

Abstract
Diameter, organization, and length of the myelin sheath are important determinants of the nerve conduction velocity, but the basic molecular mechanisms that control these parameters are only partially understood. Cell polarization is an essential feature of differentiated cells, and relies on a set of evolutionarily conserved cell polarity proteins. We investigated the molecular nature of myelin sheath polarization in connection with the functional role of the cell polarity protein pals1 (Protein Associated with Lin Seven 1) during peripheral nerve myelin sheath extension. We found that, in regard to epithelial polarity, the Schwann cell outer abaxonal domain represents a basolateral-like domain, while the inner adaxonal domain and Schmidt–Lanterman incisures form an apical-like domain. Silencing of pals1 in myelinating Schwann cells in vivo resulted in a severe reduction of myelin sheath thickness and length. Except for some infoldings, the structure of compact myelin was not fundamentally affected, but cells produced less myelin turns. In addition, pals1 is required for the normal polarized localization of the vesicular markers sec8 and syntaxin4, and for the distribution of E-cadherin and myelin proteins PMP22 and MAG at the plasma membrane. Our data show that the polarity protein pals1 plays an essential role in the radial and longitudinal extension of the myelin sheath, likely involving a functional role in membrane protein trafficking. We conclude that regulation of epithelial-like polarization is a critical determinant of myelin sheath structure and function.
Introduction
The myelin sheath that wraps axons in the nervous system is essential for the rapid and efficient propagation of action potentials. The length and the diameter of the myelin sheath is an essential parameter of the nerve conduction efficiency (Waxman, 1997). Moreover, myelin sheath thickness and compact myelin deposition are affected in numerous peripheral neuropathies (Suter and Scherer, 2003), indicating that controlled growth of the myelin sheath is crucial during myelination and in myelin maintenance. Nevertheless, the basic molecular mechanisms that contribute to the radial and longitudinal extension of the myelin sheath remain only partially understood.
Cell polarization is a process of asymmetrical organization of subcellular domains, which participates in cell differentiation, migration, and function. It involves different cellular processes such as the establishment of cellular junctions, vesicular trafficking, and membrane lipids specification (Mellman and Nelson, 2008). Genetic analyses in Drosophila have identified three complexes of conserved master proteins that are essential in epithelial cell polarization: The complex dlg1/scrib/lgl localizes in the basolateral domain, the complex pals1/patj/crb3 localizes in the apical domain, and the complex aPKC/par3/par6 is associated with adherens and/or tight junctions in the apical domain (Mellman and Nelson, 2008). Among these polarity factors, the role of pals1 (Protein Associated with Lin Seven 1) is not well understood. Pals1 is the ortholog of Drosophila Stardust (Sdt), and Sdt mutations cause cell polarity defects in Drosophila epithelia (Tepass and Knust, 1993). In zebrafish, the pals1 ortholog Nagie oko is required for retina biogenesis (Wei and Malicki, 2002) and heart development (Rohr et al., 2006). However, in mammals no in vivo phenotype after altering pals1 expression has been reported so far. In vitro, mild silencing of pals1 in mammalian epithelial cells leads only to a delay in the formation of tight junctions (Straight et al., 2004), while a stronger silencing disturbs the formation of tight and adherens junctions (Straight et al., 2006).
Epithelial-like cell polarization may be one of the pattern on which the myelin sheath is built. Indeed, some evidence shows that cell polarization is required for the trafficking of myelin proteins in oligodendrocytes (Maier et al., 2008), and par3 is required to initiate myelination in Schwann cells (SCs) (Chan et al., 2006). In addition, the distribution of cellular junctions and basal lamina in myelinating cells has suggested structural and functional similarities in the polarization of epithelial and myelinated cells (Poliak et al., 2002; Salzer, 2003; Etienne-Manneville, 2008). However, the nature of myelin sheath polarity has not been formally investigated, and potential roles of polarity factors in myelin sheath extension are unknown.
We investigated the nature of myelinating Schwann cell (mSC) polarity in respect to epithelial cell polarity. Our results show that the molecular features of myelin sheath polarity are remarkably similar to that of epithelial cells, with the abaxonal domain characterized as a basolateral-like domain and the incisuro-adaxonal domain as an apical-like domain. To test the relevance of this polarization in the extension of the myelin sheath, we have analyzed the function of pals1 during peripheral nerve myelination using lentivirally delivered shRNAs.
Materials and Methods
Primary antibodies.
For immunostaining, we used rabbit anti-SAP97 (ABR-Affinity Bioreagents, 1:500), mouse anti-MPP5 (kind gift from Heidi Stöhr, Würzburg University, Würzburg, Germany, hybridoma supernatant), rabbit anti-par3 (Millipore, 1:100), mouse anti-Scrib (kind gift from P. O. Humbert, Peter MacCallum Cancer Centre, Melbourne, Australia, 1:200), rabbit anti-Lgl1 (kind gift from J. P. Fawcett, Samuel Lunenfeld Research Institute, Toronto, Ontario, Canada, 1:750), rabbit anti-MUPP1 (kind gift from E. Peles, Weizmann Institute of Science, Rehovot, Israel, 1:200), rabbit anti-PKCζ (Santa Cruz Biotechnology, 1:75), rat anti-E-cadherin (ECCD2, 1:800), rat anti-integrinβ1 (Millipore Bioscience Research Reagents MAB1997, 1:50), rabbit anti-krox20 (BabCo, 1:500), rabbit anti-claudin 19 (1:200, kind gift from T. Uemura, Kyoto University, Kyoto, Japan), mouse anti-connexin 32 and mouse anti-MAG (both hybridoma supernatants, kind gift from S. Scherer, University of Pennsylvania, Philadelphia, PA), rabbit anti-periaxin (kind gift from S. Scherer), rabbit anti-paranodin and rabbit anti-pan-neurofascin (kind gifts of Dr. L. Goutebroze, INSERM Institut du Fer à Moulin, Paris, France, 1:500), rabbit anti-annexin2 (Santa Cruz Biotechnology, 1:50), rabbit anti-PMP22 (SUELI, U. Suter, 1:500), mouse anti-PI3K (Transduction Laboratories, 1:100), rabbit anti-PTEN (Cell Signaling Technology, 1:100), mouse anti-sec8 (Transduction Laboratories, 1:00), and mouse anti-syntaxin4 (Transduction Laboratories, 1:100). The specificity of noncommercial antibodies was verified by Western blotting.
For Western blotting, we also used mouse anti-MPP5 (Heidi Stöhr), mouse anti-E-cadherin (Transduction Laboratories, 1:1000), rabbit anti-PMP22 (SUELI, 1:2000), mouse anti-integrinβ1 (Transduction Laboratories, 1:1000), and rabbit anti-MAG (Zymed, 1:1000).
Immunostaining of teased sciatic nerve fibers.
Teasing of sciatic nerves has been described previously (Tricaud et al., 2005). Sciatic nerves were isolated from 1- to 2-month-old mice (Janvier) or MAG-GFP transgenic mice (kind gift from N. Schaeren-Wiemers, Biozentrum, Basel, Switzerland), fixed for 10 min in Zamboni's fixative (Stefanini et al., 1967) or 30 min in 4% paraformaldehyde, washed in PBS, and subsequently teased on glass slides. After teasing preparations were dried overnight at room temperature and stored at −20°C. Teased fibers were then rehydrated in PBS, incubated for 1 h at room temperature in blocking solution (10% goat serum, 0.3% Triton X-100, and 0.01% sodium azide in PBS), and incubated with primary antibodies in blocking solution overnight at 4°C. The next day, the samples were washed 3 times 5 min in PBS and incubated for 1 h at room temperature with secondary antibodies (Alexa488, Invitrogen, 1:1600; Cy3 and Cy5, Jackson ImmunoResearch, 1:800). Finally samples were washed in PBS and mounted in Citifluor AF1.
Images were acquired at room temperature using a 40× or 63× C-Apochromat objectives and a Zeiss confocal microscope LSM510 and its associated software. Pictures were then saved in a TIFF format and processed with Photoshop (Adobe) to assemble figures. Pictures of long cells were acquired at high magnification with multiple scans (5–10) and then assembled using Photoshop to show the full cell.
Measures of cell size and quantification of immunolabeling.
For each experiment, at least two injected animals were used. Wounded or dying cells were not counted. The length and the diameter (mean value of 10–20 measures along the cell) of GFP- or Dsred2-positive cells was measured using LSM510 software. For noninfected cells, immunostainings with β1 integrin antibody (abaxonal membrane) and with ankyrin G antibody (nodal region) were used to measure cell diameter and length.
To measure the impact of pals1 silencing of pals1 and E-cadherin expression in immunostaining, confocal images containing both an infected and an uninfected cell at a node of Ranvier (on the same coverslip) were analyzed using ImageJ software (NIH). First, images were converted to an 8 bit gray format and the intensity threshold was adjusted to isolate the staining from the background. A region of interest (ROI) was delimited around each cell, and the mean fluorescence intensity per area was measured within each ROI. Then values obtained in infected cells were normalized on values obtained in the next noninfected cells within the same picture.
Immunostaining of nerve cross sections.
Freshly isolated nerves (2-month-old mice) were fixed in 4% paraformaldehyde for at least 30 min and embedded in Tissue-Tek (OCT, Sakura). These preparations were cut with a cryotome into 8-μm-thick sections, thaw mounted onto Superfrost slides (Mettler), and air dried. The staining protocol is identical to the protocol described for teased nerve fibers.
Immunostaining of rat epithelial cells.
Rat epithelial cells, WB-F344, were grown on 8-well Permanox or glass slides, infected for 1 d with lentivirus, and selected with puromycin for 1 d before immunostaining. Cells were washed twice with PBS and fixed in 4% paraformaldehyde in PBS for 5 min at room temperature. After three PBS washes, cells were blocked in nonpermeabilizing (10% goat serum in PBS) or permeabilizing (same with 0.5% Triton X-100) blocking buffers for 30 min at room temperature. First antibodies [rabbit SUELI against the extracellular domain of PMP22, monoclonal rat anti-integrin β1 (Millipore Bioscience Research Reagents MAB1997), and nonimmune rabbit serum] were added in the blocking buffer for 1 h at room temperature (RT). After three washes in PBS, the second antibody was incubated in blocking buffer for 45 min at RT. After PBS washes, the slide was mounted in Immu-Mount (Thermo Fisher Scientific) and the staining was analyzed with a Zeiss LSM510 confocal microscope as described above.
Cell surface biotinylation.
Rat epithelial cells were infected with lentivirus for 1 d and selected with puromycin for 2 d. These cells were seeded on 10 cm dishes and grown in puromycin until they reached 90% confluency. After three washes in PBS, cells were incubated with 100 μm Sulfo-NHS-LC-Biotin (Sigma) in PBS at 4C for 30 min with gentle shaking. After 1 wash in PBS, reactive residues were quenched in 0.1 m glycine in PBS for 5 min, followed with three PBS washes. Cells were lysed in 50 mm Tris, pH 7.4, 150 mm NaCl, 1% Triton X-100, 5 mm EDTA, and protease inhibitors (Complete, Sigma) for 20 min in ice. The soluble proteins were incubated with 70 μl of streptavidin-agarose beads (Pierce) overnight or 2 h at 4C, and the beads were then washed three times in lysis buffer (see below). Biotinylated proteins were eluted by boiling beads for 5 min in gel loading buffer, and they were analyzed with SDS-PAGE separation and Western blotting.
Vectors and shRNAs.
Plasmids containing GFP-PH-AKT and GFP-PH-PLCδ (kind gifts of T. Balla, National Institute of Child Health and Human Development, Bethesda, MD) were cut with XbaI-blunted and NheI to excise the constructs and cloned into pSicoR (Ventura et al., 2004) between EcoRI-blunted and NheI sites.
The validated mouse shRNA sequences for pals1 (van Rossum et al., 2006) was cloned into the lentiviral pSicoR vector using XhoI-XbaI sites. As this published shRNA did not silence rat pals1, shRNAs directed against mouse and rat pals1 (also known as MPP5) were obtained from Sigma in pLKO-1 plasmid (puromycin resistance): pals1 sh1 (TRCN0000024199), pals1 sh2 (TRCN0000024200), and pals1 sh3 (TRCN0000024202). The efficiency of these shRNAs was tested by infecting WB-F344 rat epithelial cells with low-titer virus and by selecting with puromycin. The effect of shRNA expression on pals1 levels was then analyzed by Western blotting (see Fig. 9). Control shRNAs were directed against GFP (5′-CAAGCTGACCCTGAAGTTC-3′) or Dsred2 (5′-AGTTCCAGTACGGCTCCAA-3′). In addition a control shRNA with no mammalian target was also obtained from Sigma (SHC002V).
Figure 9.
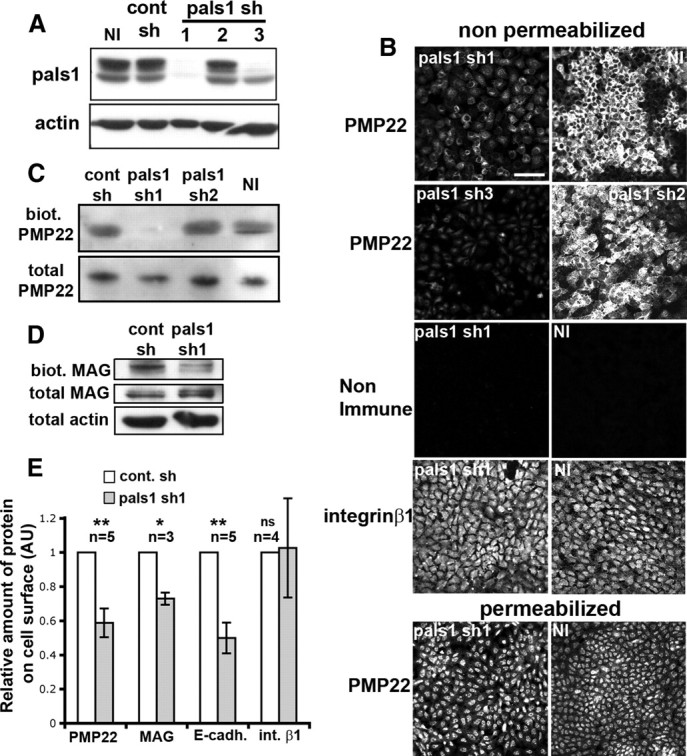
Pals1 silencing reduces the amount of PMP22, MAG, and E-cadherin but not integrin β1 at the plasma membrane. A, The efficiency of three pals1 shRNAs (pals1 sh) in silencing pals1 in rat epithelial cells WB-F344 was analyzed by Western blotting. Pals1 shRNA 1 and 3 are the most efficient, while 2 is not active. Cont sh, Control sh. B, Immunostaining of PMP22 and integrin β1 on WB-F344 cells under permeabilized or nonpermeabilized conditions. Cells were not infected (NI) or infected with lentivirus expressing pals1 shRNA 1, 2, or 3 (pals1 sh), and selected with puromycin before immunostaining. Cells expressing the effective pals1 sh1 or 3 show reduced PMP22 but not reduced integrin β1 staining at their membranes. Note that cells silenced for pals1 are larger and less numerous at confluency; thus, the overall integrin β1 staining appears stronger in noninfected than in pals1 silenced cells, but no change can be seen when looking at cells individually. All pictures have the same scale. Scale bar, 50 μm. C, D, Noninfected (NI) WB-F344 cells or cells infected with pals1 shRNA 1 and 2 (pals1 sh) or control shRNA (cont sh) were subjected to cell surface biotinylation. The total amount and the amount of biotinylated (biot.) PMP22 (C) and MAG (D) were then analyzed by Western blotting. Two bands corresponding to L-MAG and S-MAG were observed. E, Western blot results were quantified by densitometry, and the relative amount of PMP22, MAG, E-cadherin and integrin β1 at the cell surface in cells silenced for pals1 (pals1 sh1) or not silenced (cont sh) is plotted. The fraction of protein at the cell surface is the ratio of cell surface protein/total protein. Values obtained in silenced cells were normalized to values obtained in nonsilenced cells to obtain the relative amount of protein at the cell surface. In case of MAG, both bands were included in the quantification. AU, Arbitrary unit. Error bars show SEM. n = number of experiments. ns, Not significant.
pDOL-PLAP plasmid [Addgene plasmid 15164 (Fields-Berry et al., 1992)] was used to replace GFP by placental alkaline phosphatase (PLAP) in pSicoR vectors.
Lentiviral vector production.
To produce high-titer viruses, two 15 cm dishes of nearly confluent HEK293T cells were transfected with 13.5 μg of psPAX2, 9 μg of pMD2G, and 27 μg of lentiviral vector. The supernatant was collected 48 and 72 h later, pooled, centrifuged at 1000 rpm, and filtered. This clean supernatant was centrifuged using the SW28 rotor (Beckman Coulter) for 2 h at 21,000 rpm and 11°C. The pellet was resuspended in 1 ml of DMEM 10% FCS and centrifuged again 1 h at 16,000 rpm and 4°C using the T60i rotor (Beckman Coulter). The pellet obtained was finally resuspended in 40 μl of PBS with 0.001% fast green (Sigma), aliquoted, and stored at −80°C.
Animal surgery and injection.
Animal use was approved by the veterinary office of the Canton of Zürich, Switzerland. Postnatal day 3 (P3)–P4 Swiss mice (Janvier) were anesthetized with isoflurane inhalation and placed under a Stemi2000 microscope (Zeiss). The gluteus superficialis and biceps femoris muscles were separated to reveal the cavity traversed by the sciatic nerve. A thin glass needle filled with colored viral solution (2–3 μl) was introduced into the nerve with a micromanipulator. This solution was injected over 10 min with short pressure pulses using a Picospritzer III (Parker Hannifin) coupled to a pulse generator, so that regions of the nerve far away from the injection site could be filled. The nerve was replaced in the cavity, the muscles were readjusted, and the wound was closed with Histoacryl glue (Braun). When fully awake, pups were put back with the mother and the litter treated with antibiotics (Bactrim; Roche) to prevent infection. Mice were killed by CO2 inhalation.
Protein extraction and Western blotting.
Cultured cells were washed in PBS, lysed in lysis buffer [10 mm Tris, pH 7.4, 150 mm NaCl, 1% Triton X-100, 0.1% SDS, 0.5% sodium-deoxycholate, 1 mm EDTA, 50 mm NaF, 1 mm NaVO4, protease inhibitor cocktail (Sigma)] for 15 min on ice, and centrifuged at 14,000 rpm at 4°C to pellet cell debris. Sciatic nerves were dissected from mice (Janvier) at different developmental stages. After removal of the epineurium and perineurium, the nerves were homogenized with a chilled mortar and pestle in lysis buffer. All extracts were processed using standard SDS-PAGE and Western blotting procedures. Blots were digitized using a scanner (GS-800; Bio-Rad) and analyzed by densitometry with Quantity One (Bio-Rad).
PLAP staining and electron microscopy.
Staining of PLAP-positive cells was as described before (Zylka et al., 2005). Briefly, after injection of PLAP vector at postnatal day 3–4, sciatic nerves of 8-week-old mice (Swiss, Janvier) were fixed for 20 min in situ with 4% PFA, 0.05% glutaraldehyde, 0.2% picric acid in 0.1 m PBS, pH 7.4. Then nerves were removed, postfixed in the same buffer for additional 2 h at room temperature with mild agitation. After washing 30 min in 0.1 m PBS, they were cut in smaller pieces (2–3 mm) and the perineurium lacerated before incubation for 2 h in phosphate buffer at 65°C to inactivate endogenous phosphatase. Then samples were washed in 50 mm tricine buffer for 3 × 10 min with mild agitation to remove free phosphorus ions, incubated in buffer 1 (50 mm tricine, 30% sucrose, 3.9 mm MgSO4, 50 mm diethanolamine, 0.1% Tween 20, pH 10) for 30 min followed by 30 min in buffer 2 (3 mm CeCl3, 2 mm levamisole in 10 ml of buffer 1). The enzymatic reaction was started by adding 5 μl of 100 mm para-nitrophenyl phosphate, incubated for 18–24 h at 37°C, and then rinsed in tricine buffer. To oxidize cerium(III) into cerium(IV), conversion buffer (0.2% H2O2 in tricine buffer) was added and incubated for 15 min at room temperature. Nerves were postfixed in 2% glutaraldehyde and then in osmium tetroxide (0.1% OsO4, 0.1 m cacodylate, 1.8 mm CaCl2, 0.8 mm MgSO4, pH 7.4), counterstained en bloc with 1% uranyl acetate and 0.4% lead citrate, and finally embedded in Epon. Epon blocks were cut in thin sections and these sections analyzed with a FEI Morgagni electron microscope at the Electron Microscopy ETH Zürich.
Statistical analysis was done with four samples of nerves infected with each virus. For each cell showing a PLAP staining and for 2–4 nonlabeled surrounding cells, axonal and myelin perimeters were measured using ImageJ software to obtain their diameters (perimeter = diameter × π). From these values, the g-ratio of each cell (axon diameter/myelin diameter) was calculated.
Statistical analysis.
Error bars and values show ±SEM, except where otherwise noted. p values were evaluated with two-tailed t test using GraphPad Instat 3 software (GraphPad Software). Asterisks indicate p < 0.05 (*), p < 0.01 (**), or p < 0.001 (***).
Results
Established epithelial cell polarity proteins show a distinct polarized distribution in myelinating SCs
To characterize myelin sheath polarity, we used antibodies and fluorescent probes directed against molecules known to have a polarized distribution in epithelial cells. The well characterized distribution of E-cadherin in adherens junctions of the outside edge of Schmidt–Lanterman (SL) incisures and of paranodal loops (Ghabriel and Allt, 1981; Fannon et al., 1995; Tricaud et al., 2005) was used as a reference to localize the different subdomains of SCs (see Fig. 2M for a schematic representation of these domains).
Figure 2.
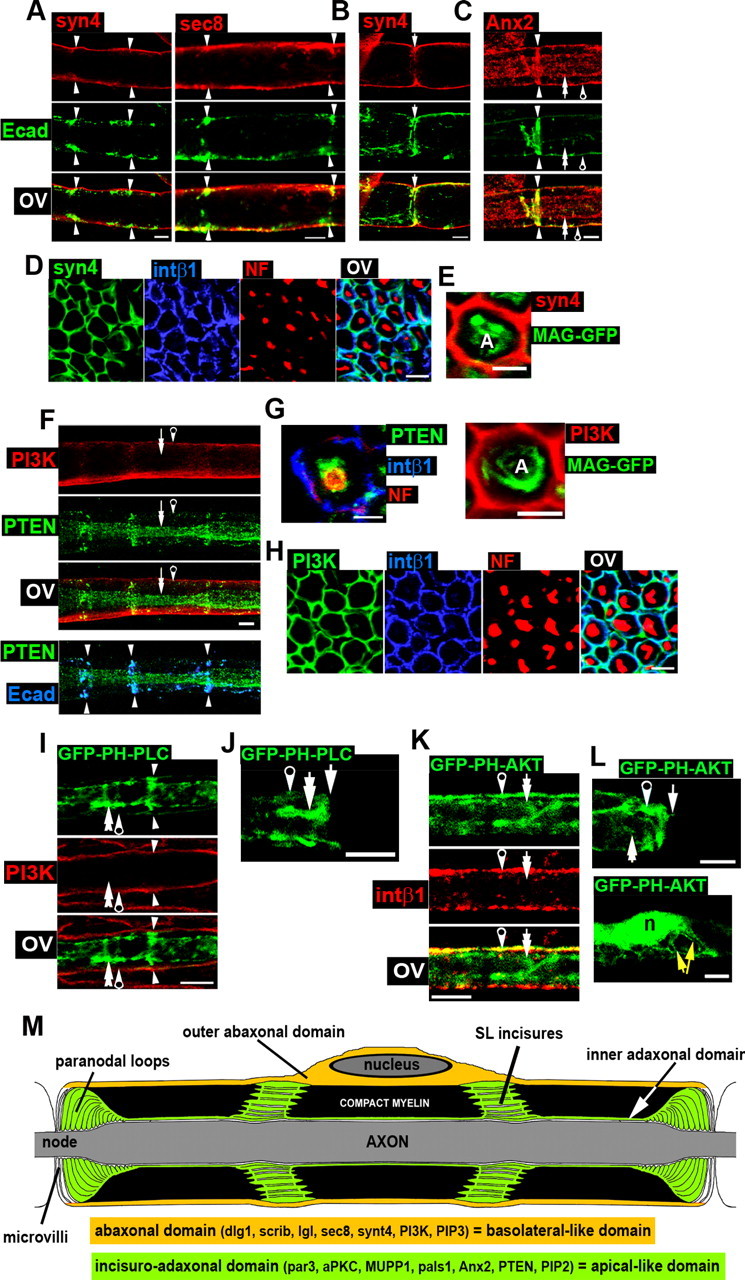
Distribution of polarized vesicular markers, phosphoinositides, PI3K, and PTEN in myelinating Schwann cells. Arrows and arrowheads are as in Figure 1. A, Immunostaining of syntaxin4 (syn4, red) and sec8 (red) reveals the localizations of these proteins in the abaxonal domain with partial colocalization with E-cadherin (green). B, Syntaxin4 (red) is present in the outer region of paranodal loops [E-cadherin (green)]. C, Immunostaining of annexin A2 (Anx2, red) shows its localization in the adaxonal domain and in SL incisures, where Anx2 colocalizes with E-cadherin (green). D, Immunostaining of syntaxin4 (syn4, green), integrin β1 (blue), and NF (red) in sciatic nerve cross sections. Syntaxin 4 colocalizes with integrin β1 in the abaxonal domain. E, No colocalization can be seen between syntaxin4 (red) and MAG-GFP (green) in Schwann cells in sciatic cross sections. A, Axon. F, Upper panel, PI3K (red) and PTEN (green) are localized in abaxonal and adaxonal domains (and SL incisures), respectively, in teased fibers. Lower panel, Overlay of PTEN (green) and E-cadherin (blue) shows their colocalization in SL incisures. G, Left, Immunostaining of PTEN (green), integrin β1 (blue), and NF (red) on nerve cross sections shows PTEN localization around the axon (stained for neurofilaments), confirming that PTEN is expressed in the adaxonal domain of SCs. Scale bar, 2.5 μm. Right, Immunostaining of PI3K (red) on Schwann cells expressing MAG-GFP (green) shows no colocalization in the adaxonal domain. A, Axon. H, PI3K (green) colocalizes with integrin β1 (blue) in the abaxonal domain. NF (red) staining shows axons in sciatic nerve cross sections. I, A myelinating Schwann cell expressing GFP-PH-PLCδ (green) shows the probe localization in SL incisures and in the adaxonal domain. No colocalization is observed with PI3K (red) in the abaxonal domain. J, GFP labeling at a node of Ranvier of a cell expressing GFP-PH-PLCδ is enriched in the inner part of paranodal loops. K, A myelinating Schwann cell expressing GFP-PH-AKT (green) show its localization in all compartments with enrichment in the abaxonal domain, where the probe colocalizes with integrin β1 (red). L, Upper panel, GFP-PH-AKT (green) is enriched in the outer region of paranodal loops at a node of Ranvier. Lower panel, The same probe is present in the perinuclear area and in Cajal bands (yellow arrows, abaxonal domain). n, Nucleus. M, This schematic drawing shows the structure of a myelinating Schwann cell, the characterized polarity domains, and a summary of the observed localizations of markers. Tissue was from 2-month-old mice, except for stainings of cells expressing GFP probes, for which mice were 10–20 d old. Unless otherwise indicated, all scale bars are 5 μm. OV, Overlay.
First, classical polarity proteins were targeted. Immunostaining on teased fibers of mature mouse sciatic nerve (2 months old) showed that the basolateral markers scrib and lgl are localized in the abaxonal domain of myelinating SCs (Fig. 1A). Furthermore, we could confirm a similar localization of dlg1 (Fig. 1A) (Bolis et al., 2009). These markers partially colocalized with E-cadherin of adherens junctions at the outside edge of SL incisures (Fig. 1A, arrowheads). In paranodal loops, these markers appeared to be localized in the outer region of the loops, with a faint colocalization with E-cadherin in the inner part of the loops (Fig. 1B, not shown for scrib and lgl). On nerve cross sections, the basolateral markers colocalized with integrin β1 in the abaxonal domain of SCs (Fig. 1C; quantification in supplemental Fig. S3, available at www.jneurosci.org as supplemental material) [axons are stained for neurofilaments (NF); not pictured for lgl and dlg1]. To confirm that the labeled domain was distinct from the adaxonal domain, we used sciatic nerves of transgenic mice expressing GFP-MAG (Erb et al., 2006). MAG is known to be localized mostly in the SL incisures and in the adaxonal domain of myelinating Schwann cells (Fig. 1D, double arrow) (Erb et al., 2006). Immunolabeling on teased fibers showed that lgl was present in the abaxonal domain (Fig. 1D, left, pierced arrow), colocalized faintly with GFP-MAG at the outside edge of SL incisures (Fig. 1D, left, arrowheads). However, lgl1 was not found in the lower part of SL incisures and in the adaxonal domain (double arrow). Cross sections of GFP-MAG sciatic nerve confirmed that lgl is localized in the abaxonal domain of SCs and did not colocalize with GFP-MAG in the adaxonal domain that surrounds the axon (Fig. 1D, right; supplemental Fig. S3, available at www.jneurosci.org as supplemental material).
Figure 1.
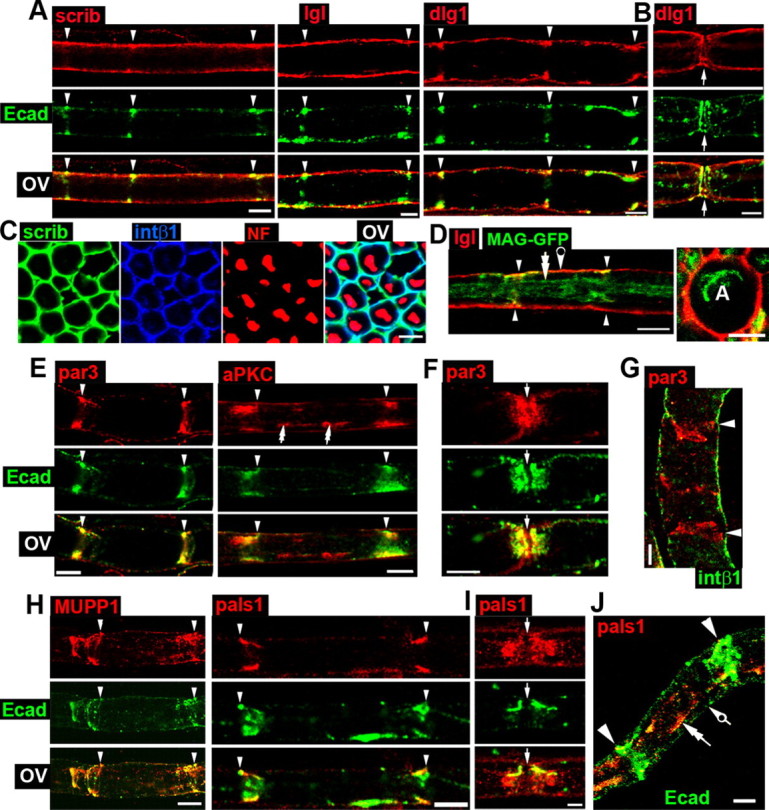
Distribution of cell polarity proteins in myelinating Schwann cells. Arrowheads indicate SL incisures, white arrows the node of Ranvier, double arrows the adaxonal domain, and pierced arrows the abaxonal domain. A, Immunostaining of scrib, lgl, and dlg1 (red) and E-cadherin (green) in myelinating Schwann cells shows their distributions in the abaxonal domain. B, Immunostaining of dlg1 (red) and E-cadherin (green) at the node of Ranvier (arrows) suggests dlg1 localization in the outer region of paranodal loops. Scale bar, 2.5 μm. C, Immunostaining of scrib (green), integrin β1 (blue), and neurofilaments (NF, red) in sciatic nerve cross sections shows scrib colocalizes with integrin β1 in the abaxonal domain. D, Left, Immunostaining of dlg1 (red) in Schwann cells expressing MAG-GFP (green) show dlg1 is not colocalized with MAG in the adaxonal domain. Right, Same immunostaining on sciatic nerve cross sections. A, Axon. E, Immunostaining of par3 and aPKC (red) and E-cadherin (green) in teased fibers shows their localization in SL incisures. F, par3 (red) and E-cadherin (green) immunostaining at a node of Ranvier (arrows) shows their partial colocalization in the middle part of paranodal loops. G, Par3 (red) and integrin β1 (green) do not colocalize (immunostaining in teased fibers). H, MUPP1 and pals1 (red) and E-cadherin (green) colocalize in SL incisures (immunostaining in teased fibers). I, Immunostainings of pals1 (red) and E-cadherin (green) at a node of Ranvier suggest pals1 localization in the inner region of paranodal loops. J, pals1 (red) is localized in the adaxonal domain of Schwann cells, while E-cadherin (green) is mostly expressed in SL incisures. Nerve tissue was from 2-month-old mice, except pals1 stainings, which were performed on tissue from 1-month-old mice. All scale bars are 5 μm otherwise indicated. OV, Overlay.
We then analyzed the distribution of the epithelial apico-junctional markers par3 and aPKC. As observed for par3 (Fig. 1E) (Poliak et al., 2002), aPKC was found in SL incisures (Fig. 1E, arrowheads), where both par3 and aPKC partially colocalized with E-cadherin in adherens junctions. In addition, aPKC was localized in some parts of the inner adaxonal domain (Fig. 1E, double arrows). The abaxonal domain, labeled with integrin β1, was clearly distinct from the incisural domain stained with par3 (Fig. 1G). Par3 and aPKC were also expressed in paranodal loops, where they partially colocalized with E-cadherin (Fig. 1F, not pictured for aPKC). Despite of the use of three different antibodies, we were not able to detect par6 expression in myelinating SCs (data not shown).
We next investigated the distribution of the apical markers pals1 and the patj close homolog, MUPP1. As reported for MUPP1 (Poliak et al., 2002), pals1 and MUPP1 were found in SL incisures, where they partially colocalized with E-cadherin (Fig. 1H, arrowheads). In some cells, pals1 was enriched in the adaxonal domain (Fig. 1J, double arrow), which was clearly distinct from the abaxonal domain (pierced arrow). In paranodal region, pals1 appeared to localize in the inner part of paranodal loops, close to the axon, where it partially colocalized with E-cadherin (Fig. 1I).
The respective distributions of the analyzed markers have been summarized in a schematic drawing in Figure 2M.
The discrete distribution of vesicular markers, phosphoinositides, PTEN, and PI3K further defines the molecular polarization of the myelin sheath
Epithelial cells show also polarized vesicle trafficking, and some proteins associated with vesicles have a polarized distribution. For example, sec8 and syntaxin4 are localized mainly in the basolateral domain (Kreitzer et al., 2003), while annexin A2 is enriched in the apical domain (Martin-Belmonte et al., 2007). In the mature myelin sheath, we found that syntaxin4 and sec8 were localized in the abaxonal domain of myelinating SCs, showing some colocalization with E-cadherin in the outside edge of SL incisures (Fig. 2A, arrowheads). Both sec8 and syntaxin4 showed colocalization with integrin β1 in this abaxonal region on nerve cross sections (Fig. 2D; quantification in supplemental Fig. S3, available at www.jneurosci.org as supplemental material, not pictured for sec8). At the cell extremities, both markers were mostly found in the outer region of the paranodal loops and therefore showed only a limited colocalization with E-cadherin (Fig. 2B, not pictured for sec8). The sec8 distribution was similar to published data (Bolis et al., 2009), except that we were unable to detect its localization in microvilli (see Fig. 2M for microvilli localization; data not shown). Stainings for annexin A2 were somewhat aggravated by substantial background, but we could confirm that this marker was clearly present in the adaxonal domain (Fig. 2C, double arrow) and in SL incisures (arrowheads), where it colocalized with E-cadherin in adherens junctions (Hayashi et al., 2007).
A critically important component of epithelial cell polarization is the heterogeneous and polarized lipid composition of the plasma membrane: phosphatidylinositol-3,4,5-triphosphate (also called PIP3) is enriched in the basolateral domain (Gassama-Diagne et al., 2006), and phosphatidylinositol-4,5-diphosphate (commonly called PIP2) in the apical domain (Martin-Belmonte et al., 2007). This heterogeneous distribution of phospholipids is mirrored by the asymmetric distribution of PI3K, the enzyme that phosphorylates PIP2 to PIP3, and of PTEN, the enzyme that dephosphorylates PIP3 to PIP2: PI3K is present in the basolateral domain, while PTEN is mostly apical (Gassama-Diagne et al., 2006; Martin-Belmonte et al., 2007). Using immunostainings, we localized PI3K in the abaxonal domain (Fig. 2F, pierced arrow) and PTEN in the putative adaxonal domain (double arrow) and in SL incisures, where it partially colocalized with E-cadherin (Fig. 2F, lower panel, arrowheads). We confirmed the adaxonal distribution of PTEN on nerve cross sections, where PTEN was found specifically around the axon (Fig. 2G, left; supplemental Fig. S3, available at www.jneurosci.org as supplemental material). On the opposite, PI3K colocalized with integrin β1 in the abaxonal domain (Fig. 2H; quantification in supplemental Fig. S3, available at www.jneurosci.org as supplemental material) and did not show colocalization with MAG-GFP in the adaxonal domain (Fig. 2G, right, supplemental Fig. S3, available at www.jneurosci.org as supplemental material).
PTEN and PI3K control the amount and distribution of both PIP2 and PIP3 in epithelial cells. Thus, we also investigated the distribution of these phosphoinositides in myelinating SCs. To do this, fluorescent probes detecting PIP2 and PIP3 were expressed in myelinating SCs of the mouse sciatic nerve using lentiviruses (see the next Results section for more detail on virus use in vivo in peripheral nerves). GFP-PH-Akt has been shown to target PIP3 and GFP-PH-PLCδ targets PIP2 (Várnai and Balla, 2007). As long-term expression of these constructs could induce cell toxicity and affect the correct interpretation of the data, we chose to infect SCs at P3–P4 and analyzed them 10 d later. Due to their relatively “young” age, these GFP-positive cells were only thinly myelinated, and the cell polarity was therefore less pronounced than at later ages. Nevertheless, we found GFP-PH-PLCδ (PIP2) to be enriched in the inner adaxonal domain (Fig. 2I, double arrow) and in SL incisures (arrowheads), with no colocalization with PI3K in the outer abaxonal domain (pierced arrow). At paranodal loops, the PIP2 probe was enriched in the inner part of the loops close to the axon (Fig. 2J, double arrow). The GFP-PH-AKT (PIP3) probe was more ubiquitously expressed, but was enriched in the outer abaxonal domain, where it colocalized with integrin β1 (Fig. 2K, pierced arrow). In addition, the PIP3 probe was enriched in the Cajal bands that extend from the perinuclear cytoplasm (Fig. 2L, lower panel, yellow arrows) in the abaxonal domain. At paranodal loops, GFP-PH-AKT (PIP3) mostly localized in the outer domain of the loops (Fig. 2L, upper panel, pierced arrow).
To summarize, we found that epithelial basolateral markers including dlg1, scrib, lgl, sec8, synt4, and PI3K are enriched in the outer abaxonal domain of the myelinating Schwann cell (Fig. 2M). PIP3 was present in all domains but was particularly enriched in the abaxonal domain and in the Cajal bands. On the other hand, epithelial apical markers such as par3, aPKC, pals1, MUPP1, annexin A2, PTEN, and PIP2 were enriched in SL incisures and in the inner adaxonal domain of the myelinating Schwann cell (Fig. 2M). Our data indicate that the myelinating Schwann cell is polarized, at least, on a radial axis, and that this polarity is molecularly similar to the epithelial cell polarity, suggesting related control mechanisms. In analogy to epithelial cells, the abaxonal domain is a basolateral-like domain and the incisuro-adaxonal domain is an apical-like domain.
Injection of lentivirus in sciatic nerves results in specific transgene expression in SCs
We and others have reported the use of adenoviral vectors to transduce myelinating SCs in the mouse sciatic nerve in vivo for functional experiments (Tricaud et al., 2005; Perrin-Tricaud et al., 2007). Here, as lentiviral vectors are easier and faster to produce, we assessed the use of lentiviral vectors for this purpose. To compare adenovirus and lentivirus efficiencies in infecting SCs, we produced high-titer human-VSV pseudotyped lentivirus expressing GFP under a CMV promoter (Fig. 3A) and injected them into sciatic nerves of adult mice (7 weeks old) or pups (3–4 d old), similarly to what we have done before for adenovirus (Tricaud et al., 2005; Perrin-Tricaud et al., 2007). Injected animals were killed 10 d to 8 weeks later. After injection in pups, the majority of GFP-positive cells were myelinating SCs (∼70%) (Fig. 3B,C), the rest being non-myelin-forming cells (∼30%) at the point of analysis. The overall number of infected cells remained low (100–200 cells per nerve, 2 months after injection), but as observed with adenovirus (Perrin-Tricaud et al., 2007), this accounted for up to ∼10% of myelinating Schwann cells on a nerve section. In adults, lentiviral vectors were not efficient, as very few cells were infected (data not shown). In comparison, adenoviral infection was efficient in both adults and pups, but most of the infected cells were non-myelin-forming cells (∼70%) and the rest (∼30%) myelinating SCs.
Figure 3.
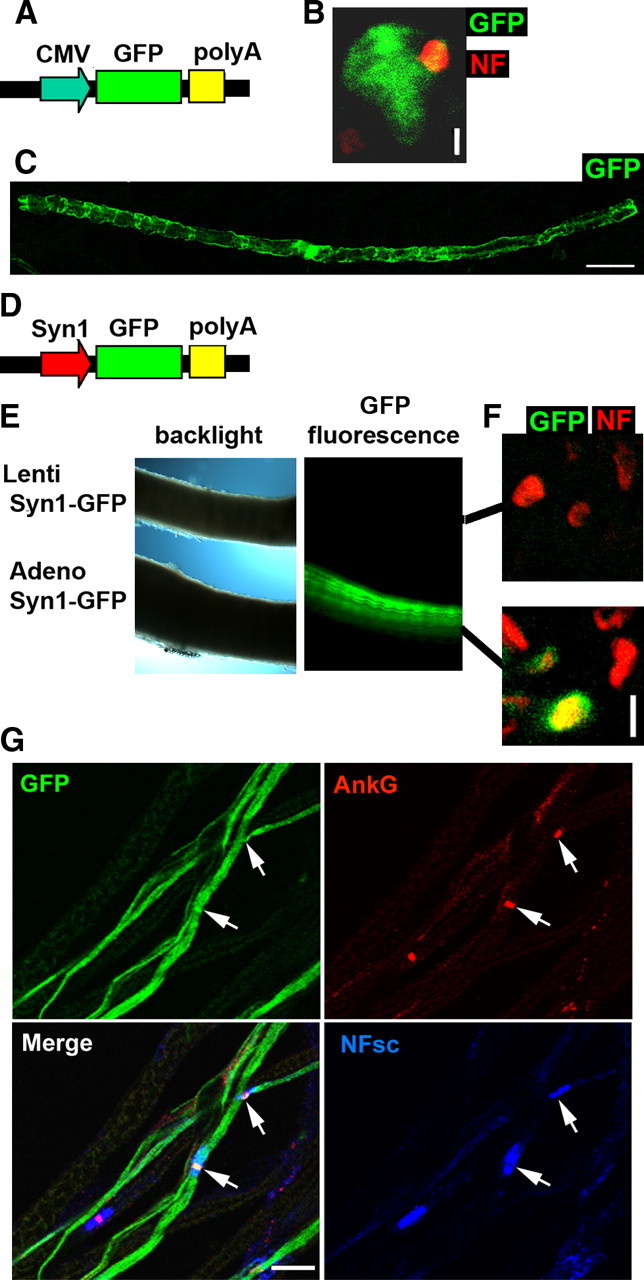
Lentiviral vectors infect myelinating Schwann cells in mouse sciatic nerve. A, CMV-GFP cassette in psicoR lentiviral vector. B, A myelinating Schwann cell infected with psicoR virus expresses GFP (green) and wraps an axon stained for NF (red). The analysis was performed 10 d after injection of lentivirus in nerves of 3- to 4-d-old mouse pups. Scale bar, 5 μm. C, A myelinating Schwann cell infected with psicoR virus expresses GFP (green) 30 d after infection. Scale bar, 50 μm D, Synapsin1 promoter cassette. E, Mouse sciatic nerves were injected with Syn1-GFP lentivirus (upper nerve) or adenovirus (lower nerve). Only the nerve injected with adenovirus syn1-GFP expresses GFP in neurons. Both syn1-GFP viruses expressed GFP in DRG neurons in culture, showing that they were infectious (data not shown). F, Cryosections were obtained from nerves injected with syn1-GFP lentivirus or adenovirus. Adenovirus syn1-GFP expressed GFP (green) in axons, where it colocalizes with NF (red). Scale bar, 2 μm. G, Teased fibers from a nerve injected with adenovirus syn1-GFP show GFP-labeled axons (green) overlapping with a nodal staining of ankyrin G (red) and neurofascins (blue, pan-neurofascin antibody). Arrows indicate nodes of Ranvier. Scale bar, 20 μm.
No or only very few neurons expressed GFP after lentivirus or adenovirus injection in adults or pups. This was surprising, because both viruses can infect DRG neurons in primary cultures. However the CMV promoter used to express GFP in our viruses has been reported to be unreliable in some neurons (Wheeler and Cooper, 2001; Kasparov, 2007). This suggested that the CMV promoter used could be preventing GFP expression in mature neurons of the postnatal sciatic nerve. To investigate this possibility, we replaced the CMV promoter in adenoviral and lentiviral vectors with a neuronal-specific synapsin1 promoter (Fig. 3D) (Glover et al., 2002). Nerves of pups injected with syn1-GFP adenovirus showed an intense GFP labeling in axons 10 d to 3 weeks after injection, while analogous injections of syn1-GFP lentivirus did not result in any labeling (Fig. 3E,F). Adenovirally delivered GFP was expressed in numerous axons (>50 per nerve), and a nodal staining was observed on some of these axons (Fig. 3G), demonstrating that they were myelinated. These data show that adenoviruses infect both neurons and SCs when injected in mouse sciatic nerve, while lentiviruses infect only SCs. In addition the use of the CMV promoter restricts gene expression to Schwann cells.
Pals1 is required for myelin sheath growth in Schwann cells in vivo
The similarities observed between epithelial cells and SCs suggested that factors involved in epithelial cell polarization might also control myelin sheath formation and maintenance. To test this hypothesis and since we found that pals1 expression was dynamically regulated during myelination in the mouse sciatic nerve (Fig. 4), which is consistent with a crucial function of the this protein in the polarization process, we investigated the role of pals1 during myelin sheath growth in SCs.
Figure 4.

Expression of pals1 is regulated during sciatic nerve myelination. Left panel, Western blot analysis of pals1 expression during postnatal development of mouse sciatic nerve. Actin was used as loading control. Right panel, Densitometric quantification of the Western blot analysis. Pals1 values are normalized to the respective actin values (±SD; n = 3). p values = 0.0005 (P0–P20), 0.002 (P20–P60). AU, Arbitrary unit.
To perturb pals1 function during the formation of the polarized myelin sheath, we combined pals1-silencing shRNAs with the lentiviral approach to deliver shRNAs to myelinating SCs in vivo. We used psicoR lentiviral vectors (Ventura et al., 2004) with a U6 promoter to express pals1 shRNAs together with a CMV-GFP cassette (Fig. 5A). In addition, to exclude expression of the transgene in neurons completely, we modified the psicoR vector to express pals1 shRNAs under a minimal CMV promoter (Perrin-Tricaud et al., 2007) together with a CMV-Dsred2 cassette (Fig. 5A). Control viruses, expressing shRNA without target in the cell, were also used. High-titer viral solutions were injected in the sciatic nerve of anesthetized mouse pups at postnatal day 3 to 4 when many SCs start to myelinate. After 3 to 8 weeks, animals were killed, the nerve fixed, and the fibers gently teased before immunostaining. As expected, fluorescent markers were only expressed in SCs. To test the efficiency of the silencing, the preparation was stained with pals1 antibodies. Cells expressing pals1 shRNA together with GFP or Dsred2 expressed less pals1 compared to the neighboring noninfected cell (see pals1 expression in paranodal loops in Fig. 5B, quantified in C). The silencing was specific for pals1 as E-cadherin expression was not affected (Fig. 5B,C). Viruses expressing control shRNA did not affect pals1 expression (data not shown).
Figure 5.

Lentivirus expressing pals1 shRNA silences pals1 expression efficiently in mSCs in vivo. A, Schematic structure of the two expression cassettes used to express pals1 shRNA with a pSICOR lentiviral vector backbone. mCMV, Minimal CMV promoter; mpolyA, minimum polyA; U6, U6 promoter. B, At a node of Ranvier (arrowhead), a cell infected with pals1 shRNA virus expresses GFP (white) and shows a strongly reduced expression of pals1 (red) in the inner part of paranodal loops (see also Fig. 1I for control). E-cadherin expression is not changed (green). Scale bar, 10 μm. C, Fluorescence intensity for pals1 is reduced in cells infected with pals1 shRNA virus (pals1 sh) versus surrounding noninfected cells (NI) (±SEM). E-cadherin fluorescence intensity is not significantly changed (ns). Number of cells counted: Pals1, 15; E-cadherin, 16. p values = 1.3 × 10⁻¹⁰ (pals1), 0.6 (E-cadherin). AU, Arbitrary unit.
Using this approach, the effect of pals1 knock-down on myelination was assessed in 2-month-old animals (∼2 months after injection) when myelination is almost completed. We used fluorescent probe expression (GFP or Dsred2) in infected cells to measure SC length and mean diameter. Dying or damaged cells were not included in the analysis. Myelinating SCs silenced for pals1 were thinner (4.16 ± 0.22 μm vs 7.12 ± 0.33 μm; p = 1.4 × 10⁻¹⁰) and shorter (237.2 ± 13.9 μm vs 363.2 ± 19.6 μm; p = 1.5 × 10⁻⁶) than cells infected with the control virus (Fig. 6A,C) (npals1sh = 81, ncontsh = 43). In addition, on the same axon, silenced mSCs were thinner than the neighboring cells, even if their nodal regions matched (Fig. 6A, inset). Despite their abnormal size, short cells expressed Krox-20 and E-cadherin in organized clusters (Fig. 6B), indicating that they were myelinating SCs. Viruses expressing shRNA under either a U6 or a CMV promoter, and two independent shRNAs directed against mouse pals1, gave comparable results (for the other shRNA used, see supplemental Fig. S1, available at www.jneurosci.org as supplemental material).
Figure 6.

Pals1 is required for radial and longitudinal extension of the myelin sheath. A, Cells infected with pals1 shRNA virus express Dsred2 or GFP (white) and show an abnormally thin diameter (right lower panel, 2.6 μm diameter for 433.1 μm length) and a reduced length (left lower panel) in comparison to a cell infected with control shRNA vector (upper panel, 8.4 μm diameter for 497.3 μm). The inset shows the detail of the left node of Ranvier of the pals1-silenced cell. Scale bars, 50 μm. B, Short cells infected with pals1 shRNA virus express Dsred2 (red) and Krox20 (green) (upper panels), GFP (green), and E-cadherin (red) (lower panels). Scale bars, 5 μm. C, Graph displaying cell diameter versus length of mSCs infected with viruses expressing control shRNA (gray squares) and pals1 shRNA (black squares). Lines show linear regressions lines for control shRNA (1) and pals1 shRNA (2). Tissue was from mice injected 3–4 d after birth and analyzed 2 months later.
We also analyzed the structure of cells infected with pals1 shRNA virus in electron microscopy. For these experiments, GFP was substituted by PLAP, which is more accurately detected by electron microscopy (Zylka et al., 2005). When expressed in myelinating SCs of the mouse sciatic nerve, the PLAP reaction product localized in adaxonal and incisural membranes as fine black precipitates, which could be seen in some cells of nerves injected with a PLAP-expressing lentivirus (Fig. 7A,B). These precipitates were not observed in noninjected nerves (data not shown). This detection system enabled us to measure the g-ratio (axon diameter/myelinated fiber diameter) of cells infected with pals1 shRNA virus and noninfected surrounding cells (Fig. 7B). The g-ratio increased in infected cells (0.68 ± 0.009 vs 0.59 ± 0.006; p = 1.9 × 10⁻¹²), while no significant change could be detected in axon diameter (3.38 ± 0.08 μm vs 3.74 ± 0.18 μm for control; p = 0.083; npals1sh = 61, nnoninfected = 137). This analysis shows that the compact myelin of pals1-silenced cells is thinner. In addition, we found no change in the ultrastructure of compact myelin or in the thickness of myelin lamellae (supplemental Fig. S2, available at www.jneurosci.org as supplemental material), indicating that the thinner myelin sheath results from fewer myelin turns. Using electron microscopy, we also looked for other defects in cells silenced for pals1. The cells appeared normal except that they often showed protrusions into the axon at the adaxonal domain (Fig. 7B,C, arrows), and in some cells these protrusions enlarged into the axon resulting in myelin infoldings (Fig. 7D).
Figure 7.
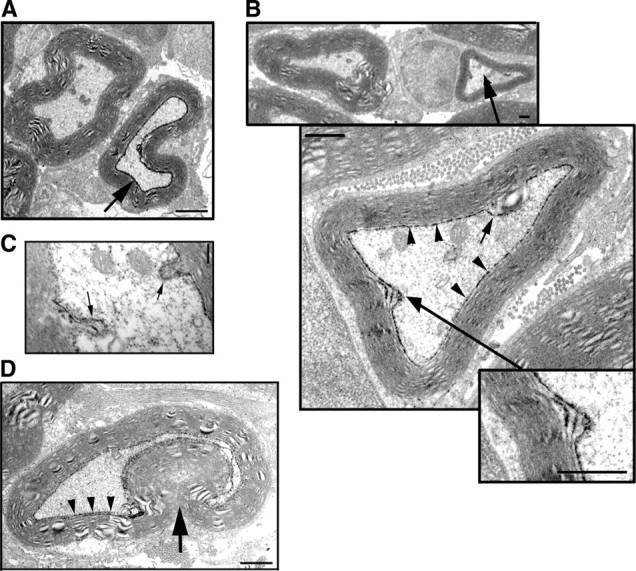
Pals1 silencing reduces compact myelin sheath thickness and induces myelin infoldings. A, Thin-section electron micrograph of sciatic nerve from a 2-month-old mouse sciatic nerve injected at postnatal day 3–4 with a lentivirus expressing PLAP. A myelinating Schwann cell expressing PLAP displays black precipitates in its adaxonal domain (arrow), while a noninfected cell (left cell) shows no PLAP staining. Scale bar, 1.2 μm. B, Thin-section electron micrographs showing three successive magnifications of the same cell in a mouse nerve injected with a lentivirus expressing pals1 shRNA and PLAP. A Schwann cell expressing pals1 shRNA and PLAP (black precipitates, arrowheads) shows an abnormally thin myelin sheath (g ratio = 0.78) and two protrusions of the adaxonal domain into the axon (arrows). The small inset shows a detail in which PLAP staining is observed on three successive noncompacted membranes, which is characteristic of incisural membranes. Scale bars, 500 nm. C, Detail of an axon showing two Schwann cell protrusions (arrows) into the axonal compartment. Note that adaxonal membranes of the protrusions are labeled by PLAP staining, indicating that the Schwann cell expresses pals1 shRNA. Scale bar, 200 nm. D, A myelinated Schwann cell infected with pals1 shRNA virus displays a PLAP staining at the interface with the axon (arrowheads) and a prominent infolding of the myelin into the axon (arrow). Scale bar, 800 nm.
Together these data show that pals1 is required for myelinating SCs to extend their myelin sheaths radially and longitudinally.
Pals1 controls the distribution of the vesicular traffic markers syntaxin4 and sec8 in myelinating Schwann cells
We next investigated the impact of pals1 silencing on the distribution of myelin sheath markers. We did not detect any change in the distribution of markers for adherens or tight junctions (E-cadherin, claudin19), the abaxonal domain (periaxin, integrin β1), the adaxonal–incisural domain (MAG, connexin32), paranodal loops (neurofascin, connexin32), or microvilli (moesin, phospho-ERM) (data not shown). On the axon side, no change could be seen in the distribution of neurofascin, caspr/paranodin, or ankyrin G, all markers of different parts of the node of Ranvier (data not shown).
We then investigated the effect of pals1-silencing on the distribution of polarized markers. Reduction of pals1 expression did not affect the distribution of dlg1, aPKC, MUPP1, annexin A2, PTEN, and PI3K (data not shown). However the distributions of sec8 and syntaxin4 changed upon pals1 silencing. These abaxonal markers were also found near the axon, in the adaxonal domain (Fig. 8A,B, see Fig. 2A for control cells), suggesting that pals1 is involved in the distribution of these markers.
Figure 8.

Pals1 is required for the polarized distribution of sec8 and syntaxin4 in myelinating Schwann cell in vivo. A, B, Immunostaining of sec8 (A) and syntaxin4 (B) (red) in a myelinating Schwann cell expressing pals1 shRNA and GFP (green). Sec8 and syntaxin4 distribute to the inner adaxonal domain (double arrows) in addition to the outer abaxonal domain (pierced arrow) as observed in control cells. Control cell stainings are illustrated in Figure 2A. Scale bars, 5 μm. Sciatic nerves from mice injected with pals1 shRNA virus at postnatal day 3–4 and analyzed 2 months later.
Pals1 is required for localization of myelin proteins at the plasma membrane
Sec8 is part of the exocyst, an evolutionary conserved complex that participates in the tethering of secretory vesicles to the plasma membrane (He and Guo, 2009). The fusion of vesicles with the plasma membrane is mediated by the SNARE complex, which includes membrane syntaxins such as syntaxin 4 (ter Beest et al., 2005). The mislocalization of these markers suggested that pals1 silencing may affect protein delivery to the plasma membrane. Indeed, pals1 has recently been shown to be required for E-cadherin trafficking to the membrane (Wang et al., 2007). The observed reduced myelination further suggested that pals1 may also be required for delivery of myelin proteins to the plasma membrane.
As pals1 silencing reduced the viability of rat SCs in culture (data not shown) and as Schwann cell polarity resembles epithelial cell polarity, we decided to use a rat epithelial cell line that expresses some myelin proteins such as PMP22 to analyze the expression of this protein at the plasma membrane in presence or absence of pals1. Silencing of pals1 in these cells was obtained using lentiviruses expressing shRNAs directed against rat pals1 together with puromycin resistance to select infected cells. The chosen pals1 shRNA 1 and 3 were effective, while shRNA 2 was not (Fig. 9A). PMP22 expression at the plasma membrane was first detected by immunostaining in nonpermeabilized cells using an antibody directed against the extracellular domain of PMP22. We found that cells infected with lentiviruses expressing the effective pals1 shRNAs 1 and 3 showed strongly reduced PMP22 staining at their membrane compared to noninfected cells or cells infected with control pals1 shRNA 2 (Fig. 9B). In contrast, similar staining intensities were obtained in permeabilized cells (Fig. 9B), suggesting that only the amount of PMP22 at the plasma membrane is affected by pals1 silencing. Similar experiments using an antibody directed against the extracellular domain of integrin β1 showed that pals1 knockdown did not affect the amount of this protein at the plasma membrane (Fig. 9B).
In a second set of experiments designed to confirm the results obtained by immunostainings in a more quantitative manner, proteins expressed at the plasma membrane were biotinylated and precipitated before Western blot analysis. Cells expressing the effective pals1 shRNA1 virus had significantly less PMP22 (Fig. 9C,E), less MAG (Fig. 9D,E), and less E-cadherin (Fig. 9E) at their plasma membrane compared to cells expressing a control shRNAs or noninfected cells. As the viruses did not change the overall protein expression (Fig. 9C), these experiments demonstrate that pals1 silencing reduces the membrane localization of these proteins. Nonetheless, this was not the case for all proteins, as integrin β1 levels at the membrane did not change after pals1 silencing (Fig. 9E). Together these data show that pals1 is required for the quantitatively correct trafficking of E-cadherin and the myelin proteins PMP22 and MAG.
Discussion
We investigated the relationship between myelin sheath polarization and epithelial cell polarization using immunostaining on myelinating SCs of the mouse sciatic nerve. The distributions of conserved cell polarity markers (dlg1, lgl, scrib, par3, aPKC, MUPP1, and pals1), vesicles traffic markers (sec8, synt4, and Anx2), and PIP3/PIP2 regulators (PTEN and PI3K) suggest that the outer abaxonal domain is the basolateral-like domain of the Schwann cell, while the incisure–adaxonal domain is the apical-like domain. When the distribution of some of these markers had previously been described, their respective distributions were largely confirmed here and they fitted to the proposed model.
Beside immunostaining, the polarization of the myelin sheath was confirmed by the finding of enrichment of PIP3 and PIP2 in the abaxonal and adaxonal domains, respectively, using fluorescent molecular probes expressed in cells in vivo. These probes have been widely used in vitro and in vivo to characterize PIP2 and PIP3 distribution (Balla et al., 2009), and they were strongly enriched in their respective domains. However, their distributions were not exclusive, probably because of their limited specificity (Várnai and Balla, 2007) and because of their toxicity, which limited their use to less mature myelinating cells. Recently, the compact myelin protein MBP has been shown to interact with the plasma membrane via PIP2 binding (Nawaz et al., 2009), suggesting that the compact myelin may contain PIP2. In our experiments, the PIP2 probe was not detected in compact myelin. The molecular size of these probes, however, is likely to hinder their access to compact myelin, preventing the detection of PIP species in this domain. The relative amount of PIP3/PIP2 regulates diverse cellular mechanisms and in particular the activation of protein kinase B or AKT. For these reasons, the regulators of the relative amounts of PIP3/PIP2, PI3K and PTEN, are well known for controlling AKT activation (Carracedo and Pandolfi, 2008). It has been suggested that AKT activity is essential to control the myelination rate in peripheral nerves (Nave and Salzer, 2006). The clearly spatially distinct distribution of PI3K and PTEN and the enrichment of PIP3/PIP2 in their respective domains suggest a tight spatial regulation of the relative amounts of PIP3/PIP2 in myelinating Schwann cells, consistent with the idea that AKT activation is a crucial feature of PNS myelination.
Our results suggest that three subdomains may be distinguished in paranodal loops: The outside edge of the loops that contains basolateral markers (see dlg1 staining in Fig. 1B), a middle part that contains adherens junctions and associated proteins (see par3 staining in Fig. 1F), and an inner part, close to the axon, that contains apical markers (see pals1 in Fig. 1I). The determination of myelin polarization at paranodal loops is not straightforward because the tridimensional complexity of these structures hinders the interpretation of confocal images. Moreover, the absence of compact myelin at this place makes it more susceptible to mechanical alteration during the preparation of teased fibers. Further studies using electron microscopy are therefore required to confirm polarization in this subdomain.
The distinct localization of apical markers in SL incisures shows that these structures are apical-like. Yet the outside edge of SL incisures also contains basolateral markers. This suggests that adherens junctions, which are mainly localized at the outside edge of SL incisures (Ghabriel and Allt, 1981; Tricaud et al., 2005), form the boundary between abaxonal and incisuro-adaxonal domains, just as they form the boundary between apical and basolateral domains in epithelial cells (Wang and Margolis, 2007). These data also suggest that the compact myelin, which is in physical continuity with incisural membranes, is mostly in the apical-like domain of the Schwann cell. Interestingly, compact myelin proteins such as PMP22 and P0 are expressed in tight or tight-like junctions of the apical domain of epithelial cells (D'Urso et al., 1990; Doyle et al., 1995; Notterpek et al., 2001). In addition, the compact myelin protein MBP binds to PIP2 (Nawaz et al., 2009), which is a marker of the apical domain (Martin-Belmonte et al., 2007). Together these data indicate that the compact myelin, which is the largest and the most characteristic compartment of myelinating cells, belongs to the apical-like domain of myelinating SCs.
The similarities observed between epithelial and Schwann cell polarities suggest that some of the conserved molecular mechanisms that drive epithelial polarization are also involved in the genesis of the myelin sheath. The function of pals1 in myelinating SCs may reflect this concept. In epithelial cells, pals1 is involved in cell polarization (Tepass and Knust, 1993; Straight et al., 2004, 2006; Wang et al., 2007), and so far this is the only function that has been shown for this molecule. In myelinating SCs, we found that pals1 silencing, while only partial in our experiments, strongly affects myelination in vivo. The radial extension of the myelin sheath and of the compact myelin in particular was found to be reduced in confocal and electron microscopy. The longitudinal extension was also reduced as seen in confocal microscopy. However the overall structure of the myelin sheath was not affected, as we did not detect any change in markers of the myelin sheath structure. The myelin ultrastructure was also not fundamentally changed except for some small adaxonal domain extensions and infoldings. Together these data indicate that pals1 is not required for the distribution of particular myelin proteins, but rather for the myelin sheath genesis itself.
While pals1 mutations or silencing have been shown to affect adherens and tight junction formation in epithelial cells (Wang et al., 2007), we did not see abnormal adherens (E-cadherin marker) or tight (claudin 19 marker) junctions in SCs. This may be due to the partial knock-down that we obtained in myelinating SCs, as partial pals1 knock-down only delays but does not prevent junction formation in epithelial cells (Straight et al., 2004).
The abnormal distribution of sec8 and syntaxin4 markers in myelinating cells, silenced for pals1, supports the conclusion of a major functional role of pals1 in the proper formation of myelin and the connection to cell polarization. Indeed the polarization of sec8 and syntaxin4 is involved in the normal vesicle trafficking in epithelial cells (ter Beest et al., 2005; He and Guo, 2009). In glial cells, sec8 has been shown to control oligodendrocyte precursor differentiation (Anitei et al., 2006) and to participate in Schwann cell myelination in vitro (Bolis et al., 2009). In addition, polarized vesicle trafficking in oligodendrocyte precursors is essential for their differentiation (Maier et al., 2008). An impairment of this mechanism in SCs silenced for pals1 is thus likely to reduce myelination. To investigate this hypothesis, further studies analyzing the expression, the distribution, and the role of other factors involved in vesicular traffic in myelinating Schwann cell are required.
Our experiments on the detection of cell surface proteins by immunostaining on nonpermeabilized cells, together with cell surface biotinylation, indicate that pals1 is required for the membrane localization of PMP22, MAG, and E-cadherin in epithelial cells. The mechanism by which pals1 exerts this effect is not clear. Recent data suggest that pals1 is involved in the targeting and delivery of E-cadherin to the membrane (Wang and Margolis, 2007) rather than in its recycling, but this remains to be shown for PMP22 and MAG. The impact of pals1 silencing on PMP22 and MAG levels at the membrane suggests that pals1 is involved in the trafficking of myelin protein in Schwann cells. While we did not find obvious changes in the distribution of MAG in myelinating SCs silenced for pals1, it cannot be excluded that pals1 reduces the delivery to the membrane without affecting localization. In addition, the diversity of the affected molecules (4-transmembrane pass protein PMP22, IgG domain protein MAG, and cadherin-domain protein E-cadherin) and of their distribution in the myelin sheath (compact myelin PMP22, noncompact myelin MAG, and adherens junctions E-cadherin) is consistent with the hypothesis that pals1 is involved in the trafficking of numerous membrane proteins in SCs. Pals1 may therefore be required for the correct delivery of many proteins to the myelin sheath, including compact and noncompact myelin proteins. This broad requirement may result in the structurally correct but reduced development of the myelin sheath that we observed. Nevertheless, not all proteins rely on pals1 for their trafficking, as integrin β1 membrane expression was not affect by pals1 silencing. Finally it should be noted that this set of experiments have been performed, due to technical limitations, in epithelial cells as a model system albeit with myelin-associated proteins expressed endogenously by these cells. To what extent this traffic situation is comparable to myelinating Schwann cells in vivo remains to be determined.
To summarize, our data demonstrate that the SC myelin sheath is polarized in a similar way as in epithelial cells, and that myelin sheath growth is critically dependent of the function of the well conserved polarity protein pals1. Further studies investigating the role of other conserved polarity proteins during myelination will help to define the molecular mechanisms that drive myelin sheath formation.
Footnotes
This work was supported by grants of the Swiss National Science Foundation (grants to N.T. and U.S.), the National Center for Competence in Research, “Neural Plasticity and Repair,” and an ETHIIRA grant of the Swiss Federal Institute of Technology Zürich (ETHZ). We thank all our noncommercial antibody suppliers for their kindness, Dr. N. Schaeren-Wiemers for her gift of animals, Drs. Ned Mantei and Claire Perrin-Tricaud for their critical reading of the manuscript, and Dr. Justine Kusch and the Light Microscopy Centre facility of the ETHZ, Rolf Huber, Egon Saluz, and Esther Christen for their technical help.
References
- Anitei M, Ifrim M, Ewart MA, Cowan AE, Carson JH, Bansal R, Pfeiffer SE. A role for Sec8 in oligodendrocyte morphological differentiation. J Cell Sci. 2006;119:807–818. doi: 10.1242/jcs.02785. [DOI] [PubMed] [Google Scholar]
- Balla T, Szentpetery Z, Kim YJ. Phosphoinositide signaling: new tools and insights. Physiology (Bethesda) 2009;24:231–244. doi: 10.1152/physiol.00014.2009. [DOI] [PMC free article] [PubMed] [Google Scholar]
- Bolis A, Coviello S, Visigalli I, Taveggia C, Bachi A, Chishti AH, Hanada T, Quattrini A, Previtali SC, Biffi A, Bolino A. Dlg1, Sec8, and Mtmr2 regulate membrane homeostasis in Schwann cell myelination. J Neurosci. 2009;29:8858–8870. doi: 10.1523/JNEUROSCI.1423-09.2009. [DOI] [PMC free article] [PubMed] [Google Scholar]
- Carracedo A, Pandolfi PP. The PTEN-PI3K pathway: of feedbacks and cross-talks. Oncogene. 2008;27:5527–5541. doi: 10.1038/onc.2008.247. [DOI] [PubMed] [Google Scholar]
- Chan JR, Jolicoeur C, Yamauchi J, Elliott J, Fawcett JP, Ng BK, Cayouette M. The polarity protein Par-3 directly interacts with p75NTR to regulate myelination. Science. 2006;314:832–836. doi: 10.1126/science.1134069. [DOI] [PubMed] [Google Scholar]
- Doyle JP, Stempak JG, Cowin P, Colman DR, D'Urso D. Protein zero, a nervous system adhesion molecule, triggers epithelial reversion in host carcinoma cells. J Cell Biol. 1995;131:465–482. doi: 10.1083/jcb.131.2.465. [DOI] [PMC free article] [PubMed] [Google Scholar]
- D'Urso D, Brophy PJ, Staugaitis SM, Gillespie CS, Frey AB, Stempak JG, Colman DR. Protein zero of peripheral nerve myelin: biosynthesis, membrane insertion, and evidence for homotypic interaction. Neuron. 1990;4:449–460. doi: 10.1016/0896-6273(90)90057-m. [DOI] [PubMed] [Google Scholar]
- Erb M, Flueck B, Kern F, Erne B, Steck AJ, Schaeren-Wiemers N. Unraveling the differential expression of the two isoforms of myelin-associated glycoprotein in a mouse expressing GFP-tagged S-MAG specifically regulated and targeted into the different myelin compartments. Mol Cell Neurosci. 2006;31:613–627. doi: 10.1016/j.mcn.2005.12.001. [DOI] [PubMed] [Google Scholar]
- Etienne-Manneville S. Polarity proteins in glial cell functions. Curr Opin Neurobiol. 2008;18:488–494. doi: 10.1016/j.conb.2008.09.014. [DOI] [PubMed] [Google Scholar]
- Fannon AM, Sherman DL, Ilyina-Gragerova G, Brophy PJ, Friedrich VL, Jr, Colman DR. Novel E-cadherin-mediated adhesion in peripheral nerve: Schwann cell architecture is stabilized by autotypic adherens junctions. J Cell Biol. 1995;129:189–202. doi: 10.1083/jcb.129.1.189. [DOI] [PMC free article] [PubMed] [Google Scholar]
- Fields-Berry SC, Halliday AL, Cepko CL. A recombinant retrovirus encoding alkaline phosphatase confirms clonal boundary assignment in lineage analysis of murine retina. Proc Natl Acad Sci U S A. 1992;89:693–697. doi: 10.1073/pnas.89.2.693. [DOI] [PMC free article] [PubMed] [Google Scholar]
- Gassama-Diagne A, Yu W, ter Beest M, Martin-Belmonte F, Kierbel A, Engel J, Mostov K. Phosphatidylinositol-3,4,5-trisphosphate regulates the formation of the basolateral plasma membrane in epithelial cells. Nat Cell Biol. 2006;8:963–970. doi: 10.1038/ncb1461. [DOI] [PubMed] [Google Scholar]
- Ghabriel MN, Allt G. Incisures of Schmidt-Lanterman. Prog Neurobiol. 1981;17:25–58. doi: 10.1016/0301-0082(81)90003-4. [DOI] [PubMed] [Google Scholar]
- Glover CP, Bienemann AS, Heywood DJ, Cosgrave AS, Uney JB. Adenoviral-mediated, high-level, cell-specific transgene expression: a SYN1-WPRE cassette mediates increased transgene expression with no loss of neuron specificity. Mol Ther. 2002;5:509–516. doi: 10.1006/mthe.2002.0588. [DOI] [PubMed] [Google Scholar]
- Hayashi A, Nakashima K, Yamagishi K, Hoshi T, Suzuki A, Baba H. Localization of annexin II in the paranodal regions and Schmidt-Lanterman incisures in the peripheral nervous system. Glia. 2007;55:1044–1052. doi: 10.1002/glia.20529. [DOI] [PubMed] [Google Scholar]
- He B, Guo W. The exocyst complex in polarized exocytosis. Curr Opin Cell Biol. 2009;21:537–542. doi: 10.1016/j.ceb.2009.04.007. [DOI] [PMC free article] [PubMed] [Google Scholar]
- Kasparov S. Suitability of hCMV for viral gene expression in the brain. Nat Methods. 2007;4:379. doi: 10.1038/nmeth0507-379a. author reply 379. [DOI] [PubMed] [Google Scholar]
- Kreitzer G, Schmoranzer J, Low SH, Li X, Gan Y, Weimbs T, Simon SM, Rodriguez-Boulan E. Three-dimensional analysis of post-Golgi carrier exocytosis in epithelial cells. Nat Cell Biol. 2003;5:126–136. doi: 10.1038/ncb917. [DOI] [PubMed] [Google Scholar]
- Maier O, Hoekstra D, Baron W. Polarity development in oligodendrocytes: sorting and trafficking of myelin components. J Mol Neurosci. 2008;35:35–53. doi: 10.1007/s12031-007-9024-8. [DOI] [PubMed] [Google Scholar]
- Martin-Belmonte F, Gassama A, Datta A, Yu W, Rescher U, Gerke V, Mostov K. PTEN-mediated apical segregation of phosphoinositides controls epithelial morphogenesis through Cdc42. Cell. 2007;128:383–397. doi: 10.1016/j.cell.2006.11.051. [DOI] [PMC free article] [PubMed] [Google Scholar]
- Mellman I, Nelson WJ. Coordinated protein sorting, targeting and distribution in polarized cells. Nat Rev Mol Cell Biol. 2008;9:833–845. doi: 10.1038/nrm2525. [DOI] [PMC free article] [PubMed] [Google Scholar]
- Nave KA, Salzer JL. Axonal regulation of myelination by neuregulin 1. Curr Opin Neurobiol. 2006;16:492–500. doi: 10.1016/j.conb.2006.08.008. [DOI] [PubMed] [Google Scholar]
- Nawaz S, Kippert A, Saab AS, Werner HB, Lang T, Nave KA, Simons M. Phosphatidylinositol 4,5-bisphosphate-dependent interaction of myelin basic protein with the plasma membrane in oligodendroglial cells and its rapid perturbation by elevated calcium. J Neurosci. 2009;29:4794–4807. doi: 10.1523/JNEUROSCI.3955-08.2009. [DOI] [PMC free article] [PubMed] [Google Scholar]
- Notterpek L, Roux KJ, Amici SA, Yazdanpour A, Rahner C, Fletcher BS. Peripheral myelin protein 22 is a constituent of intercellular junctions in epithelia. Proc Natl Acad Sci U S A. 2001;98:14404–14409. doi: 10.1073/pnas.251548398. [DOI] [PMC free article] [PubMed] [Google Scholar]
- Perrin-Tricaud C, Rutishauser U, Tricaud N. P120 catenin is required for thickening of Schwann cell myelin. Mol Cell Neurosci. 2007;35:120–129. doi: 10.1016/j.mcn.2007.02.010. [DOI] [PubMed] [Google Scholar]
- Poliak S, Matlis S, Ullmer C, Scherer SS, Peles E. Distinct claudins and associated PDZ proteins form different autotypic tight junctions in myelinating Schwann cells. J Cell Biol. 2002;159:361–372. doi: 10.1083/jcb.200207050. [DOI] [PMC free article] [PubMed] [Google Scholar]
- Rohr S, Bit-Avragim N, Abdelilah-Seyfried S. Heart and soul/PRKCi and nagie oko/Mpp5 regulate myocardial coherence and remodeling during cardiac morphogenesis. Development. 2006;133:107–115. doi: 10.1242/dev.02182. [DOI] [PubMed] [Google Scholar]
- Salzer JL. Polarized domains of myelinated axons. Neuron. 2003;40:297–318. doi: 10.1016/s0896-6273(03)00628-7. [DOI] [PubMed] [Google Scholar]
- Stefanini M, De Martino C, Zamboni L. Fixation of ejaculated spermatozoa for electron microscopy. Nature. 1967;216:173–174. doi: 10.1038/216173a0. [DOI] [PubMed] [Google Scholar]
- Straight SW, Shin K, Fogg VC, Fan S, Liu CJ, Roh M, Margolis B. Loss of PALS1 expression leads to tight junction and polarity defects. Mol Biol Cell. 2004;15:1981–1990. doi: 10.1091/mbc.E03-08-0620. [DOI] [PMC free article] [PubMed] [Google Scholar]
- Straight SW, Pieczynski JN, Whiteman EL, Liu CJ, Margolis B. Mammalian lin-7 stabilizes polarity protein complexes. J Biol Chem. 2006;281:37738–37747. doi: 10.1074/jbc.M607059200. [DOI] [PubMed] [Google Scholar]
- Suter U, Scherer SS. Disease mechanisms in inherited neuropathies. Nat Rev Neurosci. 2003;4:714–726. doi: 10.1038/nrn1196. [DOI] [PubMed] [Google Scholar]
- Tepass U, Knust E. Crumbs and stardust act in a genetic pathway that controls the organization of epithelia in Drosophila melanogaster. Dev Biol. 1993;159:311–326. doi: 10.1006/dbio.1993.1243. [DOI] [PubMed] [Google Scholar]
- ter Beest MB, Chapin SJ, Avrahami D, Mostov KE. The role of syntaxins in the specificity of vesicle targeting in polarized epithelial cells. Mol Biol Cell. 2005;16:5784–5792. doi: 10.1091/mbc.E05-07-0661. [DOI] [PMC free article] [PubMed] [Google Scholar]
- Tricaud N, Perrin-Tricaud C, Brusés JL, Rutishauser U. Adherens junctions in myelinating Schwann cells stabilize Schmidt-Lanterman incisures via recruitment of p120 catenin to E-cadherin. J Neurosci. 2005;25:3259–3269. doi: 10.1523/JNEUROSCI.5168-04.2005. [DOI] [PMC free article] [PubMed] [Google Scholar]
- van Rossum AG, Aartsen WM, Meuleman J, Klooster J, Malysheva A, Versteeg I, Arsanto JP, Le Bivic A, Wijnholds J. Pals1/Mpp5 is required for correct localization of Crb1 at the subapical region in polarized Muller glia cells. Hum Mol Genet. 2006;15:2659–2672. doi: 10.1093/hmg/ddl194. [DOI] [PubMed] [Google Scholar]
- Várnai P, Balla T. Visualization and manipulation of phosphoinositide dynamics in live cells using engineered protein domains. Pflugers Arch. 2007;455:69–82. doi: 10.1007/s00424-007-0270-y. [DOI] [PubMed] [Google Scholar]
- Ventura A, Meissner A, Dillon CP, McManus M, Sharp PA, Van Parijs L, Jaenisch R, Jacks T. Cre-lox-regulated conditional RNA interference from transgenes. Proc Natl Acad Sci U S A. 2004;101:10380–10385. doi: 10.1073/pnas.0403954101. [DOI] [PMC free article] [PubMed] [Google Scholar]
- Wang Q, Margolis B. Apical junctional complexes and cell polarity. Kidney Int. 2007;72:1448–1458. doi: 10.1038/sj.ki.5002579. [DOI] [PubMed] [Google Scholar]
- Wang Q, Chen XW, Margolis B. PALS1 regulates E-cadherin trafficking in mammalian epithelial cells. Mol Biol Cell. 2007;18:874–885. doi: 10.1091/mbc.E06-07-0651. [DOI] [PMC free article] [PubMed] [Google Scholar]
- Waxman SG. Axon-glia interactions: building a smart nerve fiber. Curr Biol. 1997;7:R406–R410. doi: 10.1016/s0960-9822(06)00203-x. [DOI] [PubMed] [Google Scholar]
- Wei X, Malicki J. nagie oko, encoding a MAGUK-family protein, is essential for cellular patterning of the retina. Nat Genet. 2002;31:150–157. doi: 10.1038/ng883. [DOI] [PubMed] [Google Scholar]
- Wheeler DG, Cooper E. Depolarization strongly induces human cytomegalovirus major immediate-early promoter/enhancer activity in neurons. J Biol Chem. 2001;276:31978–31985. doi: 10.1074/jbc.M103667200. [DOI] [PubMed] [Google Scholar]
- Zylka MJ, Rice FL, Anderson DJ. Topographically distinct epidermal nociceptive circuits revealed by axonal tracers targeted to Mrgprd. Neuron. 2005;45:17–25. doi: 10.1016/j.neuron.2004.12.015. [DOI] [PubMed] [Google Scholar]