

Abstract
Diffusion tensor imaging (DTI) can be used to elucidate relations between CNS structure and function. We hypothesized that the degree of spinal white matter organization relates to the accuracy of control of grip force. Healthy subjects of different age were studied using DTI and visuomotor tracking of precision grip force. The latter is a prime component of manual dexterity. A regional analysis of spinal white matter [fractional anisotropy (FA)] across multiple cervical levels (C2–C3, C4–C5, and C6–C7) and in different regions of interest (left and right lateral or medial spinal cord) was performed. FA was highest at the C2–C3 level, higher on the right than the left side, and higher in the lateral than in the medial spinal cord (p < 0.001). FA of whole cervical spinal cord (C2–C7) was lower in subjects with high tracking error (r = −0.56, p = 0.004) and decreased with age (r = −0.63, p = 0.001). A multiple regression analysis revealed an independent contribution of each predictor (semipartial correlations: age, r = −0.55, p < 0.001; tracking error, r = −0.49, p = 0.003). The closest relation between FA and tracking error was found at the C6–C7 level in the lateral spinal cord, in which the corticospinal tract innervates spinal circuitry controlling hand and digit muscles. FA of the medial spinal cord correlated consistently with age across all cervical levels, whereas FA of the lateral spinal cord did not. The results suggest (1) a functionally relevant specialization of lateral spinal cord white matter and (2) an increased sensitivity to age-related decline in medial spinal cord white matter in healthy subjects.
Introduction
The corticospinal tract (CST) is an essential descending pathway for the control of precision grip force and for dexterous object manipulation in humans (Lemon, 2008). The development of the CST across different animal species relates to their degree of dexterity (Lemon and Griffiths, 2005), and, in the monkey, complete (Lawrence and Kuypers, 1968) or subtotal (Sasaki et al., 2004; Freund et al., 2006) lesions of the CST affect hand function. This is also reflected after stroke or spinal cord injury (SCI). After stroke, the loss of overall hand function is related to the degree of damage to the CST (Lindberg et al., 2007). Precision finger movements are affected as well (Lang and Schieber, 2004), and their recovery depends on the degree of integrity of the CST (Lang and Schieber, 2003; Ward et al., 2007). After SCI, recovery of the CST is a main target for reparative interventions (Courtine et al., 2007).
Magnetic resonance diffusion tensor imaging (DTI) and fiber tractography is a valuable technique to quantify regional white matter differences (Basser and Jones, 2002). Recently, DTI applied to the cervical spinal cord (SC) revealed reduced fractional anisotropy (FA) with age (Agosta et al., 2007; Van Hecke et al., 2008). FA of the cervical spinal cord is also affected by pathologies: it correlates with disease severity in patients with amyotrophic lateral sclerosis (Valsasina et al., 2007) and is lower in ascending and descending tracts in multiple sclerosis (Ciccarelli et al., 2007).
Given the prominence of the CST for dexterous manipulation, it is of importance to know whether a structure–function relation can be observed in normal subjects. In the present study, we aimed at investigating whether white matter organization in the cervical spinal cord [and thus also of the CST, the largest tract in the lateral cervical spinal cord (Nathan et al., 1990)] relates to dexterity. The degree of white matter organization was quantified by DTI, the degree of dexterity by a visuomotor force-tracking task using precision grip. To ensure a wide range of force-tracking performance, we investigated subjects of varying age, because the accuracy of force tracking decreases with age (Lindberg et al., 2009a). It is also known that age leads to degenerative changes in spinal sensory and motor fibers (Cruz-Sánchez et al., 1998; Nakanishi et al., 2004; Ayabe et al., 2005). We thus performed a regional analysis of DTI parameters in the cervical spinal cord to relate spinal structure (FA) to age and control of grip force. FA is calculated from DTI-based eigenvalue measures [λ1, λ2, and λ3, indicating rate of diffusion along the three principal axes of diffusion (for details, see Basser and Pierpaoli, 1996)] and thus quantifies the directional dependence of water diffusion. FA therefore reflects structural characteristics of white matter (e.g., axonal diameter, fiber density, and myelination) and quantifies white matter “integrity” (i.e., high FA = good integrity) (Beaulieu, 2009). In this study, we first confirmed that FA varies as a function of the known spinal white matter organization: (1) that FA is greater at higher cervical levels, (2) that FA is higher in the lateral spinal cord, in which the CST passes, compared with the medial cord (in accordance with previous DTI data: Wheeler-Kingshott et al., 2002; Ciccarelli et al., 2007; Van Hecke et al., 2008). Then we tested our main hypothesis, that FA (i.e., the degree of spinal white matter organization) would be greater in subjects with good grip force control, especially in the lateral spinal cord and this independent of age.
Materials and Methods
Subjects.
Twenty-six healthy volunteers (12 men, 14 women) were recruited. Two subjects were excluded from analysis because of large head movements in the scanner (see DTI analysis). The remaining 24 subjects had a mean ± SD age of 43 ± 15 years (range, 18–69 years). Twenty-two of these subjects were right-handed and two left-handed according to the Handedness Inventory (Oldfield, 1971). Subjects were either students or employed full time. Subjects reported no sensory deficits, and no sensory deficits were apparent during testing of light touch (i.e., 70% or more correct identification of the 0.4 g Semmes-Weinstein monofilament on the finger and thumb pads). Exclusion criteria included the following: (1) any disorder that may impair precision grip (e.g., arthritis, neck pain or any radiating symptoms, diabetes) or impact on the performance of the visuomotor tracking task (e.g., cognitive or visual impairment), and (2) usual contraindications to magnetic resonance imaging (MRI). During visual inspection, no abnormalities were found in the cervical spinal cord with conventional T2-weighted MRI. The study received Institutional Review Board approval from our institution, and all subjects provided informed consent.
Control of grip force and maximal force.
The precise control of precision grip force is necessary for dexterous object manipulation. In this study, a quantitative description of each subject's capacity for control of precision grip force was obtained through a visuomotor force-tracking task (as in the study by Lindberg et al., 2009a). Subjects performed a visuomotor ramp-and-hold task by following the target force with the cursor as precisely as possible (Fig. 1, example trace at 3 N). The task comprised 18 blocks each consisting of four ramp-and-hold target force trajectories from 0 N to 3, 6, or 9 N. Before each ramp, the target remained for 3 s at 0 N. The target force then increased linearly (ramped up) during a 2 s period to reach the steady-state force level. The steady-state period lasted 4 s, after which the target force dropped instantaneously to 0 N. Between blocks, there was a 5 s pause with a black screen. Each subject performed a pseudorandomized order of six blocks at each force level (i.e., 24 trials at each force level, 72 trials in total). Subjects were instructed to minimize the distance (error) between the applied and the target force. All subjects were familiarized with the task before testing. Collection of the 72 trials took ∼12 min. Because we have shown previously that tracking accuracy decreases most during the ramp at low forces (Lindberg et al., 2009a), the error, i.e., the difference between the applied and the target force, at the lowest force level (3 N) was used as an indicator of grip force control. To test whether the degree of white matter organization was related to maximal precision grip force, maximal thumb–index finger force was also measured in all subjects. Three trials of maximal voluntary grip force were performed and the maximum retained.
Figure 1.

Cervical spinal cord white matter in relation to age and force control. A, Left, Medial (M) and lateral (L) example ROIs on axial T2-weighted MR image at C3 level. Right, Example of axial FA maps at C3 in a young (22 years) and old (64 years) subject. Although FA differences between subjects are often difficult to detect visually (Beaulieu, 2009), slightly reduced FA can be visualized in medial spinal cord in the older subject. B, Left to right, Sagittal T2-weighted image, ADC map, and FA map in the young and old subject (same subjects as in A, left and right, respectively). The older subject did not have any signs of stenosis of the spinal cord. C, Left, Example ROIs at the C6 level. Right, Example of axial FA maps at C6 in one subject with low (64 years) and one subject with high (51 years) force-tracking error. Tendency for reduced FA can be visualized in lateral spinal cord in the subject with high tracking error. D, Single-trial force-tracking examples: target trace is shown in gray and actual force in black. Arrow indicates region of increased error during the ramp to the 3 N target force level in the subject with higher mean error across trials (same subjects as in C, left and right, respectively).
Magnetic resonance imaging.
Participants underwent a single scanning session in a 1.5 T Siemens Avanto scanner. DTI-weighted images of the cervical spinal cord were collected. A sagittal diffusion-weighted echo planar imaging sequence with 25 noncollinear gradient directions was applied with two b values (b = 0 and 900 s/mm2; repetition time, 2000 ms; echo time, 95 ms; field of view, 18 cm; image matrix, 128 × 128; 12 slices with slice thickness of 3 mm; voxel size, 1.4 × 1.4 × 3 mm). Two saturation bands were used, aligned to the anterior and posterior aspects of the spinal cord. The parameters were similar to those recommended previously (Lee et al., 2006) and used (Ducreux et al., 2006; Lindberg et al., 2009b) for DTI studies of cervical spinal cord. The sequence was replicated four times, lasting 4 min 26 s in total. Diffusion tensor images were averaged across the four acquisitions before analysis. Sagittal and axial fast spin echo T2-weighted images of the cervical spine were also obtained.
DTI analysis.
Given the susceptibility of DTI to movement artifacts, diffusion images were examined for movement artifacts. Two subjects (22-year-old male and 45-year-old female) with visible artifacts were excluded from analysis. FA values were calculated voxel-by-voxel using MedINRIA software (http://www-sop.inria.fr/asclepios/software/MedINRIA) (Cohen-Adad et al., 2008). Regions of interest (ROIs) of similar size were drawn on the left and right sides on b0 images (axial views). ROIs included (1) the lateral part and (2) the medial part of the spinal cord on both sides. The spinal cord ROIs were defined as follows. First, the spinal cord was divided into a right and left half. For the lateral spinal cord ROI, the midpoint of one half of the spinal cord was identified, and then two lines, extending at 45° from the midpoint to the ventrolateral and dorsolateral margins of the cord, were drawn. Thus, the lateral spinal cord ROI was defined in accordance with the anatomical position of the lateral CST (Nathan et al., 1990). The medial spinal cord ROI was defined as the remaining part of the spinal cord, with the lateral part excluded (examples in Fig. 1). The lateral spinal cord ROI thus had a greater white to gray matter ratio than the medial spinal cord ROI and was more likely to describe diffusion parameters of the lateral CST, the major descending tract of the lateral ROI (although other tracts undoubtedly contributed to the FA of the lateral ROI, such as the dorsal and ventral spinocerebellar tracts). Because it has been shown that diffusion parameters vary depending on the level studied (Wheeler-Kingshott et al., 2002), ROIs were drawn on axial views of slices for each level from C2–C7. For each ROI, DTI values were averaged across the following levels: C2–C3, C4–C5, and C6–C7.
The partial volume effect (Virta et al., 1999) may bias an ROI method as a result of inclusion of voxels containing CSF or gray matter. To limit inclusion of voxels with partial volume effect, we verified that (1) ROI placement on b0 image did not contain voxels extending into CSF (voxels covering both were removed), (2) on FA color maps (FA directionality), only voxels with diffusion predominantly in the craniocaudal direction were included, and (3) voxels with FA values lower than 0.2 were removed from analysis because these voxels likely reflect presence of partial volume effect (Van Hecke et al., 2008). This latter step resulted in exclusion of voxels in only 8% of ROI slices (of 288 ROI slices across subjects). Although this method limits inclusion of voxels containing CSF, it does not fully rule it out. To control for it, we calculated the SD of FA values within the ROIs. Inclusion of voxels with partial volume effect would systematically lower the mean FA but would also increase the SD of FA. We argued that a lower mean FA, obtained without a change in SD, reflects a genuine decrease of FA. We tested whether subjects with a low mean FA for an ROI had a greater variability (increased SD) in FA values than subjects with higher mean FA. Finally, we also tested whether the volume of the spinal cord, identified on the central sagittal T2-weighted image, would systematically bias the diffusion parameters: we checked for any correlation between spinal cord volume (cubic centimeters) and FA of the whole spinal cord from C2–C7.
The total number of voxels included in the spinal cord ROIs (from C2–C7) ranged from ∼30 to 40 voxels in the lateral ROIs and from 70 to 110 voxels for the medial ROIs. For each subject, absolute FA, apparent diffusion coefficient (ADC), axial diffusivity (AD), and radial diffusivity (RD) values were obtained for all ROIs (mean and SD). Using this ROI method, we have shown previously that Wallerian degeneration in the lateral tracts is detectable in chronic hemiparetic stroke patients (Lindberg et al., 2009b). To further validate our ROI method, FA and ADC values for the whole cervical spinal cord (from C2–C7) obtained with manual placing of ROIs were compared with values obtained using a tractography-based segmentation approach (Van Hecke et al., 2008). Across subjects, these values correlated strongly (FA, r = 0.80, p < 0.001; ADC, r = 0.74, p < 0.001), providing supporting evidence for accurate description of diffusion parameters within our ROIs.
Statistics.
Differences in FA and ADC values of SC depending on ROI, side, and spinal level were analyzed separately using a general linear model repeated measures ANOVA with three within-subject factors: ROI (lateral SC, medial SC), side (right, left), and level (C2–C3, C4–C5, C6–C7). Post hoc contrasts were used for post hoc testing of level differences. Whether white matter organization across the whole lateral or medial cervical SC (indicated by mean FA and ADC across all levels, i.e., from C2–C7) was related to dexterity, maximal precision grip force, and age, was first examined independently of each other using univariate Pearson's correlations. A multiple regression analysis between mean FA of the whole cervical spinal cord with dexterity and age as continuous predictors was thereafter performed to investigate the unique contribution of each predictor (maximal force was not analyzed further because no univariate correlation was found). FA variance uniquely explained by each predictor was examined according to semipartial correlation statistics. To facilitate interpretation of the correlations with FA, we also examined whether AD or RD could explain the relation found, i.e., by adding each in turn as a covariate in the multiple regression analysis. AD describes the principal eigenvector (λ1) and provides information about the integrity of axons (Song et al., 2003; Budde et al., 2007), whereas RD describes the mean of the remaining two eigenvectors perpendicular to λ1 (λ2+ λ3/2) and provides information about the integrity of myelin (Song et al., 2002; Budde et al., 2007). Comparison of diffusion parameters (FA, ADC, AD, and RD) across subjects can help understand potential mechanisms underlying white matter changes, e.g., reduced FA, indicative of reduced white matter integrity, can be caused by a decrease in AD, an increase in RD, or a combination of the two, each indicating different potential mechanisms (Beaulieu, 2009). Finally, to describe anatomical variations in relations between white matter organization, age, and dexterity, we analyzed how white matter organization in different ROIs (medial SC or lateral SC) and at different spinal levels (i.e., C2–C3, C4–C5, and C6–C7) correlated with age and dexterity using Pearson's correlations. According to our hypothesis, based on the importance of the CST for dexterous manipulation, we expected to find a strong relation between FA and dexterity at the C6–C7 level and a closer relation in the lateral SC compared with the medial SC. Medial SC and lateral SC FA values were averaged across sides because we did not aim to describe anatomical differences depending on side (FA of whole cervical SC). Statistical analysis was performed using Statistica 7 (StatSoft), and the level of significance was set to p < 0.05.
Results
Cervical spinal cord white matter organization
Examples of spinal cord ROIs, FA maps, and force-tracking performance are shown in Figure 1. Spinal cord white matter was clearly visible in both a young and an older subject (Fig. 1B). Slightly reduced FA was visible in the medial spinal cord in the older subject (Fig. 1A). A tendency for reduced FA in the lateral spinal cord was observed in the subject with high force-tracking error (Fig. 1C). The mean FA of the whole spinal cord from C2–C7 (mean ± SD, 0.57 ± 0.04) was not related to the mean SD of FA (r = 0.11, p = 0.61), suggesting that low FA values were not systematically biased by inclusion of voxels with lower FA values (e.g., with greater partial volume effect). Also, the mean FA from the whole spinal cord was not related to the volume of spinal cord (r = −0.12, p = 0.57), ruling out a systematic bias of spinal cord volume. FA was highest at the C2–C3 level, was higher on the right than the left side, and higher in the lateral than in the medial spinal cord ROI (Table 1). Statistical testing using the repeated measures ANOVA revealed FA differences according to ROI, side, and level (Fig. 2). FA was significantly higher in the lateral SC than in medial SC ROIs (F(1,23) = 25.2, p < 0.001, ηp2 = 0.52), significantly higher on the right side than on the left (F(1,23) = 13.9, p = 0.001, ηp2 = 0.38), and decreased significantly from higher to lower cervical levels (F(2,46) = 29.7, p < 0.001, ηp2 = 0.56). Post hoc testing revealed that FA at the C2–C3 level was significantly higher than at both lower levels and that FA at C4–C5 was higher than at C6–C7 (p < 0.007).
Table 1.
Diffusion characteristics for lateral and medial ROIs (mean ± SD)
| Right |
Left |
|||||
|---|---|---|---|---|---|---|
| C2–C3 | C4–C5 | C6–C7 | C2–C3 | C4–C5 | C6–C7 | |
| Lateral spinal cord | ||||||
| FA | 0.65 ± 0.06 | 0.61 ± 0.07 | 0.57 ± 0.07 | 0.63 ± 0.07 | 0.60 ± 0.07 | 0.56 ± 0.08 |
| ADC (mm2/s) | 2.23 ± 0.32 | 2.22 ± 0.27 | 2.19 ± 0.2 | 2.28 ± 0.31 | 2.27 ± 0.34 | 2.29 ± 0.27 |
| AD | 1.36 ± 0.12 | 1.27 ± 0.12 | 1.33 ± 0.09 | 1.32 ± 0.13 | 1.36 ± 0.13 | 1.28 ± 0.1 |
| RD | 0.41 ± 0.08 | 0.46 ± 0.07 | 0.44 ± 0.05 | 0.43 ± 0.07 | 0.42 ± 0.07 | 0.50 ± 0.09 |
| Medial spinal cord | ||||||
| FA | 0.58 ± 0.05 | 0.54 ± 0.05 | 0.56 ± 0.04 | 0.57 ± 0.03 | 0.56 ± 0.05 | 0.52 ± 0.05 |
| ADC (mm2/s) | 2.46 ± 0.2 | 2.42 ± 0.17 | 2.46 ± 0.25 | 2.44 ± 0.21 | 2.53 ± 0.18 | 2.47 ± 0.27 |
| AD | 1.44 ± 0.11 | 1.34 ± 0.10 | 1.40 ± 0.13 | 1.41 ± 0.12 | 1.44 ± 0.11 | 1.33 ± 0.13 |
| RD | 0.52 ± 0.07 | 0.54 ± 0.05 | 0.54 ± 0.08 | 0.52 ± 0.05 | 0.55 ± 0.06 | 0.57 ± 0.08 |
Figure 2.
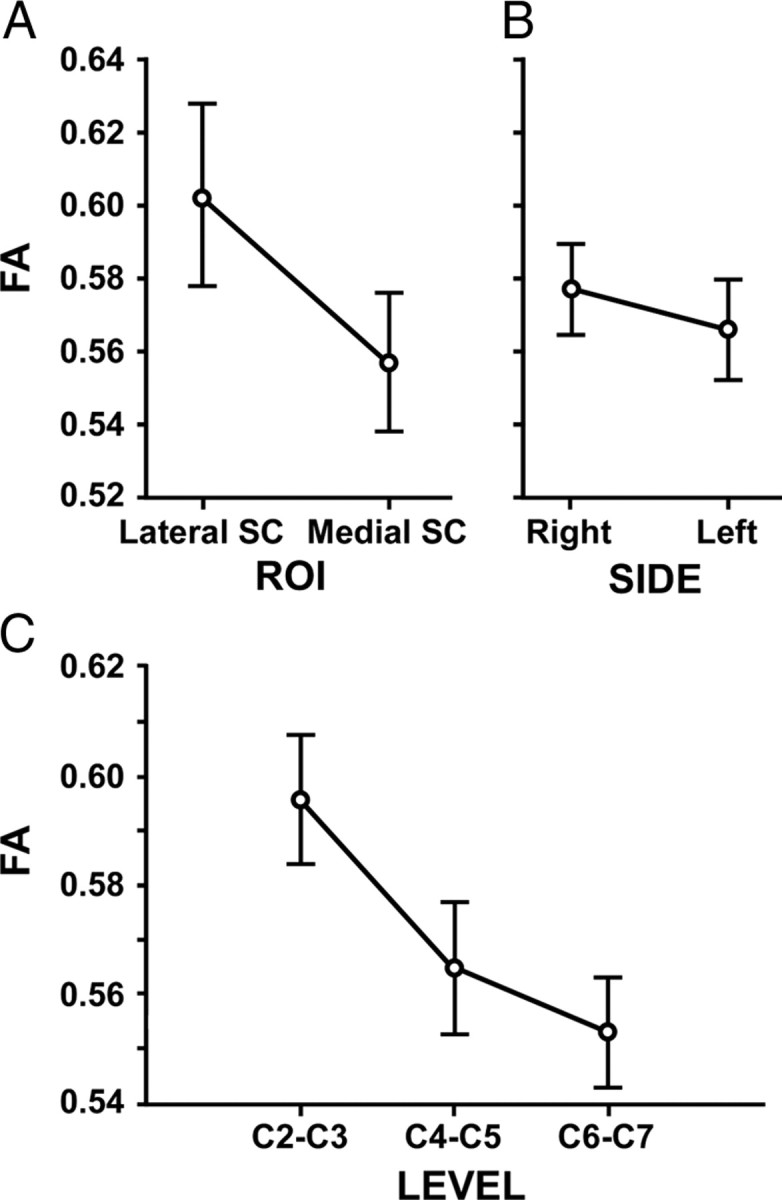
Spinal cervical FA. A, FA was significantly higher in the lateral SC than in medial SC ROIs (mean ± SE) (F(1,23) = 25.2, p < 0.001, ηp2 = 0.52). B, FA was significantly higher on the right side than on the left (F(1,23) = 13.9, p = 0.001, ηp2 = 0.38). C, FA decreased significantly from higher to lower cervical levels (F(2,46) = 29.7, p < 0.001, ηp2 = 0.56).
The repeated measures ANOVA revealed differences in ADC according to ROI and side: ADC was lower in the lateral SC than in medial SC ROIs (F(1,23) = 16.1, p < 0.001, ηp2 = 0.41), and ADC was lower on the right than on the left side (F(1,23) = 5.9, p = 0.02, ηp2 = 0.21). ADC did not differ according to level (F(2,46) = 0.92, p = 0.40, ηp2 = 0.04).
Age and cervical white matter organization
Older subjects revealed more frequent indentation of the spinal cord during visual inspection of sagittal and axial T2-wieghted MR images. However, signs of spinal cord stenosis (i.e., absent CSF on sagittal and flattening of spinal cord on axial T2-weighted images) and spinal cord lesions (hyperintense T2-weighted signal) were not present in any of the subjects (Fig. 1B).
FA of whole SC (medial and lateral, C2–C7) decreased with age (r = −0.63, p = 0.001). SD of FA did not correlate with age (r = 0.02, p = 0.93), suggesting that the partial volume effect did not bias the relation between FA and age. FA of the medial SC (C2–C7) correlated negatively with age (r = −0.68, p = 0.003), whereas FA of the lateral SC (C2–C7) showed only a trend for a negative correlation (r = −0.37, p = 0.07) (Fig. 3). ADC of whole cervical SC did not correlate with age (r = −0.12, p = 0.57).
Figure 3.
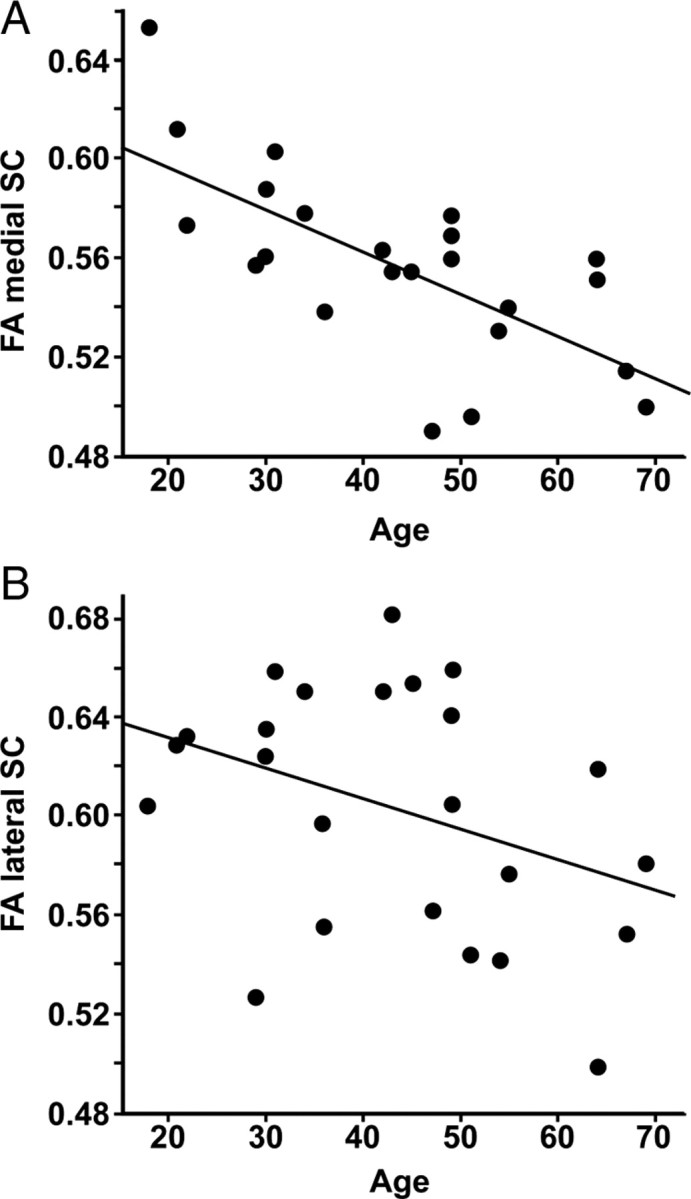
Spinal cervical FA as a function of age. A, Pearson's correlation between FA of the medial cervical spinal cord and age (n = 24, r = −0.68, p = 0.003). B, Pearson's correlation between FA of the lateral cervical spinal cord and age (n = 24, r = −0.37, p = 0.07).
Control of grip force and cervical white matter organization
Tracking error during the ramp at 3 N ranged from 43 to 83 N·s (mean ± SD, 57.4 ± 11 N·s). FA of whole cervical SC (medial and lateral, C2–C7) was lower in subjects with high tracking error (r = −0.56, p = 0.004). SD of FA did not correlate with tracking error (r = −0.22, p = 0.3), further suggesting that any bias through partial volume effect was marginal. FA of the lateral SC (C2–C7) showed a stronger correlation with tracking error (r = −0.63, p = 0.0009) than FA of the medial SC (C2–C7) (r = −0.39, p = 0.06) (Fig. 4). ADC of whole cervical SC did not correlate with tracking error (r = 0.26, p = 0.22). Maximal force ranged from 22.4 to 37.2 N (mean ± SD, 29.4 ± 4.7). Maximal force did not correlate with FA of whole SC (r = −0.18, p = 0.4) nor with ADC of whole SC (r = −0.01, p = 0.99).
Figure 4.
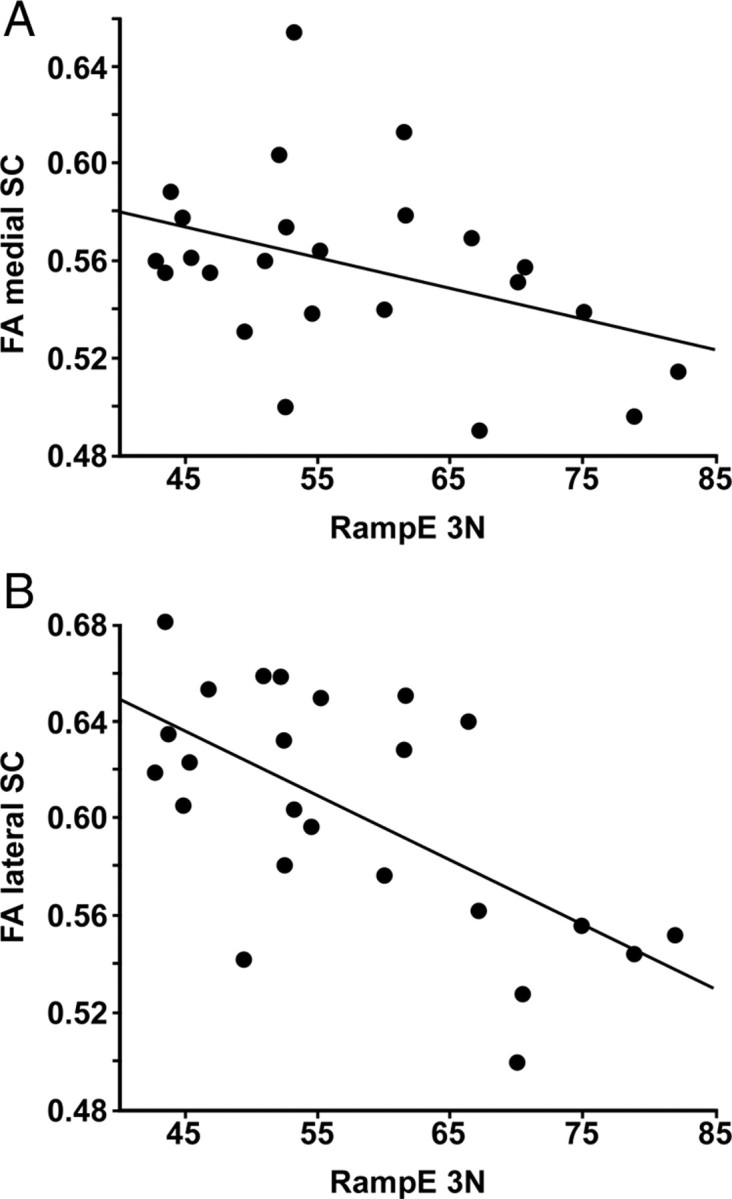
Spinal cervical FA as a function of tracking error. A, Pearson's correlation between FA of the medial cervical spinal cord and tracking error during the ramp up to 3 N (n = 24, r = −0.39, p = 0.06). B, Pearson's correlation between FA of the lateral cervical spinal cord and tracking error during the ramp up to 3 N (n = 24, r = −0.63, p = 0.0009).
Multiple regression analysis
Multiple regression analysis of mean FA of the whole cervical spinal cord (medial and lateral, C2–C7) with age and tracking error as continuous predictors revealed an independent contribution of each predictor in explaining the variance in FA (semipartial correlations: age, r = −0.55, p < 0.001; tracking error, r = −0.49, p = 0.003). The correlations remained significant (p < 0.05) when including either AD or RD as a covariate, indicating that neither AD nor RD alone could explain the relation between FA and age and tracking error.
Control of grip force, age, and white matter organization as a function of spinal cord level
Figure 5 shows how FA relates to age and tracking error at different cervical SC levels. The closest relation between FA and tracking error was found at the C6–C7 level in the lateral spinal cord ROI. Tracking error explained 41% of the variance in FA in the lateral SC at this level compared with 9% in the medial SC. Correlations between the lateral spinal cord FA and the tracking error increased successively from C2–C3, to C3–C4, to C6–C7 (Fig. 5D–F). In contrast, age did not correlate significantly with FA at any of the levels in the lateral spinal cord ROIs.
Figure 5.

FA as a function of age, tracking error, and spinal cervical level. A–C, FA of the medial spinal cord. Significant Pearson's correlations for age but not for tracking error at each cervical level. D–F, FA of the lateral spinal cord. y-axis shows mean normalized values for age and RampE 3N (i.e., values of 1 indicate mean). The Pearson's correlations between the lateral spinal cord FA and the tracking error increased successively from the C2–C3 (nonsignificant), to C3–C4 (weakly significant), to C6–C7 (highly significant). In contrast, no significant correlation was found with age.
Age correlated significantly at each of the levels for FA of the medial cervical SC (Fig. 5A–C). The closest relation between age and FA was found in the medial SC at the C4–C5 level, with age explaining 46% of the variance in FA at this level.
Discussion
We used DTI and a regional analysis of FA to quantify white matter organization in the cervical spinal cord. This structural information was then related to a functional parameter: precision grip force, an essential component of manual dexterity. Two principle results were obtained: (1) a correlation, independent of age, between the accuracy of grip force control and FA in the cervical spinal cord, and (2) FA correlations with age and control of grip force varied differentially depending on spinal cord region. In particular, the strongest correlation between FA and control of grip force was found in the lateral spinal cord at C6–C7, an area of the spinal cord known to contain descending CST fibers innervating the spinal circuitry relevant for the control of distal upper limb muscles.
Methodological considerations and validation of the DTI method
A limitation of this study is the relatively poor spatial resolution of the DTI sequence and the use of manually defined ROIs. However, a similar slice thickness has been used previously for spinal DTI (Ducreux et al., 2006; Agosta et al., 2007; Lindberg et al., 2009b), and a comparative study using different DTI settings showed that thicker sagittal slices resulted in better image quality and in a larger number of reconstructed fibers using tractography (Lee et al., 2006). The definition and use of our ROIs has been validated by comparison with an automated segmentation approach (see Materials and Methods). Identical ROIs have been used recently to reveal the presence of Wallerian degeneration in the lateral spinal cord in chronic stroke patients (Lindberg et al., 2009b).
Mean FA for the whole cervical cord (C2–C7) was 0.57 in our study. This is slightly lower than 0.61 reported by Wheeler-Kingshott et al. (2002) using an axial DTI sequence and 0.64 by Agosta et al. (2007) using a sagittal sequence, but higher than mean tract FA of 0.49 found by Ciccarelli et al. (2007) using probabilistic fiber tracking. Given different scanners and DTI sequences, these variations are to be expected. In this study, FA was highest at the C2–C3 cervical level compared with lower cervical levels, as reported previously (Wheeler-Kingshott et al., 2002; Van Hecke et al., 2008). Furthermore, the 13% reduction in FA from the higher C2–C3 (0.60) to the lower C6–C7 (0.55) level, which may reflect an increasing gray matter/white matter ratio at the cervical enlargement (Wheeler-Kingshott et al., 2002), is comparable with previously reported reductions: 8% between C2–C3 and C5–C6 (Wheeler-Kingshott et al., 2002) and 13% between C1–C2 and C5–C6 (Van Hecke et al., 2008).
We found higher FA values in lateral compared with medial spinal cord ROIs. This is in line with previously reported DTI findings using probabilistic tractography (Ciccarelli et al., 2007) and is coherent with the overall gray matter–white matter distribution at cervical levels (Nathan et al., 1990). We also found higher FA values on the right compared with the left side of cervical spinal cord, which has not been reported elsewhere, but is consistent with postmortem data revealing a greater number of CST fibers on the right (Nathan et al., 1990). Finally, we also found a strong negative correlation between age and FA (r = −0.63) similar to previous reports (r = −0.70) (Agosta et al., 2007). Thus, FA findings of the current study confirm previous DTI results of the cervical spinal cord. This indirectly validates the new findings discussed below.
Control of grip force and age: differential relations with white matter organization in the cervical spinal cord
This is the first study to show a correlation between spinal white matter organization as determined by DTI and force control in precision grip, an important aspect of manual dexterity in healthy subjects. In agreement with our hypothesis, (1) FA was higher in subjects with low error in the force tracking task, and this was independent of age. (2) The correlation between FA and accuracy in force control was stronger in the lateral compared with medial spinal cord. This most likely reflects the fact that the lateral CST is key to manual dexterity (Lemon, 2008), represents the largest tract in the lateral spinal cord (Nathan et al., 1990), and is likely to contribute significantly to the FA of the lateral ROI. (3) FA correlated most strongly with control of grip force at the (lateral) C6–C7 level. This most probably reflects the proportion of descending white matter fibers, functionally relevant for hand function, which pass at the C6–C7 level. This proportion is greater at C6–C7 than at higher levels: at C2–C3, descending fibers innervate neck, proximal and distal upper limb, as well as lower limb muscles, whereas at C6–C7 only distal upper limb and lower limb muscles are innervated. Conversely, (4) age and FA correlated consistently across all cervical levels in the medial spinal cord. Thus, the regions of white matter affected by age were spatially distinct from those closely correlated to dexterity. Furthermore, the multiple regression analysis revealed an independent contribution of age and control of grip force in predicting FA of whole spinal cord: each predictor explained a unique part of the FA variance (age, 30%; dexterity, 24%). Together, these findings show that age and control of grip force explain different aspects of cervical spinal cord white matter organization and that the correlation between FA and control of grip force cannot be explained by age.
The relation between age and FA in the medial cervical cord is consistent with findings that white matter degeneration is more common in the posterior columns compared with the lateral tracts in the very old (Wang et al., 1999). Nonetheless, the CST is affected by age (Cruz-Sánchez et al., 1998; Nakanishi et al., 2004) and particularly the small-diameter fibers (Terao et al., 1994). Therefore, the differential relation may in part be explained by the fact that FA mainly reflects the diffusion characteristics of large-diameter fibers (Beaulieu, 2002). The reduced FA in the medial spinal cord in the older subjects is likely attributable to subtle changes in both axial and radial diffusivity because neither alone could explain the observed correlation. This suggests both altered axons (accumulations of neurofilaments) and disrupted myelin sheaths, as found in the aging cat (Zhang et al., 1998). Finally, although speculatively, greater age-related effects in the medial spinal cord might be caused by greater compression of the medial compared with the lateral spinal cord because the incidence of posterior disc protrusion increases with age (Okada et al., 2009). In this study, no visual signs of spinal cord stenosis were present among the subjects. Future studies quantifying the degree of spinal cord stenosis may shed light on whether age-related changes in the medial spinal cord are specifically related to degree of stenosis.
Speculation on causal relation
The question is open as to the underlying cause of the observed correlation between structure and function, i.e., between spinal FA and accuracy in grip force tracking. We interpret this finding in the sense that higher FA values reflect a functional specialization of the descending motor pathways, in particular of the lateral CST. Different mechanisms may come into play: increased FA may (1) reflect the presence of more fibers in a given volume (Beaulieu, 2002) and (2) express a higher degree of myelination (Bengtsson et al., 2005; Fields, 2008). More fibers would increase diffusion along white matter tracts (axial diffusivity), and higher degree of myelination would increase diffusion perpendicular to white matter tracts (radial diffusivity) (Song et al., 2002, 2003; Budde et al., 2007; Beaulieu, 2009). However, in this study, it seems that the higher FA in subjects with good force control combined subtle changes in both axial and radial diffusivity, because alone neither of them could explain the correlation (in the multiple regression). This suggests a combination of improved axonal and myelin integrity underlying improved force control (Song et al., 2002, 2003; Budde et al., 2007). Another factor that may affect spinal cord FA is the density of collateral fibers (Mamata et al., 2006). However, the current resolution did not permit separate quantification of FA of descending versus collateral fibers.
The number of fibers and their myelination depends predominantly on two factors: learning and maturation (Fields, 2008). Learning or highly repetitive use of finger movements have been linked to structural and functional changes in sensorimotor brain networks (Karni et al., 1995; Pascual-Leone et al., 1993, 1995; Pearce et al., 2000; Draganski et al., 2004; Rosenkranz et al., 2007) and spinal networks (Perez et al., 2005; Meunier et al., 2007). Nonetheless, this is supposed to reflect changes in synaptic plasticity and not in white matter (cf. Markham et al., 2009 in the rat model), which suggests that learning during adulthood alone cannot explain the increased FA found in subjects with good dexterity. It seems more likely that a combination of learning and maturation underlies this white matter upregulation, i.e., upregulation during childhood or adolescence when the degree of myelination is highly use dependent. This interpretation would be consistent with three key points (1) maturation of the CST parallels the behavioral development of fine finger movements (Paus et al., 1999), (2) white matter integrity in the adult CST is related to the degree of use during childhood (Bengtsson et al., 2005), and (3) myelination through oligodendrocytes can be induced by electrical axonal activity (Demerens et al., 1996).
In conclusion, differential correlations between spinal white matter organization (FA), age, and control of grip force were found in healthy subjects. The correlation between FA and age was predominant in the medial spinal cord, suggesting an increased sensitivity to age-related decline in medial spinal cord white matter in healthy subjects. In contrast, the strongest correlation between FA and control of grip force was found at C6–C7 in the lateral spinal cord in which the CST innervates spinal circuitry relevant for the control of the distal upper limb, indicating a functionally relevant specialization of spinal cord white matter.
Footnotes
This study was supported in part by grants from Hjärnfonden (the Swedish Brain Foundation) (P.G.L.) and the Institut pour la Recherche sur la Moelle Epinière et l'Encéphale (Paris, France).
References
- Agosta F, Laganà M, Valsasina P, Sala S, Dall'Occhio L, Sormani MP, Judica E, Filippi M. Evidence for cervical cord tissue disorganisation with aging by diffusion tensor MRI. Neuroimage. 2007;36:728–735. doi: 10.1016/j.neuroimage.2007.03.048. [DOI] [PubMed] [Google Scholar]
- Ayabe S, Goto N, Atsumi T, Goto J, Suzuki J. Morphometric evaluation of posterior funiculus nerve fibers in relation to aging. Okajimas Folia Anat Jpn. 2005;82:35–38. doi: 10.2535/ofaj.82.35. [DOI] [PubMed] [Google Scholar]
- Basser PJ, Jones DK. Diffusion-tensor MRI: theory, experimental design and data analysis—a technical review. NMR Biomed. 2002;15:456–467. doi: 10.1002/nbm.783. [DOI] [PubMed] [Google Scholar]
- Basser PJ, Pierpaoli C. Microstructural and physiological features of tissues elucidated by quantitative-diffusion-tensor MRI. J Magn Reson B. 1996;111:209–219. doi: 10.1006/jmrb.1996.0086. [DOI] [PubMed] [Google Scholar]
- Beaulieu C. The basis of anisotropic water diffusion in the nervous system: a technical review. NMR Biomed. 2002;15:435–455. doi: 10.1002/nbm.782. [DOI] [PubMed] [Google Scholar]
- Beaulieu C. In: Diffusion MRI: from quantitative measurement to in vivo neuroanatomy. Johansen-Berg H, Behrens TEJ, editors. London: Elsevier; 2009. [Google Scholar]
- Bengtsson SL, Nagy Z, Skare S, Forsman L, Forssberg H, Ullén F. Extensive piano practicing has regionally specific effects on white matter development. Nat Neurosci. 2005;8:1148–1150. doi: 10.1038/nn1516. [DOI] [PubMed] [Google Scholar]
- Budde MD, Kim JH, Liang HF, Schmidt RE, Russell JH, Cross AH, Song SK. Toward accurate diagnosis of white matter pathology using diffusion tensor imaging. Magn Reson Med. 2007;57:688–695. doi: 10.1002/mrm.21200. [DOI] [PubMed] [Google Scholar]
- Ciccarelli O, Wheeler-Kingshott CA, McLean MA, Cercignani M, Wimpey K, Miller DH, Thompson AJ. Spinal cord spectroscopy and diffusion-based tractography to assess acute disability in multiple sclerosis. Brain. 2007;130:2220–2231. doi: 10.1093/brain/awm152. [DOI] [PubMed] [Google Scholar]
- Cohen-Adad J, Benali H, Hoge RD, Rossignol S. In vivo DTI of the healthy and injured cat spinal cord at high spatial and angular resolution. Neuroimage. 2008;40:685–697. doi: 10.1016/j.neuroimage.2007.11.031. [DOI] [PubMed] [Google Scholar]
- Courtine G, Bunge MB, Fawcett JW, Grossman RG, Kaas JH, Lemon R, Maier I, Martin J, Nudo RJ, Ramon-Cueto A, Rouiller EM, Schnell L, Wannier T, Schwab ME, Edgerton VR. Can experiments in nonhuman primates expedite the translation of treatments for spinal cord injury in humans? Nat Med. 2007;13:561–566. doi: 10.1038/nm1595. [DOI] [PMC free article] [PubMed] [Google Scholar]
- Cruz-Sánchez FF, Moral A, Tolosa E, de Belleroche J, Rossi ML. Evaluation of neuronal loss, astrocytosis and abnormalities of cytoskeletal components of large motor neurons in the human anterior horn in aging. J Neural Transm. 1998;105:689–701. doi: 10.1007/s007020050088. [DOI] [PubMed] [Google Scholar]
- Demerens C, Stankoff B, Logak M, Anglade P, Allinquant B, Couraud F, Zalc B, Lubetzki C. Induction of myelination in the central nervous system by electrical activity. Proc Natl Acad Sci U S A. 1996;93:9887–9892. doi: 10.1073/pnas.93.18.9887. [DOI] [PMC free article] [PubMed] [Google Scholar]
- Draganski B, Gaser C, Busch V, Schuierer G, Bogdahn U, May A. Neuroplasticity: changes in grey matter induced by training. Nature. 2004;427:311–312. doi: 10.1038/427311a. [DOI] [PubMed] [Google Scholar]
- Ducreux D, Lepeintre JF, Fillard P, Loureiro C, Tadié M, Lasjaunias P. MR diffusion tensor imaging and fiber tracking in 5 spinal cord astrocytomas. AJNR Am J Neuroradiol. 2006;27:214–216. [PMC free article] [PubMed] [Google Scholar]
- Fields RD. White matter in learning, cognition and psychiatric disorders. Trends Neurosci. 2008;31:361–370. doi: 10.1016/j.tins.2008.04.001. [DOI] [PMC free article] [PubMed] [Google Scholar]
- Freund P, Schmidlin E, Wannier T, Bloch J, Mir A, Schwab ME, Rouiller EM. Nogo-A-specific antibody treatment enhances sprouting and functional recovery after cervical lesion in adult primates. Nat Med. 2006;12:790–792. doi: 10.1038/nm1436. [DOI] [PubMed] [Google Scholar]
- Karni A, Meyer G, Jezzard P, Adams MM, Turner R, Ungerleider LG. Functional MRI evidence for adult motor cortex plasticity during motor skill learning. Nature. 1995;377:155–158. doi: 10.1038/377155a0. [DOI] [PubMed] [Google Scholar]
- Lang CE, Schieber MH. Differential impairment of individuated finger movements in humans after damage to the motor cortex or the corticospinal tract. J Neurophysiol. 2003;90:1160–1170. doi: 10.1152/jn.00130.2003. [DOI] [PubMed] [Google Scholar]
- Lang CE, Schieber MH. Reduced muscle selectivity during individuated finger movements in humans after damage to the motor cortex or corticospinal tract. J Neurophysiol. 2004;91:1722–1733. doi: 10.1152/jn.00805.2003. [DOI] [PubMed] [Google Scholar]
- Lawrence DG, Kuypers HG. The functional organization of the motor system in the monkey. I. The effects of bilateral pyramidal lesions. Brain. 1968;91:1–14. doi: 10.1093/brain/91.1.1. [DOI] [PubMed] [Google Scholar]
- Lee JW, Kim JH, Kang HS, Lee JS, Choi JY, Yeom JS, Kim HJ, Chung HW. Optimization of acquisition parameters of diffusion-tensor magnetic resonance imaging in the spinal cord. Invest Radiol. 2006;41:553–559. doi: 10.1097/01.rli.0000221325.03899.48. [DOI] [PubMed] [Google Scholar]
- Lemon RN. Descending pathways in motor control. Annu Rev Neurosci. 2008;31:195–218. doi: 10.1146/annurev.neuro.31.060407.125547. [DOI] [PubMed] [Google Scholar]
- Lemon RN, Griffiths J. Comparing the function of the corticospinal system in different species: organizational differences for motor specialization? Muscle Nerve. 2005;32:261–279. doi: 10.1002/mus.20333. [DOI] [PubMed] [Google Scholar]
- Lindberg PG, Skejø PH, Rounis E, Nagy Z, Schmitz C, Wernegren H, Bring A, Engardt M, Forssberg H, Borg J. Wallerian degeneration of the corticofugal tracts in chronic stroke: a pilot study relating diffusion tensor imaging, transcranial magnetic stimulation, and hand function. Neurorehabil Neural Repair. 2007;21:551–560. doi: 10.1177/1545968307301886. [DOI] [PubMed] [Google Scholar]
- Lindberg P, Ody C, Feydy A, Maier MA. Precision in isometric precision grip force is reduced in middle-aged adults. Exp Brain Res. 2009a;193:213–224. doi: 10.1007/s00221-008-1613-4. [DOI] [PubMed] [Google Scholar]
- Lindberg PG, Bensmail D, Bussel B, Maier MA, Feydy A. Wallerian degeneration in lateral cervical spinal cord detected with diffusion tensor imaging in four chronic stroke patients. J Neuroimaging. 2009b doi: 10.1111/j.1552-6569.2009.00409.x. [DOI] [PubMed] [Google Scholar]
- Mamata H, De Girolami U, Hoge WS, Jolesz FA, Maier SE. Collateral nerve fibers in human spinal cord: visualization with magnetic resonance diffusion tensor imaging. Neuroimage. 2006;31:24–30. doi: 10.1016/j.neuroimage.2005.11.038. [DOI] [PubMed] [Google Scholar]
- Markham JA, Herting MM, Luszpak AE, Juraska JM, Greenough WT. Myelination of the corpus callosum in male and female rats following complex environment housing during adulthood. Brain Res. 2009;1288:9–17. doi: 10.1016/j.brainres.2009.06.087. [DOI] [PMC free article] [PubMed] [Google Scholar]
- Meunier S, Kwon J, Russmann H, Ravindran S, Mazzocchio R, Cohen L. Spinal use-dependent plasticity of synaptic transmission in humans after a single cycling session. J Physiol. 2007;579:375–388. doi: 10.1113/jphysiol.2006.122911. [DOI] [PMC free article] [PubMed] [Google Scholar]
- Nakanishi R, Goto J, Ezure H, Motoura H, Ayabe S, Atsumi T. Morphometric analyses of axons in the human lateral corticospinal tract: cervical/lumbar level comparison and relation to the ageing process. Okajimas Folia Anat Jpn. 2004;81:1–4. doi: 10.2535/ofaj.81.1. [DOI] [PubMed] [Google Scholar]
- Nathan PW, Smith MC, Deacon P. The corticospinal tracts in man. Course and location of fibres at different segmental levels. Brain. 1990;113:303–324. doi: 10.1093/brain/113.2.303. [DOI] [PubMed] [Google Scholar]
- Okada E, Matsumoto M, Ichihara D, Chiba K, Toyama Y, Fujiwara H, Momoshima S, Nishiwaki Y, Hashimoto T, Ogawa J, Watanabe M, Takahata T. Does the sagittal alignment of the cervical spine have an impact on disk degeneration? Minimum 10-year follow-up of asymptomatic volunteers. Eur Spine J. 2009;18:1644–1651. doi: 10.1007/s00586-009-1095-5. [DOI] [PMC free article] [PubMed] [Google Scholar]
- Oldfield RC. The assessment and analysis of handedness: the Edinburgh inventory. Neuropsychologia. 1971;9:97–113. doi: 10.1016/0028-3932(71)90067-4. [DOI] [PubMed] [Google Scholar]
- Pascual-Leone A, Cammarota A, Wassermann EM, Brasil-Neto JP, Cohen LG, Hallett M. Modulation of motor cortical outputs to the reading hand of braille readers. Ann Neurol. 1993;34:33–37. doi: 10.1002/ana.410340108. [DOI] [PubMed] [Google Scholar]
- Pascual-Leone A, Nguyet D, Cohen LG, Brasil-Neto JP, Cammarota A, Hallett M. Modulation of muscle responses evoked by transcranial magnetic stimulation during the acquisition of new fine motor skills. J Neurophysiol. 1995;74:1037–1045. doi: 10.1152/jn.1995.74.3.1037. [DOI] [PubMed] [Google Scholar]
- Paus T, Zijdenbos A, Worsley K, Collins DL, Blumenthal J, Giedd JN, Rapoport JL, Evans AC. Structural maturation of neural pathways in children and adolescents: in vivo study. Science. 1999;283:1908–1911. doi: 10.1126/science.283.5409.1908. [DOI] [PubMed] [Google Scholar]
- Pearce AJ, Thickbroom GW, Byrnes ML, Mastaglia FL. Functional reorganisation of the corticomotor projection to the hand in skilled racquet players. Exp Brain Res. 2000;130:238–243. doi: 10.1007/s002219900236. [DOI] [PubMed] [Google Scholar]
- Perez MA, Lungholt BK, Nielsen JB. Presynaptic control of group Ia afferents in relation to acquisition of a visuo-motor skill in healthy humans. J Physiol. 2005;568:343–354. doi: 10.1113/jphysiol.2005.089904. [DOI] [PMC free article] [PubMed] [Google Scholar]
- Rosenkranz K, Williamon A, Rothwell JC. Motorcortical excitability and synaptic plasticity is enhanced in professional musicians. J Neurosci. 2007;27:5200–5206. doi: 10.1523/JNEUROSCI.0836-07.2007. [DOI] [PMC free article] [PubMed] [Google Scholar]
- Sasaki S, Isa T, Pettersson LG, Alstermark B, Naito K, Yoshimura K, Seki K, Ohki Y. Dexterous finger movements in primate without monosynaptic corticomotoneuronal excitation. J Neurophysiol. 2004;92:3142–3147. doi: 10.1152/jn.00342.2004. [DOI] [PubMed] [Google Scholar]
- Song SK, Sun SW, Ramsbottom MJ, Chang C, Russell J, Cross AH. Dysmyelination revealed through MRI as increased radial (but unchanged axial) diffusion of water. Neuroimage. 2002;17:1429–1436. doi: 10.1006/nimg.2002.1267. [DOI] [PubMed] [Google Scholar]
- Song SK, Sun SW, Ju WK, Lin SJ, Cross AH, Neufeld AH. Diffusion tensor imaging detects and differentiates axon and myelin degeneration in mouse optic nerve after retinal ischemia. Neuroimage. 2003;20:1714–1722. doi: 10.1016/j.neuroimage.2003.07.005. [DOI] [PubMed] [Google Scholar]
- Terao S, Sobue G, Hashizume Y, Shimada N, Mitsuma T. Age-related changes of the myelinated fibers in the human corticospinal tract: a quantitative analysis. Acta Neuropathol. 1994;88:137–142. doi: 10.1007/BF00294506. [DOI] [PubMed] [Google Scholar]
- Valsasina P, Agosta F, Benedetti B, Caputo D, Perini M, Salvi F, Prelle A, Filippi M. Diffusion anisotropy of the cervical cord is strictly associated with disability in amyotrophic lateral sclerosis. J Neurol Neurosurg Psychiatry. 2007;78:480–484. doi: 10.1136/jnnp.2006.100032. [DOI] [PMC free article] [PubMed] [Google Scholar]
- Van Hecke W, Leemans A, Sijbers J, Vandervliet E, Van Goethem J, Parizel PM. A tracking-based diffusion tensor imaging segmentation method for the detection of diffusion-related changes of the cervical spinal cord with aging. J Magn Reson Imaging. 2008;27:978–991. doi: 10.1002/jmri.21338. [DOI] [PubMed] [Google Scholar]
- Virta A, Barnett A, Pierpaoli C. Visualizing and characterizing white matter fiber structure and architecture in the human pyramidal tract using diffusion tensor MRI. Magn Reson Imaging. 1999;17:1121–1133. doi: 10.1016/s0730-725x(99)00048-x. [DOI] [PubMed] [Google Scholar]
- Wang Y, Hashizume Y, Yoshida M, Inagaki T, Kameyama T. Pathological changes of the spinal cord in centenarians. Pathol Int. 1999;49:118–124. doi: 10.1046/j.1440-1827.1999.00832.x. [DOI] [PubMed] [Google Scholar]
- Ward NS, Newton JM, Swayne OB, Lee L, Frackowiak RS, Thompson AJ, Greenwood RJ, Rothwell JC. The relationship between brain activity and peak grip force is modulated by corticospinal system integrity after subcortical stroke. Eur J Neurosci. 2007;25:1865–1873. doi: 10.1111/j.1460-9568.2007.05434.x. [DOI] [PMC free article] [PubMed] [Google Scholar]
- Wheeler-Kingshott CA, Hickman SJ, Parker GJ, Ciccarelli O, Symms MR, Miller DH, Barker GJ. Investigating cervical spinal cord structure using axial diffusion tensor imaging. Neuroimage. 2002;16:93–102. doi: 10.1006/nimg.2001.1022. [DOI] [PubMed] [Google Scholar]
- Zhang JH, Sampogna S, Morales FR, Chase MH. Age-related intra-axonal accumulation of neurofilaments in the dorsal column nuclei of the cat brainstem: a light and electron microscopic immunohistochemical study. Brain Res. 1998;797:333–338. doi: 10.1016/s0006-8993(98)00301-1. [DOI] [PubMed] [Google Scholar]