

Abstract
The function of voltage-gated chloride channels in neurons is essentially unknown. The voltage-gated chloride channel ClC-2 mediates a chloride current in pyramidal cells of the hippocampus. We directly show that ClC-2 assists chloride extrusion after high chloride load. Furthermore, the loss of this chloride channel leads to a dramatic increase of the input resistance of CA1 pyramidal cells, making these cells more excitable. Surprisingly, basal synaptic transmission, as judged from recordings of field EPSPs, was decreased. This difference was eliminated when GABAergic inhibition was blocked. Recordings from hippocampal interneurons revealed ClC-2-mediated currents in a subset of these cells. An observed increase in GABAergic inhibition could thus be explained by an increase in the excitability of interneurons, caused by the loss of ClC-2. Together, we suggest a dual role for ClC-2 in neurons, providing an additional efflux pathway for chloride and constituting a substantial part of the background conductance, which regulates excitability. In ClC-2 knock-out mice, an increased inhibition seemingly balances the hyperexcitability of the network and thereby prevents epilepsy.
Introduction
Aside from the ligand-gated GABAA receptors, voltage-gated chloride channels are expressed in the hippocampus (Jentsch et al., 2002). In contrast to the well characterized GABAA receptors, the function of voltage-gated chloride channels in neurons is still primarily elusive. They have been suggested to be involved in regulating chloride homeostasis (Staley et al., 1996), excitability (Madison et al., 1986), and acidification of synaptic vesicles (Stobrawa et al., 2001).
One of the voltage-gated chloride channels expressed in neurons is ClC-2. ClC-2 is an almost ubiquitously expressed chloride channel of the CLC family of chloride channels and transporters. ClC-2 is activated by negative membrane voltage, cell swelling, a rise in intracellular chloride concentration, or mild extracellular acidification (Gründer et al., 1992; Thiemann et al., 1992; Jordt and Jentsch, 1997; Zúñiga et al., 2004). The loss of ClC-2 in mice has profound effects leading to testicular and retinal degeneration (Bösl et al., 2001). Recently, in aged knock-out (KO) animals, a spongiform vacuolation of the white matter in the CNS was reported, which might be related to defective oligodendrocyte function (Blanz et al., 2007).
Although currents with properties similar to ClC-2 have been described in neurons (Chenoy-Marchais, 1982; Madison et al., 1986; Staley, 1994), the molecular identity and the function of this current remains unclear. ClC-2 has been proposed to participate in lowering the cytoplasmic chloride concentration ([Cl−]i) of neurons (Staley, 1994; Staley et al., 1996; Ben-Ari, 2002). Chloride extrusion is primarily mediated by the neuron-specific potassium chloride cotransporter 2 (KCC2); however, additional mechanisms might play an important role under conditions of high chloride load. The large conductance of ClC-2 makes it well suited for this purpose (Staley et al., 1996). In addition, if this conductance is active at resting membrane potential, it should contribute to the membrane resistance (Madison et al., 1986). Both actions are such that loss of ClC-2 should lead to increased neuronal excitability, which could cause diseases, such as epilepsy. However, the disruption of ClC-2 in mice did not entail epilepsy (Bösl et al., 2001; Nehrke et al., 2002; Blanz et al., 2007). This has been controversial, because mutations in the gene encoding ClC-2 in humans have been linked to epilepsy (D'Agostino et al., 2004; Everett et al., 2007).
Here we investigate the role of ClC-2 in hippocampal pyramidal cells. We found that ClC-2 mediates a chloride current, is involved in chloride extrusion, and constitutes a substantial part of the background conductance in hippocampal neurons. The loss of ClC-2 leads to a dramatic increase of the input resistance of CA1 pyramidal cells, thereby increasing excitability. Surprisingly, basal synaptic transmission decreased in field recordings, which was dependent on GABAergic inhibition. We show that a subset of interneurons display a characteristic ClC-2-mediated current. The loss of ClC-2 in interneurons leads to an increase of excitability of interneurons, resulting in an increased inhibition of principal neurons, thereby reducing overall network excitability. Our data suggest a dual role for ClC-2 in neurons, regulating excitability via the membrane resistance and providing an additional efflux pathway for chloride.
Materials and Methods
Mice.
The generation of ClC-2 knock-out mice was described previously (Bösl et al., 2001). Both male and female mice were used for all experiments.
Slice preparation.
Animals were anesthetized with isoflurane (Baxter) and decapitated. Brains were removed quickly and chilled in carbogen (95% O2, 5% CO2) gassed artificial CSF (ACSF) containing the following (in mm): 130.9 NaCl, 2.75 KCl, 1.43 MgSO4, 2.5 CaCl2, 1.1 NaH2PO4, 28.82 NaHCO3, and 11.1 d-glucose (osmolarity of 315–325 mOsm/L). Hippocampal slices (400 μm) were cut either horizontally [postnatal day 1 (P1) to P8] or transversally (P9–P20) with a vibratome (VT1200S; Leica). Before recording, slices were kept for 30 min at 32°C and subsequently stored at room temperature in ACSF continuously gassed with carbogen.
Electrophysiology.
All recordings were performed using a Multiclamp 700B amplifier (Molecular Devices). Data were digitized using a Digidata 1322A (Molecular Devices). Pipettes (3–5 MΩ) were pulled from borosilicate glass (Science Products). Inputs from CA3 to CA1 were severed to prevent propagation of epileptiform activity. Liquid junction potentials were calculated with the liquid junction potential assistant of pClamp. Membrane potentials were corrected by 15 mV.
Extracellular recordings.
Field EPSPs (fEPSPs) were recorded in the stratum radiatum of CA1 of P15–P20 mice. Recording and stimulation electrodes were filled with ASCF.
Whole-cell recordings.
Whole-cell recordings were obtained from CA1 pyramidal cells or interneurons, which were visualized using differential interference contrast infrared video microscopy.
ClC-2 currents.
Chloride currents were recorded with high chloride pipette solution containing the following (in mm): 90 CsCl, 20 Cs-gluconate, 8 NaCl, 2 MgCl2, 10 HEPES, 1 EGTA, and 2 QX-314 [N-(2,6-dimethylphenylcarbamoylmethyl)triethylammonium chloride] (Alomone Labs), pH 7.2 (290 mOsm/L). Extracellular recording solution contained the following (in mm): 70 NaCl, 2.5 KCl, 16 MgSO4, 26.2 NaHCO3, 11 glucose, 30 tetraethylammonium-chloride, and 10 CsCl [supplemented with 200 nm tetrodotoxin (TTX) to block action potentials (APs)]. In some recordings, 50 μm ZD7288 (4-ethylphenylamino-1,2-dimethyl-6-methylaminopyrimidinium chloride) (Ascent Scientific) was added to block the hyperpolarization-activated inward current (Ih). Interneurons were identified as such by their location, morphology, and post hoc biocytin staining. Recordings were not obtained from any specific type of interneuron. ClC-2 chloride currents were evoked by stepping the membrane potential from −10 to −120 mV for 4 s (see Fig. 1F). ClC-2-mediated currents were calculated as the difference of the inward current at the beginning and the end of the voltage step.
Figure 1.

Properties of ClC-2 currents in CA1 pyramidal cells. CA1 pyramidal cells show ClC-2-mediated currents. Currents were elicited by voltage steps of 4 s from a holding potential of −10 mV to values between 40 and −120 mV in steps of −20 mV, followed by a test pulse of +40 mV for 1 s, as illustrated in F. A, The slowly developing inward current is not blocked by the specific Ih inhibitor ZD7288. B, ClC-2 currents in CA1 pyramidal cells are activated by acid extracellular pH. C, Currents obtained in CA1 neurons show a lower permeability for iodide, which is typical for ClC chloride channels. D, Under the same recording conditions as in WT mice, no currents were elicited from Clcn2−/− animals. E, Current–voltage plot of steady-state currents from WT (filled symbols) and KO (open symbols). F, Voltage step protocol used for evoking ClC-2 currents. Error bars represent SEM in all graphs. Note that symbol size might occlude error bars.
Chloride transport.
GABA-evoked chloride currents were recorded at the soma in response to pressure application of GABA (100 μm) in ACSF to the apical dendrites 50–100 μm from the soma (5–15 ms, 5 psi) using a pneumatic drug ejector (NPI). Cells were clamped to −70 mV. Recordings were performed with a low chloride intracellular solution containing the following (in mm): 150 K-methylsulphonate, 4 KCl, 4 NaCl, 4 MgATP, 0.4 Mg GTP, and 10 HEPES. To estimate chloride transport, [Cl−]i was transiently increased, and the rate at which [Cl−]i returned to baseline was determined. For experimental protocol, also see Figure 2. Charges of GABA-evoked currents were normalized to the absolute sum of the charges of the baseline and the first test pulse, because the rate of decay depends on the baseline charge and the effective loading, which is given by the first test pulse. To obtain time constants, curves were fitted with a monoexponential function.
Figure 2.
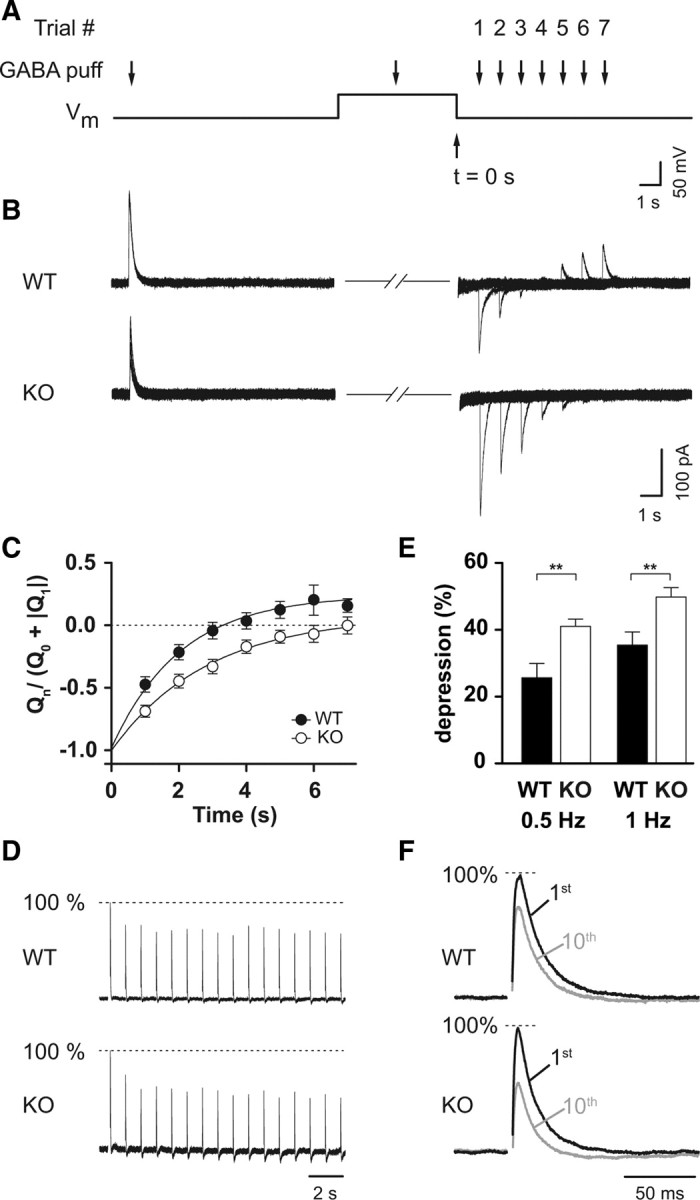
Chloride is extruded quickly via ClC-2. A, Experimental protocol. A first GABA puff elicited a baseline chloride current; thereafter, Vm was depolarized to −15 mV for 6 s. At 3 s into the voltage step, [Cl−]i was increased by a second GABA puff. Vm was then stepped back to resting membrane potential, and a third GABA application evoked a test current. Seven trials of GABA puffs with increasing delays between load and test pulse were performed. B, Sample traces for WT (top) and KO (bottom) show a much slower return to steady-state conditions in the KO. Note that currents during depolarization are omitted for clarity. C, Average return to steady state. Charges were normalized to the absolute sum of the baseline and first evoked trial. Decay kinetics of WT (filled circles) were significantly faster than for KO (open circles). See Material and Methods for detailed description of analysis. D, Sample traces for WT (top) and KO (bottom) of normalized IPSCs; dotted line indicates 100% of the baseline. Stimulus artifacts have been omitted for clarity. E, Repetitive activation of GABAA receptors leads to a chloride accumulation, reducing the driving force and thereby leading to a depression of evoked IPSCs. At 0.5 and 1 Hz, Clcn2−/− showed a stronger depression than Clcn2+/+. F, Normalized sample traces of the 1st and 10th stimulus for WT (top) and KO (bottom). Stimulus artifacts have been omitted for clarity. Filled symbols represent WT, and open symbols represent KO in all graphs. Error bars represent SEM in all graphs.
Chloride accumulation.
Recording conditions were the same as for chloride transport experiments. Trains of IPSCs were synaptically evoked by repetitive stimulation at different frequencies (0.5, 1, 2, and 5 Hz) with a monopolar stimulation electrode placed nearby the recorded pyramidal cell. The depression was calculated as the ratio of the 10th to the first evoked IPSC (eIPSC).
Excitatory synaptic transmission.
Whole-cell patch recordings were obtained in ASCF supplemented with picrotoxin (PTX) (100 μm) to block GABAA receptors. Glass electrodes were filled with an internal solution containing the following (in mm): 150 Cs-gluconate, 8 NaCl, 2 MgATP, 10 HEPES, 0.2 EGTA, 0.1 spermine, and 5 QX-314, pH 7.2. Ratios of AMPA to NMDA currents in CA1 pyramidal cells were obtained by evoking AMPA eEPSCs at −70 mV and NMDA eEPSC at +40 mV, the current being taken 70 ms after stimulus. Paired-pulse facilitation was determined as the ratio of the AMPA EPSC of the second pulse to the AMPA EPSC of the first pulse with an interstimulus interval of 40 ms.
Miniature EPSCs (mEPSCs) were recorded at −70 mV in ACSF supplemented with of TTX (0.2 μm), PTX (100 μm), and trichiormethiazide (250 μm) to increase mEPSC frequency.
Inhibitory synaptic transmission.
IPSCs were recorded at −70 mV holding potential using a high chloride internal solution containing the following (in mm): 90 CsCl, 20 Cs-gluconate, 8 NaCl, 2 MgCl2, 10 HEPES, 1 EGTA, and 2 QX-314, pH 7.2 (290 mOsm/L). Spontaneous IPSCs (sIPSCs) were recorded in ASCF supplemented with NBQX (10 μm) to block AMPA receptors. To isolate mIPSC, ACSF was additionally supplemented with TTX (0.2 μm) to block action potentials. IPSCs were evoked with a stimulation electrode placed 100 μm away from the soma of the recorded cell. The position of the stimulation electrode was adjusted such that the smallest stimulus (5 pA) elicited a current smaller than 40 pA. Paired-pulse ratio (PPR) was determined as the ratio of the IPSC amplitude of the second pulse to the IPSC amplitude of the first pulse with an interstimulus interval of 50 ms.
Current-clamp recordings.
Pipette solutions contained the following (in mm): 150 K-methylsulphonate, 4 KCl, 4 NaCl, 4 MgATP, 0.4 Mg GTP, and 10 HEPES. AP threshold was determined using the first derivative of single APs. For input/output (I/O) functions, a series of EPSPs were evoked at various stimulus intensities covering a range from subthreshold to supramaximal. EPSP slopes were measured between 20 and 80% of the peak. I/O functions were generated by binning the EPSP slopes and plotting the bin center against the percentage of successful action potentials in the respective bin. Data was fitted with an asymmetric sigmoid function: Y = (1/(1 + exp((EC50 + (1/Hill slope) * log((2^(1/S)) − 1) − X) * Hill slope))^S). The threshold, the EPSP slope that yields an AP 50% of the times, was defined as the EC50 value of this fit (threshold). The gain was determined as the Hill slope.
Biocytin staining.
For interneuron identification, intracellular solution was supplemented with biocytin (0.2%; Invitrogen). To morphologically characterize biocytin-filled neurons, slices were fixed in 4% paraformaldehyde, in 0.1 m PBS, pH 7.3, for at least 30 min at room temperature. After washing with PBS (three times for 10 min), endogenous peroxidase was blocked by 3% H2O2 for 15 min. After additional washing with PBS (five times for 10 min), cell membranes were permeabilized in 0.4% Triton X-100 in 0.1 m PBS. Subsequently, slices were incubated with avidin and biotinylated horseradish peroxidase macromolecular complex (Vectastain ABC reagent; Vector Laboratories) overnight at 4°C. Afterward, slices were washed with PBS (five times for 10 min) and then incubated in 0.7 mg/ml 0.1 m PBS–diaminobenzidine (Serva Electrophoresis) at room temperature in the dark. After 25 min preincubation, 0.03% H2O2 was added, resulting in a brown reaction product. Slices were again washed (five times for 10 min in PBS and one time for 10 min in dH2O), and embedded in Mowiol 4–88 mounting medium (Roth).
Data analysis.
All data were analyzed using Clampfit 10.2 (Molecular Devices), Prism 5 (GraphPad Software), and Matlab (MathWorks). mEPSCs, sIPSCs, and mIPSCs were analyzed offline with customized software using a threshold of 5 pA (mEPSCs) and 15 pA (mIPSCs/sIPSCs). Data are presented as means ± SEM. Differences between groups were tested using the Student's t test (when normally distributed), the Mann–Whitney test (when not normally distributed), or the Kolmogorov–Smirnov (K–S) test, as indicated. p values are reported in the text, and significance was set as p < 0.05. For the Kolmogorov–Smirnov test, the significance level was 0.01. In figures, *p < 0.05, **p < 0.01, and ***p < 0.001. n represents the number of cells examined. For mini-analysis, histograms were derived from 150–200 events per cell. Averaged cumulative distributions were calculated from normalized histograms. Because the K–S test is only appropriate for testing data against a continuous distribution, 25 events were randomly chosen from each cell, and a continuous cumulative probability functions was calculated from these events.
Results
CA1 neurons show ClC-2-mediated currents
We first characterized the properties of the hyperpolarization-activated chloride current in CA1 pyramidal neurons. ClC-2 currents were isolated by blocking potassium and sodium conductances. The currents obtained showed the characteristic slow activation at negative membrane potentials and a pronounced inward rectification. Wash in of 50 μm ZD7288 had no effect on the slowly developing inward current, excluding the possibility that the obtained currents are mediated by Ih [wild type (WT), 556 ± 50 pA; ZD7288, 595 ± 44 pA; n = 9, p < 0.05, t test] (Fig. 1A). When heterologously expressed in Xenopus oocytes, ClC-2 is activated by acidic extracellular pH (Jordt and Jentsch, 1997) and, in contrast to non-CLC chloride channels, has a lower permeability for iodide than for chloride (Thiemann et al., 1992). Both of these properties are conserved in the currents obtained from CA1 pyramidal cells. Lowering the extracellular pH from 7.2 to 6.5 increased ClC-2 currents by 64% (pH 7.2, 783 ± 132 pA; pH 6.5, 1285 ± 115 pA; n = 7, p < 0.05, t test) (Fig. 1B). Substituting the extracellular anion chloride with iodide reduced ClC-2 currents to 33% (Cl−, 812 ± 146 pA; I−, 269 ± 78 pA; n = 8, p < 0.05, t test) (Fig. 1C). In the absence of specific ClC-2 antagonists, we recorded from CA1 neurons of ClC-2 KO (Clcn2−/−) animals. Under the same conditions, we did not observe a voltage-gated chloride current (KO, 11 ± 2 pA; n = 23) (Fig. 1D,E). These data clearly show that the observed chloride conductance is mediated by ClC-2 and allowed us to use Clcn2−/− animals to study the function of ClC-2 in neurons.
Does ClC-2 assist chloride extrusion?
One of the proposed functions of ClC-2 is a role in rapid extrusion of chloride after GABAA receptor activation (Smith et al., 1995; Staley et al., 1996). ClC-2 is an inwardly rectifying chloride conductance (Thiemann et al., 1992) that activates at membrane potentials more negative than ECl, so that chloride can flow out but not in through ClC-2 (Staley, 1994; Smith et al., 1995). Because the conductance of ClC-2 is large and does not display time-dependent inactivation, it is well suited to stabilize ECl near resting membrane potential (Staley et al., 1996).
To test whether chloride is extruded via ClC-2 under conditions of high [Cl−]i, we measured outward chloride transport by transiently elevating [Cl−]i and monitoring as it returned to baseline (Brumback and Staley, 2008). Briefly, the cell was clamped to resting membrane potential using a low chloride intracellular solution. After recording an outward baseline response by pressure applying GABA to the dendrite, the cell was depolarized to −15 mV for 6 s. During this depolarization, another GABA application caused a large chloride influx, thereby increasing [Cl−]i in the small compartment of the dendrite. To measure chloride transport, we stepped the membrane voltage back to resting membrane potential and pressure applied GABA. Shortly after loading, when [Cl−]i is high, the test currents showed a strong chloride efflux (inward current), indicating the successful loading of the cell. We repeated this seven times with increasing delays between the loading and test application (illustration of experimental protocol shown in Fig. 2A). GABA-evoked currents returned more slowly toward baseline in Clcn2−/− animals compared with WT (Clcn2+/+) (Fig. 2B,C). To quantify the time course of chloride extrusion, charges of GABA-evoked currents were normalized to the absolute sum of the baseline and the first test pulse. Fitting the time courses with a monoexponential function show a significant difference in the decay kinetics (WT, τ = 1.8 s, n = 13; KO, τ = 2.9 s, n = 11; p < 0.0001, Mann–Whitney test) (Fig. 2C).
It has been reported that repetitive activation of GABAA receptors reduces IPSC amplitude, at least in part as a result of chloride accumulation (McCarren and Alger, 1985; Huguenard and Alger, 1986; Thompson and Gähwiler, 1989; Ling and Benardo, 1995). If ClC-2 quickly extrudes chloride, chloride should accumulate more strongly in cells lacking ClC-2 after synaptic activation of GABAA receptors, leading to a greater reduction of IPSC amplitudes (Fig. 2D–F). We tested this by synaptically evoking IPSCs at 0.5, 1, 2, and 5 Hz, while cells were clamped at −70 mV with a low chloride internal solution. Indeed, at 0.5 and 1 Hz, IPSC amplitudes were significantly decreased in KO animals (0.5 Hz: WT, 29.8 ± 4.7%, n = 11; KO, 41.1 ± 2.1%, n = 14, p < 0.05; 1 Hz: WT, 35.5 ± 3.9%, n = 15; KO, 49.8 ± 2.8%, n = 14, p < 0.01, t test) (Fig. 2D–F). At higher frequencies, we did not observe significant differences between WT and KO (2 Hz: WT, 42.4 ± 3.5%, n = 14; KO, 48.9 ± 4.3%, n = 15, p > 0.05; 5 Hz: WT, 58.1 ± 4.0%, n = 8; KO, 57.5 ± 4.9%, n = 9, p > 0.05, t test), consistent with the idea that the reduction of presynaptic release is the main cause for the depression at higher frequencies (Ling and Benardo, 1995). These experiments demonstrate that ClC-2 accelerates chloride extrusion if the cell is strongly loaded with chloride.
ClC-2-mediated currents are not seen at early postnatal ages
In the early stages of development, ECl is positive relative to the resting membrane potential and GABA acts as an excitatory neurotransmitter (Obata et al., 1978). In hippocampal pyramidal cells, GABAergic responses undergo a switch from excitatory to inhibitory during the first postnatal week (Stein et al., 2004). This process is primarily mediated by the differential upregulation and downregulation of the cation-chloride cotransporters KCC2 and NKCC1 (Na–K–2Cl cotransporter). To investigate whether ClC-2 is functional during this period, we recorded chloride currents at P1, P5, P8, P10, and P15 from WT CA1 pyramidal cells (Fig. 3A,B). Functional ClC-2 expression could only be observed from P8 onward. At P10, it reached levels indistinguishable from later time points (P1, 4 ± 3 pA, n = 13; P5, 3 ± 2 pA, n = 20; P8, 60 ± 14 pA, n = 18; P10, 797 ± 76 pA, n = 21; P15, 648 ± 74 pA, n = 33, ANOVA). This functional expression profile parallels the switch from high to low intracellular chloride (Stein et al., 2004), compatible with the idea of providing an efflux pathway for chloride that assists chloride extrusion.
Figure 3.

ClC-2-mediated currents are not seen at early postnatal ages. A, Sample traces of ClC-2 currents at P1 (left), P8 (middle), and P10 (right). B, Average currents at different postnatal stage. No currents were observed at P1 and P5. After P10, the amplitude does not significantly change.
ClC-2 constitutes a substantial part of the background conductance
Because ClC-2 is active at resting membrane potential, it could contribute to the background conductance and affect the membrane resistance (Madison et al., 1986). This would directly influence the excitability of the neuron. In current-clamp recordings (Fig. 4A), we observed a strong increase in membrane resistance in KO animals (WT, 160 ± 10 MΩ, n = 17; KO, 286 ± 15 MΩ, n = 16; p < 0.0001, t test) (Fig. 4B). In addition, the voltage difference between resting membrane potential and action potential threshold was significantly decreased in Clcn2−/− animals (WT, 27.7 ± 1.3 mV, n = 17; KO, 20.1 ± 1.0 mV, n = 16; p < 0.0001, t test). In turn, the same current injected elicited more action potentials (Fig. 4A,B). In contrast to the potassium leak conductance, loss of ClC-2 did not significantly alter the resting membrane potential (WT, −77.8 ± 1.0 mV, n = 17; KO, −75.4 ± 1.1 mV, n = 16; p > 0.05, t test), possibly because ECl is close to resting membrane potential (Tyzio et al., 2008). Furthermore, the sag ratio (WT, 0.7 ± 0.1, n = 17; KO, 0.8 ± 0.1, n = 16; p > 0.05, t test) were not different between genotypes. These data clearly show that ClC-2 constitutes a significant part of the background conductance. The loss of ClC-2 leads to an increase of the input resistance, thereby increasing the excitability of the neuron.
Figure 4.

Intrinsic membrane properties of Clcn2−/− pyramidal neurons are altered. A, Sample traces of current-clamp recordings. Inset shows the current step protocol, and the same colors indicate same injected currents: dark blue, −100 pA; green, −50 pA; red, 0 pA; light blue, 25 pA; magenta, 50 pA; yellow, 75 pA. Calibration (for inset): 250 ms, 25 pA. B, Comparison of input resistance (left), AP threshold (middle), and number of APs generated at various current injections (right). Filled symbols represent WT, and open symbols represent KO. Error bars represent SEM in all graphs.
Network gain is reduced in fEPSP recordings
The strong effects on input resistance should lead to a higher excitability of the hippocampal network and possibly seizures. In contrast, epilepsy or higher seizure susceptibility has not been observed in Clcn2−/− mice (Bösl et al., 2001; Nehrke et al., 2002; Blanz et al., 2007). One possible explanation is a reduction of synaptic transmission, which would compensate for the increased excitability of the postsynaptic neuron. Therefore, we tested basal synaptic transmission with extracellular field recordings, because these do not affect [Cl−]i. In addition, extracellular recordings are well suited to determine the network properties, because the signals are sampled from many neurons, including interneurons. Here we compared the size of the presynaptic fiber volley (input) with the slope of the field EPSP (output) in stratum radiatum. Much to our surprise, the slope of the I/O curve (network gain) of synaptic transmission was strongly reduced in Clcn2−/− animals (Fig. 5A,C). In contrast, no difference between WT and KO was observed in the presence of PTX (Fig. 5B,D). These data suggest that loss of ClC-2 leads to a change in the inhibitory microcircuit of the CA1.
Figure 5.

Network gain is reduced in ClC-2 KO animals. A, B, Sample traces of extracellular field recordings for WT and KO in the absence (A) and presence (B) of picrotoxin. C, Input/output curve for basal synaptic transmission in hippocampal slices from WT (filled symbols) and KO (open symbols) mice. fEPSPs were recorded at a range of stimulus intensities from CA1 stratum radiatum. fEPSP slopes in the knock-out mice are significantly smaller than from WT mice at every fiber volley (FV) amplitude. D, Input/output curve in the presence of picrotoxin to block inhibition showed no significant differences between WT and KO. The slope of the I/O curve is increased compared with conditions without PTX for both WT and KO. Error bars represent SEM in all graphs. Note that symbol size might occlude error bars.
Excitatory synaptic transmission is not impaired in Clcn2−/− animals
To exclude changes in excitatory synaptic transmission as a cause for the reduced network gain, we studied basal synaptic transmission in more detail using whole-cell patch-clamp recordings. During these recordings, we noted that reduced membrane resistance resulted in significantly smaller holding current in KO cells than in WT cells (data not shown). First, we compared the AMPA receptor and NMDA receptor components of EPSCs (Fig. 6A). The AMPA/NMDA ratio was not altered (WT, 1.8 ± 0.2, n = 22; KO, 1.9 ± 0.2, n = 25; p > 0.05, Mann–Whitney test). Second, the PPR, a measure of changes in the probability of transmitter release, was unchanged (WT, 2.1 ± 0.1, n = 16; KO, 2.1 ± 0.1, n = 24; p > 0.05, Mann–Whitney test) (Fig. 6B). Additionally, we compared mEPSCs in Clcn2+/+ and Clcn2−/− mice to exclude changes in synapse number and synaptic receptor density (Fig. 6C,D). Neither mEPSC amplitude nor frequency was changed (mean mEPSC amplitude: WT, 18.5 ± 1.3 pA, n = 18; KO, 19.9 ± 1.1 pA, n = 18, p = 1; mean mEPSC frequency: WT, 1.5 ± 0.1 Hz, n = 18; KO, 1.5 ± 0.1 Hz, n = 18, p = 1, K–S test). Together, we did not observed any difference in basal excitatory synaptic transmission between WT and KO animals, excluding a change of excitatory synapse function in KO animals as a cause for the reduction in network gain.
Figure 6.
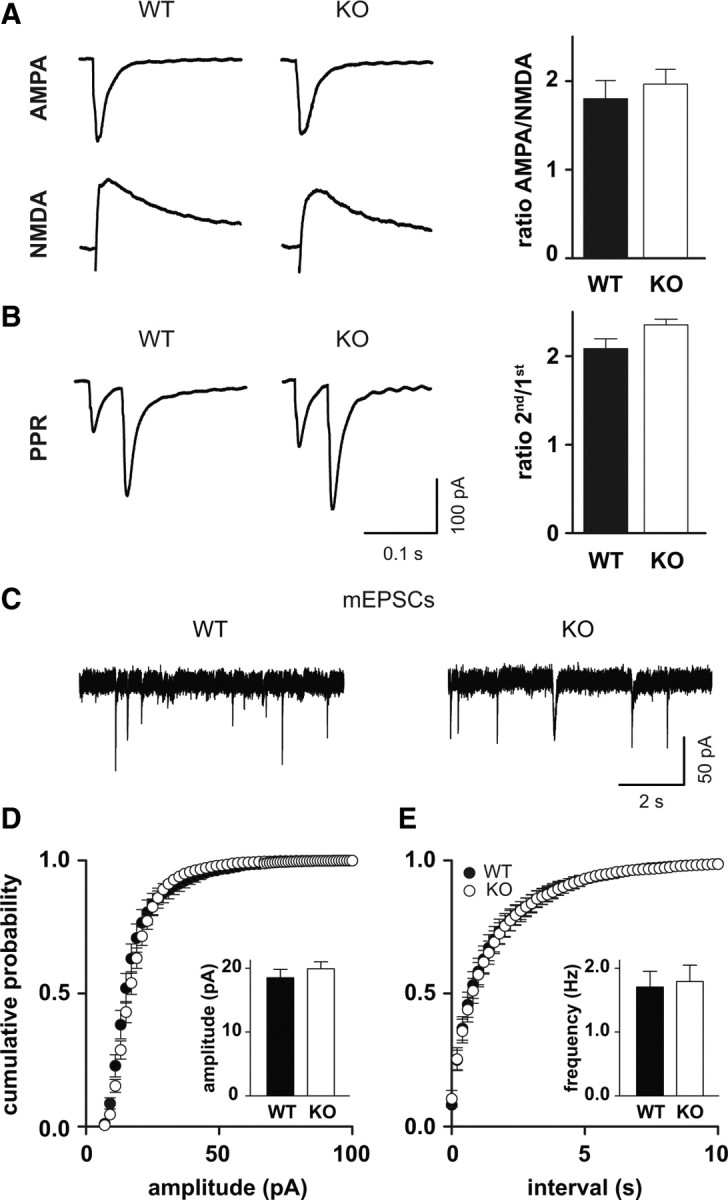
Excitatory synaptic transmission is not altered in Clcn2−/− mice. A, Ratio of AMPA to NMDA currents is not altered. Sample traces are shown at the left. AMPA currents were recorded at −70 mV, and NMDA currents were determined at +40 mV, 70 ms after the stimulus. B, PPR, a measure for presynaptic release, shows no difference between WT and KO. Sample traces are shown on the left. Stimulus artifacts have been omitted for clarity. Calibration is the same in A and B. C, Sample traces for mEPSC recordings for WT (left) and KO (right). D, Cumulative frequency distribution of mEPSC amplitudes (p = 1, Kolmogorov–Smirnov test; n = 18 for WT; n = 18 for KO). E, Cumulative frequency distribution of mEPSC frequencies (p = 1, Kolmogorov–Smirnov test; n = 18 for WT; n = 18 for KO). Error bars represent SEM in all graphs.
GABAergic inhibition is increased in Clcn2−/− mice
Because I/O curves did not differ between WT and KO in the presence of picrotoxin (Fig. 5D), we studied inhibitory synaptic transmission in more detail. Inhibitory interneurons and pyramidal neurons form microcircuits in the hippocampus. Feedforward inhibition is provided by excitatory inputs that activate both pyramidal cells and inhibitory interneurons (see Fig. 8B). Sík et al. (2000) suggested by immunostaining that ClC-2 is expressed in a small subset of interneurons. Therefore, we tested whether interneurons show ClC-2-mediated currents. A typical ClC-2 current was detected in a subset of randomly selected interneurons (11 of 33 neurons; average current, 114 ± 17 pA, n = 11) morphologically identified by biocytin filling (Fig. 7A). No ClC-2-mediated current was seen in 22 interneurons of Clcn2−/− animals (data not shown). The large variety of interneuron types (Klausberger and Somogyi, 2008) precluded us from a more detailed analysis of interneuron membrane properties. However, if the increased GABAergic inhibition results from more excitable interneurons, evoking IPSCs should be easier in KO than in WT. I/O curves for IPSCs revealed that IPSCs were significantly increased over a range of stimulus intensities (Fig. 7B,C). Only at the highest stimulus intensity was this difference not significant, consistent with the idea that the upper limit of IPSC amplitude is reached when action potentials are evoked in all recruitable interneurons (0.05 μA: WT, −12 ± 3 pA, n = 10; KO, −12 ± 6 pA, n = 9, p > 0.9; 0.1 μA: WT, −97 ± 20 pA, n = 10; KO, −286 ± 58 pA, n = 9, p < 0.005; 0.02 μA: WT, −416 ± 77 pA, n = 10; KO, −720 ± 101 pA, n = 9, p < 0.05; 0.3 μA: WT, −694 ± 95 pA, n = 10; KO, −1024 ± 124 pA, n = 9, p < 0.05; 0.5 μA: WT, −939 ± 166 pA, n = 8; KO, 1152 ± 158 pA, n = 7, p > 0.4, t test) (Fig. 7B,C). In addition, a higher excitability of inhibitory neurons should lead to an increased rate of action potential firing reflected in an increased fraction of action potential-dependent sIPSCs. If our idea is correct, the average sIPSC amplitude should be increased, because the amplitudes of action potential-dependent sIPSCs are bigger than the amplitudes of action potential-independent mIPSCs. To test this hypothesis, we measured action potential-dependent sIPSCs (Fig. 7E–G). Indeed, the mean amplitude of these events was significantly increased (WT, 46 ± 4 pA, n = 24; KO, 65 ± 5 pA, n = 24; p < 0.001, K–S test) (Fig. 7F). The frequency of events was not changed (WT, 5.5 ± 0.5 Hz, n = 24; KO, 5.5 ± 0.5 Hz, n = 24; p = 1, K–S test) (Fig. 7G). To exclude changes in the number of postsynaptic receptors and number of synapses, we recorded mIPSCs (Fig. 7H–J). We did not detect any difference in mIPSC amplitude (Fig. 7I) and mIPSC frequency (Fig. 7J) between the two genotypes (amplitude: WT, 57 ± 3 pA, n = 22; KO, 58 ± 2 pA, n = 23, p = 1; frequency: WT, 5.6 ± 0.4 Hz, n = 22; KO, 4.9 ± 0.4 Hz, n = 23, p = 1, K–S test). In addition, we recorded the PPR of two evoked IPSCs to exclude changes in presynaptic release. We did not detect a difference in PPR between WT and KO, demonstrating that presynaptic release was not affected by the loss of ClC-2 (WT, 1.0 ± 0.1, n = 12; KO, 1.0 ± 0.1, n = 12; p > 0.4, Mann–Whitney test) (Fig. 7D).
Figure 8.
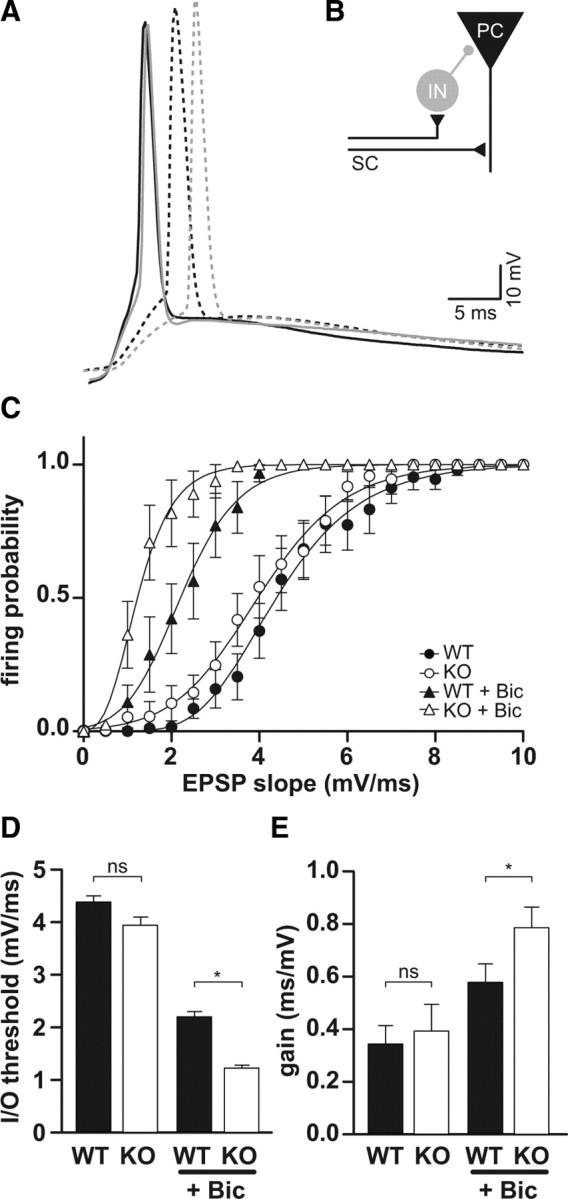
Feedforward inhibition is increased in Clcn2−/− animals. A, Sample traces of evoked EPSP in WT (black) and KO (gray) CA1 neurons in the absence (solid) and presence of bicuculline (dashed). B, Schematic diagram of disynaptic feedforward inhibition. SC, Schaffer collateral; IN, interneuron; PC, pyramidal cell. C, Neuronal I/O function. Firing probability plotted against the EPSP slope in the absence (circles) and presence (triangles) of bicuculline (Bic) for WT (filled symbols) and KO (open symbols). In the absence of bicuculline, I/O functions for WT and KO were not significantly different (n = 16 for WT; n = 16 for KO), whereas in the presence of bicuculline, the I/O function for KO was shifted more to the left relative to WT and had a steeper slope. D, E, Average gain and threshold for I/O functions shown in C. Error bars represent SEM in all graphs.
Figure 7.

Loss of ClC-2 in interneurons leads to an increased inhibition. A, ClC-2 is expressed in a subset of interneurons. Sample trace of a ClC-2 current from an interneuron identified by biocytin filling. B, C, Evoked IPSCs were measured as a function of the stimulus strength in CA1 pyramidal cells in response to extracellular stimulation by a microelectrode positioned nearby. Sample traces for WT (left) and KO (right) (B). Averaged data reveal an increase of IPSCs (C). D, Paired-pulse ratio, a measure for presynaptic release, shows no difference between WT and KO. Sample traces on the left. Stimulus artifacts have been omitted for clarity. E, Sample traces of sIPSC recordings for WT (left) and KO (right). F, Cumulative frequency distribution of sIPSC amplitudes (p < 0.001, Kolmogorov–Smirnov test; n = 24 for WT; n = 24 for KO). Inset shows mean amplitude. G, Cumulative frequency distribution of sIPSC frequencies (p = 1, Kolmogorov–Smirnov test; n = 18 for WT; n = 18 for KO). Inset shows mean frequency. H, Sample traces for mIPSC recordings for WT (left) and KO (right). I, Cumulative frequency distribution of mIPSC amplitudes (p = 1, Kolmogorov–Smirnov test; n = 22 for WT; n = 23 for KO). Inset shows mean amplitude. J, Cumulative frequency distribution of mIPSC frequencies (p = 1, Kolmogorov–Smirnov test; n = 22 for WT; n = 23 for KO). Inset shows mean frequency. Error bars represent SEM in all graphs.
Together, the I/O curve of evoked IPSC and the increase in sIPSC amplitude indicate that more excitable interneurons are the cause for the increased inhibition. In addition, we can exclude increased presynaptic release.
I/O function is changed in Clcn2−/− mice
To further study this idea of increased inhibition, we examined the I/O characteristic of CA1 pyramidal cells. We use the term neuronal I/O function to refer to the relationship between the excitatory input to a neuron and the probability it will generate an AP (Daoudal and Debanne, 2003; Marder and Buonomano, 2003; Staff and Spruston, 2003). The I/O curve of a neuron, generally represented as a sigmoidal function, is characterized by two components: the threshold and the gain. Here, we define the I/O threshold as the EPSP slope that elicits a spike 50% of the time. The gain refers to the slope of the I/O function (Carvalho and Buonomano, 2009). Carvalho and Buonomano (2009) recently described a model predicting that threshold and gain of the I/O function can be independently controlled by changes in excitatory and/or inhibitory synaptic inputs. More specifically, increased excitation shifts the threshold of the I/O function to the left, whereas increased inhibition shifts the threshold to the right and additionally decreases gain of the I/O function. We recorded EPSPs at various stimulus intensities and plotted the probability of generating an AP against the slope of the EPSP (Fig. 8C). Typical traces at stimulus intensities around the threshold are presented in Figure 8A. If our idea of increased inhibition in KO mice is correct, we should see only a small difference in the I/O function of WT and KO in the absence of bicuculline, a GABAA receptor antagonist, but a stronger difference between WT and KO in the presence of bicuculline. Indeed, in the absence of bicuculline, the threshold between KO and WT was not significantly different. In the presence of bicuculline, the I/O function for KO neurons shifted significantly more to the left, reflecting a change in threshold (ΔWT, 2.2 ± 0.1, n = 16; ΔKO, 2.8 ± 0.1, n = 16; p < 0.05) (Fig. 8D,E). Compatible with the prediction by the model, the slope was also increased more in KO than in WT cells (ΔWT, 0.6 ± 0.1, n = 16; ΔKO, 0.8 ± 0.1, n = 16; p < 0.05) (Fig. 8A,C,E). These data clearly indicate that inhibition is strongly increased in Clcn2−/− animals.
Discussion
Our data clearly prove that ClC-2 mediates a previously described chloride conductance (Chesnoy-Marchais, 1983; Madison et al., 1986; Smith et al., 1995) in CA1 pyramidal cells and a subset of interneurons. In addition to the absence of this conductance in Clcn2−/− neurons, we observed the same biophysical properties described in heterologous expression systems such as activation by acidic pH (Jordt and Jentsch, 1997) and a higher permeability for chloride than for iodide (Thiemann et al., 1992).
We used KO mice to test whether ClC-2 is involved in chloride extrusion and whether the loss of ClC-2 leads to a higher excitability. We directly demonstrated that the voltage-gated chloride channel ClC-2 helps to quickly extrude chloride from neurons after chloride accumulation. More importantly, we revealed that ClC-2 contributes substantially to the background conductance, which has a strong effect on neuronal excitability by changing the input resistance. Surprisingly, fEPSP I/O curves are reduced in Clcn2−/− mice. Our data demonstrate that this reduction is caused by an increased activity of a subset of GABAergic interneurons, which thereby decrease activity of excitatory pyramidal cells. This inhibition increase might balance over excitability and thereby prevent seizures in Clcn2−/− mice.
Chloride extrusion
The inhibitory effect of GABA depends on the intracellular chloride concentration, which can be changed by several transporters that couple the movement of chloride across the membrane to that of potassium, sodium, or bicarbonate. The resulting chloride gradient, which is mainly established by NKCC1 and KCC2, determines the response of a particular neuron to GABA. Importantly, however, an inhibitory outcome does not require the chloride reversal potential to be more negative than the resting membrane potential, because a major component of inhibition is mediated by shunting (Bartos et al., 2007). It has been proposed that ClC-2 plays a role in chloride homeostasis (Staley, 1994; Staley et al., 1996; Mladinić et al., 1999; Ben-Ari, 2002); however, the extrusion of chloride was thus far only indirectly shown. Here we provide direct evidence that ClC-2 mediates an efflux pathway for chloride in CA1 neurons, which normally have a low [Cl−]i. After strongly loading neurons with chloride, by pressure applying GABA during depolarization, [Cl−]i returned to initial values more slowly in KO than in WT animals. In addition, we analyzed whether repetitive synaptic activation of GABAA receptors leads to a stronger chloride accumulation in KO animals. At frequencies of 0.5 and 1 Hz, evoked IPSCs were more depressed in KO than WT animals, indicating a stronger chloride accumulation. These data clearly emphasize that ClC-2 is involved in chloride homeostasis. However, the complex nature of the interplay of chloride reversal potential, shunting inhibition, and action potential threshold makes it difficult to predict whether the loss of chloride extrusion via ClC-2 results in a substantial loss of GABAergic inhibition. The effect on chloride extrusion might be more relevant under conditions of high neuronal activity, and the loss of ClC-2 might thereby increase the susceptibility to seizures.
Remarkably, typical ClC-2 currents were not seen during the first postnatal week in CA1 pyramidal cells. This functional expression profile parallels the switch from high to low intracellular chloride (Stein et al., 2004), compatible with the idea of providing an efflux pathway for chloride, which assists chloride homeostasis.
ClC-2 contributes to the background conductance
Background (or leak) conductances are important in determining membrane resting potential and input resistance, both key components of neuronal excitability. Some of the leak conductance is mediated by the family of two pore potassium channels, which are voltage insensitive, but tightly regulated by cyclic nucleotides, noradrenaline, serotonin, pH, and GABA (for review, see Goldstein et al., 2001; Honoré, 2007). Mouse models suggest that some of these channels are involved in neurological diseases such as epilepsy and depression (Honoré, 2007). Although two pore potassium channels are primarily voltage independent, ClC-2 opening depends on hyperpolarized membrane potentials; however, because ClC-2 closes only very slowly with depolarization, it practically does not close during the brief depolarization of an AP. Thus, the remarkable effect on membrane resistance further indicates that ClC-2 is conductive at resting conditions similar to other channels contributing to the background conductance.
Although the information on the subcellular localization of ClC-2 is limited, Sík et al. (2000) localized ClC-2 to perinuclear regions and apical dendrites in CA1 neurons. This localization is complementary with our data, demonstrating that ClC-2 contributes strongly to the leak conductance, more specifically the input resistance, thereby affecting neuronal excitability; however, because the chloride reversal potential is close to the resting membrane potential (Tyzio et al., 2008), the loss of ClC-2 does not affect the resting membrane potential. It is tempting to speculate that modulating ClC-2 by neuronal activity changing extracellular pH or the activity of PKC could regulate neuronal excitability.
Increased inhibition
Surprisingly, the network gain is reduced in Clcn2−/− mice. Generally, a decrease in fEPSP I/O curves reflects a change in excitatory synaptic transmission. However, when we repeated the fEPSP recordings in the presence of picrotoxin blocking GABAergic inhibition, we did not observe any difference between the two genotypes. Because AMPA/NMDA ratios, paired-pulse facilitation, and mEPSCs could not account for this reduction, we excluded a change in excitatory synaptic transmission. The fEPSP I/O curves recorded in the presence of picrotoxin suggested a change in GABAergic inhibition. A subset of interneurons showed ClC-2-mediated currents; however, the large variety of interneuron subtypes did not allow for a specific characterization of membrane properties of these neurons. We showed that evoked IPSCs are bigger in Clcn2−/− animals over a range of stimulus intensities. In addition, the increase in the amplitude of action potential-dependent sIPSCs further supports the idea of more excitable interneurons. We did not find a change in the frequency of sIPSCs, as one could have expected, but, because only a subset of interneurons expresses ClC-2, a change in sIPSC frequency might not be detectable. Because mIPSC amplitude and frequency, as well as PPR, of evoked IPSCs were not altered, we can exclude a change in number of postsynaptic GABAA receptors, inhibitory synapse number, and probability of release as cause for the increased inhibition.
In a final set of recordings, we revealed that the I/O function of the neuron is not altered in Clcn2−/− mice compared with Clcn2+/+ mice. In contrast, in the presence of bicuculline, the threshold of neurons of Clcn2−/− mice was shifted more to the left and had a bigger gain than in Clcn2+/+ mice.
Together, these experiments confirm that the loss of ClC-2 leads to an increase in neuronal inhibition in KO animals.
ClC-2 and epilepsy
Whether mutations in ClC-2 cause epilepsy or not has been controversial. Over the past years, several mutations in the gene encoding for ClC-2 have been described (Stogmann et al., 2006; Everett et al., 2007; Combi et al., 2009; Saint-Martin et al., 2009); however, the study by Haug et al. (2009), which established the link between mutations in CLCN2 and epilepsy, has recently been retracted. Moreover, mutations found in humans do not lead to drastic changes in biophysical properties of ClC-2 (Blanz et al., 2007), as one might expect for a single disease-causing gene. In contrast, the complete loss of ClC-2 in mice did not lead to higher seizure susceptibility (Bösl et al., 2001; Blanz et al., 2007). In addition, as discussed above, it is difficult to predict whether the loss of chloride extrusion via ClC-2 results in a substantial loss of GABAergic inhibition under prolonged paroxysmal conditions that could lead to hyperexcitability. Therefore, the loss of ClC-2 might increase the susceptibility of seizures by impairing inhibition. Moreover, we cannot exclude that mutated ClC-2 proteins are trafficked differently or the interactions with other proteins are disturbed affecting the function of ClC-2.
Summary and outlook
This work revealed an important role of ClC-2 in neuronal excitability. ClC-2 is not only expressed in pyramidal neurons but also in a subset of inhibitory interneurons. The loss of ClC-2 in interneurons increases inhibition mediated by a higher excitability of a subpopulation of interneurons. The increased inhibition might balance hyperexcitability of the network, thereby preventing epilepsy in ClC-2 knock-out mice. Together, we suggest that ClC-2 in neurons regulates excitability via the membrane resistance and provides an additional efflux pathway for chloride. The effects on membrane resistance pose the question whether ClC-2 is regulated by neuronal activity, for example, by changing extracellular pH or PKC activity, thereby regulating neuronal excitability.
Footnotes
This study was supported by Deutsche Forschungsgemeinschaft Grant STE 1062/2-1. We are grateful to N. Meyer for technical assistance and Thorben Kurz for the help with reconstructing biocytin filled interneurons. We thank Thomas J. Jentsch for generously making ClC-2 knock-out mice available, C. Leibold and A. Tzingounis for helpful discussions, and Tara Keck for critical comments on this manuscript.
References
- Bartos M, Vida I, Jonas P. Synaptic mechanisms of synchronized gamma oscillations in inhibitory interneuron networks. Nat Rev Neurosci. 2007;8:45–56. doi: 10.1038/nrn2044. [DOI] [PubMed] [Google Scholar]
- Ben-Ari Y. Excitatory actions of gaba during development: the nature of the nurture. Nat Rev Neurosci. 2002;3:728–739. doi: 10.1038/nrn920. [DOI] [PubMed] [Google Scholar]
- Blanz J, Schweizer M, Auberson M, Maier H, Muenscher A, Hübner CA, Jentsch TJ. Leukoencephalopathy upon disruption of the chloride channel ClC-2. J Neurosci. 2007;27:6581–6589. doi: 10.1523/JNEUROSCI.0338-07.2007. [DOI] [PMC free article] [PubMed] [Google Scholar]
- Bösl MR, Stein V, Hübner C, Zdebik AA, Jordt SE, Mukhopadhyay AK, Davidoff MS, Holstein AF, Jentsch TJ. Male germ cells and photoreceptors, both dependent on close cell-cell interactions, degenerate upon ClC-2 Cl(−) channel disruption. EMBO J. 2001;20:1289–1299. doi: 10.1093/emboj/20.6.1289. [DOI] [PMC free article] [PubMed] [Google Scholar]
- Brumback AC, Staley KJ. Thermodynamic regulation of NKCC1-mediated Cl− cotransport underlies plasticity of GABAA signaling in neonatal neurons. J Neurosci. 2008;28:1301–1312. doi: 10.1523/JNEUROSCI.3378-07.2008. [DOI] [PMC free article] [PubMed] [Google Scholar]
- Carvalho TP, Buonomano DV. Differential effects of excitatory and inhibitory plasticity on synaptically driven neuronal input-output functions. Neuron. 2009;61:774–785. doi: 10.1016/j.neuron.2009.01.013. [DOI] [PMC free article] [PubMed] [Google Scholar]
- Chenoy-Marchais D. A Cl− conductance activated by hyperpolarization in Aplysia neurones. Nature. 1982;299:359–361. doi: 10.1038/299359a0. [DOI] [PubMed] [Google Scholar]
- Chesnoy-Marchais D. Characterization of a chloride conductance activated by hyperpolarization in Aplysia neurones. J Physiol. 1983;342:277–308. doi: 10.1113/jphysiol.1983.sp014851. [DOI] [PMC free article] [PubMed] [Google Scholar]
- Combi R, Grioni D, Contri M, Redaelli S, Redaelli F, Bassi MT, Barisani D, Lavitrano ML, Tredici G, Tenchini ML, Bertolini M, Dalprà L. Clinical and genetic familial study of a large cohort of Italian children with idiopathic epilepsy. Brain Res Bull. 2009;79:89–96. doi: 10.1016/j.brainresbull.2009.01.008. [DOI] [PubMed] [Google Scholar]
- D'Agostino D, Bertelli M, Gallo S, Cecchin S, Albiero E, Garofalo PG, Gambardella A, St Hilaire JM, Kwiecinski H, Andermann E, Pandolfo M. Mutations and polymorphisms of the CLCN2 gene in idiopathic epilepsy. Neurology. 2004;63:1500–1502. doi: 10.1212/01.wnl.0000142093.94998.1a. [DOI] [PubMed] [Google Scholar]
- Daoudal G, Debanne D. Long-term plasticity of intrinsic excitability: learning rules and mechanisms. Learn Mem. 2003;10:456–465. doi: 10.1101/lm.64103. [DOI] [PubMed] [Google Scholar]
- Everett K, Chioza B, Aicardi J, Aschauer H, Brouwer O, Callenbach P, Covanis A, Dooley J, Dulac O, Durner M, Eeg-Olofsson O, Feucht M, Friis M, Guerrini R, Heils A, Kjeldsen M, Nabbout R, Sander T, Wirrell E, McKeigue P, Robinson R, Taske N, Gardiner M. Linkage and mutational analysis of CLCN2 in childhood absence epilepsy. Epilepsy Res. 2007;75:145–153. doi: 10.1016/j.eplepsyres.2007.05.004. [DOI] [PubMed] [Google Scholar]
- Goldstein SA, Bockenhauer D, O'Kelly I, Zilberberg N. Potassium leak channels and the KCNK family of two-P-domain subunits. Nat Rev Neurosci. 2001;2:175–184. doi: 10.1038/35058574. [DOI] [PubMed] [Google Scholar]
- Gründer S, Thiemann A, Pusch M, Jentsch TJ. Regions involved in the opening of CIC-2 chloride channel by voltage and cell volume. Nature. 1992;360:759–762. doi: 10.1038/360759a0. [DOI] [PubMed] [Google Scholar]
- Haug K, Warnstedt M, Alekov AK, Sander T, Ramírez A, Poser B, Maljevic S, Hebeisen S, Kubisch C, Rebstock J, Horvath S, Hallmann K, Dullinger JS, Rau B, Haverkamp F, Beyenburg S, Schulz H, Janz D, Giese B, Müller-Newen G, Propping P, Elger CE, Fahlke C, Lerche H. Retraction: Mutations in CLCN2 encoding a voltage-gated chloride channel are associated with idiopathic generalized epilepsies. Nat Genet. 2009;41:1043. doi: 10.1038/ng0909-1043. [DOI] [PubMed] [Google Scholar]
- Honoré E. The neuronal background K2P channels: focus on TREK1. Nat Rev Neurosci. 2007;8:251–261. doi: 10.1038/nrn2117. [DOI] [PubMed] [Google Scholar]
- Huguenard JR, Alger BE. Whole-cell voltage-clamp study of the fading of GABA-activated currents in acutely dissociated hippocampal neurons. J Neurophysiol. 1986;56:1–18. doi: 10.1152/jn.1986.56.1.1. [DOI] [PubMed] [Google Scholar]
- Jentsch TJ, Stein V, Weinreich F, Zdebik AA. Molecular structure and physiological function of chloride channels. Physiol Rev. 2002;82:503–568. doi: 10.1152/physrev.00029.2001. [DOI] [PubMed] [Google Scholar]
- Jordt SE, Jentsch TJ. Molecular dissection of gating in the ClC-2 chloride channel. EMBO J. 1997;16:1582–1592. doi: 10.1093/emboj/16.7.1582. [DOI] [PMC free article] [PubMed] [Google Scholar]
- Klausberger T, Somogyi P. Neuronal diversity and temporal dynamics: the unity of hippocampal circuit operations. Science. 2008;321:53–57. doi: 10.1126/science.1149381. [DOI] [PMC free article] [PubMed] [Google Scholar]
- Ling DS, Benardo LS. Activity-dependent depression of monosynaptic fast IPSCs in hippocampus: contributions from reductions in chloride driving force and conductance. Brain Res. 1995;670:142–146. doi: 10.1016/0006-8993(94)01298-v. [DOI] [PubMed] [Google Scholar]
- Madison DV, Malenka RC, Nicoll RA. Phorbol esters block a voltage-sensitive chloride current in hippocampal pyramidal cells. Nature. 1986;321:695–697. doi: 10.1038/321695a0. [DOI] [PubMed] [Google Scholar]
- Marder CP, Buonomano DV. Differential effects of short- and long-term potentiation on cell firing in the CA1 region of the hippocampus. J Neurosci. 2003;23:112–121. doi: 10.1523/JNEUROSCI.23-01-00112.2003. [DOI] [PMC free article] [PubMed] [Google Scholar]
- McCarren M, Alger BE. Use-dependent depression of IPSPs in rat hippocampal pyramidal cells in vitro. J Neurophysiol. 1985;53:557–571. doi: 10.1152/jn.1985.53.2.557. [DOI] [PubMed] [Google Scholar]
- Mladinić M, Becchetti A, Didelon F, Bradbury A, Cherubini E. Low expression of the ClC-2 chloride channel during postnatal development: a mechanism for the paradoxical depolarizing action of GABA and glycine in the hippocampus. Proc Biol Sci. 1999;266:1207–1213. doi: 10.1098/rspb.1999.0764. [DOI] [PMC free article] [PubMed] [Google Scholar]
- Nehrke K, Arreola J, Nguyen HV, Pilato J, Richardson L, Okunade G, Baggs R, Shull GE, Melvin JE. Loss of hyperpolarization-activated Cl− current in salivary acinar cells from Clcn2 knockout mice. J Biol Chem. 2002;277:23604–23611. doi: 10.1074/jbc.M202900200. [DOI] [PubMed] [Google Scholar]
- Obata K, Oide M, Tanaka H. Excitatory and inhibitory actions of GABA and glycine on embryonic chick spinal neurons in culture. Brain Res. 1978;144:179–184. doi: 10.1016/0006-8993(78)90447-x. [DOI] [PubMed] [Google Scholar]
- Saint-Martin C, Gauvain G, Teodorescu G, Gourfinkel-An I, Fedirko E, Weber YG, Maljevic S, Ernst JP, Garcia-Olivares J, Fahlke C, Nabbout R, LeGuern E, Lerche H, Poncer JC, Depienne C. Two novel CLCN2 mutations accelerating chloride channel deactivation are associated with idiopathic generalized epilepsy. Hum Mutat. 2009;30:397–405. doi: 10.1002/humu.20876. [DOI] [PubMed] [Google Scholar]
- Sík A, Smith RL, Freund TF. Distribution of chloride channel-2-immunoreactive neuronal and astrocytic processes in the hippocampus. Neuroscience. 2000;101:51–65. doi: 10.1016/s0306-4522(00)00360-2. [DOI] [PubMed] [Google Scholar]
- Smith RL, Clayton GH, Wilcox CL, Escudero KW, Staley KJ. Differential expression of an inwardly rectifying chloride conductance in rat brain neurons: a potential mechanism for cell-specific modulation of postsynaptic inhibition. J Neurosci. 1995;15:4057–4067. doi: 10.1523/JNEUROSCI.15-05-04057.1995. [DOI] [PMC free article] [PubMed] [Google Scholar]
- Staff NP, Spruston N. Intracellular correlate of EPSP-spike potentiation in CA1 pyramidal neurons is controlled by GABAergic modulation. Hippocampus. 2003;13:801–805. doi: 10.1002/hipo.10129. [DOI] [PubMed] [Google Scholar]
- Staley K. The role of an inwardly rectifying chloride conductance in postsynaptic inhibition. J Neurophysiol. 1994;72:273–284. doi: 10.1152/jn.1994.72.1.273. [DOI] [PubMed] [Google Scholar]
- Staley K, Smith R, Schaack J, Wilcox C, Jentsch TJ. Alteration of GABAA receptor function following gene transfer of the CLC-2 chloride channel. Neuron. 1996;17:543–551. doi: 10.1016/s0896-6273(00)80186-5. [DOI] [PubMed] [Google Scholar]
- Stein V, Hermans-Borgmeyer I, Jentsch TJ, Hübner CA. Expression of the KCl cotransporter KCC2 parallels neuronal maturation and the emergence of low intracellular chloride. J Comp Neurol. 2004;468:57–64. doi: 10.1002/cne.10983. [DOI] [PubMed] [Google Scholar]
- Stobrawa SM, Breiderhoff T, Takamori S, Engel D, Schweizer M, Zdebik AA, Bösl MR, Ruether K, Jahn H, Draguhn A, Jahn R, Jentsch TJ. Disruption of ClC-3, a chloride channel expressed on synaptic vesicles, leads to a loss of the hippocampus. Neuron. 2001;29:185–196. doi: 10.1016/s0896-6273(01)00189-1. [DOI] [PubMed] [Google Scholar]
- Stogmann E, Lichtner P, Baumgartner C, Schmied M, Hotzy C, Asmus F, Leutmezer F, Bonelli S, Assem-Hilger E, Vass K, Hatala K, Strom TM, Meitinger T, Zimprich F, Zimprich A. Mutations in the CLCN2 gene are a rare cause of idiopathic generalized epilepsy syndromes. Neurogenetics. 2006;7:265–268. doi: 10.1007/s10048-006-0057-x. [DOI] [PubMed] [Google Scholar]
- Thiemann A, Gründer S, Pusch M, Jentsch TJ. A chloride channel widely expressed in epithelial and non-epithelial cells. Nature. 1992;356:57–60. doi: 10.1038/356057a0. [DOI] [PubMed] [Google Scholar]
- Thompson SM, Gähwiler BH. Activity-dependent disinhibition. I. Repetitive stimulation reduces IPSP driving force and conductance in the hippocampus in vitro. J Neurophysiol. 1989;61:501–511. doi: 10.1152/jn.1989.61.3.501. [DOI] [PubMed] [Google Scholar]
- Tyzio R, Minlebaev M, Rheims S, Ivanov A, Jorquera I, Holmes GL, Zilberter Y, Ben-Ari Y, Khazipov R. Postnatal changes in somatic gamma-aminobutyric acid signalling in the rat hippocampus. Eur J Neurosci. 2008;27:2515–2528. doi: 10.1111/j.1460-9568.2008.06234.x. [DOI] [PubMed] [Google Scholar]
- Zúñiga L, Niemeyer MI, Varela D, Catalán M, Cid LP, Sepúlveda FV. The voltage-dependent ClC-2 chloride channel has a dual gating mechanism. J Physiol. 2004;555:671–682. doi: 10.1113/jphysiol.2003.060046. [DOI] [PMC free article] [PubMed] [Google Scholar]