

Abstract
How seizures start is a major question in epilepsy research. Preictal EEG changes occur in both human patients and animal models, but their underlying mechanisms and relationship with seizure initiation remain unknown. Here we demonstrate the existence, in the hippocampal CA1 region, of a preictal state characterized by the progressive and global increase in neuronal activity associated with a widespread buildup of low-amplitude high-frequency activity (HFA) (>100 Hz) and reduction in system complexity. HFA is generated by the firing of neurons, mainly pyramidal cells, at much lower frequencies. Individual cycles of HFA are generated by the near-synchronous (within ∼5 ms) firing of small numbers of pyramidal cells. The presence of HFA in the low-calcium model implicates nonsynaptic synchronization; the presence of very similar HFA in the high-potassium model shows that it does not depend on an absence of synaptic transmission. Immediately before seizure onset, CA1 is in a state of high sensitivity in which weak depolarizing or synchronizing perturbations can trigger seizures. Transition to seizure is characterized by a rapid expansion and fusion of the neuronal populations responsible for HFA, associated with a progressive slowing of HFA, leading to a single, massive, hypersynchronous cluster generating the high-amplitude low-frequency activity of the seizure.
Introduction
One of the main disabling features of epilepsy is the unpredictability of seizures. A variety of analytical techniques have been developed to try to identify a state preceding seizures, the “preictal” state (Litt and Lehnertz, 2002; Mormann et al., 2007). Most of these studies have focused on algorithmic seizure prediction and paid little attention to the underlying mechanisms of seizure generation (or ictogenesis). However, the existence of a preictal state and its biological origins are far from clear (Lopes da Silva, 2008; Sackellares, 2008). Greater insights are required into the mechanisms of neuronal and population behavior of the preictal period, not only to improve seizure prediction but also to help us understand the pathophysiological process of ictogenesis (Mormann et al., 2007).
A promising candidate phenomenon for a preictal marker is high-frequency activity (HFA), which is found most reliably in intracranial recordings (Mormann et al., 2007). Recent studies have suggested an important role of HFA in epileptogenesis (Bragin et al., 1999, 2000, 2004) and in seizure initiation (Allen et al., 1992; Fisher et al., 1992; Bikson et al., 2003; Grenier et al., 2003; Bragin et al., 2005). However, studies specifically on the role of HFA in the preictal state are sparse, generally fail to address the cellular and network mechanisms of its buildup, and in some cases consider it an epiphenomenon (Worrell et al., 2004; Khosravani et al., 2005).
In the current work, we present cellular and network mechanisms and spatiotemporal dynamics of HFA, and of the preictal period, in the CA1 region of hippocampal slices in the low-calcium and high-potassium models. The preictal period is characterized by the progressive global increase in neuronal firing that manifests extracellularly as a buildup of HFA and a decrease in system complexity. Immediately preceding the seizure, CA1 neuronal networks are at state of high sensitivity to perturbations. Any weak depolarizing and/or synchronizing perturbation can cause transition to seizure. Transition to seizure is then characterized by rapid expansion and fusion of activity of neuronal populations generating HFA, resulting in one massive neuronal population generating seizure activity.
Materials and Methods
Transverse hippocampal slices (400 μm) were prepared from male Sprague Dawley rats (180–225 g; anesthetized with ketamine and medetomidine; killed by cervical dislocation). All experiments were performed under the Animals (Scientific Procedures) Act 1986 of the United Kingdom and institutional ethical review. The slices were stored, at room temperature, submerged in a holding chamber filled with “normal” artificial CSF (ACSF) consisting of the following (in mm): 125 NaCl, 26 NaHCO3, 3 KCl, 2 CaCl2, 1 MgCl2, 1.25 NaH2PO4, and 10 glucose (aerated with humidified 95% O2–5% CO2 mixture). After >60 min, slices were transferred to an interface recording chamber, at 32°C, containing normal ACSF.
Spontaneous seizure-like events were induced by perfusion of slices with low-calcium increased-potassium ACSF consisting of the following (in mm): 125 NaCl, 26 NaHCO3, 5 KCl, 0.2 CaCl2, 1 MgCl2, 1.25 NaH2PO4, and 10 glucose (bubbled with 95% O2–5% CO2 mixture). Slices generating activity >2 mV in amplitude were accepted in this study. In other slices, seizure-like events were induced by high-potassium ACSF, which differed from normal ACSF only in a higher concentration of KCl of 8.5 mm. In the high-potassium model, temperature in chamber was kept at 33–35°C.
Extracellular field potentials were recorded using wire electrodes, which were fabricated in our laboratory from platinum/iridium wire (25 μm diameter, <800 kΩ impedance; Advent Research Materials). Electrodes were positioned individually under visual control using a microscope and eyepiece graticule. The majority of recordings was performed with 8–10 electrodes inserted in the exposed surface of stratum pyramidale along the long axis of the CA1 region. In experiments with wide separation of electrodes, the interelectrode distance was 200 μm. In experiments with close electrode separation, the distance between adjacent electrodes was 25 μm. Electrode positions were photographed using a digital eyepiece camera (World Precision Instruments). Interelectrode distance then was verified using the NIH ImageJ program (http://rsb.info.nih.gov/ij). Extracellular field potentials were preamplified using Neuralynx head-stage amplifier, amplified (500×), and low-pass filtered (3 kHz) with Neuralynx Lynx-8 amplifiers.
Direct-coupled (DC) recordings were performed with glass micropipettes (2–8 MΩ) filled with low-calcium ACSF. Electrodes were placed in the CA1 pyramidal cell layer. Signals were amplified with an Axoclamp-1A (Molecular Devices) and Neurolog NL-106 and NL-125 amplifiers (Digitimer).
Extracellular unit activity was recorded with concentric tetrodes (Thomas Recording GmbH) or tetrodes fabricated from tungsten wire (13 μm; California Fine Wire). Single or three tetrodes (positioned close to each other) were used. Signals were preamplified, amplified 2000×, and filtered (high cutoff frequency of 10 kHz) using Neuralynx.
All recorded signals were digitized using 1401 Plus or 1401 Power and Spike2 software (Cambridge Electronic Design). Extracellular field potentials were digitized at 2.5 or 5 kHz. Data from tetrodes were digitized at 20 or 25 kHz.
Uniform electric fields were applied via Ag/AgCl (2 mm in diameter, 4 cm long) electrodes using a Bi-Phasic Stimulus Isolator DS4 (Digitimer) or an Analog Stimulus Isolator (model 2200; A-M Systems). Electrodes were placed on either side of the hippocampal slice and oriented so that the CA1b somatodendritic axis was parallel to the direction of the applied electric field. The applied fields lasted 0.75 s. Schematics of recording arrangements can be found in supplemental Figure 1 (available at www.jneurosci.org as supplemental material).
All data analyses were performed using Spike2 software (Cambridge Electronic Design) and programs written in our laboratory and running under Matlab (MathWorks). Epochs lasting 0.5 s containing HFA were analyzed, and the power spectrum was calculated using the Morlet wavelet transforms (Li et al., 2007b). To quantify power spectral properties, median and first moment were calculated within the frequency range of 10–1000 Hz. The temporal profile of changes in frequency was determined from summated power in the frequency band 80–250 Hz using windows lasting 0.75 s. The synchronization of multichannel recordings was analyzed using wavelet phase-synchronization methods. Because most of the information, both interictal and ictal, in our signal occurs in the frequency band 10–250 Hz, signals for synchronization analysis were bandpass filtered [10–250 Hz, finite impulse response (FIR) filter]. Epochs lasting 0.2 s were analyzed. The amplitude and phase of field potential recording do not necessarily change in parallel (Lachaux et al., 2002), so it was necessary to isolate phase synchronization between two sets of field potential data. After Morlet wavelet transform, the phase information over the frequency band was obtained. The instantaneous phase ϕ(t) of the signal x(t) was determined. The phase difference between two series is defined as ϕn,m(t) = Φ1(t) − Φ2(t). The distribution of the cyclic relative phase is ψ(t) = ϕ(t)mod2π. The wavelet phase synchronization index was calculated by γ = , where the brackets denote the average over time. The measure of synchronization strength varies from 0 to 1. Phase synchronization was calculated between all possible pairs of channels so the synchronization matrix was generated. This matrix brings information about the spatial profile of synchrony and formation of clusters of synchrony between individual channels. To quantify the formation of synchrony clusters and the synchrony profile, the synchronization matrix was analyzed using principal component analysis and random matrix theory (Li et al., 2007a). This method decomposed the synchronization matrix to generate a set of eigenvectors and eigenvalues. Then the following characteristics, based on the analysis of eigenvectors and eigenvalues, were extracted: (1) global synchronization index, which ranges from 0 to 1, where 0 denotes the absence of synchrony and 1 denotes perfect (absolute) synchrony between signals; (2) number of statistically significant synchrony clusters; and (3) synchronization index for each individual cluster, revealing the amount of synchrony for that cluster. The global synchronization index is derived from the maximal synchronization index.
Spike sorting was performed using Spike2 spike sorting toolbox and Matlab routines. The continuously recorded wide-band signals were digitally high-pass filtered >800 Hz using a fast Fourier transform filter. The times of individual spikes were defined at their maximal negativities. Units were initially clustered using KlustaKwik and then by a graphical cluster cutting in two-dimensional plots (Wilson and McNaughton, 1993). The clustering process was based on the principle of plotting different waveform parameters and features from different electrodes. Principal component analysis was also used to extract features, usually from the first three components. Interspike interval histograms and autocorrelograms were calculated during the clustering process. If no clear refractory period (<2 ms) was detected in the autocorrelogram, then more than one neuron must be contributing to that cluster and additional feature combinations were examined to subdivide the cluster further until a clear refractory period was present in the autocorrelogram (Csicsvari et al., 1999). Only units with clear refractory periods were included in the present analysis. Then cross-correlograms between all possible pairs of units were calculated and examined for symmetrical gaps in the center bins. The presence of a gap (common refractoriness) suggested that two clusters represented activity of the same unit, and therefore those clusters were merged (Fee et al., 1996). Neurons with low firing rates were included in the study only if the number of observed events was higher than 500 (silent neurons).
After the clustering procedure, several parameters were examined to differentiate pyramidal cells from interneurons. Spikes of each unit were extracted from the original wide-band recording and averaged. The averaged spike was then resampled to 80 kHz and used to measure spike width at 25% of its amplitude. This was the main criterion to differentiate between interneurons (<0.4 ms) and pyramidal cells (>0.45 ms). Additionally, autocorrelogram shape was used to differentiate between neuronal subtypes.
Raw wide-band recordings were bandpass (80–250 Hz) filtered by an FIR filter. Troughs of individual oscillation with amplitudes >5 and 7 SD of background activity were identified. Cross-correlation functions were calculated between single-unit activity and individual cycles of the fast activity, with the peak negativity of each cycle as the reference point. Autocorrelation and cross-correlation histograms were normalized by dividing the count in each bin by the total number in all bins.
To determine the role of neurons in generating HFA, individual cell firing phase histograms were calculated, normalized by dividing each bin by total number of events (HFA cycles), and expressed as firing probability histograms. Using the Rayleigh test, we determined whether the neuronal firing changed during HFA cycles (non-uniform distribution) or not (uniform distribution). The intensity (depth) of the change in firing probability was quantified by generating unit vectors (summation of spike phases) and normalized by number of spikes. The index of intensity of change ranged from 0 (uniform distribution) to 1 (values of all angles are the same).
To examine interactions (coupling) between neurons, we calculated cross-correlograms between spike trains of pairs of neurons. In situations with weak coupling not manifested with obvious peaks in cross-correlograms, we used a surrogate approach to distinguish weak coupling from random coincidence. To count the number of coincident spikes, we used a spike-centered bin algorithm with bin size 5 ms (typical duration of cycles of HFA). This approach detected coincident action potentials and their number. We then used 200 surrogates for each pair of recordings, generated by shuffling one of the original spike trains (maintaining their respective interspike interval histograms), to generate a distribution for chance coincident firing. From this, we were able estimate whether number of coincident spikes between the pair of neurons results from random coincidence or from significant, if weak, interactions (p < 0.05). To test the significance, we used one-sample t test to compare number of coincident spikes generated by surrogates with value obtained from original spike trains.
To study spatial volume conduction, spatial second derivative of voltage as a function of distance z and time t was estimated by a second-order differencing formula (Kloosterman et al., 2001): {[Φ(z,t) − Φ(z − Δz,t)] − [Φ(z + Δz,t) − Φ(z,t)]}/(Δz)2, where Φ(z,t) is the potential value at distance z and time t. Δz is spacing between adjacent electrodes, in our case 25 μm.
To characterize system dynamics and quantify signal complexity, we used the Gaussian process entropy rate (GPER) measurement (Palus, 1997). GPER provides a useful first approximation of the level of complexity of signals. It can be interpreted as a measure reflecting the number of linearly independent oscillatory modes contained in the analyzed signal. GPER was calculated from signal epochs using the fast Fourier transform in a window of 1.6 s, shifted through the signal by a step of 0.2 s. A more detailed description of the method can be found in the supplemental data (available at www.jneurosci.org as supplemental material).
Statistical analysis was performed using SPSS software (SPSS Inc.). Group comparisons were tested using t tests or Mann–Whitney tests. Normal distribution was evaluated by the Kolmogorov–Smirnov test. Temporal profiles and trends were analyzed using the general linear model (GLM). Results in text and graphs were expressed as mean ± SEM.
Results
Seizure activity
After perfusion with low-calcium ACSF for >60 min, slices generated repeated spontaneous field bursts (Fig. 1 A) that consisted of a negative shift in DC potential with superimposed population spikes (Fig. 1 B). The mean duration of field bursts was 17.3 ± 0.5 s (n = 200, 40 slices), and they recurred with a mean interictal interval of 46.6 ± 1.4 s (n = 200, 40 slices). Their appearance was similar to those reported previously (Jefferys and Haas, 1982; Haas and Jefferys, 1984; Konnerth et al., 1986). The seizures could start in any part of CA1 (supplemental Fig. 2, available at www.jneurosci.org as supplemental material). Seizure onset zones could change within individual slices, and sometimes seizures started simultaneously in different parts of CA1. If CA1 was cut into minislices each containing ∼2 mm of CA1 (supplemental Fig. 2D, available at www.jneurosci.org as supplemental material), they maintained the ability to generate seizures with multifocal onset (10 slices). Seizures could be preceded by prebursts, an activity resembling seizures aborted shortly after onset (supplemental Fig. 3, available at www.jneurosci.org as supplemental material).
Figure 1.

Low-calcium seizures and HFA. A, Repeated seizure activity. B, Detail of low-calcium seizure. Seizures are superimposed on large negative DC shift. C, Periods between seizures are characterized by the presence of low-amplitude HFA. D, Short burst of HFA with superimposed multiunit activity. E, Bandpass filtered (80–250 Hz) data showing only HFA. F, Raw data were high-pass filtered (>600 Hz) to reveal multiunit activity (MUA).
Dynamics of high-frequency network activity during interictal period
During the periods between seizures, low-amplitude (<400 μV) irregular activity was present throughout CA1 (Fig. 1 C). This activity was composed of low-amplitude HFA (Fig. 1 D,E) with superimposed multiunit activity (Fig. 1 F). Digital filtering revealed substantial activity in the band 80–250 Hz (Fig. 1 E). This high-frequency activity changed dynamically during the interictal period and in the run-up to the next seizure (Fig. 2). The bandpass filtered signal, wavelet spectrogram, and summated power all show progressive increases in HFA centered on 186 ± 2 Hz (Fig. 2 C–E, respectively, calculated for the recording shown in A, B). The increase in power in the 80–250 Hz band is consistent when averaged across 21 slices, revealing an asymmetrical U-shaped profile (Fig. 2 F,G, respectively, showing power in real time and in interictal segment in which we divided each interictal period into 100 equal segments). HFA power rapidly declined to a minimum during the first few seconds after the previous seizure and then progressively increased during most of the period between seizures, reaching a peak immediately before the start of the next seizure (Fig. 2 F,G) (10.9 times minimum; n = 20; p < 0.001, GLM). At the onset of the seizure, HFA transformed to high-amplitude low-frequency regular ictal discharges.
Figure 2.
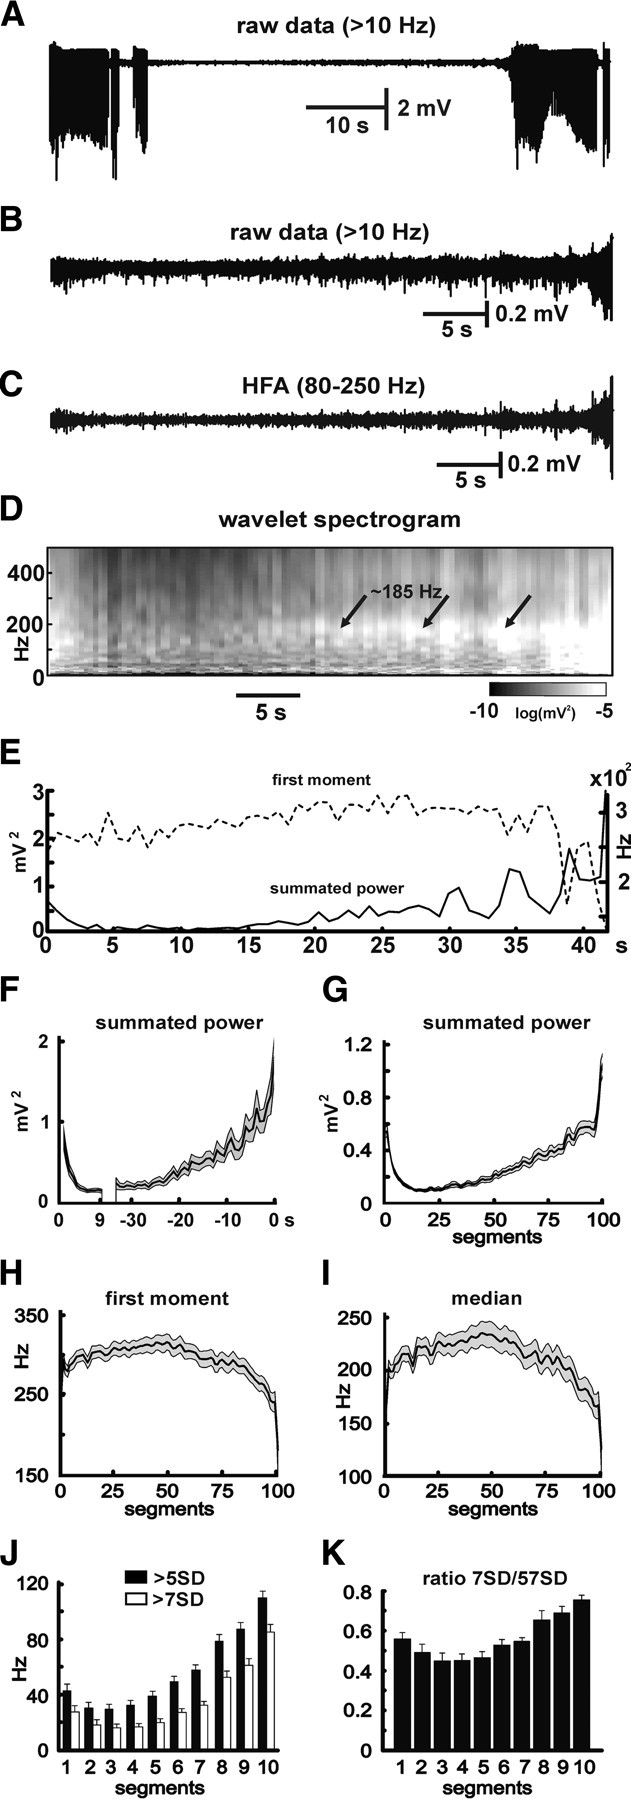
Temporal profile of HFA. A, Example of period between seizures (DC removed, high-pass >10 Hz filter). B, Isolated interictal period. C, Bandpass (80–250 Hz) filtered interictal period demonstrates increases in amplitude and especially in incidence of bursts of HFA preceding the seizure. D, Corresponding wavelet spectrogram shows increase (pale gray to white) in power, especially in frequency band (80–250 Hz) mainly ∼185 Hz. E, Corresponding summated power of 80–250 Hz band and first moment of power spectra. F, Time course of summated power of 80–250 Hz band in 21 slices (mean ± SEM; gray area is SEM). The increase power starts >30 s before the seizure. After the end of the seizure, HFA occurs and quickly decreases in power. G, Because the period between seizures in each slice is not equal, interictal periods were each divided into 100 epochs of equal length, and the mean values of summated power for individual epochs was obtained. H, I, First moment (H) and median (I) of power spectra show that buildup in HFA is accompanied by progressive drop in frequency, with sudden drop immediately preceding the seizure. J, Temporal profile of incidence of >5 and >7 SD HFA cycles. Preceding the seizure, there is increase in number of >5 and >7 SD oscillations, but the steeper increase in >7 SD suggests also an increase in amplitude of the HFA preceding the seizure (period between seizures divided into 10 segments). K, Ratio between numbers of >7 and >5 SD cycles reveal an increase in cycles with higher amplitude.
Part way through this progressive increase in power, ∼0.5 through the interictal period, the central frequency of HFA started to decrease (characterized by first moment or median) (Fig. 2 H,I) and progressively slowed until just before the seizure when the rate of slowing increased much more rapidly and in parallel with the rapid increase in power. The mean frequency (or first moment) of the power spectra progressively decreased from 309 ± 9 to 231 ± 9 Hz (Fig. 2 H) (n = 21) immediately preceding the seizure; a similar profile of the first moment of frequency was seen in individual interictal periods (Fig. 2 E, dashed lines). The median frequency followed a similar course, decreasing from 229 ± 11 to 158 ± 10 Hz (Fig. 2 I) (n = 21) at seizure onset. The decreases in these values suggest that, preceding the seizure, the composition of HFA shifts toward lower frequencies, but these remain within the HFA band. The overall increase in power was accompanied by an increase in the amplitude of HFA cycles (Fig. 2 C). The progressive increase in the amplitude was reflected by an increase of the ratio between the number of 7 and 5 SD cycles, from a baseline of 0.46 ± 0.03 to 0.69 ± 0.03 immediately preceding the seizure (n = 9; p < 0.001, t test) (Fig. 2 J,K).
To examine the dynamics of interictal HFA, phase space trajectories were constructed in three-dimensional phase space using original and time-shifted variables x(t), x(t + τ), and x(t + 2τ), where τ is fixed time lag (1 ms) (Fig. 3 C–F). During seizures, the trajectory pattern was regular and resembled a noisy three- or more dimensional limit cycle (Fig. 3 F). The phase space trajectory during interictal periods had more irregular (complex) patterns (Fig. 3 C,D). The progressive increase in signal amplitude preceding the seizure was associated with a progressive expansion of the trajectory in phase space (Fig. 3 C–E). Transition to seizure (Fig. 3 E) was characterized by a sudden and rapid expansion in phase space reflecting a sudden increase in signal amplitude, associated with an increase in regularity (decrease in complexity) of the phase space trajectory.
Figure 3.
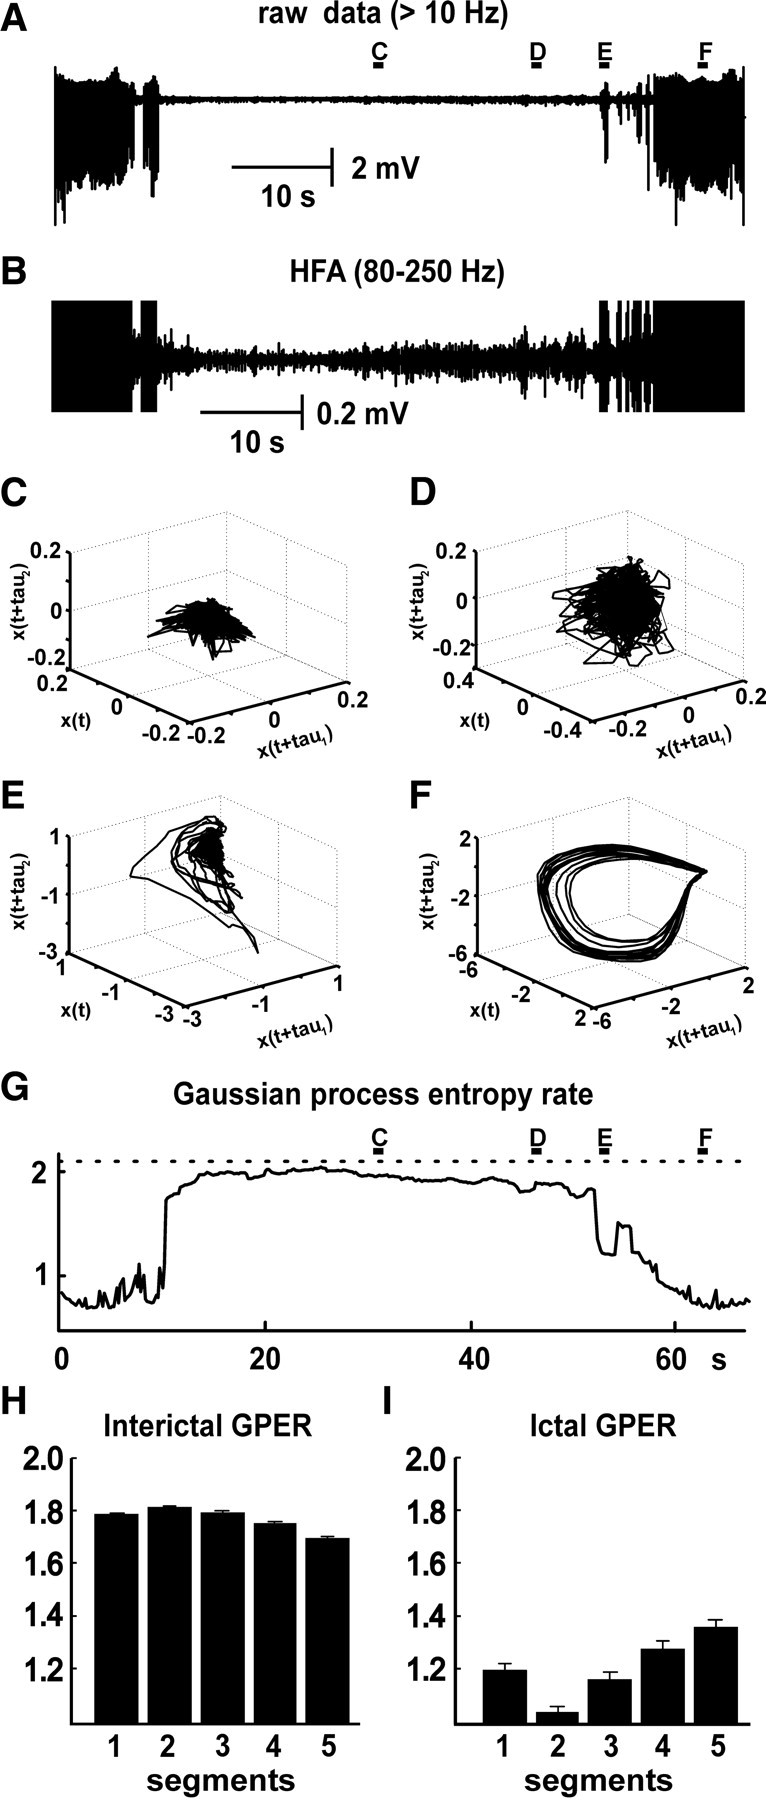
Preictal and ictal changes in Gaussian process entropy rate. A, Two seizures and intervening interictal period. B, Signal bandpass filtered at 80–250 Hz shows buildup in HFA. C, Phase space diagram constructed from the activity during the middle part of the interictal period has a visually irregular (complex) pattern. D, Activity closer to the seizure onset is still characterized by an irregular, but expanding, pattern in phase space. E, Seizure onset is characterized by a progressive expansion and more regular pattern of trajectories. F, Regular pattern of trajectories during the seizure, which resembles a three- or more dimensional limit cycle. G, GPER, with GPER progressively decreasing before the seizure and a substantial drop during the seizure. H, Bar graph shows changes in interictal GPER across 10 slices. I, Changes in GPER during seizures across 10 slices.
To quantify and describe discrete changes in dynamical system complexity, signals were analyzed using GPER (Palus, 1997). This is an entropic measure that measures system complexity, understood as the number of different oscillatory processes making up the time series (Fig. 3 G,H). High values reflect large numbers of processes, whereas low values indicate smaller numbers of processes creating the time series. It showed that mean GPER between seizures was 1.763 ± 0.001 (n = 30; 10 slices). During the seizure, the complexity of the system was significantly lower than during the interictal period (Fig. 3 G,I). Ictal values of the GPER were 1.21 ± 0.02 (n = 30; 10 slices; p < 0.001). Discrete changes in system complexity were observed between seizures. As the next seizure approached, values of GPER progressively and significantly decreased (Fig. 3 G,H) (p < 0.001, GLM, n = 30; 10 slices). Seizure onset was characterized by a substantial and significant drop in GPER (Fig. 3 G,I) (p < 0.001, t test; n = 30; 10 slices). The low GPER values persisted throughout the course of each seizure.
HFA spatial profile and synchronization on a local scale
We studied the spatial and synchrony profiles of HFA on both local and global scales. For the analysis at the local scale, recordings were performed with electrodes spaced at 25 μm (Fig. 4). Buildup of HFA was present in all recording electrodes (Fig. 4 A). Estimation of phase synchronization between all pairs of electrodes and subsequent random matrix analysis showed that HFA generates local areas of synchrony (Fig. 4 C). A maximum of three independent statistically significant (p > 0.01) synchronization clusters could be observed at a time (Fig. 4 C). Therefore, we used the first three synchronization indices to determine the mean strength of synchronization of three largest clusters between seizures. Their values were 0.165 ± 0.004, 0.091 ± 0.002, and 0.021 ± 0.001.
Figure 4.
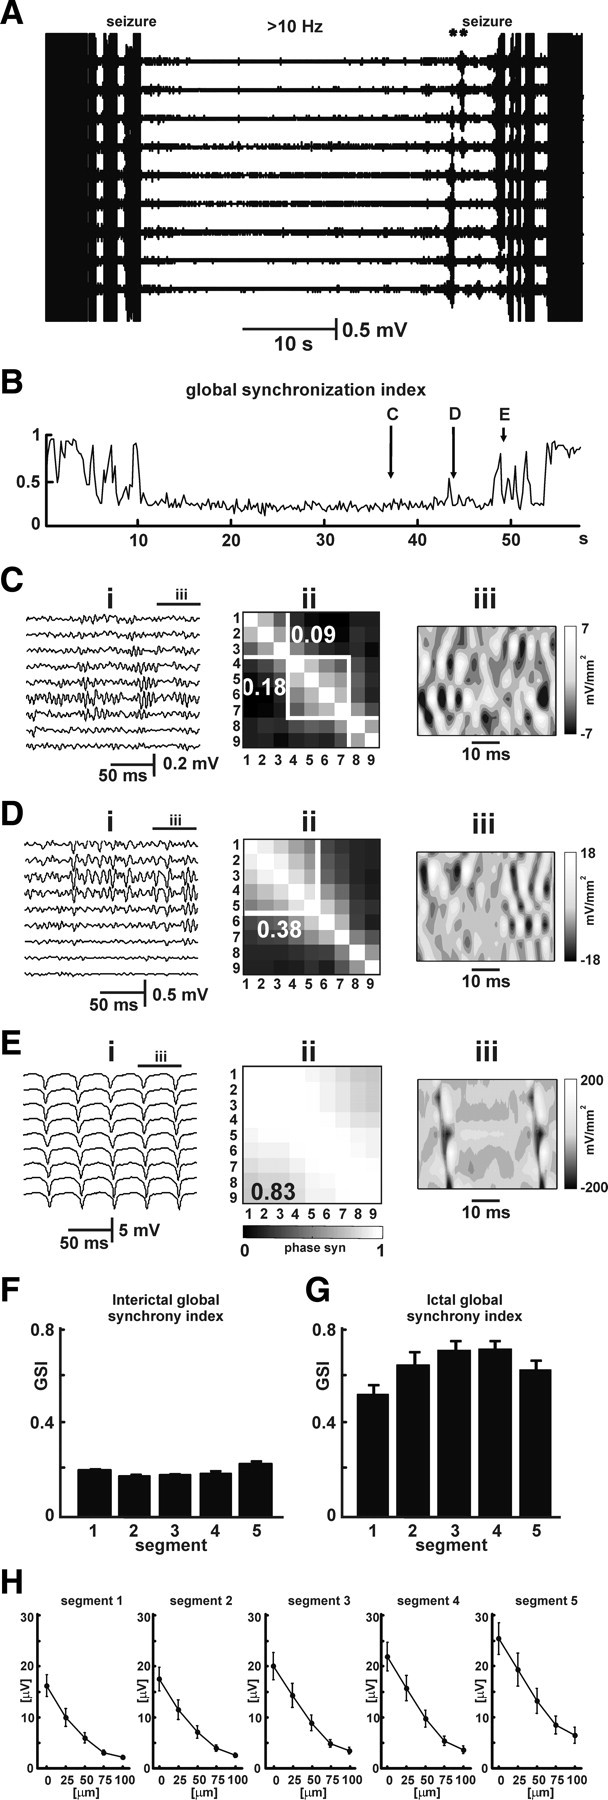
Synchrony profile of HFA and seizures on a local scale. A, Recording with closely spaced electrodes (25 μm). Period between seizures is characterized by the presence of HFA in all channels. Preceding the seizure are two short prebursts (asterisks). B, GSI slightly increases during preictal period. Transient increases can be observed during the prebursts. Seizure onset is characterized by a sudden increase in GSI, rising up to 0.9. C, Detail of recording between seizures shows HFA present in all channels (i). Phase-synchronization matrix (ii) shows two statistically significant clusters (p < 0.01). Synchronization indices for the individual clusters are 0.18 and 0.09. Synchronization index of largest cluster corresponds to GSI. Second spatial derivative of voltage shows the presence of several local sinks (iii). D, Seizure onset is characterized by expansion of one of the clusters and coalescence with adjacent ones. GSI is 0.38. Second derivative of voltage shows expansion and spread of local sinks. E, Seizure activity is characterized by high-amplitude low-frequency activity during which whole recorded area generates activity synchronously and creates one large hypersynchronous cluster. GSI reaches 0.83. Note the continuous current sinks and sources propagating across the area of recording. F, G, Values of GSI between seizures (F) and during seizures (G). There is a modest, but significant, progressive increase in synchrony during preictal period. H, Preictal changes characterized by increase in amplitude are associated also with increased spatial extent (averaged HFA from interictal period divided into 5 segments).
Transition to seizure was characterized by sudden spatial expansion of synchrony (n = 24, 8 slices). This expansion was a focal process with one of the clusters expanding (Fig. 4 D) and merging with adjacent clusters. The mean global synchrony index (GSI) at seizure onset was 0.46 ± 0.03 (seven slices), significantly different from interictal values (p < 0.001, t test). During seizures, expansion proceeded and the strength of synchrony further increased until the whole recorded area generated highly synchronous activity (mean GSI, 0.61 ± 0.02; seven slices) (Fig. 4 E,G). During seizures, periods of activity were observed during which the entire area acted as one hypersynchronous ictal cluster (maximum GSI, 0.88 ± 0.03; seven slices).
We tested the hypothesis that the spatial structure in the HFA simply reflected passive volume conduction from a very local source. Passive volume conduction would result in a 0 s spatial derivative of voltage; this is the basis of current source density analysis in which significant values of this measure are interpreted in terms of currents passing between the intracellular and extracellular spaces. The second spatial derivative of voltage along the pyramidal layer showed substantial values (Fig. 4 C,D), which shows that the structure of HFA is not attributable to passive decay but rather is the consequence of local activity. Even after seizure onset, when the whole of CA1 becomes phase locked, the second derivative reveals current sinks and sources along the pyramidal layer, associated with the propagating population spikes (Fig. 4 E).
The first synchronization index shows the largest synchrony cluster, which therefore is used as a measure of global synchronization to estimate the total amount of synchrony in the studied area. The mean GSI between seizures was 0.165 ± 0.004 (n = 30; 10 slices) (Fig. 4 B). The temporal profile of the GSI index had a U-shape during the interictal period (Fig. 4 F) (p < 0.001, GLM). This increase in synchrony ran in parallel with increase in amplitude of HFA and its spatial extent (Fig. 4 H).
HFA spatial profile and synchronization on a global scale
Recording with a wider interelectrode separation of ∼200 μm (17 slices) between seizures showed that the buildup in HFA occurs over the entire CA1 region (Fig. 5 A). However, HFA did not synchronize between electrodes; no synchrony clusters were observed in the synchronization matrix during interictal HFA (Fig. 5 C). The mean GSI recorded between seizures with the widely spaced electrodes was 0.009 ± 0.0004 (n = 30; 10 slices), significantly smaller than from recordings with closely spaced electrodes (p > 0.001, Mann–Whitney test) (Fig. 5 F). Areas of increased synchrony were detected at the end of prebursts, which preceded the seizure and/or at the initial parts of seizure (0.12 ± 0.01; n = 36; 12 slices) (Fig. 5 D). As each seizure progresses, synchrony spreads to adjacent regions, ultimately entraining the whole of CA1 (Fig. 5 E). In cases with simultaneous onsets at either end of CA1, the resulting two large seizure clusters merged to cover the whole of CA1. The mean seizure synchrony index was 0.4 ± 0.02. During the advanced stages of the seizure, the entire CA1 region could be involved in ictal activity and behaved as a single cluster of hypersynchronous activity (Fig. 5 E,G). Then GSI reached its maximal value (0.78 ± 0.03; n = 36; 12 slices) (Fig. 5 E,G).
Figure 5.
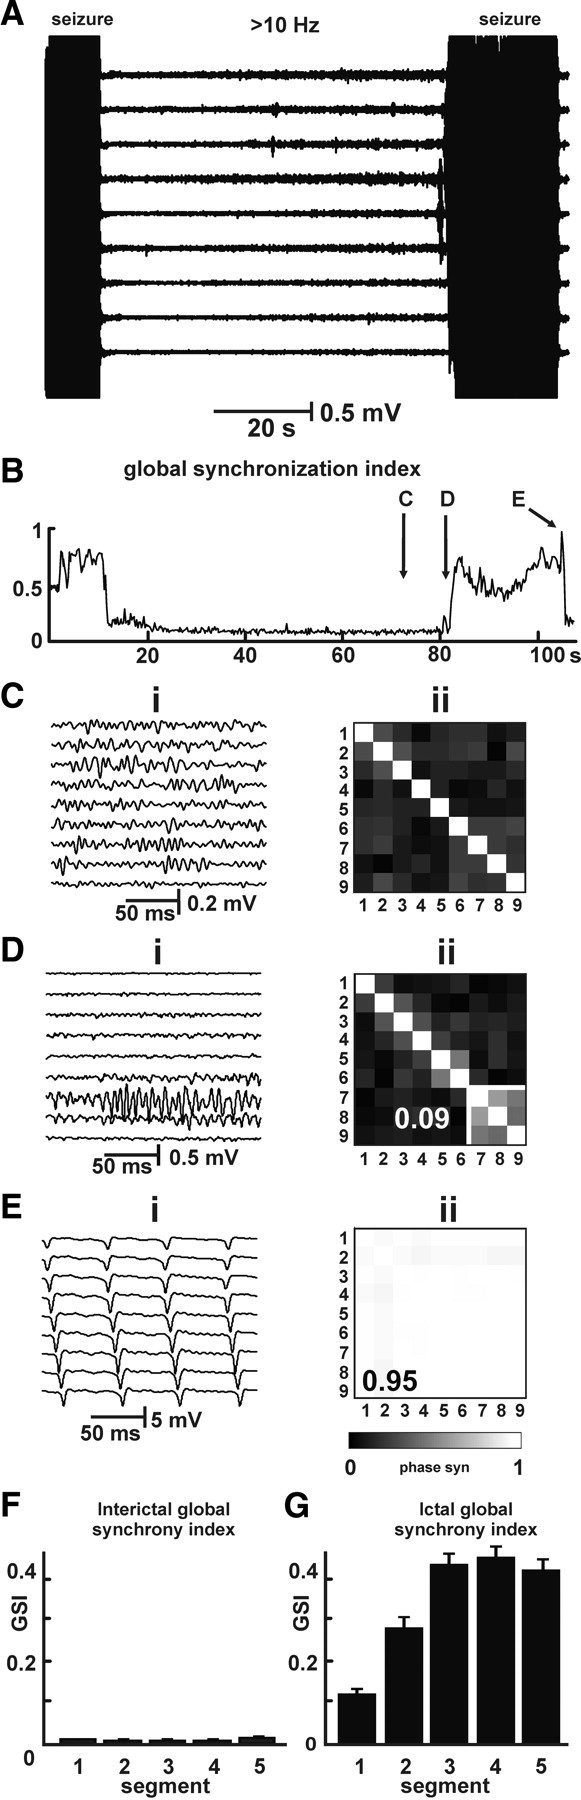
Synchrony profile of HFA and seizures on a global scale. A, Recording with large separation between electrodes (200 μm) shows widespread buildup in HFA. B, Between seizures, GSI values are very low. C, Detail of activity during preictal period shows the widespread presence of HFA, which lacks synchrony between electrodes. D, Seizure onset is characterized by an expansion of synchrony, which is rapid but slower then on the local scale. E, During the seizure, the entire CA1 can generate epileptic activity in near complete synchrony (GSI of 0.95). F, G, GSI between (F) and during (G) seizures on the large (global) scale.
Cellular mechanisms of high-frequency network activity
We investigated neuronal behavior during HFA by isolating 247 cells from tetrode recordings. Of these, we were able to reliably differentiate 87 pyramidal cells and 27 interneurons (Fig. 6). The remaining cells were either unclassifiable or were “silent” pyramidal cells, which fired fewer than 500 action potentials over the recording period of ∼15 min. Pyramidal cells fired single action potentials (mean width, 0.57 ± 0.02 ms) or short bursts of action potentials with mean firing rate 4.0 ± 0.7 Hz (Fig. 6 A,C). Interneurons fired trains of action potentials (mean width, 0.37 ± 0.03 ms) or could also fire single action potentials with a mean firing frequency of 15.1 ± 2.6 Hz (Fig. 6 B,D). Cross-correlograms between spike trains and HFA cycles showed that pyramidal cells increased firing robustly during HFA cycles, whereas interneuronal activity was only slightly increased (Fig. 6 E,F). To quantify the firing probability, phase histograms were calculated (Fig. 6 G,H). All pyramidal cells showed statistically significant increase of their spike timing in relation to HFA cycle (Rayleigh test, p < 0.05; n = 87), as did interneurons (n = 27). Pyramidal cell firing probability peaked during the trough of HFA cycle with mean angle of firing 175 ± 4°, overlapping the trough minimum at 180°. The mean intensity in increase of pyramidal cell firing probability in relation to HFA cycle was 0.49 ± 0.02. The mean intensity of increase in firing probability of interneurons was 0.19 ± 0.02, significantly lower than that of pyramidal neurons (p < 0.001, t test); the mean phase angle of the firing probability peak was 197 ± 8°. Although the activity of both pyramidal cells and interneurons increases during HFA cycles, the firing probability and firing rates of both classes shared an important feature: that none of the cells fired during every HFA cycle.
Figure 6.

Cellular mechanisms of HFA and dynamics of cellular firing. A, Averaged pyramidal cell action potential (gray area represents SEM; n = 84 cells). B, Averaged interneuronal action potential (gray area represents SEM; n = 27 cells). C, D, Normalized and averaged autocorrelograms of firing of pyramidal cells (C) and of interneurons (D). E, F, Averaged normalized cross-correlograms between HFA cycle and firing of pyramidal cells (E) and interneurons (F). G, Phase histograms of firing probability, during HFA cycles, show increase in probability of pyramidal cell firing during the HFA cycle, with increased probability of firing mainly during the trough of HFA cycle. H, Phase histogram for interneurons show only mild increase of firing during the HFA cycle. I, Coincident firing. Coincident firing was observed 43 times between the illustrated pair of neurons. Histogram shows the number (y-axis) of coincident firings (x-axis) observed in 200 surrogates. Results suggest that coincident firing between these two neurons is not attributable to random coincidence (p < 0.001). J–L, Interictal period between two seizures is characterized by a progressive buildup in HFA. M, Activity of pyramidal cells (PYR) and interneurons (INT) derived from three closely spaced tetrodes reveals a progressive increase in neuronal firing and recruitment of cells. N, Transition to seizures is characterized by progressive increase in multiunit activity (n = 24; 8 slices).
Cellular behavior, and correlating multiunit activity with HFA, suggested that individual HFA cycles are attributable to cofiring of more than two neurons (Fig. 1 D–F) (supplemental Fig. 4, available at www.jneurosci.org as supplemental material). Therefore, we examined coupling between neuronal firing. Cross-correlation analyses did not demonstrate the presence of clear coupling between pairs of neurons. Therefore, we examined the existence of weak coupling using a coincidence approach (Fig. 6 I). Firing coincidence was determined in 5 ms time windows. For each pair of trains, we generated 200 surrogates with shuffled spikes to estimate chance levels of coincident firing. Analyses of 1354 pairs of neurons from single tetrode data identified potentially significant coincident firing in 54 pairs (4%) of neurons, using a criterion of fewer than 10 of the 200 surrogates having more coincident firings than the real data. A sample of pairs not meeting this criterion showed that the observed incidence of coincident firing was not significantly different from the surrogate data. More detailed analysis of the 54 pairs that did reach criterion revealed that, in all cases, the observed coincident firing rate was significantly different from that for the population of surrogates (p < 0.001, one-sample t test), showing that the modest incidence of coincident firing was not attributable to chance.
During interictal periods (such as that shown in Fig. 6 J–M), unit firing accelerated or, in some cases, postictally silent units were recruited, as the next seizure approached. This applied to both pyramidal cells and interneurons (Fig. 6 M). To determine the overall dynamics of neuronal firing during interictal periods, we averaged the firing rate for each of 10 equal segments per interictal period for a total of 24 interictal periods from eight slices. This revealed a slowing during the early interictal period just after the previous seizure, followed by a progressive increase in firing rate as the next seizure approached (Fig. 6 N): the mean multiunit firing rate increased from a minimum of 32 ± 3 Hz shortly after the previous seizure to 121 ± 18 Hz just before the next (n = 12; p < 0.001, GLM). The asymmetrical U-shape of mean unit firing rate during the interictal period resembles the pattern seen for summated HFA power (Fig. 2 E,F), HFA amplitude (Fig. 2 J,K), and HFA local synchrony (Fig. 4 F) and the inverted asymmetrical U-shape for GPER (Fig. 3 H). We determined the correlation between mean unit firing rate and HFA summated power within the 80–250 Hz band and found r = 0.81 ± 0.01 (five slices).
To examine cellular mechanisms of HFA further, slices were perfused with drugs. Synaptic transmission is blocked by the low concentration of Ca2+ in the ACSF (supplemental Fig. 5, available at www.jneurosci.org as supplemental material), but neurotransmitter release independent of action potentials and calcium entry is possible. Therefore, we applied antagonists of AMPA (20 μm 2,3-dioxo-6-nitro-1,2,3,4-tetrahydrobenzo[f]quinoxaline-7-sulfonamide; n = 4 slices), NMDA (25 μm 5-APV; n = 4 slices), and GABAA (20 μm bicuculline methiodide; n = 5 slices) receptors. None of the drugs applied blocked HFA. Application of gap-junction blockers [0.25–0.5 mm octanol (n = 7 slices), 0.2 mm carbenoxolone (n = 4 slices)] did not suppress HFA either. Decreasing the extracellular space by perfusing slices with hypo-osmolar ACSF (both 40 and 90 mOsm below control osmolarity) increased amplitude of HFA cycles (n = 4 slices).
Transition to seizure
Preictal changes are slow and progressive, but transition to seizure is a sudden and rapid process associated with massive amplitude increase, synchrony expansion, and decrease in GPER. Seizures could be triggered by applying various external perturbations, such as local application of glutamate (10 mm glutamate; eight slices) (Fig. 7 A), antidromic electrical stimulation (four slices), or by application of electric fields (four slices) (Fig. 7 B–E).
Figure 7.

Sensitivity to external perturbations. A, Seizure triggered by local application of 10 mm glutamate. B, During preictal period immediately preceding the next expected seizure, weak external depolarizing electric fields (−4 V/m, 0.75 s) can trigger seizure (C). D, Repeated medium strength (−8 V/m) pulses failed to trigger seizures until later in the interictal period. E, Strong depolarizing field (−40 V/m) reliably triggered seizures early in the interictal period. F, Repeated pulses (as in D) demonstrate the relationship between field strength and shortening of the interictal period. G, Sensitivity of CA1 area to applied fields, of all strengths, as a function of stage during the interictal period (divided into 5 equal segments based on the interictal period measured in the absence of fields). The closer to the predicted seizure onset, the higher the percentage of applied fields of all strengths capable of inducing seizures.
Application of electric fields showed a time-dependent sensitivity of the CA1 area to applied fields. Fields of various strengths (−2, −4, −8, −10, −20, −40, and −60 V/m) were applied during the periods between seizures. Long after the previous seizure and immediately preceding the next expected seizure, weak fields (−4 V/m) reliably triggered seizure activity (p < 0.05, t test; n = 8; 4 slices) (Fig. 7 B,C); in some cases, fields as weak as −2 V/m were able to trigger seizures. Fields were applied repetitively during the interictal period until the next seizure (Fig. 7 D). The stronger the applied field, the greater the truncating of the interictal period (Fig. 7 F). Fields applied shortly after the previous seizure needed to be strong (stronger than −40 V/m) to trigger persistent seizure activity (Fig. 7 E). From these data, we calculated sensitivity S for five segments of interictal period, using the following formula: S = (field evoking seizure)/(fields evoking seizure + fields failing) * 100. This measure showed that sensitivity to applied fields increases linearly preceding the seizure (p < 0.001, GLM) (Fig. 7 G), an increase that suggests a progressive increase in excitability of CA1 area.
HFA buildup in high-potassium model
To examine whether preseizure changes (buildup in HFA) can be observed in a model in which synaptic activity is intact, we recorded from CA1 in slices perfused with high-potassium (8.5 mm KCl) ACSF. CA1 was isolated from CA3 input by a cut. After perfusion with high-potassium ACSF for >20 min, isolated CA1 generated repeated, spontaneous seizures (Fig. 8 A), characterized by repeated epileptiform discharges (Jensen and Yaari, 1988). The mean duration of field bursts was 12.4 ± 0.7 s (n = 29, 6 slices), and they recurred with a mean interictal interval of 40.3 ± 2.0 s (n = 28, 6 slices). During the periods between seizures, low-amplitude activity was present throughout the CA1 (Fig. 8 B). This activity was characterized by the presence of HFA (Fig. 8 C) with superimposed multiunit activity (Fig. 8 D). Digital filtering and spectral analysis revealed that this HFA had frequency peaks centered at 217 ± 7 Hz (n = 23, 6 slices). This high-frequency activity had similar features (morphology and shape) to HFA observed in the low-calcium model. The temporal profile showed that HFA in the high-potassium model changed dynamically throughout the interictal period and progressively built up in the run-up to the next seizure, again like the low-calcium model (Fig. 8 E,F). Digital filtering (Fig. 8 F), spectrograms (Fig. 8 G), and summated power (Fig. 8 H) for the frequency band 80–250 Hz all showed progressive linear increases as the next seizure approached (n = 48, 16 slices; just before the next seizure summated power reached 25.8 ± 3.1 times its minimum; GLM, p < 0.001) Progressive buildup was associated with decrease in the spectral first moment from 321 ± 5 to 251 ± 4 Hz immediately preceding seizure (GLM, p < 0.001) (Fig. 8 I). At the onset of the seizure, HFA transformed from low-amplitude HFA to high-amplitude low-frequency seizure discharges.
Figure 8.
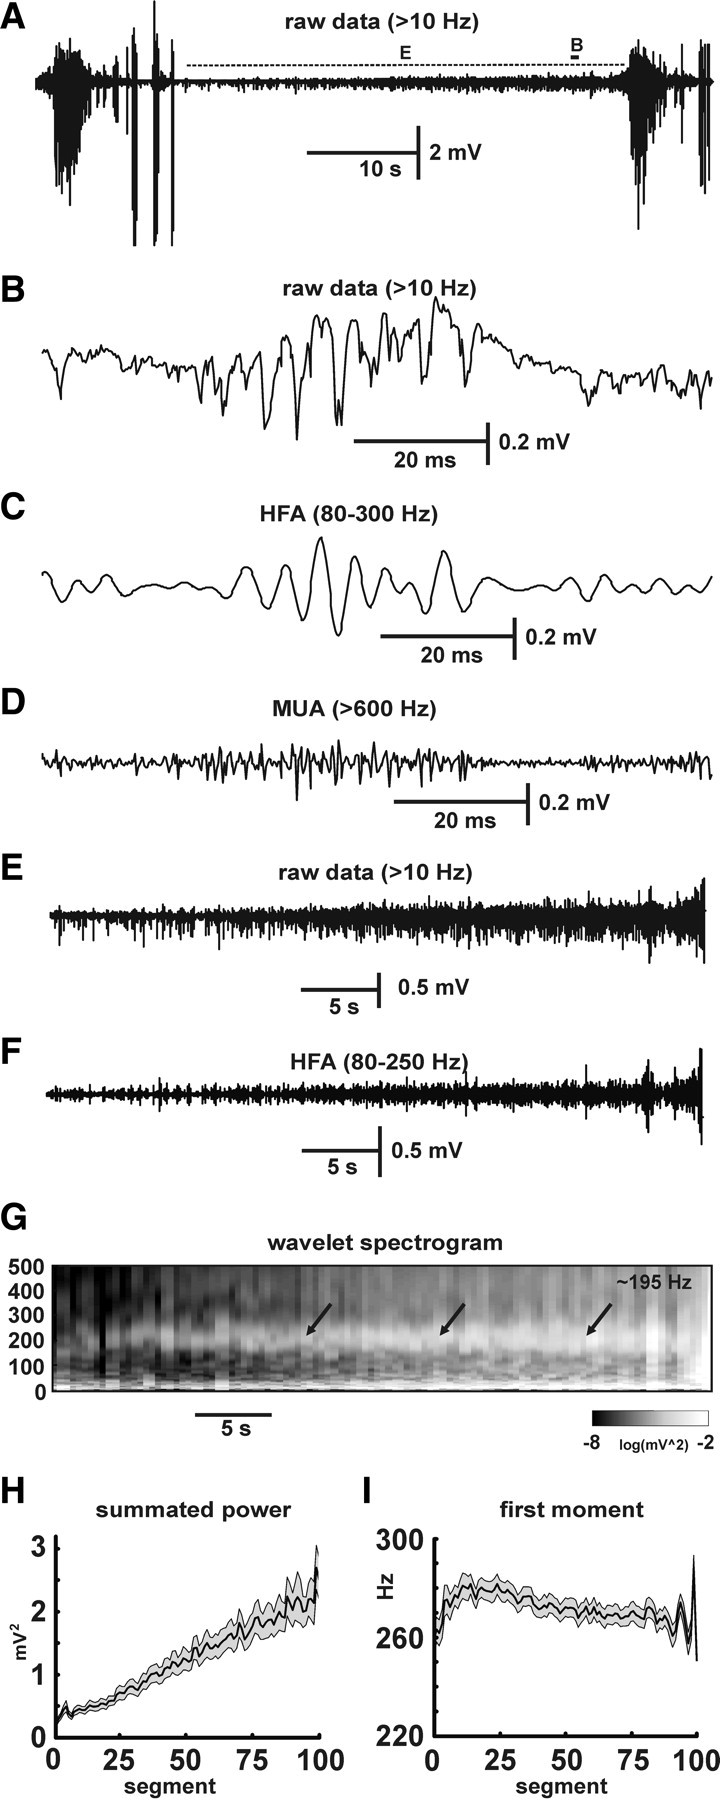
Preseizure changes in the high-potassium model. A, Repeated seizure activity. B, Between seizures, low-amplitude HFA is present with superimposed multiunit activity (MUA). C, Episode of HFA bandpass filtered (80–250 Hz) data. D, High-pass filtering (>600 Hz) shows multiunit activity (MUA). E, Isolated interictal period shows progressive buildup of low-amplitude HFA. F, Bandpass (80–250 Hz) filtered interictal period demonstrates increases in amplitude and incidence of HFA preceding the seizure. G, Corresponding wavelet spectrogram shows progressive increase (pale gray to white) in power, especially in frequency band (80–250 Hz) centered around ∼195 Hz (arrows). H, Time course of summated power of 80–250 Hz band in 16 slices (mean ± SEM, gray area is SEM). I, Frequency profile shift toward low frequencies preceding the seizures, expressed by the temporal profile of the first moment of the spectrum.
Discussion
In this study, we showed complex dynamics of the preictal state in two models of epileptic seizures. In both cases, this preictal state was characterized by buildup of HFA. Our detailed data on the low-calcium model suggest that individual cycles of HFA are generated mainly by action potential firing of CA1 pyramidal cells with a small but significant contribution from interneurons. The width and shape of individual cycles and the width and shape of extracellular action potentials suggest that each HFA cycle represents population phenomenon during which a small group of neurons (2–10 cells) generates action potentials simultaneously during a time window of ∼5 ms. Analysis of the firing of pairs of units recorded with single tetrodes revealed that a minority of neuron pairs did indeed fire within 5 ms of each other more often than chance. Analysis of spatial synchrony suggests that HFA cycles are generated by multiple and independent local (<130 μm) neuronal populations distributed across the entire CA1. A key question is what are the mechanisms leading to near-simultaneous cofiring of such small neuronal populations?
The absence of synaptic transmission in the low-calcium model suggests that the mechanisms involved in generating HFA must be predominantly nonsynaptic (Haas and Jefferys, 1984; Konnerth et al., 1986). Two conditions are necessary for the generation of HFA in this model. The first is the presence of increased neuronal firing. Pyramidal cells and interneurons become hyperactive and spontaneously generate action potentials, following the experimental manipulation of decreasing extracellular calcium and increasing extracellular potassium. In contrast, CA1 cells in normal hippocampal slice conditions very rarely fire spontaneously.
The second necessary condition for generating HFA is a mechanism enabling action potential cofiring with the ∼5 ms time span. Currently, there are two known nonsynaptic mechanisms capable of achieving such fast synchronization of firing: (1) interaction via gap junctions between pyramidal cells (Draguhn et al., 1998; Schmitz et al., 2001), and (2) local electric field or ephaptic interactions (Jefferys, 1995). Both mechanisms have been implicated in HFA (Draguhn et al., 1998; Grenier et al., 2003; Foffani et al., 2007). However, the persistence of HFA in the presence of gap-junction blockers in our experiments, together with the enhancement of HFA by decreasing extracellular space, supports the role of ephaptic mechanisms. In this mechanism, the electric field generated around cells when they fire can excite adjacent cells, especially if they are close to threshold as they are in the low-calcium model. This mechanism requires close proximity between cells and is helped by their parallel anatomical organization. Some CA1 interneurons are known to share orientation and location with CA1 pyramidal cells, which may explain why some interneurons increased their firing during the HFA cycle. No neurons, whether interneuron or pyramidal cell, fired on every cycle of HFA: rather, the high frequency of HFA is a composite of low-frequency firing neuronal populations.
One of the main findings of the present study is that HFA is a dynamic process, with HFA progressively building up and strengthening preceding the seizure. At the cellular level, the increase in incidence of HFA corresponds to a gradual increase in neuronal excitability reflected as increased individual cell firing and the recruitment of silent cells. As seizure onset approaches, the neuronal populations generating HFA increase in size, which is reflected by increases in the amplitude of HFA (and hence increase in power), with a progressive increase in global synchrony.
Seizure prediction and EEG analysis in human patients commonly relies on the measurement of the system dynamics of electrographic data (Litt and Lehnertz, 2002; Mormann et al., 2007). Several different analytical tools have revealed progressive preictal changes in measures of system dynamics and complexity: correlation dimension (Lehnertz and Elger, 1995), Lyapunov coefficient (Iasemidis et al., 1990), Kolmogorov entropy, etc. The biological substrate of these measures is not clear, but they generally suggest decreases in complexity of the system preceding the seizure. Periods between low-calcium seizures were also associated with changes in system dynamics, reflected by a decrease in GPER. This measure of system complexity is understood to reflect the number of independent oscillatory processes generating the observed time series. In our study, the preictal decrease in entropy rate could be explained by progressive expansion of neuronal clusters generating HFA, with a concomitant decrease in their number.
At seizure onset, low-amplitude high-frequency activity very rapidly converts into high-amplitude low-frequency ictal discharges. We show that this transition is characterized by the spatial expansion of synchrony and the coalescence of local areas of synchronization. Other evidence shows that seizure generation requires recruitment of critical “minimal mass” of neuronal population (Fox et al., 2007). During the seizure, CA1 behaves as one hypersynchronous population of neurons with an associated dramatic drop in systems complexity, which confirms that, during seizures, the system behaves as a more compact process.
Immediately preceding seizure onset, CA1 is in a highly excitable state susceptible to being recruited into seizure activity and sensitive to small perturbations. Application of brief electrical fields revealed increased sensitivity to external stimuli. Fields of 2–4 V/m were capable of triggering seizures. Under normal conditions, these field intensities are harmless: fields 20–40 times stronger are required to evoke epileptic activity, which does not persist beyond the stimulus (Bikson et al., 2004). A variety of weak external perturbations can trigger seizures under these conditions (our observations and those of Yaari et al., 1986), as long as they have depolarizing and/or synchronizing actions. These preictal states of low seizure threshold will also be susceptible to endogenous perturbations, which may provide the actual trigger for the seizure: their diversity would contribute to the unpredictability of seizure initiation.
Buildup in HFA has been reported, but not investigated in detail, in conditions of intact synaptic activity in both humans (Worrell et al., 2004; Khosravani et al., 2009) and experimental models (Khosravani et al., 2005). The nonsynaptic processes described above remain active in these models but are modulated by synaptic activity in ways that modify the dynamics of the preictal state (Dzhala and Staley, 2003) and transition to seizure. Nonsynaptic mechanisms are sufficient to cause seizures in synaptic models, such as slices exposed to elevated potassium, because seizures can persist when synaptic activity is pharmacologically blocked (Jensen and Yaari, 1988). This is in agreement with our observation that buildup in HFA can be also observed in high-potassium model, and HFA shares morphological, spectral, and dynamical similarities with HFA observed in low-calcium model.
Epileptic seizures appear abruptly at the macroscopic scale, but closer investigation can reveal that the transition from the physiological interictal state to the pathophysiological seizure state is through a preictal period of the kind reported here. Seizures depend of a wide variety of cellular, molecular, and other mechanisms involving modulation of glutamatergic synaptic transmission, failure of inhibition or depolarizing inhibitory potentials, etc. Such a variety of mechanisms may help explain why many epilepsies are hard to treat pharmacologically by drugs targeting only one mechanism. Moreover, many of these mechanisms depend on, or are promoted by, increased neuronal firing (Prince and Wilder, 1967; Traub et al., 1993, 1994, 1995; Staley, 2004; Wong et al., 2005). The increased and abundant neuronal firing and synchrony preceding seizure onset reported here would engage those mechanisms. Therefore, suppressing the preictal state described here would abolish the cascade of changes responsible for transition to seizure, which makes the preictal state the more attractive target for novel treatments than the seizures themselves.
Footnotes
This work was supported by Epilepsy Research UK Grants A0702 and A0937 (J.G.R.J., P.J.), Wellcome Trust Grant 074771 (J.G.R.J., A.D.P.), and Institutional Research Plan AV0Z10300504 (M.P.). We thank the reviewers for their valuable comments. P.J., A.D.P., M.V., and W.-C.C. conducted experiments. P.J., J.C., J.E.F., X.L., A.F.B., R.W.D., M.P., and J.G.R.J. performed data analyses. P.J., J.E.F., and J.G.R.J. wrote the manuscript. J.G.R.J. and J.E.F. supervised the project.
References
- Allen PJ, Fish DR, Smith SJ. Very high-frequency rhythmic activity during SEEG suppression in frontal lobe epilepsy. Electroencephalogr Clin Neurophysiol. 1992;82:155–159. doi: 10.1016/0013-4694(92)90160-j. [DOI] [PubMed] [Google Scholar]
- Bikson M, Fox JE, Jefferys JG. Neuronal aggregate formation underlies spatiotemporal dynamics of nonsynaptic seizure initiation. J Neurophysiol. 2003;89:2330–2333. doi: 10.1152/jn.00764.2002. [DOI] [PubMed] [Google Scholar]
- Bikson M, Inoue M, Akiyama H, Deans JK, Fox JE, Miyakawa H, Jefferys JG. Effects of uniform extracellular DC electric fields on excitability in rat hippocampal slices in vitro. J Physiol. 2004;557:175–190. doi: 10.1113/jphysiol.2003.055772. [DOI] [PMC free article] [PubMed] [Google Scholar]
- Bragin A, Engel J, Jr, Wilson CL, Vizentin E, Mathern GW. Electrophysiologic analysis of a chronic seizure model after unilateral hippocampal KA injection. Epilepsia. 1999;40:1210–1221. doi: 10.1111/j.1528-1157.1999.tb00849.x. [DOI] [PubMed] [Google Scholar]
- Bragin A, Wilson CL, Engel J., Jr Chronic epileptogenesis requires development of a network of pathologically interconnected neuron clusters: a hypothesis. Epilepsia. 2000;41(Suppl 6):S144–S152. doi: 10.1111/j.1528-1157.2000.tb01573.x. [DOI] [PubMed] [Google Scholar]
- Bragin A, Wilson CL, Almajano J, Mody I, Engel J., Jr High-frequency oscillations after status epilepticus: epileptogenesis and seizure genesis. Epilepsia. 2004;45:1017–1023. doi: 10.1111/j.0013-9580.2004.17004.x. [DOI] [PubMed] [Google Scholar]
- Bragin A, Azizyan A, Almajano J, Wilson CL, Engel J., Jr Analysis of chronic seizure onsets after intrahippocampal kainic acid injection in freely moving rats. Epilepsia. 2005;46:1592–1598. doi: 10.1111/j.1528-1167.2005.00268.x. [DOI] [PubMed] [Google Scholar]
- Csicsvari J, Hirase H, Czurkó A, Mamiya A, Buzsáki G. Oscillatory coupling of hippocampal pyramidal cells and interneurons in the behaving rat. J Neurosci. 1999;19:274–287. doi: 10.1523/JNEUROSCI.19-01-00274.1999. [DOI] [PMC free article] [PubMed] [Google Scholar]
- Draguhn A, Traub RD, Schmitz D, Jefferys JG. Electrical coupling underlies high-frequency oscillations in the hippocampus in vitro. Nature. 1998;394:189–192. doi: 10.1038/28184. [DOI] [PubMed] [Google Scholar]
- Dzhala VI, Staley KJ. Transition from interictal to ictal activity in limbic networks in vitro . J Neurosci. 2003;23:7873–7880. doi: 10.1523/JNEUROSCI.23-21-07873.2003. [DOI] [PMC free article] [PubMed] [Google Scholar]
- Fee MS, Mitra PP, Kleinfeld D. Automatic sorting of multiple unit neuronal signals in the presence of anisotropic and non-Gaussian variability. J Neurosci Methods. 1996;69:175–188. doi: 10.1016/S0165-0270(96)00050-7. [DOI] [PubMed] [Google Scholar]
- Fisher RS, Webber WR, Lesser RP, Arroyo S, Uematsu S. High-frequency EEG activity at the start of seizures. J Clin Neurophysiol. 1992;9:441–448. doi: 10.1097/00004691-199207010-00012. [DOI] [PubMed] [Google Scholar]
- Foffani G, Uzcategui YG, Gal B, Menendez de la Prida L. Reduced spike-timing reliability correlates with the emergence of fast ripples in the rat epileptic hippocampus. Neuron. 2007;55:930–941. doi: 10.1016/j.neuron.2007.07.040. [DOI] [PubMed] [Google Scholar]
- Fox JE, Bikson M, Jefferys JG. The effect of neuronal population size on the development of epileptiform discharges in the low calcium model of epilepsy. Neurosci Lett. 2007;411:158–161. doi: 10.1016/j.neulet.2006.10.021. [DOI] [PubMed] [Google Scholar]
- Grenier F, Timofeev I, Steriade M. Neocortical very fast oscillations (ripples, 80–200 Hz) during seizures: intracellular correlates. J Neurophysiol. 2003;89:841–852. doi: 10.1152/jn.00420.2002. [DOI] [PubMed] [Google Scholar]
- Haas HL, Jefferys JG. Low-calcium field burst discharges of CA1 pyramidal neurones in rat hippocampal slices. J Physiol. 1984;354:185–201. doi: 10.1113/jphysiol.1984.sp015371. [DOI] [PMC free article] [PubMed] [Google Scholar]
- Iasemidis LD, Sackellares JC, Zaveri HP, Williams WJ. Phase space topography and the Lyapunov exponent of electrocorticograms in partial seizures. Brain Topogr. 1990;2:187–201. doi: 10.1007/BF01140588. [DOI] [PubMed] [Google Scholar]
- Jefferys JG. Nonsynaptic modulation of neuronal activity in the brain: electric currents and extracellular ions. Physiol Rev. 1995;75:689–723. doi: 10.1152/physrev.1995.75.4.689. [DOI] [PubMed] [Google Scholar]
- Jefferys JG, Haas HL. Synchronized bursting of CA1 hippocampal pyramidal cells in the absence of synaptic transmission. Nature. 1982;300:448–450. doi: 10.1038/300448a0. [DOI] [PubMed] [Google Scholar]
- Jensen MS, Yaari Y. The relationship between interictal and ictal paroxysms in an in vitro model of focal hippocampal epilepsy. Ann Neurol. 1988;24:591–598. doi: 10.1002/ana.410240502. [DOI] [PubMed] [Google Scholar]
- Khosravani H, Pinnegar CR, Mitchell JR, Bardakjian BL, Federico P, Carlen PL. Increased high-frequency oscillations precede in vitro low-Mg seizures. Epilepsia. 2005;46:1188–1197. doi: 10.1111/j.1528-1167.2005.65604.x. [DOI] [PubMed] [Google Scholar]
- Khosravani H, Mehrotra N, Rigby M, Hader WJ, Pinnegar CR, Pillay N, Wiebe S, Federico P. Spatial localization and time-dependant changes of electrographic high frequency oscillations in human temporal lobe epilepsy. Epilepsia. 2009;50:605–616. doi: 10.1111/j.1528-1167.2008.01761.x. [DOI] [PubMed] [Google Scholar]
- Kloosterman F, Peloquin P, Leung LS. Apical and basal orthodromic population spikes in hippocampal CA1 in vivo show different origins and patterns of propagation. J Neurophysiol. 2001;86:2435–2444. doi: 10.1152/jn.2001.86.5.2435. [DOI] [PubMed] [Google Scholar]
- Konnerth A, Heinemann U, Yaari Y. Nonsynaptic epileptogenesis in the mammalian hippocampus in vitro. I. Development of seizurelike activity in low extracellular calcium. J Neurophysiol. 1986;56:409–423. doi: 10.1152/jn.1986.56.2.409. [DOI] [PubMed] [Google Scholar]
- Lachaux JP, Lutz A, Rudrauf D, Cosmelli D, Le Van Quyen M, Martinerie J, Varela F. Estimating the time-course of coherence between single-trial brain signals: an introduction to wavelet coherence. Neurophysiol Clin. 2002;32:157–174. doi: 10.1016/s0987-7053(02)00301-5. [DOI] [PubMed] [Google Scholar]
- Lehnertz K, Elger CE. Spatio-temporal dynamics of the primary epileptogenic area in temporal lobe epilepsy characterized by neuronal complexity loss. Electroencephalogr Clin Neurophysiol. 1995;95:108–117. doi: 10.1016/0013-4694(95)00071-6. [DOI] [PubMed] [Google Scholar]
- Li X, Cui D, Jiruska P, Fox JE, Yao X, Jefferys JG. Synchronization measurement of multiple neuronal populations. J Neurophysiol. 2007a;98:3341–3348. doi: 10.1152/jn.00977.2007. [DOI] [PubMed] [Google Scholar]
- Li X, Yao X, Fox J, Jefferys JG. Interaction dynamics of neuronal oscillations analysed using wavelet transforms. J Neurosci Methods. 2007b;160:178–185. doi: 10.1016/j.jneumeth.2006.08.006. [DOI] [PubMed] [Google Scholar]
- Litt B, Lehnertz K. Seizure prediction and the preseizure period. Curr Opin Neurol. 2002;15:173–177. doi: 10.1097/00019052-200204000-00008. [DOI] [PubMed] [Google Scholar]
- Lopes da Silva F. Epilepsy as a disease of the dynamics of neuronal networks: models and predictions. In: Schelter B, Timmer J, Schulze-Bonhage A, editors. Seizure prediction in epilepsy: from basic mechanisms to clinical applications. Weinheim, Germany: Wiley-VCH Verlag; 2008. pp. 97–107. [Google Scholar]
- Mormann F, Andrzejak RG, Elger CE, Lehnertz K. Seizure prediction: the long and winding road. Brain. 2007;130:314–333. doi: 10.1093/brain/awl241. [DOI] [PubMed] [Google Scholar]
- Palus M. On entropy rates of dynamical systems and Gaussian processes. Phys Lett A. 1997;227:301–308. [Google Scholar]
- Prince DA, Wilder BJ. Control mechanisms in cortical epileptogenic foci. “Surround” inhibition. Arch Neurol. 1967;16:194–202. doi: 10.1001/archneur.1967.00470200082007. [DOI] [PubMed] [Google Scholar]
- Sackellares JC. Seizure prediction. Epilepsy Curr. 2008;8:55–59. doi: 10.1111/j.1535-7511.2008.00236.x. [DOI] [PMC free article] [PubMed] [Google Scholar]
- Schmitz D, Schuchmann S, Fisahn A, Draguhn A, Buhl EH, Petrasch-Parwez E, Dermietzel R, Heinemann U, Traub RD. Axo-axonal coupling. a novel mechanism for ultrafast neuronal communication. Neuron. 2001;31:831–840. doi: 10.1016/s0896-6273(01)00410-x. [DOI] [PubMed] [Google Scholar]
- Staley KJ. Role of the depolarizing GABA response in epilepsy. Adv Exp Med Biol. 2004;548:104–109. doi: 10.1007/978-1-4757-6376-8_8. [DOI] [PubMed] [Google Scholar]
- Traub RD, Miles R, Jefferys JG. Synaptic and intrinsic conductances shape picrotoxin-induced synchronized after-discharges in the guinea-pig hippocampal slice. J Physiol. 1993;461:525–547. doi: 10.1113/jphysiol.1993.sp019527. [DOI] [PMC free article] [PubMed] [Google Scholar]
- Traub RD, Jefferys JG, Whittington MA. Enhanced NMDA conductance can account for epileptiform activity induced by low Mg2+ in the rat hippocampal slice. J Physiol. 1994;478:379–393. doi: 10.1113/jphysiol.1994.sp020259. [DOI] [PMC free article] [PubMed] [Google Scholar]
- Traub RD, Colling SB, Jefferys JG. Cellular mechanisms of 4-aminopyridine-induced synchronized after-discharges in the rat hippocampal slice. J Physiol. 1995;489:127–140. doi: 10.1113/jphysiol.1995.sp021036. [DOI] [PMC free article] [PubMed] [Google Scholar]
- Wilson MA, McNaughton BL. Dynamics of the hippocampal ensemble code for space. Science. 1993;261:1055–1058. doi: 10.1126/science.8351520. [DOI] [PubMed] [Google Scholar]
- Wong RK, Bianchi R, Chuang SC, Merlin LR. Group I mGluR-induced epileptogenesis: distinct and overlapping roles of mGluR1 and mGluR5 and implications for antiepileptic drug design. Epilepsy Curr. 2005;5:63–68. doi: 10.1111/j.1535-7597.2005.05207.x. [DOI] [PMC free article] [PubMed] [Google Scholar]
- Worrell GA, Parish L, Cranstoun SD, Jonas R, Baltuch G, Litt B. High-frequency oscillations and seizure generation in neocortical epilepsy. Brain. 2004;127:1496–1506. doi: 10.1093/brain/awh149. [DOI] [PubMed] [Google Scholar]
- Yaari Y, Konnerth A, Heinemann U. Nonsynaptic epileptogenesis in the mammalian hippocampus in vitro. II. Role of extracellular potassium. J Neurophysiol. 1986;56:424–438. doi: 10.1152/jn.1986.56.2.424. [DOI] [PubMed] [Google Scholar]