

Abstract
In Parkinson's disease (PD), the oscillatory activity recorded from the basal ganglia shows dopamine-dependent changes. In the “off” parkinsonian motor state, there is prominent activity in the beta band (12–30 Hz) that is mostly attenuated after dopaminergic therapy (“on” medication state). The on state is also characterized by activity in the gamma (60–80 Hz) and high-frequency (300 Hz) bands that is modulated by movement. We recorded local field potentials from a group of 15 PD patients (three females) treated with bilateral deep brain stimulation of the subthalamic nucleus, using a high sampling rate (2 kHz) and filters suitable to study high-frequency activity (0.3–1000 Hz). We observed high-frequency oscillations (HFOs) in both the off and on motor states. In the off state, the amplitude of the HFOs was coupled to the phase of the abnormal beta activity. The beta-coupled HFOs showed little or even negative movement-related changes in amplitude. Moreover, the degree of movement-related modulation of the HFOs correlated negatively with the rigidity/bradykinesia scores. In the on motor state, the HFOs were liberated from this beta coupling, and they displayed marked movement-related amplitude modulation. Cross-frequency interactions between the phase of slow activities and the amplitude of fast frequencies have been attributed an important role in information processing in cortical structures. Our findings suggest that nonlinear coupling between frequencies may not only be a physiological mechanism (as shown previously) but also that it may participate in the pathophysiology of parkinsonism.
Introduction
Neuronal oscillations are a key feature of human brain activity. These oscillations exhibit large variability in amplitude and recurrence, extending up to frequencies >500 Hz (Buzsáki and Draguhn, 2004). Oscillatory activity participates in many brain processes, including motor, cognitive, and perception tasks, facilitating network integration (Singer, 1993; Farmer, 1998; Varela et al., 2001).
Surgical treatment of Parkinson's disease (PD) offers the opportunity to record oscillatory activity from different nuclei in the basal ganglia (BGs) through the stimulators implanted to treat the motor symptoms of the disease. In this way, clear differences can be observed in the power spectrum of the local field potentials (LFPs) recorded in the subthalamic nucleus (STN) of PD patients in the “off” (without medication) and “on” (after dopaminergic treatment) motor states (Priori et al., 2004). At rest, without medication, exaggerated oscillatory activity in the beta range (10–30 Hz) dominates the spectrum. Dopaminergic treatment attenuates the abnormal beta activity in parallel with motor improvement (Brown, 2003; Gatev et al., 2006). In some cases, the on state is also characterized by a power increase in the theta range, which is associated to the presence of levodopa-induced dyskinesias (Alonso-Frech et al., 2006), as well as by activity in the gamma range (55–100 Hz) (Brown et al., 2001). The presence of a high-frequency activity peak (300 Hz) in the STN has also been described in PD patients under the effect of dopaminergic treatment (Foffani et al., 2003). Since this activity was not detected in the off-medication state, it was proposed that the loss of these high-frequency oscillations (HFO) might fulfill a role in the pathophysiology of PD.
There are many reports of oscillations >100 Hz in different cortical areas (Buzsáki et al., 1992; Canolty et al., 2006), although in the human BGs they have only been identified in the STN (Foffani et al., 2003; Kane et al., 2009) and nucleus accumbens (Cohen et al., 2009). Two recent studies described frequency interactions in STN LFP recordings from off PD patients measuring correlations in the beta band (Priori et al., 2004), or by using the bispectrum to detect cross-frequency interactions at low frequencies (0–40 Hz) (Marceglia et al., 2006). The studies involving cross-frequency interactions between the phase of slow activities and the amplitude of fast frequencies suggest they have a physiological role in facilitating the transient coordination of cortical areas (Canolty et al., 2006), in visual perception (Lakatos et al., 2008), or during task decision making (Tort et al., 2008).
Here, we studied HFO (∼300 Hz) in both motor states (off and on) recorded from the STN of PD patients treated with bilateral deep brain stimulation (DBS). We found cross-frequency interactions between beta and HFO at rest, with different properties depending on the motor state. These interactions affected the movement-related changes in the HFO and correlated with rigidity and bradykinesia scores.
Materials and Methods
Subjects
A total of 15 PD patients treated with bilateral DBS of the STN participated in the study. All of them were right-handed according to the Oldfield inventory. The study was approved by the institutional ethical committee, and each patient gave their written informed consent. All patients were assessed preoperatively in the off motor state and in the on motor state according to the CAPSIT (Core Assessment Program for Surgical Interventional Therapies) protocol for surgical treatment of PD. Their clinical details are given in Table 1.
Table 1.
Clinical characteristics of the PD patients
| Patient | Age | Gender | Disease duration (years) | UPDRS off | UPDRS on | l-DOPA dose per day | Contacts R/L | Motor states studied |
|---|---|---|---|---|---|---|---|---|
| P1 | 45 | M | 3 | 33 | 21 | a | 0–1 | Both |
| 0–2 | ||||||||
| P2 | 65 | M | 18 | 33 | 8 | 1725 | 2 | Off |
| 1 | ||||||||
| P3 | 62 | F | 20 | 52 | 23 | 1570 | 2 | Off |
| 2 | ||||||||
| P4 | 58 | M | 17 | 62 | 24 | 1430 | 1–2 | Both |
| 0–3 | ||||||||
| P5 | 58 | M | 19 | 27 | 3 | 900 | 1–3 | Both |
| 2 | ||||||||
| P6 | 55 | M | 10 | 42 | 19 | 1600 | 1 | Both |
| 1–3 | ||||||||
| P7 | 60 | M | 11 | 30 | 10 | 1925 | 2 | Both |
| 3 | ||||||||
| P8 | 59 | M | 11 | 34 | 15 | 875 | 1–2 | Both |
| 1–2 | ||||||||
| P9 | 54 | M | 10 | 55 | 23 | 1605 | 2–3 | Both |
| 1–3 | ||||||||
| P10 | 67 | F | 10 | 45 | 15 | 1275 | 2–1 | Both |
| 2–1 | ||||||||
| P11 | 67 | M | 13 | 27 | 13 | 500 | 3 | Both |
| 3 | ||||||||
| P12 | 67 | M | 10 | 33 | 10 | 1000 | 1 | On |
| 1 | ||||||||
| P13 | 47 | M | 12 | 44 | 17 | 875b | 2–0 | Both |
| 1–3 | ||||||||
| P14 | 59 | M | 11 | 34 | 21 | 525b | 1–3 | Both |
| 1 | ||||||||
| P15 | 55 | F | 7 | 27 | 14 | 1615 | 2–3 | Both |
| 3 |
The UPDRS scores are the motor subscale scores (UPDRS-III) before surgery. The l-DOPA dose includes the equivalent dose of all dopaminergic drugs taken by each patient in milligrams per day (100 mg of standard levodopa = 130 mg of controlled-released levodopa = 10 mg of bromocriptine = 1 mg of pergolide = 1 mg of lisuride = 1 mg of pramipexole = 5 mg of ropinirole). The contacts used for final programming in each patient are indicated in the last column.
aSustained dopaminergic treatment was suppressed at the time of surgery because of gastrointestinal intolerance.
bThe patient was also given continuous apomorphine infusion of a total dose of ∼100 mg/d.
Surgical procedure
An image fusion procedure (iPlan 2.6; BrainLAB) was used to obtain the stereotactic coordinates for surgery. The day before surgery, the patients were submitted to 1.5 tesla magnetic resonance imaging (MRI). After the placement of the CRW frame under local anesthesia (Cosman–Robert–Wells; Radionics), computerized tomography was performed with the PD patients in the off condition, and these data were fused with the previous MRI. Coordinates for the STN were determined from T2-weighted MRI images in axial planes with the target usually placed 4–6 mm below and 11–13 mm lateral to the intercommissural line, and 2–3 mm posterior to the mid-intercommissural point. The motor region of the STN was defined intraoperatively by microrecording (200–600 KΩ platinum/iridium FHC microelectrodes) and microstimulation. These surgical techniques have been performed routinely by our group for several years, and more details of the procedure can be found elsewhere (Guridi et al., 2000; Rodríguez-Oroz et al., 2001).
A Medtronic 3389 electrode (four active contacts: 7.5 mm active, 1.5 mm × 4 contacts with 0.5 mm × 3 intervals) was placed at the selected coordinates in the STN with the most ventral contact (contact 0) placed in the ventral part of the nucleus. A clinical assessment of the efficacy and adverse effects of DBS was performed intraoperatively before securing the electrode in the chosen position. Subsequently, the electrode was fixed with a burr hole ring and cap, and it was connected to percutaneous connectors with extension wires that exit through a small incision in the skin. The correct placement of the electrodes was corroborated in all subjects by postoperative MRI (Fig. 1). After the intervention, the patients' off Unified Parkinson's Disease Rating Scale (UPDRS) motor subscale score was reduced by a mean of 61.5% (SD, 14.3%) under the effect of bilateral stimulation (135–185 Hz; 2.5–4.5 V; 60–90 μs), in general agreement with our standard results (Rodríguez-Oroz et al., 2004, 2005).
Figure 1.

Axial T1 section and parasagittal MRI reconstruction showing the correct placement of the DBS in the STN of a representative patient (patient 15).
Clinical assessment
Bradykinesia, rigidity, and tremor were assessed preoperatively (1–3 d before surgery) in both motor states (off and on) using the motor section of the UPDRS-III. The off and on pharmacological states were defined, respectively, as the motor scores after 12 h without medication, and the maximum improvement after a dose of levodopa equal to 150% of the usual first morning dose. Bradykinesia was calculated by considering the UPDRS subitems 23–26 (finger tap, opening and closing hand movements, rapidly alternating prone and supine hand movements, and leg movements), rigidity was the sum of the UPDRS subitem 22 (neck, arms, and legs), and tremor was the sum of subitem 21.
Recording procedure and data acquisition
Signals were recorded 4–5 d after the initial surgery to situate the electrodes and before the second operation to internalize the connections to the stimulating device. STN field potentials were recorded by connecting the different leads of the wire corresponding to each contact on the electrode to differential amplifiers using a custom-made cable and a sequential bipolar montage, giving a total of three channels per side (0–1, 1–2, and 2–3: 0 being the most ventral contact). The STN bipolar signal was filtered at 0.3–1000 Hz, amplified 50,000-fold (Digitimer C-150), sampled at a frequency of 2000 Hz, and stored in a personal computer using Spike2 software and a CED 1401 plus analog-to-digital converter (Cambridge Electronic Design).
In addition, the right extensor carpi radialis surface EMG from the patient was simultaneously recorded, filtered at 0.3–1000 Hz, amplified 5000-fold (Grass IP511 amplifiers; Astro-Med), and stored at the same sampling frequency (2000 Hz).
Twelve PD patients were first studied in the off motor state after overnight withdrawal of medication. Subsequently, they were given their usual morning dose of l-DOPA and studied again during the transition to the on motor state, as well as in the on motor state. In addition, two PD patients were only studied in the off state and one PD patient was studied only in the on state. Thus, a total of 14 patients were studied in the off state and 13 in the on state.
Recordings at rest.
The patients were instructed to stay awake, relaxed, and with their eyes open, and to avoid voluntary movements during the initial 10 min of the recording (in the off state), as well as during a 10 min period after reaching the on motor state. They were also instructed to stay relaxed with their eyes open during the motor state transition, although some degree of movement was allowed for the sake of comfort. Signals were recorded continuously with Spike2 software during the rest periods and the motor state transition. Two 5 min segments of off and on resting activity were selected off-line for additional analyses (see below).
Recordings during movement execution.
After the rest periods, each patient was instructed to perform self-initiated right wrist extensions, with a minimum intermovement interval of 6 s. The recording procedure was similar to that used in the resting condition, and it was repeated in the off and on motor states. After the recording, we performed off-line automatic triggering over the EMG signals to obtain segments centered around movement onset. The trigger was carefully chosen individually after a detailed review of each surface EMG signal, and different levels were selected for different segments of the file if necessary. The files were segmented in 4 s sweeps, 2 s premovement onset, and the other 2 s postmovement onset. All sweeps were reviewed individually to exclude those with visible artifacts or bad triggering (where the trigger could not be located at the beginning of the movement). A more detailed description of the triggering/segmentation procedure can be found in the study by Alegre et al. (2005). The minimal number of artifact-free sweeps per subject and motor state was 24 (mean, 58; SD, 23).
Signal analysis
All analyses were performed using Matlab 7.7 software (Mathworks).
Power spectrum analysis.
Time-evolving power spectra of STN channels were estimated for all the patients in each motor state (“off,” “off-to-on transition,” and “on”), using the fast Fourier transform with blocks of 4096 samples, a Hanning window, and a 75% overlap, until the whole recording was analyzed. The transforms obtained offered a resolution of ∼0.5 Hz and 1 s. This way, we obtained for each patient, state, hemisphere, and channel, a visualization of the frequency distribution and the temporal evolution of the oscillatory activity.
After reviewing the recordings, 300 s rest segments were selected for each patient in the off and on motor states. To characterize the frequency components of these signals, we estimated the Welch periodogram (Welch, 1967) using a fast Fourier transform of 4096 samples and a Hanning window, to achieve a resolution of ∼0.5 Hz per bin. In these spectra, we measured the peak frequency of the different relevant bands (low beta, high beta, and HFO) and the relative power of these bands, calculating a ratio between the peak power and the power of the adjacent spectrum. The choice of relative power values instead of absolute power values was because of the high intersubject variability in baseline power values in the HFO range.
Power changes in the movement execution recordings were studied by means of the Stockwell transform (ST) (Stockwell et al., 1996), which is a complex transformation that gives an accurate estimate of the time-varying energy and phase of the signal analyzed in a selected time–frequency window of interest. The ST is suitable for our study because it provides a unique time–frequency representation of a signal by adapting the Fourier transform to analyze a localized signal, using frequency-dependent time-scaling windows, thereby allowing us to study a wide range of frequencies (specifically 5–400 Hz, setting the width factor of the localizing Gaussian to a value of 9). In fact, the ST is a short-time Fourier transform with scalable Gaussian windows that provides a frequency-dependent resolution. Averaging the magnitude of single-sweep ST gives an estimate of the power spectrum variations during the time period studied, considering only the changes in amplitude and excluding the influence of the phase. With that aim, the complex coefficients, S(t,f), were obtained for every single sweep. Then, their absolute value was squared to obtain power values, and finally these were averaged across the different sweeps. If represented as an image scale plot, this transform gives a complete picture of the time evolution of the power spectrum of the signal.
Where we detected high-frequency oscillations, we displayed that particular frequency band linearly to measure and quantify the relative power variation with movement. The transforms obtained were also normalized using the activity over the first 500 ms of the image as the baseline, to build a grand average representation.
Cross-frequency interactions analysis.
In first place, we studied potential modulations in the amplitude of the HFOs by computing the power spectrum of their amplitude envelope. This amplitude envelope was obtained by applying the Hilbert transform on the bandpass-filtered signal.
To detect and quantify the possible cross-frequency interactions between different frequency bands, we computed a modulation index (MI), which allowed us to measure the phase-to-amplitude modulation between two frequency ranges of interest. This index has been described previously (Canolty et al., 2006; Tort et al., 2008) and is calculated as follows. Briefly, the raw data are bandpass filtered in the two frequency intervals of interest: a low-frequency band and a higher-frequency range. Then, the instantaneous phase is extracted from the low-frequency filtered data, and the instantaneous amplitude envelope is extracted from the high-frequency filtered data by applying the Hilbert transform. Next, the coupling between the low-frequency phase and high-frequency amplitude envelope is determined. This is done by computing the entropy of the distribution of the instantaneous amplitude envelope for every 20° interval of the instantaneous phase. Finally, entropy values are normalized by the maximum entropy value, that of a uniform distribution, giving the MI [MI = (Hmax − H)/Hmax]. When the MI value is 0, there is no phase-to-amplitude modulation, whereas larger MI values arise from stronger modulation. In this study, we calculated the MI for multiple pairs of frequencies, and we represented the values obtained in an image scale plot. Specifically, we calculated the phase signal filtering the raw signal from 10 to 30 Hz in 1 Hz steps with 2 Hz bandwidth, and the amplitude signal filtering from 200 to 400 Hz in 2 Hz steps with 4 Hz bandwidth. Only the statistically significant values of the index were represented in the MI diagrams. To determine the significance threshold value, we computed a distribution of 200 surrogate data for each pair of frequencies by adding a temporal random offset to the amplitude signal. Assuming that the surrogate data follow a normal distribution, if we use a p value of 0.01 and apply the Bonferroni correction for multiple comparisons, we get the significance threshold value.
Movement-related changes in the MI were studied by selecting 1 s fragments in two different conditions from all the trials: premovement (time interval, −1.9 to −0.9 s) and during movement execution (time interval, 0–1 s). The value of the MI was calculated as explained above with the following exception: to obtain the significance threshold value, we computed a distribution of 200 surrogate data for each pair of frequencies by randomizing the relationship between the amplitude signal of one trial and the phase signal of a different random trial. Again, assuming that the surrogate data follow a normal distribution, we used a p value of 0.01 and applied the Bonferroni correction for multiple comparisons to get the significance threshold value.
Segments of the raw signal were also averaged centered on the peaks of the high-frequency activity, with the requirement of a minimum 100 ms separation between peaks to avoid selecting more than one peak in a beta cycle (Tort et al., 2008). A similar result can be obtained by averaging segments of the raw signal centered on those high-frequency activity peaks showing amplitude values higher than a trigger level, set on the mean amplitude plus 2 SDs. Although both methods offered similar results, the figures of this paper were calculated using the first method because the visualization of the HFOs was better.
We also calculated time–frequency plots of the mean normalized power of the high-frequency activity time-associated to the phase minimums of the beta activity. This method was described by Canolty et al. (2006), and it averages fragments of the normalized amplitudes, squared element-wise, of the filtered high-frequency activity centered at the phase minimums of the beta activity. In the off state, the phase minimums of the filtered low-beta activity were used as triggers, whereas in the on state the phase minimums were extracted from the filtered high-beta activity. The frequencies of the beta filtering were derived from the results of the previous analysis (HFO peak-centered average).
Statistics
Statistical analyses were performed using SPSS 15.0 for Windows (SPSS). To assess the statistical significance of our results, we used nonparametric tests, the Wilcoxon test for paired samples, and the Mann–Whitney U test for unpaired samples. Correlations between different clinical and neurophysiological variables (those indicated in Table 2 plus UPDRS scores for tremor) were performed using a bivariate correlation for nonparametric data (Spearman's correlation), as most of the neurophysiological variables involved did not follow a normal distribution. Finally, once the normality of the dependent variables (clinical scores) was confirmed, the degree of prediction that the different variables offered for the UPDRS scores for tremor, bradykinesia, and rigidity was assessed using a multiple linear regression analysis with backward elimination. In this procedure, all independent variables are initially entered into the model. At each step, the variable with the largest probability-of-F value is removed, provided that the value is larger than the preestablished removal p value (p = 0.1). The equation is recomputed without the variable and the process is repeated until no more independent variables can be removed. The residuals of the model followed a normal distribution.
Table 2.
Spearman's correlations between clinical and neurophysiological parameters
| Parameters | Low-beta power | HFO power | Rest MI | Mov.-rel. changes MI | Mov.-rel. changes HFO power | UPDRS (B&R) |
|---|---|---|---|---|---|---|
| Low-beta power | — | 0.722** | 0.756** | −0.110 | −0.186 | 0.428* |
| p < 0.001 | p < 0.001 | p = 0.626 | p = 0.384 | p = 0.029 | ||
| N = 26 | N = 22 | N = 22 | N = 24 | N = 26 | ||
| HFO power | 0.722** | — | 0.752** | −0.163 | −0.347 | 0.498** |
| p < 0.001 | p < 0.001 | p = 0.470 | p = 0.097 | p = 0.01 | ||
| N = 26 | N = 22 | N = 22 | N = 24 | N = 26 | ||
| Rest MI | 0.756** | 0.752** | — | −0.147 | −0.097 | 0.493* |
| p < 0.001 | p < 0.001 | p = 0.513 | p = 0.669 | p = 0.02 | ||
| N = 22 | N = 22 | N = 22 | N = 22 | N = 22 | ||
| Mov.-rel. changes MI | −0.110 | −0.163 | −0.147 | — | −0.440* | 0.117 |
| p = 0.626 | p = 0.470 | p = 0.513 | p = 0.041 | p = 0.604 | ||
| N = 22 | N = 22 | N = 22 | N = 22 | N = 22 | ||
| Mov.-rel. changes HFO power | −0.186 | −0.347 | −0.097 | −0.440* | — | −0.493* |
| p = 0.384 | p = 0.097 | p = 0.669 | p = 0.041 | p = 0.014 | ||
| N = 24 | N = 24 | N = 22 | N = 22 | N = 24 | ||
| UPDRS (B&R) | 0.428* | 0.498** | 0.493* | 0.117 | −0.493* | — |
| p = 0.029 | p = 0.01 | p = 0.02 | p = 0.604 | p = 0.014 | ||
| N = 26 | N = 26 | N = 22 | N = 22 | N = 24 |
Significant correlations are highlighted in bold. Low-beta power, Relative power of the low-beta peak at rest; HFO power, relative power of the high-frequency (250–350 Hz) peak at rest; Rest MI, modulation index (cross-frequency coupling) at rest; Mov.-rel. changes MI, relative movement-related changes in the modulation index; Mov.-rel. changes HFO power, relative movement-related changes in HFO power; UPDRS (B&R), sum of the UPDRS-III scores for bradykinesia and rigidity.
*p < 0.05,
**p < 0.01.
Results
A total of 26 subthalamic nuclei from 14 patients were studied in the off state and 24 nuclei from 13 patients were studied in the on state. The recordings of two nuclei, both in the on and off state, were disregarded because of a low signal-to-noise ratio generated by technical issues that arose during the recording.
Rest analysis
Our analysis was focused on the two frequency bands that showed consistently spectral peaks in both the off and on motor states, albeit with different characteristics: high-frequency (250–350 Hz range) and beta oscillations (12–30 Hz, subdivided into low and high beta). In the on state, the power spectrum also displayed activity bands at frequencies in the theta range (4–8 Hz) in 10 of the 13 patients and in the high gamma range (55–100 Hz) in 3 of the 13 patients. However, none of these bands was present in the off state.
Characterization of the high-frequency band
At rest, in the off state, 13 of 14 patients showed a consistent band of high-frequency activity at the peak frequency of 265 ± 33 Hz (Fig. 2A, left; B). These HFOs were most likely generated locally in the STN and not volume-conducted from adjacent structures. Indeed, phase reversal could be observed in the filtered signals of two adjacent contact pairs (Fig. 3A,B) in 23 of 26 nuclei. The phase reversals were usually found at contact 2 (18 of 23). Also, the presence of these HFOs was well localized to the most dorsal contacts (Fig. 2C). The only patient that showed no HFO was predominantly tremoric with a UPDRS score in the lower range (P15) (see UPDRS scores in Table 1).
Figure 2.
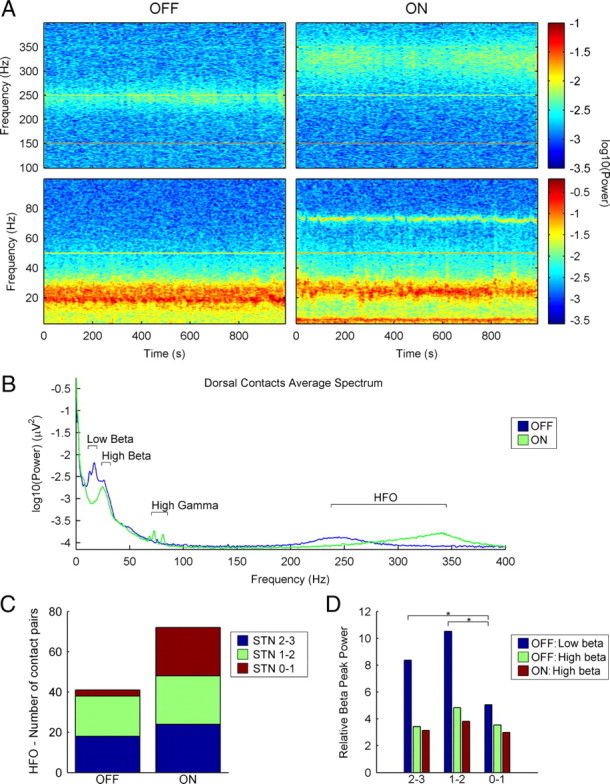
Subthalamic beta and HFOs in the off and on motor states have different characteristics. A, Temporal evolution of the power spectrum of patient 1 (left STN, dorsal contacts 2–3) in both motor states (off and on) during rest periods. The bottom images represent the 3–100 Hz frequency range and the top images represent the 100–400 Hz frequency range. Power values are shown in a logarithmic scale, adjusted for each frequency range. HFOs in the 250–350 Hz range can be observed in both motor states. The thin horizontal lines observed at 50, 150, 250, and 350 Hz are artifacts (at the mains frequency and its odd harmonics). B, Mean power spectrum (logarithmic scale) in the dorsal contact pairs (0–400 Hz), in both motor states (n = 22). The artifacts at mains frequency and its harmonics have been removed and replaced by interpolated values. Most differences between the on and off plots are centered in the beta, gamma, and HFO ranges. The off low-beta peak attenuates in the on state, whereas the high beta activity does not change. The small gamma differences observed are attributable to three subjects. A peak in the HFO range can be observed in both states, although at different frequencies. C, Topographical distribution of the HFOs in the whole group in both motor states (off and on). D, Comparison of the mean relative power values of low- and high-beta peaks in both motor states (off and on) in different contact pairs (*p < 0.05). All contact pairs were included in the analysis; 2–3 means dorsal contact pairs, 1–2 means intermediate contact pairs, and 0–1 means ventral contact pairs.
Figure 3.

A, Filtered LFP from a sample patient (patient 9) in the off motor state highlighting the phase reversal of the low-beta activity (right) and the HFOs (left) in the dorsal STN. B, Phase difference histogram (360 bins, 300 s segment) from the same patient showing the phase reversal around contact 2 in the HFOs. The mean phase difference between contact pairs 2–3 and 1–2 is ∼180° (π radians). The horizontal line indicates the mean level in an ideally random distribution. C, Phase difference histogram from the same patient and contact pairs showing the phase reversal in the low-beta activity around electrode 2 (same parameters as in B).
The transition from the off to on motor state was characterized by a sharp attenuation of the power in these oscillations. The HFO recovered gradually (between 40 and 120 s) after this sharp decrease, but in a higher frequency range and with a broader distribution (Figs. 2A, right; 4A). In the fully established on state, this band was evident in the 13 patients studied and it was detected homogeneously at all the contact pairs (Fig. 2B,C), with a peak frequency of 323 ± 19 Hz. In this state, phase reversals in HFOs were found in 23 of 24 nuclei with a uniform distribution across contacts, including 8 nuclei with two phase reversals at contacts 2 and 1. The peak frequency was significantly higher in the on state than in the off state (323 ± 19 Hz in on vs 265 ± 33 Hz in off; Mann–Whitney U, Z = 4.758; p < 0.001), whereas the relative peak power of this activity band was similar in both motor states (1.83 ± 0.98 in on vs 2.06 ± 1.02 in off; Mann–Whitney U, Z = 0.958; p = 0.349).
Figure 4.
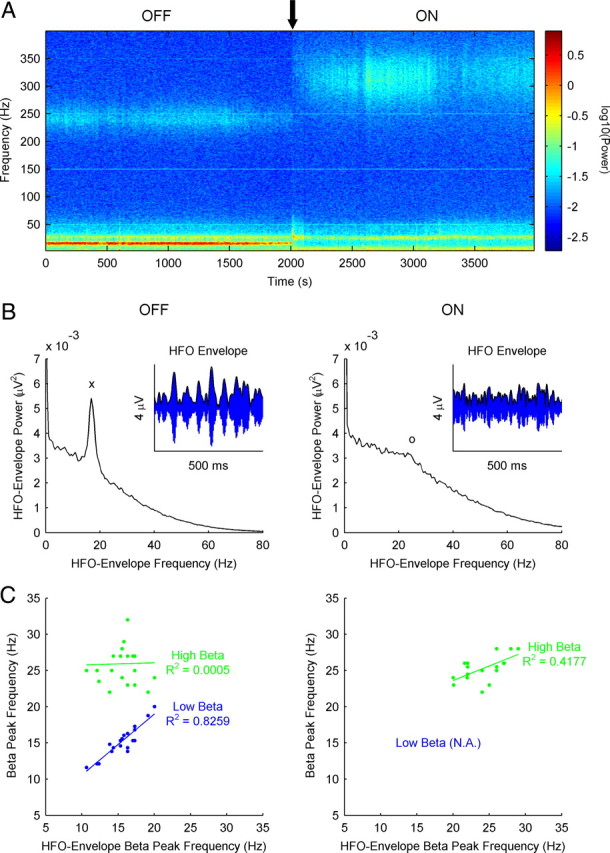
HFOs in the off motor state (but not in the on motor state) display amplitude modulation at the frequency of the low-beta power peak. A, Temporal evolution of the power spectrum from patient 11 (right STN, dorsal contacts 2–3) during the off-to-on transition (marked with a black arrow). Low-beta and HFO bands show a similar temporal pattern during the transition. B, Power spectrum of the envelope of the HFOs (variations in amplitude, as shown in the small insert) from the same patient and contacts (right STN, dorsal contacts 2–3) at rest in both motor states (off and on). A marked low-beta peak can be observed in the off motor state (marked with “x”), whereas in the on state there is a smaller and more diffuse high-beta increment (marked with “o”). C, Relationship between the frequency of both beta bands in the raw signal power spectrum (blue dots for low beta and green dots for high beta) and the frequency of the peak (characteristic scale) observed in the power spectrum of the HFO envelope, in the off (left) and on (right) states. In the off state, the highly significant linear correlation observed with the low-beta peak contrasts with the lack of correlation with the high-beta peak. In the on state, a smaller (but significant) correlation is observed in the high-beta range (there is no low-beta power peak in this motor state).
Characterization of the beta band
In all the patients studied, there were two different spectral peaks of oscillatory activity in the beta range of the power spectrum in the off state. One of these peaks was in the 12–20 Hz range (“low beta” band, mean frequency, 15.33 Hz; SD, 1.97 Hz), whereas the other peak was in the 20–30 Hz range (“high beta” band, mean frequency, 26.22 Hz; SD, 2.75 Hz). Phase reversals were observed both in low-beta and in high-beta activity in 21 of the 26 nuclei. The power of the low-beta activity was significantly higher in the most dorsal contacts when compared with the ventral ones (Wilcoxon's test: dorsal vs intermediate, Z = 1.384, p = 0.173; dorsal vs ventral, Z = 2.68, p = 0.004; intermediate vs ventral, Z = 3.215, p = 0.001), whereas the power of the high-beta band was similar in all contacts (Wilcoxon's test: dorsal vs intermediate, Z = 1.493, p = 0.141; dorsal vs ventral, Z = 0.571, p = 0.582; intermediate vs ventral, Z = 1.13, p = 0.269) (Fig. 2D). Accordingly, low-beta phase reversal was more frequent around contact 2, whereas phase reversal in high-beta activity was more frequent in contact 1 and even was double (in contacts 1 and 2 simultaneously) in five nuclei.
In the transition from the off to the on motor state, there was a sharp attenuation of the power in the low-beta band (Wilcoxon's test, Z = 4.015, p < 0.001), concomitant with the decrease in the HFOs (as commented above, see Fig. 4A), whereas the high-beta band remained invariant in power and topography (Wilcoxon's test off–on high-beta power comparison: dorsal contacts, Z = 0.795, p = 0.443; intermediate contacts, Z = 1.607, p = 0.113; ventral contacts, Z = 0.081, p = 0.949) (Fig. 2B,D). In contrast to the HFOs, the decrease in the low-beta activity that appeared in the off-to-on transition was sustained throughout the on state.
Cross-frequency interactions
The coincident temporal pattern of the low-beta activity and the HFOs during the off-to-on transition (Fig. 4A) and their similar topographic distribution in the off state led us to search for a relationship between these two frequency bands. Accordingly, we studied the power spectrum of the temporal evolution of the amplitude in the HFO. We found that, in the off state, the amplitude of the HFOs presented a characteristic scale (frequency peak in the power spectrum) within the low-beta range (Fig. 4B, left). No such characteristic scale was evident in the same spectrum in the on state, although some subjects showed increased power in the high-beta range (Fig. 4B, right). The presence of this scale implies that the amplitude of the HFO is modulated at frequencies within the beta range in the off state. We represented the frequency of both beta bands (low and high) against the frequency of the characteristic scale found in the spectrum of HFO amplitudes. In this way, we found a highly significant correlation between the frequency of the characteristic scale in the amplitude of the HFO and the peak frequency of the low-beta band in the off state (R2 = 0.8259; p < 0.001) (Fig. 4C, left), whereas in the on state there was just a weak correlation within the high-beta band (Fig. 4C, right).
To characterize the relationship between the low-beta and the HFO bands, we calculated a cross-frequency measure named the modulation index. This index allowed us to quantify the phase-to-amplitude modulation between two frequency bands of interest. We calculated this measure for multiple frequency pairs considering the phase in the 10–30 Hz range and amplitudes in the 200–400 Hz range. These different MI values were plotted as a color image.
In the off state, the images displayed very significant phase-to-amplitude modulation between the phase of the low-beta band and the amplitude of the HFO, particularly in the contact pairs in which the patients had clear high-frequency peaks (usually the most dorsal ones) (Fig. 5A). By contrast, this modulation was shifted from the low-beta to the high-beta band in the on state, and its magnitude was drastically reduced (Mann–Whitney U: Z = 2.327, p = 0.02). This small modulation appeared in all contact pairs, as the HFOs were detected homogeneously in all contact pairs in the on state (Fig. 5B). We used two complementary techniques to assess the coupling pattern: one based on averaging fragments of the HFO using the beta troughs as a trigger, whereas the other averaged fragments of the raw signal centered at the peaks of the HFOs. Qualitatively, both approaches showed that the HFO peaks appeared in the ascendant phase of the low-beta activity in the off state, whereas no clear relationship could be appreciated in the on state (Fig. 5C). Figure 5 shows the results from one side of patient P10 and the results from two other patients (P14 and P9) are shown in supplemental Figures 1 and 2 (available at www.jneurosci.org as supplemental material).
Figure 5.

Cross-frequency coupling between the phase of the low-beta activity and the amplitude of the HFOs at rest is evident in the off motor state. A, Phase to amplitude representations of the MI at rest in a representative patient (patient 10, left STN, contacts 2–3, 1–2, and 0–1), both in the off (top images) and on state (bottom images). All plots use the same scale. Please note that cross-frequency coupling is 2 orders of magnitude higher in the off state. B, Topographical distribution of MI values from the macroelectrode contact pairs in both motor states (off and on) showing the predominance in dorsal contact pairs in the off state (*p < 0.05). C, Two additional representations of the beta–HFO coupling in both motor states (patient 10, left STN, contact pair 2–3). Top, Average of 500 ms segments of the raw signal centered at the peaks of the HFO. The amplitude of the HFOs is greater during the valley and the ascending curve of the beta oscillations in the off state. This relationship is lost in the on state. Bottom, Mean normalized power of the 100–400 Hz range time-locked to the phase minimums of the beta activity.
Analysis of the movement-related changes
We averaged single-sweep Stockwell transforms to study the movement-related changes in the power of the oscillatory activity in the STN, optimizing the parameters for high-frequency activity. The study of the 0–100 Hz frequency range, although limited by the parameters selected, confirmed the results obtained by other groups (Doyle et al., 2005; Foffani et al., 2005; Devos et al., 2006). In the off state, the power in the beta range decreased from at least 1 s before movement until the end of the action. In the on state, there was also a beta decrease with a similar temporal pattern, together with an increase in the gamma range (Fig. 6A,B) (for another example, see also supplemental Fig. 3, available at www.jneurosci.org as supplemental material). When analyzing the high-frequency band, we found little or no movement-related power changes in the off state, whereas marked positive movement-related modulation of high-frequency power could be observed in the on state (Fig. 6A,B). The movement-related power increase in the HFOs showed a trend for higher values in the dorsal contact pairs when compared with the ventral ones (p = 0.1). The values obtained are displayed in Figure 6C (one contact pair for each nucleus), showing the significant differences between the off and on motor states (Mann–Whitney U: Z = 4.464, p < 0.001).
Figure 6.
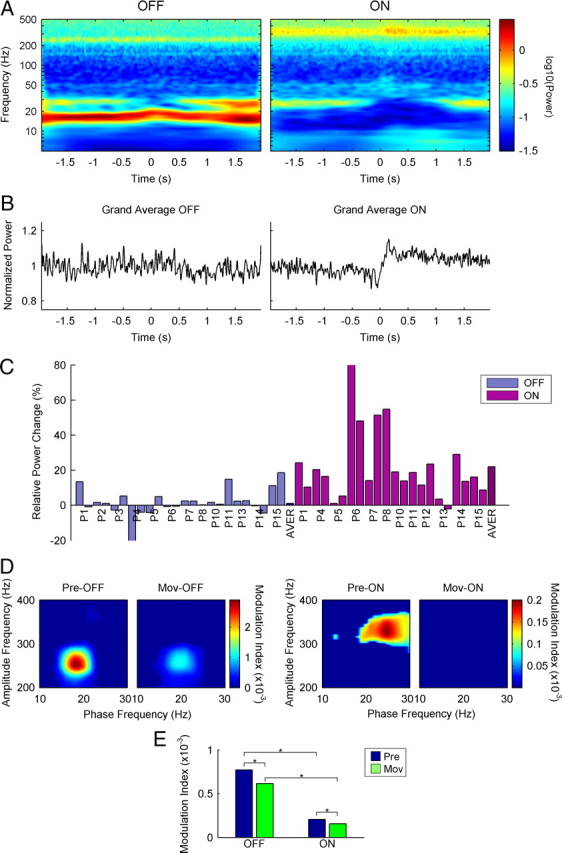
Movement-related changes in HFO power and beta–HFO coupling in both motor states. A, Average of the single-sweep Stockwell transforms of a sample patient (P14, left STN, intermediate contacts 1–2) in both motor states (off and on) during movement. Time 0 indicates the beginning of movement. A perimovement power increase in the HFO band (∼340 Hz) can only be observed in the on state. Please note the logarithmic scale in the y-axis. B, Linear representation from the whole group of patients of the normalized movement-related power changes in the HFO range in both motor states (off and on). Again, a perimovement power increase can only be observed in the on state. C, Bar diagram showing the relative movement-related power changes in all the nuclei studied in both motor states (off and on). In the on state, most nuclei show movement-related power increases, whereas in the off state the changes are mostly minimal or absent. D, Phase to amplitude representations of the MI values in premovement (Pre-) and perimovement periods (Mov-) from patient 14 (left STN, intermediate contacts 1–2). A perimovement decrease is observed in both motor states. However, off perimovement values are still much higher than on premovement values. E, Mean MI values premovement and perimovement in both motor states (off and on, *p < 0.05) showing that, regardless of the relative perimovement decrease, off values are still higher than on values.
We also studied the effect of movement on the beta–HFO coupling. There was a significant decrease in the MI in the off state (Wilcoxon's test: Z = 2.906, p = 0.003) together with a small shift in the phase frequency (Fig. 6D; supplemental Fig. 3, available at www.jneurosci.org as supplemental material), as the low-beta band frequency was modulated by movement (Foffani et al., 2005; Alegre et al., 2010). Despite this movement-related decrease, the magnitude of the MI was still highly significant. We also observed a decrease in the MI in the on state (Wilcoxon's test: Z = 3.558, p < 0.001), although both the “pre” and “during” movement indices were clearly higher in the off motor state than in the on state (Mann–Whitney U: off-pre vs on-pre, Z = 2.652, p = 0.007; off-mov vs on-mov, Z = 2.075, p = 0.038) (Fig. 6E).
Correlations with clinical parameters
Spearman's correlations were estimated for different clinical and neurophysiological parameters in the off motor state. Specifically, we analyzed the correlations between the relative power of the low beta and high frequency peaks at rest, the magnitude of the MI at rest, the movement-related power changes, the movement-related changes in the MI, and the sum of the UPDRS scores for bradykinesia/rigidity and tremor.
We found significant correlations between two of the neurophysiological measures at rest (low-beta power and HFO power) and between the two dynamic measures (the movement-related changes in the modulation index correlated with the relative movement-related power changes). The off UPDRS scores for bradykinesia and rigidity were significantly correlated with the three measures at rest (beta and HFO power, and MI) and with the relative movement-related power changes (Table 2). The multiple linear regression analysis included the rigidity and bradykinesia scores as dependent variables, and the other five parameters as independent variables. The relative movement-related change in power was the only variable that predicted independently the UPDRS scores for bradykinesia and rigidity in the off state (F = 8.777; p = 0.008) (Fig. 7). Backward elimination in the regression model did not show any significant additive effect for the remaining independent variables. No neurophysiological parameter was correlated with the tremor scores.
Figure 7.

Regression plot displaying the relationship between the movement-related changes in HFO power and the rigidity/bradykinesia scores.
Discussion
Our results show that in the off parkinsonian motor state, HFOs in the STN are coupled to the abnormal low-beta activity. The beta-coupled HFOs show no or even negative movement-related changes in amplitude. The “blockage” of the movement-related modulation of the HFO amplitude is correlated with the severity of the disease and, particularly, with rigidity/bradykinesia. In the on motor state, after l-DOPA administration, the HFOs are released from low-beta coupling and they show marked movement-related amplitude modulation.
Off and on subthalamic HFOs
Oscillations >100 Hz are commonly observed in the human cortex, and although initially considered a phenomenon related to epilepsy (Urrestarazu et al., 2007), it is now generally accepted that these oscillations may also have a physiological role (Engel et al., 2009). In fact, oscillations at frequencies as high as 600 Hz have been described during somatosensory stimulation in the cortex and thalamus (Gobbelé et al., 1998; Hashimoto, 2000). The HFOs permit a higher information load to be transmitted than slower oscillations, suggesting that they may indeed be important in brain processing (Foffani et al., 2003). The origin of such fast activity is not clear. Interneuronal activity has been proposed to be responsible for somatosensory-evoked cortical HFOs (Hashimoto et al., 1996; Curio, 2000), although this hypothesis cannot be applied to the motor STN, which is essentially void of interneurons (Lévesque and Parent, 2005). The individual neuronal firing rate in the off parkinsonian STN is ∼30 Hz (Rodríguez-Oroz et al., 2001) and does not increase in the on state (Levy et al., 2001). However, the emergence of faster oscillations could be explained by more complex mechanisms, such as the synchronized phase-shifted recruitment of STN cells, or reverberating activity of STN units because of intrinsic membrane properties (Jones et al., 2000; Foffani et al., 2003).
Foffani et al. (2003) described the presence of HFOs in the parkinsonian STN in the on state, and their modulation by movement. Interestingly, some of their patients also showed HFOs in the off state. Our results show that HFOs have similar amplitudes in both the off and on states, although they differ in frequency, topography, and beta coupling.
The frequency of HFOs in the off state was usually lower than in the on state, but not always (see supplemental Fig. 1, available at www.jneurosci.org as supplemental material). The off HFOs have a topographic distribution similar to the abnormal low-beta activity, and they are limited to dorsal contact pairs. The limited topographical distribution of the off HFO might explain their reduced presence in the study by Foffani et al. (2003), where only central or wide field contact pairs were used for the analysis. However, the HFOs are observed in all of the contact pairs in the on state with similar amplitude, more like the distribution of the high-beta activity. Despite the broader distribution of basal HFOs, movement-related changes were more marked in the more dorsal contact pairs, most likely located within the motor part of the nucleus.
Kane et al. (2009) described the presence of HFOs both in the thalamus (reticular nucleus) and the STN in intraoperative LFP recordings in PD patients. Dopaminergic stimulation increased the frequency of the HFOs in both structures (as in our results), but the power of the HFOs behaved differentially in the STN (with an increase) and the thalamus (decrease). A more detailed comparison with our study is difficult because of the different characteristics of the recordings (microelectrodes vs macroelectrodes) and analysis procedures.
Another issue that might explain the differences between our results and previous studies is the different time interval between the surgery and the recordings: 4–5 d in our study, 2–3 d in the study by Foffani et al. (2003), and none (intraoperative) in the study by Kane et al. (2009).
Low and high beta
A collateral but still interesting finding of our study was the clear separation of two different spectral peaks of beta activity in the parkinsonian STN. In the off state, there was a predominant peak within the low-beta band (12–20 Hz), together with a smaller peak in the high-beta band (20–30 Hz). The low-beta peak disappeared or was greatly reduced in the on motor state, whereas the high-beta peak remained at similar power. The topography of both peaks was different as the low-beta activity in the off state was clearly restricted to dorsal contact pairs, whereas the high-beta peak had a more widespread distribution through the STN in both motor conditions. Our results, therefore, indicate that low- and high-beta activities may have a different functional meaning, as previously suggested (Priori et al., 2004; Marceglia et al., 2006, 2007).
Beta–HFO coupling
Nonlinear coupling between different frequencies has been described as a physiological mechanism in sensory processing and memory circuits (Canolty et al., 2006; Lakatos et al., 2008; Tort et al., 2008; Cohen et al., 2009). Our results suggest that this coupling may also have a pathophysiological implication when exaggerated. In the on motor state, as well as in the off motor state of less affected patients, slight coupling between the HFOs and the high-beta band is observed (1 or 2 orders of magnitude lower). This suggests that beta–HFO coupling may be a physiological mechanism in motor control in the basal ganglia that becomes pathologically exaggerated (100-fold) in Parkinson's disease, thereby blocking high-frequency amplitude modulation. Despite the significant coupling between beta activity and the HFOs, there was no direct relationship between the frequency of the beta peak and the frequency of the HFOs, neither in the off or on state. This finding confirms that the cross-frequency coupling is a complex nonlinear phenomenon that needs to be studied with specific tools.
Correlation with motor signs
Recent studies have shown a positive correlation between the relative amplitude of the off subthalamic beta oscillations and the improvement in the bradykinesia/rigidity UPDRS scores after dopaminergic treatment in PD patients (Kühn et al., 2006, 2009). Our patients showed positive correlation of the bradykinesia/rigidity off scores with the beta amplitude, but also with the HFO amplitude (with similar r values), and with the MI. The correlation was also significant, but negative, with the amplitude modulation of the HFOs. In the linear regression analysis, the amplitude modulation of the HFOs was the only significant independent variable. Although the linear association found does not imply causality, this result suggests that the parameter most closely related to bradykinesia and rigidity is the impairment of movement-related amplitude modulation of the HFOs. The correlation of the amplitude to the off beta oscillations might therefore be attributable to their “blocking” effect on the movement-related HFO modulation. This idea is also supported by the inverse relationship between the movement-related changes in the MI and the movement-related changes in HFO power. Accordingly, an interesting hypothesis might be to consider that an abnormal beta rhythm “blocks” the HFOs present in the STN (and perhaps also in other parts of the motor circuit), preventing any movement-related change. Thus, the lack of the movement-related HFOs might be involved in the generation of bradykinesia. Admittedly, this hypothesis remains to be confirmed. Indeed, from a purely theoretical point of view, the local HFO–beta coupling can also be explained by thinking of the construction of beta oscillations by means of variations in the amplitude of the HFOs, instead of entraining of the HFOs by an “external” beta. The simultaneous disappearance of the HFOs and the low-beta activity during motor transitions and the similar topographical localization also favor the idea that both low-beta activity and the off HFOs are generated concomitantly as a consequence of the lack of dopaminergic input into the motor circuit of the basal ganglia.
HFOs have been described in the nonparkinsonian STN, although sporadically during short periods of time (Danish et al., 2007). Moreover, they have not been described to our knowledge in other motor structures of the basal ganglia. However, the histological characteristics of the STN (very few interneurons, excitatory output) argue against the possibility that the HFOs are a purely “local” phenomenon. Additional studies will be needed to assess the presence of HFOs (basally or movement-related) in other basal ganglia structures and in subjects without PD.
Final remarks
In summary, our results show that the lack of dopaminergic input into the motor circuit of the basal ganglia generates a series of complex changes in the oscillatory activity of the subthalamic nucleus. The off state subthalamic activity is characterized by the presence of coupled low-beta and high-frequency oscillations. These beta-coupled HFOs show little or no change during voluntary movements, and the altered movement-related changes correlate negatively with the bradykinesia/rigidity scores: a lower, more strongly altered modulation is associated with a higher bradykinesia/rigidity off score. In the on state, low-beta activity disappears, the coupling is greatly reduced, and the HFOs show clear movement-related positive amplitude modulation. These findings suggest the possibility that nonlinear coupling between frequencies may not simply be a physiological mechanism (as shown previously) but also that it may take part in the pathophysiology of bradykinesia and rigidity in PD.
Footnotes
This work was supported by the “Unión Temporal de Empresas Proyecto Centro de Investigación Médica Aplicada” and by grants from the Departamento de Salud (Gobierno de Navarra) and the Fondo de Investigaciones Sanitarias (PI 07/0034).
References
- Alegre M, Alonso-Frech F, Rodríguez-Oroz MC, Guridi J, Zamarbide I, Valencia M, Manrique M, Obeso JA, Artieda J. Movement-related changes in oscillatory activity in the human subthalamic nucleus: ipsilateral vs. contralateral movements. Eur J Neurosci. 2005;22:2315–2324. doi: 10.1111/j.1460-9568.2005.04409.x. [DOI] [PubMed] [Google Scholar]
- Alegre M, Rodríguez-Oroz MC, Valencia M, Pérez-Alcázar M, Guridi J, Iriarte J, Obeso JA, Artieda J. Changes in subthalamic activity during movement observation in Parkinson's disease. Is the mirror system mirrored in the basal ganglia? Clin Neurophysiol. 2010;121:414–425. doi: 10.1016/j.clinph.2009.11.013. [DOI] [PubMed] [Google Scholar]
- Alonso-Frech F, Zamarbide I, Alegre M, Rodríguez-Oroz MC, Guridi J, Manrique M, Valencia M, Artieda J, Obeso JA. Slow oscillatory activity and levodopa-induced dyskinesias in Parkinson's disease. Brain. 2006;129:1748–1757. doi: 10.1093/brain/awl103. [DOI] [PubMed] [Google Scholar]
- Brown P. Oscillatory nature of human basal ganglia activity: relationship to the pathophysiology of Parkinson's disease. Mov Disord. 2003;18:357–363. doi: 10.1002/mds.10358. [DOI] [PubMed] [Google Scholar]
- Brown P, Oliviero A, Mazzone P, Insola A, Tonali P, Di Lazzaro V. Dopamine dependency of oscillations between subthalamic nucleus and pallidum in Parkinson's disease. J Neurosci. 2001;21:1033–1038. doi: 10.1523/JNEUROSCI.21-03-01033.2001. [DOI] [PMC free article] [PubMed] [Google Scholar]
- Buzsáki G, Draguhn A. Neuronal oscillations in cortical networks. Science. 2004;304:1926–1929. doi: 10.1126/science.1099745. [DOI] [PubMed] [Google Scholar]
- Buzsáki G, Horváth Z, Urioste R, Hetke J, Wise K. High-frequency network oscillation in the hippocampus. Science. 1992;256:1025–1027. doi: 10.1126/science.1589772. [DOI] [PubMed] [Google Scholar]
- Canolty RT, Edwards E, Dalal SS, Soltani M, Nagarajan SS, Kirsch HE, Berger MS, Barbaro NM, Knight RT. High gamma power is phase-locked to theta oscillations in human neocortex. Science. 2006;313:1626–1628. doi: 10.1126/science.1128115. [DOI] [PMC free article] [PubMed] [Google Scholar]
- Cohen MX, Axmacher N, Lenartz D, Elger CE, Sturm V, Schlaepfer TE. Good vibrations: cross-frequency coupling in the human nucleus accumbens during reward processing. J Cogn Neurosci. 2009;21:875–889. doi: 10.1162/jocn.2009.21062. [DOI] [PubMed] [Google Scholar]
- Curio G. Linking 600-Hz “spikelike” EEG/MEG wavelets (“sigma-bursts”) to cellular substrates: concepts and caveats. J Clin Neurophysiol. 2000;17:377–396. doi: 10.1097/00004691-200007000-00004. [DOI] [PubMed] [Google Scholar]
- Danish SF, Moyer JT, Finkel LH, Baltuch GH, Jaggi JL, Priori A, Foffani G. High-frequency oscillations (>200 Hz) in the human non-parkinsonian subthalamic nucleus. Brain Res Bull. 2007;74:84–90. doi: 10.1016/j.brainresbull.2007.05.006. [DOI] [PubMed] [Google Scholar]
- Devos D, Szurhaj W, Reyns N, Labyt E, Houdayer E, Bourriez JL, Cassim F, Krystkowiak P, Blond S, Destée A, Derambure P, Defebvre L. Predominance of the contralateral movement-related activity in the subthalamo-cortical loop. Clin Neurophysiol. 2006;117:2315–2327. doi: 10.1016/j.clinph.2006.06.719. [DOI] [PubMed] [Google Scholar]
- Doyle LM, Kühn AA, Hariz M, Kupsch A, Schneider GH, Brown P. Levodopa-induced modulation of subthalamic beta oscillations during self-paced movements in patients with Parkinson's disease. Eur J Neurosci. 2005;21:1403–1412. doi: 10.1111/j.1460-9568.2005.03969.x. [DOI] [PubMed] [Google Scholar]
- Engel J, Jr, Bragin A, Staba R, Mody I. High-frequency oscillations: what is normal and what is not? Epilepsia. 2009;50:598–604. doi: 10.1111/j.1528-1167.2008.01917.x. [DOI] [PubMed] [Google Scholar]
- Farmer SF. Rhythmicity, synchronization and binding in human and primate motor systems. J Physiol Lond. 1998;509:3–14. doi: 10.1111/j.1469-7793.1998.003bo.x. [DOI] [PMC free article] [PubMed] [Google Scholar]
- Foffani G, Priori A, Egidi M, Rampini P, Tamma F, Caputo E, Moxon KA, Cerutti S, Barbieri S. 300-Hz subthalamic oscillations in Parkinson's disease. Brain. 2003;126:2153–2163. doi: 10.1093/brain/awg229. [DOI] [PubMed] [Google Scholar]
- Foffani G, Bianchi AM, Baselli G, Priori A. Movement-related frequency modulation of beta oscillatory activity in the human subthalamic nucleus. J Physiol. 2005;568:699–711. doi: 10.1113/jphysiol.2005.089722. [DOI] [PMC free article] [PubMed] [Google Scholar]
- Gatev P, Darbin O, Wichmann T. Oscillations in the basal ganglia under normal conditions and in movement disorders. Mov Disord. 2006;21:1566–1577. doi: 10.1002/mds.21033. [DOI] [PubMed] [Google Scholar]
- Gobbelé R, Buchner H, Curio G. High-frequency (600 Hz) SEP activities originating in the subcortical and cortical human somatosensory system. Electroencephalogr Clin Neurophysiol. 1998;108:182–189. doi: 10.1016/s0168-5597(97)00100-7. [DOI] [PubMed] [Google Scholar]
- Guridi J, Rodríguez-Oroz MC, Lozano AM, Moro E, Albanese A, Nuttin B, Gybels J, Ramos E, Obeso JA. Targeting the basal ganglia for deep brain stimulation in Parkinson's disease. Neurology. 2000;55:S21–S28. [PubMed] [Google Scholar]
- Hashimoto I. High-frequency oscillations of somatosensory evoked potentials and fields. J Clin Neurophysiol. 2000;17:309–320. doi: 10.1097/00004691-200005000-00008. [DOI] [PubMed] [Google Scholar]
- Hashimoto I, Mashiko T, Imada T. Somatic evoked high-frequency magnetic oscillations reflect activity of inhibitory interneurons in the human somatosensory cortex. Electroencephalogr Clin Neurophysiol. 1996;100:189–203. doi: 10.1016/0168-5597(95)00244-8. [DOI] [PubMed] [Google Scholar]
- Jones MS, MacDonald KD, Choi B, Dudek FE, Barth DS. Intracellular correlates of fast (>200 Hz) electrical oscillations in rat somatosensory cortex. J Neurophysiol. 2000;84:1505–1518. doi: 10.1152/jn.2000.84.3.1505. [DOI] [PubMed] [Google Scholar]
- Kane A, Hutchison WD, Hodaie M, Lozano AM, Dostrovsky JO. Dopamine-dependent high-frequency oscillatory activity in thalamus and subthalamic nucleus of patients with Parkinson's disease. Neuroreport. 2009;20:1549–1553. doi: 10.1097/WNR.0b013e32833282c8. [DOI] [PubMed] [Google Scholar]
- Kühn AA, Kupsch A, Schneider GH, Brown P. Reduction in subthalamic 8–35 Hz oscillatory activity correlates with clinical improvement in Parkinson's disease. Eur J Neurosci. 2006;23:1956–1960. doi: 10.1111/j.1460-9568.2006.04717.x. [DOI] [PubMed] [Google Scholar]
- Kühn AA, Tsui A, Aziz T, Ray N, Brücke C, Kupsch A, Schneider GH, Brown P. Pathological synchronisation in the subthalamic nucleus of patients with Parkinson's disease relates to both bradykinesia and rigidity. Exp Neurol. 2009;215:380–387. doi: 10.1016/j.expneurol.2008.11.008. [DOI] [PubMed] [Google Scholar]
- Lakatos P, Karmos G, Mehta AD, Ulbert I, Schroeder CE. Entrainment of neuronal oscillations as a mechanism of attentional selection. Science. 2008;320:110–113. doi: 10.1126/science.1154735. [DOI] [PubMed] [Google Scholar]
- Lévesque JC, Parent A. GABAergic interneurons in human subthalamic nucleus. Mov Disord. 2005;20:574–584. doi: 10.1002/mds.20374. [DOI] [PubMed] [Google Scholar]
- Levy R, Dostrovsky JO, Lang AE, Sime E, Hutchison WD, Lozano AM. Effects of apomorphine on subthalamic nucleus and globus pallidus internus neurons in patients with Parkinson's disease. J Neurophysiol. 2001;86:249–260. doi: 10.1152/jn.2001.86.1.249. [DOI] [PubMed] [Google Scholar]
- Marceglia S, Foffani G, Bianchi AM, Baselli G, Tamma F, Egidi M, Priori A. Dopamine-dependent non-linear correlation between subthalamic rhythms in Parkinson's disease. J Physiol. 2006;571:579–591. doi: 10.1113/jphysiol.2005.100271. [DOI] [PMC free article] [PubMed] [Google Scholar]
- Marceglia S, Bianchi AM, Baselli G, Foffani G, Cogiamanian F, Modugno N, Mrakic-Sposta S, Priori A, Cerutti S. Interaction between rhythms in the human basal ganglia: application of bispectral analysis to local field potentials. IEEE Trans Neural Syst Rehabil Eng. 2007;15:483–492. doi: 10.1109/TNSRE.2007.907893. [DOI] [PubMed] [Google Scholar]
- Priori A, Foffani G, Pesenti A, Tamma F, Bianchi AM, Pellegrini M, Locatelli M, Moxon KA, Villani RM. Rhythm-specific pharmacological modulation of subthalamic activity in Parkinson's disease. Exp Neurol. 2004;189:369–379. doi: 10.1016/j.expneurol.2004.06.001. [DOI] [PubMed] [Google Scholar]
- Rodríguez-Oroz MC, Rodriguez M, Guridi J, Mewes K, Chockkman V, Vitek J, DeLong MR, Obeso JA. The subthalamic nucleus in Parkinson's disease: somatotopic organization and physiological characteristics. Brain. 2001;124:1777–1790. doi: 10.1093/brain/124.9.1777. [DOI] [PubMed] [Google Scholar]
- Rodríguez-Oroz MC, Zamarbide I, Guridi J, Palmero MR, Obeso JA. Efficacy of deep brain stimulation of the subthalamic nucleus in Parkinson's disease 4 years after surgery: double blind and open label evaluation. J Neurol Neurosurg Psychiatry. 2004;75:1382–1385. doi: 10.1136/jnnp.2003.031294. [DOI] [PMC free article] [PubMed] [Google Scholar]
- Rodríguez-Oroz MC, Obeso JA, Lang AE, Houeto JL, Pollak P, Rehncrona S, Kulisevsky J, Albanese A, Volkmann J, Hariz MI, Quinn NP, Speelman JD, Guridi J, Zamarbide I, Gironell A, Molet J, Pascual-Sedano B, Pidoux B, Bonnet AM, Agid Y, et al. Bilateral deep brain stimulation in Parkinson's disease: a multicentre study with 4 years follow-up. Brain. 2005;128:2240–2249. doi: 10.1093/brain/awh571. [DOI] [PubMed] [Google Scholar]
- Singer W. Synchronization of cortical activity and its putative role in information processing and learning. Annu Rev Physiol. 1993;55:349–374. doi: 10.1146/annurev.ph.55.030193.002025. [DOI] [PubMed] [Google Scholar]
- Stockwell R, Mansinha L, Lowe R. Localization of the complex spectrum: the S transform. IEEE Trans Signal Process. 1996;44:998–1001. [Google Scholar]
- Tort AB, Kramer MA, Thorn C, Gibson DJ, Kubota Y, Graybiel AM, Kopell NJ. Dynamic cross-frequency couplings of local field potential oscillations in rat striatum and hippocampus during performance of a T-maze task. Proc Natl Acad Sci U S A. 2008;105:20517–20522. doi: 10.1073/pnas.0810524105. [DOI] [PMC free article] [PubMed] [Google Scholar]
- Urrestarazu E, Chander R, Dubeau F, Gotman J. Interictal high-frequency oscillations (100–500 Hz) in the intracerebral EEG of epileptic patients. Brain. 2007;130:2354–2366. doi: 10.1093/brain/awm149. [DOI] [PubMed] [Google Scholar]
- Varela F, Lachaux JP, Rodriguez E, Martinerie J. The brainweb: phase synchronization and large-scale integration. Nat Rev Neurosci. 2001;2:229–239. doi: 10.1038/35067550. [DOI] [PubMed] [Google Scholar]
- Welch P. The use of fast Fourier transform for the estimation of power spectra: a method based on time averaging over short, modified periodograms. IEEE Trans Audio Electroacoustics. 1967;15:70–73. [Google Scholar]