

Abstract
Acid-sensing ion channels (ASICs), a member of the degenerin/epithelial Na+ channel superfamily, are widely expressed in the mammalian CNS. Accumulating evidence suggests that ASIC current density is higher in GABAergic interneurons than that in glutamatergic pyramidal neurons (PNs) in the hippocampus. Such differential expression of ASICs in cortical networks is thought to be a key element for seizure termination. However, GABAergic interneurons are highly diverse; it is unclear whether the functional expression of ASICs differs in distinct GABAergic interneuron subtypes. Moreover, the subunit composition of ASICs in individual GABAergic interneurons remains unknown. By combining patch-clamp recording and single-cell reverse transcription (RT)-PCR analysis, we correlated ASIC currents with their gene expression in acute rat hippocampal slices. The results yielded several surprising findings. First, ASIC current density of oriens lacunosum-moleculare (O-LM) cells in the CA1 region, a classical type of dendrite-targeting interneuron, is 6 times greater than that of fast-spiking basket cells (BCs) in the dentate gyrus, a major class of soma-targeting interneuron. Second, the recovery of ASICs from desensitization is slowest in BCs, intermediate in PNs, and fastest in O-LM cells. Third, the tarantula venom psalmotoxin 1, the specific blocker for ASIC1a homomers, inhibits ASIC currents in BCs but not in O-LM cells. Finally, single-cell RT-PCR analysis reveals coexpression of ASIC1a and ASIC2 subunit transcripts in O-LM cells, whereas only ASIC1a subunit transcript is detected in most BCs. Thus, differential expression of ASICs in inhibitory microcircuits likely contributes to the distinct roles of GABAergic interneurons in normal physiology and pathophysiology.
Introduction
Acid-sensing ion channels (ASICs), a member of the degenerin/epithelial Na+ channel (DEG/ENaC) cation channel superfamily, are widely expressed in the mammalian nervous system (Waldmann et al., 1997; for review, see Wemmie et al., 2006) and have been implicated in pain, ischemic stroke, seizures and many other neurological diseases (Xiong et al., 2004; Mazzuca et al., 2007; Ziemann et al., 2008; Coryell et al., 2009). Many studies showed that GABAergic inhibitory interneurons in the hippocampus have larger ASIC current densities than glutamatergic excitatory pyramidal neurons (PNs) (Bolshakov et al., 2002; Cho and Askwith, 2008; Ziemann et al., 2008). In line with this view, a recent report showed that ASIC1a null mice display delayed seizure termination after seizure induction and suggested that ASIC activation by falls in extracellular pH during seizures increases the cortical inhibition through preferential recruitment of GABAergic inhibitory interneurons (Ziemann et al., 2008).
However, GABAergic inhibitory interneurons consist of a highly heterogeneous population of cells (McBain and Fisahn, 2001; Jonas et al., 2004; Markram et al., 2004; Klausberger and Somogyi, 2008). Different GABAergic interneuron types have specific roles in hippocampal function (Klausberger and Somogyi, 2008). At least two functionally distinct classes of GABAergic interneurons are known to exist in the hippocampus (McBain and Fisahn, 2001; Jonas et al., 2004; Freund and Katona, 2007). Soma-targeting inhibitory interneurons, such as fast-spiking basket cells (BCs), control the spike initiation of principal neurons via axonal innervations onto perisomatic areas of principal neurons (Cobb et al., 1995; Miles et al., 1996; Kraushaar and Jonas, 2000), whereas dendrite-targeting inhibitory interneurons, such as oriens lacunosum-moleculare (O-LM) cells, regulate dendritic Na+ or Ca2+ spikes and synaptic plasticity by innervating dendritic domains of principal neurons (Miles et al., 1996). These two distinct GABAergic interneuron subtypes differ not only in their intrinsic properties, such as neurochemical contents, Ca2+-buffering proteins/homeostasis, ion channels, and transmitter receptors (Koh et al., 1995; Freund and Buzsáki, 1996; Martina et al., 1998; Lien et al., 2002; Pouille and Scanziani, 2004; Aponte et al., 2008; Liao and Lien, 2009), but also in their synaptic and network functions (Klausberger et al., 2003; Pouille and Scanziani, 2004; Klausberger and Somogyi, 2008). Unfortunately, the lack of measurement of ASIC currents from identified GABAergic inhibitory interneurons has left a fundamental question unresolved: is the ASIC expression among hippocampal GABAergic inhibitory interneurons cell type-specific? Moreover, the subunit composition of ASICs in various classes of GABAergic inhibitory interneurons (“perisomatic” versus “dendritic” interneurons) remains to be determined.
In this study, we correlated the functional property with gene-expression profile of ASICs in the PNs in the CA1 region and two functionally distinct classes of GABAergic inhibitory interneurons-O-LM cells and fast-spiking BCs in rat hippocampal slices by combining patch-clamp techniques and single-cell reverse transcription (RT)-PCR (Lien et al., 2002; Liss et al., 2004). Using these approaches, we uncovered a previously unknown expression pattern of ASICs in GABAergic inhibitory microcircuits, which likely underlies the selective vulnerability of distinct types of GABAergic inhibitory interneurons under pathological conditions.
Materials and Methods
Patch-clamp techniques in hippocampal slices.
Transverse hippocampal slices of 300 μm thickness were cut from the brains of 15- to 23-d-old male Sprague Dawley rats using a vibratome (DSK-1000, Dosaka) as described previously (Lien et al., 2002; Liao and Lien, 2009). Animals were sacrificed by decapitation in agreement with national and institutional guidelines and all procedures were approved by the Animal Care and Use Committee of National Yang-Ming University. Slices were sectioned in the ice-cold cutting saline containing the following (in mm): 87 NaCl, 25 NaHCO3, 1.25 NaH2PO4, 2.5 KCl, 10 glucose, 75 sucrose, 0.5 CaCl2 and 7 MgCl2. Following sectioning, slices were incubated in the cutting saline (oxygenated with 95% O2/5% CO2) in a holding chamber at 34°C for 30 min, and then at room temperature until used. During experiments, an individual slice was transferred to a submersion recording chamber and was continuously superfused with oxygenated artificial CSF containing the following (in mm): 125 NaCl, 25 NaHCO3, 1.25 NaH2PO4, 2.5 KCl, 25 glucose, 2 CaCl2 and 1 MgCl2.
Experiments were performed under visual control using infrared differential interference contrast (IR-DIC) videomicroscopy (Stuart et al., 1993). O-LM cells in the CA1 subfield were selected based on the following criteria (Lien et al., 2002; Liao and Lien, 2009): (1) location of a fusiform soma in the stratum oriens with bipolar dendrites; (2) a pronounced sag response upon 1 s hyperpolarizing current pulse (−300 pA) injection; (3) fast-spiking patterns (50–60 Hz) and pronounced fast afterhyperpolarization during 1 s depolarization. For CA1 pyramidal neuron recording, cells of large somata in the stratum pyramidale with accommodating firing patterns were chosen. Dentate gyrus (DG) BCs were selected in accordance with previous reports (Koh et al., 1995; Martina et al., 1998; Aponte et al., 2008): (1) a relatively large size of cell body near the border between granule cell layer and hilus; (2) high-frequency (≥70 Hz) action potential (AP) phenotype; (3) relatively low input resistance (<170 MΩ); (4) little sag response upon membrane hyperpolarization. The recording temperature was 22−24°C.
Nucleated patch recordings.
Nucleated patch recordings were made as described previously (Lien et al., 2002; Lien and Jonas, 2003) using an Axopatch 200B amplifier (Molecular Devices). Pipette capacitance was compensated. Signals were low-pass filtered at 5 kHz (four-pole Bessel), and sampled at 10 kHz using a digitizer Digidata 1322A (Molecular Devices). Pulse sequences were generated by Digidata 1322A via pClamp 9.2 (Molecular Devices). Minor and major axes of nucleated patches were measured. It was assumed that nucleated patches were approximately ellipsoid (Gentet et al., 2000) and the membrane surface area was calculated using the following formula:
Fast application of H+.
Fast application of H+ on nucleated patches isolated from identified neurons was performed as described previously (Koh et al., 1995). Fast application experiments were started 1–2 min after the patches were excised. Double-barreled application pipettes were fabricated from theta glass capillaries (2 mm outer diameter, 0.3 mm wall thickness, 0.12 mm septum, Hilgenberg GmbH), and mounted on a piezoelectric-based solution switching system (Burleigh LSS-3000, EXFO). The time necessary for complete exchange of solution was measured with an open patch pipette by switching between Na+-rich and 20% Na+-rich solutions. It was 227 ± 50 μs (n = 3) by measuring 20–80% rise time of junction potential change. ASIC currents evoked by 2 s pulses of H+ were applied every 15–30 s except in some pharmacological experiments (see Fig. 5), short pulses (50 ms) were used.
Figure 5.

PcTX1 preferentially inhibited ASIC currents of BCs. Top, Traces showing ASIC currents (evoked by pH 5 at −100 mV) in a nucleated patch from an O-LM cell in the control and in the presence of 30 nm PcTX1. Bottom, PcTX1 (30 nm) inhibited 74% of ASIC currents in a nucleated patch from a BC. Traces were average of 5–7 sweeps.
Focal H+ puffing to dendrites.
To visualize dendrites, we filled neurons with red fluorescent dye sulforhodamine 101 (SR101; 10 μm) via somatic recording. The dendrites were traced under epifluorescence microscope. To evoke ASIC currents along the dendrites, the puffing pipette was placed close to the dendrites (see Fig. 7). Voltage changes or ASIC currents were evoked by focal puffs of H+ (∼6 psi) using PicoSpritzer III (Parker Instrumentation) in whole-cell current or voltage-clamp recording. Acidic pH solution was injected via a patch pipette with an open tip (2 μm). The PicoSpritzer was triggered by an external TTL pulse generated by Digidata 1322A. This approach approximates the ASIC current amplitudes at dendrites and the caveat should be pointed out here. It is clear that the current amplitude did not directly reflect channel density because the surface area exposed to the puff varied.
Figure 7.

Dendritic ASIC currents in distinct types of neurons. A, Focal acid puffs (5 s, pH 4.5) to the O-LM cell dendrite (at the distance of 23 μm from the soma) evoked a desensitizing inward current, which was reversibly blocked by amiloride (100 μm). Black, Control; gray, amiloride; red, washout. B, Left, An O-LM cell filled with SR101 via somatic recording; the puff pipette was placed near the dendrite. Right, Brief acid puffs (1 s, pH 4) at different distances along the O-LM dendrite evoked large inward currents at the voltage-clamp potential (V-clamp) of −70 mV and spike trains in the current-clamp recording (holding potential −70 mV), respectively. C, Left, A PN filled with SR101 and the puff pipette was placed near the apical dendrite. Right, Brief acid puffs (1 s, pH 4) at different distances along the PN dendrite evoked relatively smaller inward currents (V-clamp = −70 mV) and subthreshold membrane depolarization in the current-clamp recording (holding potential −70 mV), respectively. D, Left, A BC filled with SR101 and the puff pipette was placed near the apical dendrite. Right, Local acid puffs (2 s, pH 4) evoked relatively smaller ASIC currents (V-clamp = −70 mV) and subthreshold membrane depolarization in the current-clamp recording (holding potential −70 mV), respectively. E, ASIC currents as a function of distance from the soma. Lines represent exponential functions fit to the data points. Data are from 8 O-LM cells, 9 PNs and 6 BCs. F, Summary plot of spike number plotted against distance from the soma. Lines represent exponential functions fit to data points. Data are from 8 O-LM cells, 9 PNs and 6 BCs. All experiments were performed in the presence of 1 mM kynurenic acid and 1 μm SR95531.
Morphological analysis.
Morphological reconstruction was identical to those reported previously (Liao and Lien, 2009). A separate subset of CA1 pyramidal cells, O-LM cells and BCs were filled with biocytin (0.2%) during recordings. After ∼30 min recording, slices were fixed overnight with 4% paraformaldehyde in phosphate-buffered solution (PB; 0.1 m, pH 7.3). Following wash with PB, slices were incubated with fluorescein isothiocyanate (FITC)-conjugated avidin-d (2 μl/ml; Invitrogen) in PB and 0.3% Triton X-100 overnight at 4°C. After wash, slices were embedded in mounting medium Vectashield (Vector Laboratories). Labeled cells were examined by a two-photon microscope using a pulsed titanium/sapphire laser (Chameleon-Ultra II tuned to 800 nm; Coherent) attached to a Leica DM6000 CFS that was equipped with a 20×/0.50 numerical aperture water-immersion objective (HCX APO L; Leica). The two dimensional morphologies of the cells were reconstructed from a stack of 38–455 images (voxel size, 0.378–1.514 μm in the x-y plane; 0.4–0.99 μm along the z-axis) using ImageJ (v. 1.42q).
Solutions and drugs.
The HEPES-buffered Na+-rich external solution used for fast application in the control barrel contained (in mm): 135 NaCl, 5.4 KCl, 1.8 CaCl2, 1 MgCl2, 5 HEPES; pH adjusted to 7.4 with N-methyl-d-glucamine (NMDG). To evoke ASIC currents with various pH values, MES-buffered Na+-rich external solution in the test barrel contained (in mm): 135 NaCl, 5.4 KCl, 1.8 CaCl2, 1 MgCl2, 10 MES, adjusted to the desired values with NMDG. The intracellular solution contained (in mm): 135 K-gluconate, 20 KCl, 0.1 EGTA, 2 MgCl2, 4 Na2ATP, 10 HEPES; pH adjusted to 7.3 with HCl. For low Na+ experiments, Na+ in the buffered Na+-rich external solution was substituted by NMDG. For low Na+/high Ca2+ experiments, concentrations of NaCl and CaCl2 were varied as indicated (see Fig. 3C). Bovine serum albumin (0.1%) was added in external solutions containing the spider toxin Psalmotoxin 1 (PcTX1; Peptides International) to prevent its absorption to tubing and containers. Amiloride from Tocris Bioscience was dissolved in water to give 10 mm stock solution and stored at −20°C. All other chemicals were from Sigma except where noted.
Figure 3.

Functional properties of ASIC in different types of neurons. A, Inset, Representative ASIC currents in an O-LM cell induced by pH changes from pH 7.4 to 6, 5.5, and 5. The peak current amplitude, normalized to the mean peak amplitude of pH 5-induced currents, is plotted against the pH value. The continuous curve represents the single Hill equation fitted to the data points. Points represent mean values from 4 to 25 experiments. B, Inset, Representative ASIC currents in a nucleated patch from an O-LM cell were recorded at different membrane potentials (from −60 mV to +100 mV, increments 20 mV). The current–voltage (I–V) curve of ASIC currents has the Erev of +62 ± 3 mV. Data points are fitted with a polynomial function. C, Semilogarithmic plot of the Erev against [Na+]o. Symbols represent the recordings in either 1.8 mm [Ca2+]o (open symbols) or high [Ca2+]o/low [Na+]o (filled symbols: 100/10 and 80/50 mm, respectively). The gray line depicts the Nernst Na+ equilibrium potential plotted against [Na+]o; the black line is the linear fit of all data points. The slope values of the relationship between Erev and Log[Na+]o correspond to 58.2 mV (gray) and 56.8 mV (black) per tenfold [Na+]o change, respectively. D, Left, Representative peak-scaled traces of ASIC currents showing desensitization. Right, Scatter plot of τdesen of ASIC currents of O-LM cells (688 ± 97 ms, n = 26), PNs (471 ± 21 ms, n = 32) and BCs (434 ± 33 ms, n = 16). The τdesen was obtained by fitting the decay phase of the current with a monoexponential function. ***p < 0.0005. E, Left, Representative peak-scaled traces of ASIC currents showing deactivation. Right, Bar plot of τdeact of ASIC currents of O-LM cells (3.7 ± 0.3 ms, n = 10), PNs (9.3 ± 1.2 ms, n = 5) and BCs (9.8 ± 1.0 ms, n = 5). The τdeact was obtained by fitting the decay phase of the current with a monoexponential function. **p < 0.005. F, Left, Representative traces showing the recovery from desensitization was measured at −60 mV after rapid changes from pH 7.4 to 5 for 2 s and then changed back to pH 7.4 for 20 s, followed by a second pulse to pH 5 for 2 s. The peak current evoked by the second pH 5 pulse divided by the first pH 5 pulse was plotted against the pulse interval. Right, data points obtained from O-LM cells (n = 6), PNs (n = 16) and BCs (n = 9) were fitted with either a mono- or a biexponential function, yielding the weighted recovery time constants of 0.96 s, 13.2 s and 42.8 s, respectively. G, Left, Cumulative desensitization of ASICs (at −60 mV) evoked by repetitive 2 s pulses (from pH 7.4 to 5) at 0.05 Hz in an O-LM, a PN and a BC, respectively. Only the first five traces were shown. Right, Time courses of onset of desensitization in O-LM cells (n = 6), PNs (n = 10) and BCs (n = 7). The peak current amplitude, normalized to the first peak current amplitude, was plotted against the time of each pulse. Curves represent exponential functions fitted to the data points. Time constants for PNs and BCs were 23.6 ± 1.8 and 8.3 ± 0.3 s, respectively.
Data analysis and statistics.
Data were analyzed and fitted with Clampfit 10.0 (Molecular Devices) and Mathematica 5.2 (Wolfram Research). Apparent input resistance was defined by the ratio of peak voltage change/1 s hyperpolarizing current (−100 pA). Desensitization and deactivation time constants of ASIC currents were obtained by fitting currents with the function:
where A denotes the peak amplitude of current, τdecay represents the desensitization or deactivation time constant, and C denotes the amplitude of steady-state current.
Concentration–response curves were fitted with the function:
 |
where A is the constant for the maximal effect, c denotes the concentration, EC50 represents the half-maximal effective concentration, and n denotes the Hill coefficient.
For measuring reversal potential, data points of I–V relations (see Fig. 3B) were fitted with second order polynomials, from which the interpolated potentials were calculated. Theoretical reversal potential of sodium channels (Erev) was plotted against external Na+ concentration according to the Nernst equation:
where [Na+]o, [Na+]i are outer and inner Na+ concentrations and F, R, T have standard thermodynamic meanings (Hille, 2001).
The single-channel conductance of ASIC was estimated by nonstationary fluctuation analysis (Hartveit and Veruki, 2007) of ASIC currents from 23 to 50 traces (see Fig. 6A). To minimize errors due to rundown, the entire dataset was divided into nonoverlapping subsets of 7–10 traces (Engel and Jonas, 2005). Mean ensemble current and variances were determined for each subset and averaged. Mean variance (σ2) versus mean current (I), for each sampling point, can then be obtained. To assign similar weights to all phases of the ensemble mean waveform, binning of mean I and corresponding σ2 were used by dividing the mean current amplitude into a number of bins of equal amplitude (Hartveit and Veruki, 2007). The values of mean I and mean σ2 within each bin were then further averaged. The averaged mean I was plotted against the averaged mean σ2 and then fitted with the equation when they look like a parabola:
developed from a binomial model, yielding values for apparent single-channel current i, total number of ion channel N available for activation. σb2 is the variance of the background noise. In all BCs (n = 5) and some PNs (3 of 7), the data can be adequately described with a straight line rather than a parabola. The slope of the variance–mean relation was plotted with the equation:
Figure 6.
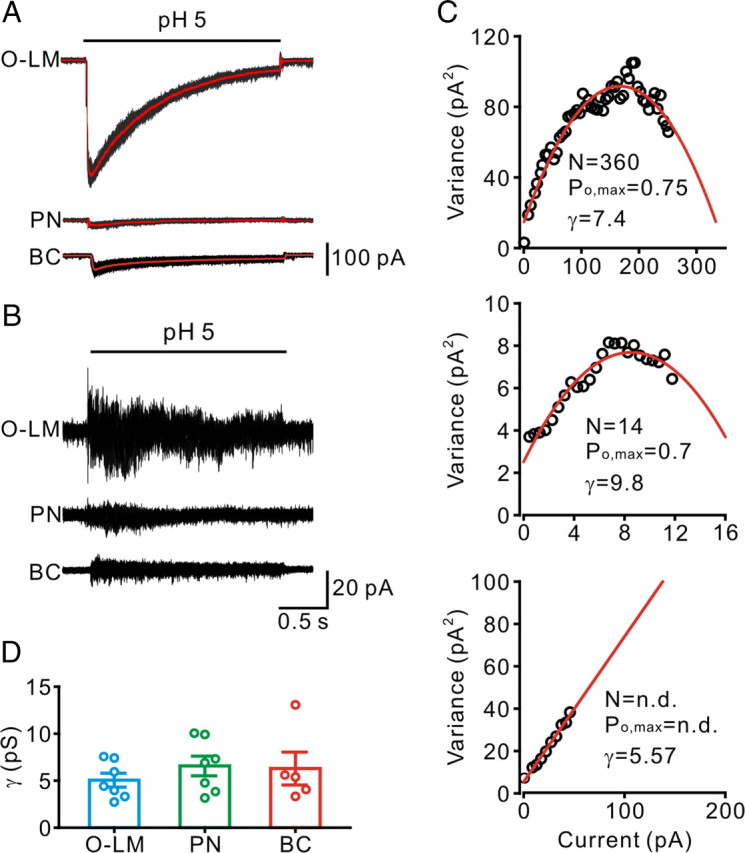
Nonstationary fluctuation analysis of single-channel properties of ASICs. A, Representative ensemble of 10 consecutive ASIC current traces (black) superimposed with the averaged current traces (red) recorded in nucleated patches from an O-LM cell, a PN and a BC. B, Traces illustrating deviation of three representative individual traces from the mean. Traces from the same cells in A. C, The ensemble variance was calculated from the fluctuations of ASIC currents around the mean, plotted against the ensemble mean, and fitted with a parabolic function. Each plotted point is the average of 10 sampling points. Same patches as shown in A. Red curves are parabolic or linear functions fitted to the data points. D, A bar plot summarizing γ values for O-LM cells, PNs and BCs.
The single-channel chord conductance γ was calculated as follows:
The maximum open probability (Po, max), corresponding to the fraction of available ion channels open at the time of the peak current (Ipeak), can then be calculated from the following equation:
Values indicate mean ± SEM; error bars in figures also represent SEM. Statistical significance among groups was tested using the nonparametric Kruskal–Wallis test. When it was significant, pairwise comparisons by the Wilcoxon rank-sum test were then carried out for each pair of groups. All tests were performed at the significance level (P) indicated using GraphPad Prism 5.0. SEs of reversal potentials were obtained by analyzing data of individual experiments separately. SEs of parameters of dose–response curves were calculated by a parametric bootstrap method (Efron and Tibshirani, 1998). A total of 500 artificial datasets were generated in which the original values were replaced by normally distributed random numbers with means and SEM identical to those of the original data points, and were fitted as the original dataset.
Single-cell RT-PCR.
Single-cell gene expression profiles were analyzed using the single-cell RT-PCR approach as previously described (Martina et al., 1998; Lien et al., 2002; Liss and Roeper, 2004; Aponte et al., 2006). RNase-free patch-clamp buffer containing (in mm): 140 KCl, MgCl2, 5 HEPES, 5 EGTA (pH = 7.3) was autoclaved before used. Patch-clamp capillaries were baked overnight at 220°C before use. The cytoplasm of a recorded neuron was harvested into the recording pipette, under visual control, without losing the gigaseal immediately after electrophysiological characterization. The contents of the patch pipette (∼2–5 μl) were expelled into a 0.2 ml PCR tube (Axygen Scientific) containing 17 μl of RT mix (SuperScript III platinum Two-Step qPCR Kit with SYBR green I, Invitrogen). The mix contained 5 μl of diethylpyrocarbonate (DEPC)-treated water, 10 μl of 2× RT reaction mix (oligo(dT)20, random hexamers, MgCl2 and dNTPs) and 2 μl of RT enzyme mix (SuperScript III reverse transcriptase and recombinant ribonuclease inhibitor). Total volume was ∼20 μl. After a series of incubation at different temperatures according to the manufacturer's instructions, the cDNA-containing tube was stored at −70°C until used. The RNA strand in the RNA-DNA hybrid was then removed by adding 1 μl (2 U/μl) of E. coli RNase H and incubated at 37°C for 20 min before PCR process.
Following cDNA synthesis, the cDNA solution of a single cell was split into 3 aliquots (5 μl) and each of them was used for gene amplification. A PCR approach with Rotor-Gene 3000 (Corbett Research) or StepOnePlus Real-Time PCR system (Applied Biosystems) was performed in a total volume of 25 μl with 1 μl of 10 μm primers (each), 5.5 μl of DEPC-treated water and 12.5 μl of Platinum SYBR Green qPCR SuperMix-UDG (Invitrogen) containing Platinum TaqDNA polymerase, Mg2+, uracil DNA glycosylase, proprietary stabilizers, and dNTPs with dUTP. Primers were designed with Perlprimer v1.1.14 and selected for maximal specificity and intron-overspanning amplicons (Table 1). The molecular weights of the ASIC1a and ASIC2 amplicons and other neuron-specific markers were subsequently examined on ethidium bromide-stained agarose gels; sizes were in close agreement with the expected lengths (see Fig. 4A). For ASIC expression profiles, all analyzed neurons expressed neurofilament 3 (NF3), indicating selective harvesting from neurons. To exclude the possibility of contaminations, no template control was performed in parallel to every PCR, and the reverse transcriptase was omitted in a subset of cells. Additional controls to exclude nonspecific harvesting were performed by advancing pipettes into the slice and taking them out without seal formation and suction (Martina et al., 1998; Lien et al., 2002).
Table 1.
Oligonucleotide primers for RT-PCR
| Gene | Forward/Reverse | Product size (bp) |
|---|---|---|
| Parvalbumin | 5′-GGCGATAGGAGCCTTTACTGCTGC-3′ | 372 |
| 5′-GAAACCCAGGAGGGCCGCGA-3′ | ||
| Somatostatin | 5′-GGCTGCCACCGGGAAACAGGAAC-3′ | 119 |
| 5′-CCTGCTCAGCTGCCTGGGGC-3′ | ||
| Calcineurin | 5′-CCGAGCCCACGAAGCCCAGG-3′ | 337 |
| 5′-TGCAGCCGTGGCTCCGTCAA-3′ | ||
| GAD65 | 5′-TGGCATCTCCGGGCTCTGGCT-3′ | 296 |
| 5′-TGGCAGCAGGTCTGTTGCGTGG-3′ | ||
| Neurofilament 3 | 5′-TCGCCGCATATAGGAAACTACTG-3′ | 95 |
| 5′-GGGCTGTCGGTGTGTGTACA-3′ | ||
| Cholecystokinin | 5′-GCTGGACAGCAGCCGTTGGA-3′ | 280 |
| 5′-GGCCAGAGGGAGCTTTGCGG-3′ | ||
| ASIC1a | 5′-GAACATTCTGGTGCTGGACATT-3′ | 184 |
| 5′-CCTGTGCTTAATGACCTCGTAG-3′ | ||
| ASIC2a | 5′-CGCACAACTTCTCCTCAGTGTTT-3′ | 146 |
| 5′-GTACTCATCTTGCTGAATGTCCA-3′ |
aASIC2a and ASIC2b mRNAs were detected with a pair of common primers.
Figure 4.
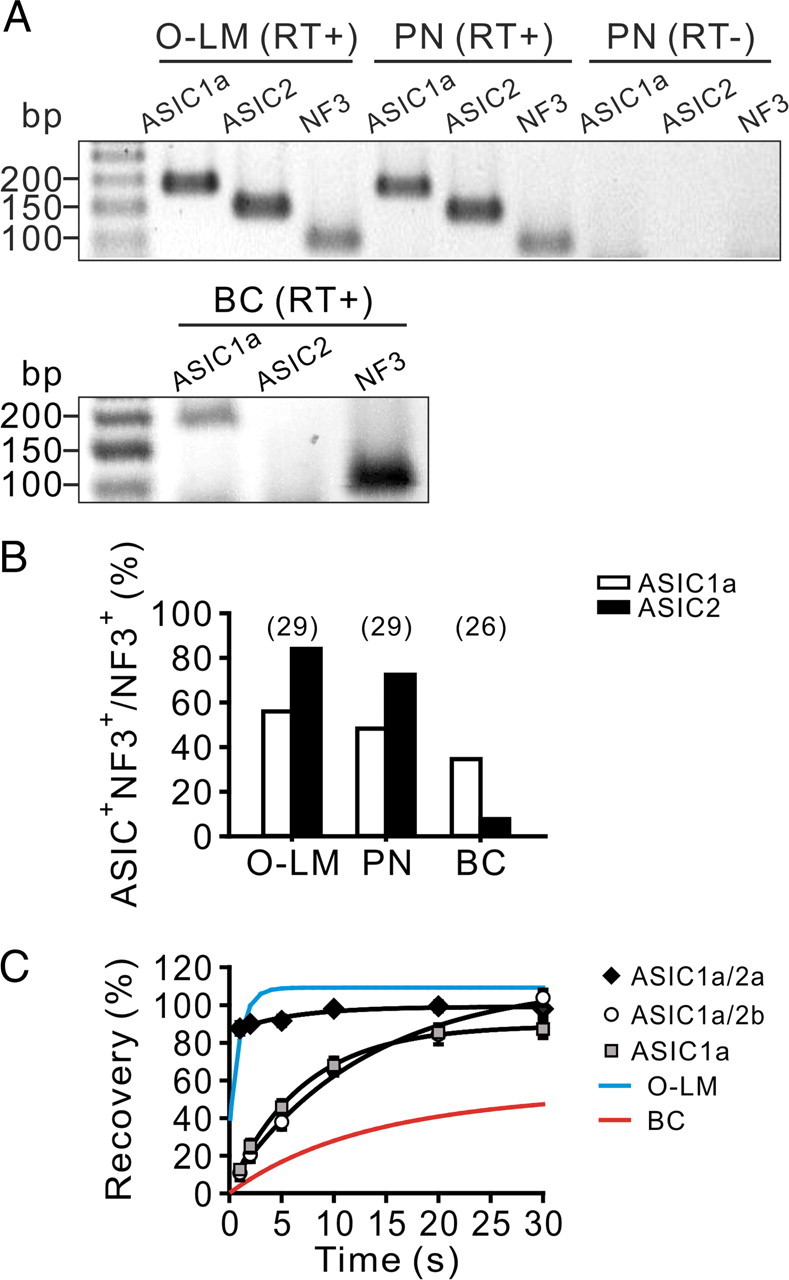
Expression of ASIC subunit transcripts in single hippocampal neurons. A, Ethidium bromide-stained gels of the PCR products amplified with primers specific for ASIC1a, ASIC2 and NF3 transcripts. Molecular weight markers were shown in the left upper and lower lanes, together with the corresponding number of base pairs. Plus and minus signs indicate samples with or without RT. All analyzed neurons expressed NF3. B, Bar graph showing the percentage of NF3-positive neurons expressing ASIC1a and ASIC2 transcripts. Number in parentheses indicates the number of the NF3-positive cells. C, Time courses of recovery from desensitization of ASICs from O-LM cells (blue line) and BCs (red line) were plotted together with data from heterologously expressed mouse ASICs in CHO (change to curves obtained by fitting data from Askwith et al., 2004). Lines represent exponential functions fit to the data points.
Results
Functional ASICs are differentially expressed in hippocampal microcircuits
We made whole-cell patch recordings from neurons in acute rat hippocampal slices under IR-DIC optics (Fig. 1A). Neurons in the CA1 area and the DG were selected as previously described (Martina et al., 1998; Lien and Jonas, 2003; Aponte et al., 2008; Liao and Lien, 2009). Under current-clamp configuration at 23 ± 1°C, CA1 PNs generated regular and accommodating AP trains upon injection of 1 s depolarizing current (+600 pA) pulses and exhibited sag responses in response to 1 s hyperpolarizing current (−300 pA) pulses with apparent input resistance of 176 ± 9.1 MΩ (n = 30, Fig. 1A, middle). Under the same protocol, O-LM cells generated APs at a frequency ≥50 Hz and showed pronounced sag responses with apparent input resistance of 335.6 ± 25 MΩ (n = 24, Fig. 1A, left). In contrast to PNs and O-LM cells, BCs in the DG generated high-frequency AP trains (86.7 ± 2.9 Hz, n = 18) with negligible sag responses and exhibited relatively low input resistance (133.9 ± 5 MΩ, n = 18; Fig. 1A, right). In a subset of experiments, the neuron types were further confirmed by post hoc morphological reconstruction of the recorded cells (Fig. 1B) and cell type-specific markers (supplemental Fig. 1, available at www.jneurosci.org as supplemental material). Consistent with previous reports (Sík et al., 1998; Maccaferri et al., 2000; Klausberger et al., 2003), analyses of single-cell RT-PCR showed that CA1 PNs expressed calcineurin, whereas O-LM cells and BCs expressed somatostatin and parvalbumin, respectively (supplemental Fig. 1, available at www.jneurosci.org as supplemental material). Moreover, nucleated patches subsequently isolated from these three types of neurons after whole-cell recordings exhibited cell type-specific voltage-gated K+ currents (Du et al., 1996; Martina et al., 1998; Lien et al., 2002). Total outward K+ currents in nucleated patches from CA1 PNs consisted of a large proportion of A-type currents, whereas patches from O-LM cells or BCs exhibited a predominant sustained component (supplemental Fig. 2, available at www.jneurosci.org as supplemental material).
Figure 1.

ASIC currents in CA1 PNs and defined interneurons. A, Voltage responses to 1 s depolarizing (+600 pA) or hyperpolarizing (−300 pA) current pulses in the whole-cell current-clamp configuration from an O-LM cell, a PN and a BC, respectively. B, Two-photon z stack projection of neurons in A filled with biocytin and stained with FITC-conjugated avidin. Note that the O-LM cell has its axonal arborization in stratum lacunosum moleculare (SLM), whereas the BC's axon is largely restricted to the granule cell layer (GCL). SR, stratum radiatum; SP, stratum pyramidale; SO, stratum oriens; ML, molecular layer. C, Inward currents recorded at −60 mV after rapid pH changes from pH 7.4 to 5 in nucleated patches from an O-LM cell, a PN and a BC, respectively. Traces are averages of 5–10 sweeps. H+-evoked currents are reversibly blocked by 10 μm amiloride (control: black; amiloride: gray; washout: red). Inset, Schematic of the experimental configuration. The open tip response was 227 ± 50 μs (n = 3) (see Materials and Methods). D, Scatter plots showing that the current amplitude (left) and density (right) of O-LM cells are significantly larger than those of PNs and BCs. ***p < 0.0005.
Extracellular pH reductions evoke ASIC currents in hippocampal PNs (Baron et al., 2002; Bolshakov et al., 2002; Askwith et al., 2004; Ziemann et al., 2008). We next measured ASIC currents in these neurons using nucleated patch configuration, which allowed us to examine channel gating under ideal voltage-clamp conditions. A submillisecond switch of extracellular pH from 7.4 to 5 by fast application induced a transient inward current of 22.3 ± 1.9 pA in CA1 PNs (n = 27, Fig. 1C, black, middle, Fig. 1D, left), corresponding to a current density of 0.11 ± 0.01 pA/μm2 (n = 27; Fig. 1D, right). In contrast to CA1 PNs, nucleated patches from O-LM cells upon pH 5 application exhibited a much larger current amplitude (237.9 ± 55.1 pA, n = 27; Fig. 1C black, left, Fig. 1D, left) with a current density of 0.75 ± 0.08 pA/μm2 (n = 19; Fig. 1D, right). Surprisingly, the current amplitude (22.4 ± 3.8 pA, n = 19; Fig. 1C, black, right, Fig. 1D, left) and density (0.12 ± 0.02 pA/μm2, n = 19; Fig. 1D, right) of nucleated patches from fast-spiking BCs in the DG were at least sixfold smaller than those of O-LM cells (p < 0.001, Wilcoxon rank-sum test) but were comparable to those of CA1 PNs (p = 0.47, Wilcoxon rank-sum test; Fig. 1D). All inward currents of these three cell types were reversibly blocked by the DEG/ENaC channel inhibitor amiloride (10 μm) (Fig. 1C, amiloride, gray; washout, red).
Non-fast-spiking interneurons in the DG have relatively large ASIC currents
We next investigated whether the feature of low ASIC current is unique to fast-spiking (FS) cells. In the DG, we classified all recorded non-fast-spiking interneurons into two functional groups (stuttering and accommodating) based on their firing patterns (Markram et al., 2004) (Fig. 2A). Nucleated patches from both stuttering (STUT) and accommodating (AC) interneurons had significantly larger ASIC currents than FS BCs (Fig. 2B,C). Overall, the ASIC currents in STUT and AC interneurons were 406 ± 56 pA (n = 10) and 399 ± 36 pA (n = 15), respectively (Fig. 2C). Also, both STUT and AC interneurons had higher input resistance than FS BCs. The scatter plot of the ASIC current against the input resistance revealed that FS BCs are featured by relatively low input resistance and low ASIC currents (Fig. 2D).
Figure 2.

ASIC currents of various interneurons in the DG. A, Voltage responses to 1 s depolarizing (+700, +500 and +300 pA) or hyperpolarizing (−100 pA) current pulses in the whole-cell current-clamp configuration from a FS BC (left) and two non-FS interneurons: middle, STUT firing; right, AC firing. Membrane potentials before the pulses were −70 mV. Inset, stimulation protocol. B, Inward currents recorded at −60 mV after rapid pH changes from pH 7.4 to pH 5 in nucleated patches from a FS BC (left) and non-FS interneurons (middle, STUT; right, AC) in the DG. Traces are average of 11–75 sweeps. C, Bar plot summarizing the amplitude of ASIC currents from FS BCs (n = 6), STUT (n = 10) and AC (n = 15) interneurons. **p < 0.005. D, Scatter plot of the input resistance against the ASIC current from all FS and non-FS cells.
ASIC gating is dependent on cell type
Steep pH dependence, Na+ selectivity, and blockade by amiloride and extracellular Ca2+ ions are hallmark properties of ASIC gating (Waldmann et al., 1997; Bolshakov et al., 2002; Immke and McCleskey, 2003; Askwith et al., 2004; Wemmie et al., 2006; Cho and Askwith, 2008; Ziemann et al., 2008). To test pH dependence, we recorded ASIC currents upon different extracellular pH reductions. As represented by Figure 3A, the magnitude of ASIC current in an O-LM cell depended on the pH value. The dose– response curve was fitted with the equation (Eq. 3), yielding the pH value of 6.0 ± 0.0 for the half-maximal activation and the Hill coefficient of 1.2 ± 0.0. We further determined the ionic permeability of ASICs by measuring the reversal potentials (Erev) in the presence of varied [Na+]o. ASIC currents in the normal condition ([Na+]o/[Na+]i = 135/8 mm) reversed at 62 ± 3 mV (n = 4, Fig. 3B). The plot of Erev against [Na+]o revealed that the values of Erev measured in a variety of [Ca2+]o/[Na+]o solutions were close to the Nernst equilibrium potential for Na+ (Fig. 3C, gray line; also see Eq. 4). These results indicate that Na+ is the major permeant ion for ASICs. In addition to the sensitivity to amiloride (Fig. 1C), extracellular Ca2+ was shown to compete with H+ for the ASIC activation site (Immke and McCleskey, 2003). Consistent with this notion, we found that high [Ca2+]o (18 mm) inhibited acid (pH 5)-induced currents by 60 ± 2.3% (supplemental Fig. 3, available at www.jneurosci.org as supplemental material).
ASIC1a is a principal subunit for a functional ASIC, whereas ASIC2 subunit plays a modulatory role in the gating of ASIC, such as desensitization and recovery from desensitization (Askwith et al., 2004). We thus explored the potential differences in ASIC subunit composition of these three neuron types by measuring the desensitization time constant (τdesen), deactivation time constant (τdeact) and the recovery from desensitization of ASIC currents. The τdesen values of native ASICs from these three cell types were all <1 s (Fig. 3D). On the other hand, τdeact values from three cell types were all <10 ms (Fig. 3F). Notably, both τdesen and τdeact of ASICs in O-LM cells were significantly different from those of PNs and BCs. Interestingly, the recovery from desensitization as assessed by the recovery time constant (τrecovery) was fastest (τrecovery = 0.96 ± 0.00 s) in O-LM cells, intermediate (τrecovery = 13.2 ± 0.1 s) in CA1 PNs and slowest (τrecovery = 42.8 ± 1.0 s) in BCs (Fig. 3F). Consistent with the recovery time course, cumulative desensitization of ASIC currents evoked by 0.05 Hz repetitive acid (pH 5) pulses was fastest in BCs, intermediate in PNs and slowest in O-LM cells (Fig. 3G). Together, these results strongly suggest differences in ASIC subunit composition among these three neuron types.
ASIC2 subunit determines the recovery of native ASICs from desensitization
To further correlate the gating properties with gene-expression profile of individual neurons, we analyzed ASIC1a and ASIC2 subunit mRNAs of each neuron type at the single-cell level (Fig. 4A). Single-cell RT-PCR analysis revealed that ASIC1a and ASIC2 mRNAs were coexpressed in CA1 PNs and O-LM cells, whereas only ASIC1a mRNA was detected in most BCs (9 of 11 ASIC-expressing BCs; Fig. 4B). These results correlate well with the notion that the rapid recovery of ASIC currents in O-LM cells is mediated by ASIC1a/2a heteromers, while the prolonged recovery of ASICs from desensitization in BCs is largely attributed to the expression of ASIC1a homomers (Askwith et al., 2004). To make this point clear, we illustrated the recovery time courses of ASICs from O-LM cells (blue line) and BCs (red line) together with those of various recombinant ASICs (Fig. 4C; change to curves obtained by fitting data from Askwith et al., 2004).
PcTX1 preferentially inhibits ASIC currents in basket cells
Homomeric ASIC1a channel is potently inhibited by the PcTX1 (Baron et al., 2002; Chen et al., 2005; Xiong et al., 2008). We, therefore, examined the effects of PcTX1 on functionally distinct ASIC currents in nucleated patches from either O-LM cells or BCs. Because of the very slow recovery time course (τrecovery = 42.8 s) of ASICs in BCs, we thus obtained stable ASIC current amplitudes by applying short (50 ms) acid pulses to nucleated patches (Fig. 5). In control conditions, ASIC currents of O-LM cells and BCs showed little desensitization and were stable over time (Fig. 5, left traces). PcTX1 (30 nm) had only minimal effects on ASIC currents in nucleated patches from O-LM cells (Fig. 5, top, right). The peak current in the presence of PcTX1 was 102 ± 1% of the control (n = 4, p > 0.05; Fig. 5, top, right). In contrast, PcTX1 (30 nm) significantly blocked 76 ± 5% of the ASIC currents in nucleated patches from BCs (n = 6, p < 0.005; Wilcoxon signed-rank test; Fig. 5, bottom, right).
ASIC channel number accounts for differences in current density
Finally, we determined whether the remarkable differences in current densities among the neuron types were derived from differences in channel number (N), maximum open probability (Po, max) or single-channel conductance (γ). We retrieved N, Po, max and γ from the ensembles of macroscopic currents (Fig. 6A) using nonstationary fluctuation analysis. The ensemble variance was calculated from the fluctuation of ASIC currents around the mean (Fig. 6B), plotted against the ensemble mean, and fitted with a parabolic function (Fig. 6C). Analysis from patches of O-LM cells yielded the γ of 5.05 ± 0.74 pS (n = 7; Fig. 6D) and the channel number N of 427 ± 82 (n = 7). For CA1 PNs, though the γ (6.57 ± 1.05 pS, n = 7) was comparable to that of O-LM cells, the estimated N was 69 ± 45 (n = 4; 3 of 7 cells were fitted with a linear function; see below), significantly less than that of O-LM cells (p < 0.05, Wilcoxon rank-sum test). Notably, the variance–mean relation of ASIC currents from all BCs (n = 5) displayed a straight line rather than a parabola, indicating low open-channel probability (Alvarez et al., 2002). In this case, we can determine the γ, but not the N and Po, max in the membrane (Alvarez et al., 2002). By fitting the data points with a linear function, we obtained the γ of 6.29 ± 1.75 pS (n = 5; Fig. 6D) from the slope. Collectively, the γ values were not significantly different among the three groups (p = 0.72, Kruskal–Wallis test). Similarly, the Po, max values at pH 5 were not significantly different between O-LM cells and CA1 PNs (O-LM cells, 0.54 ± 0.06, n = 7 versus PNs, 0.48 ± 0.08, n = 4; p = 0.65, Wilcoxon rank-sum test). In sum, ASIC channel number greatly contributes to the cell type-specific difference in current density.
Dendritic ASIC currents in O-LM cells are higher than those of PNs and BCs
ASICs are distributed at somatodendrites of neurons (Wemmie et al., 2002; Alvarez de la Rosa et al., 2003; Zha et al., 2006, 2009). After filling neurons with red fluorescent dye SR101 (10 μm) via somatic recording, dendrites were traced under epifluorescent microscope. Similar to somatic ASIC currents, dendritic ASIC currents of O-LM cells (V-clamp at −70 mV) evoked by local acid puffing were transient and reversibly inhibited by amiloride (100 μm) (Fig. 7A). Then we determined whether dendritic ASIC currents differed among three distinct types of neurons by local acid puffing along the apical dendrites of CA1 PNs (Fig. 7B), bitufted dendrites of O-LM cells (Fig. 7C) and apical dendrites of BCs (Fig. 7D). ASIC currents in dendrites with the puffing site at distances of 30–100 μm from the soma (280 ± 65 pA, n = 8) of O-LM cells are much larger than those of CA1 PNs (132 ± 28 pA, n = 9) and BCs (52 ± 8 pA, n = 6) (Fig. 7E). Consistently, ASIC currents effectively generated AP trains in O-LM cells when neurons were recorded in the current-clamp configuration but only caused subthreshold membrane depolarization in PNs and BCs under the same conditions (Fig. 7F).
Discussion
Earlier studies reported that GABAergic inhibitory interneurons possess larger ASIC current density than pyramidal cells in the hippocampus (Bolshakov et al., 2002; Cho and Askwith, 2008; Ziemann et al., 2008). In contrast to them, our study shows that fast-spiking, parvalbumin-expressing BCs have comparable ASIC current density to CA1 PNs. Moreover, ASIC current densities and gating greatly differ between two functionally distinct GABAergic (perisomatic versus dendritic) inhibitory interneurons. Furthermore, single-cell RT-PCR analysis reveals coexpression of ASIC1a and ASIC2 subunits in O-LM cells, whereas only ASIC1a is detected in most BCs. The lack of the ASIC2 subunit likely accounts for the prolonged recovery of native ASICs from desensitization in BCs.
Comparisons between native and recombinant ASICs
Heterologously expressed mouse ASIC1a homomers and ASIC1a/2 heteromers in CHO cells desensitize rapidly (τdecay < 1 s) (Askwith et al., 2004). In comparison with them, the values of τdesen of native ASICs from all three cell types are <1 s (Fig. 3D), suggesting that either ASIC1a homomers or heteromeric channels assembled by ASIC1a/2a or ASIC1a/2b combination likely mediate the majority of native channels. Further analyses of ASIC gating implicate differential expression of ASIC subunits in different cell types. Most obviously, the recovery from desensitization of ASICs is fastest in O-LM cells, intermediate in CA1 PNs and slowest in BCs (Fig. 3F). These suggest that ASIC1a/2a heteromers likely mediate ASICs of O-LM cells because the recovery from desensitization of heterologously expressed mouse ASIC1a/2a heteromers as estimated by the τrecovery is <1 s, whereas the values of τrecovery of either recombinant ASIC1a homomers or ASIC1a/2b heteromers are relatively slow (Fig. 4C). Conversely, the very slow recovery of ASICs from desensitization in BCs strongly suggests that the majority of ASICs in BCs is assembled as ASIC1a homomers. This notion is strongly supported by the results of single-cell RT-PCR and pharmacological sensitivity to PcTX1.
However, differences between native and recombinant ASICs still exist, despite that the recovery time course of native ASICs qualitatively recapitulates those of heterologously expressed ASICs in CHO cells. First, there are quantitative differences in the recovery time course of ASICs, particularly between the native ASICs in BCs (τrecovery ∼42.8 s) and the recombinant ASIC1a homomers (τrecovery ∼7 s) (Fig. 4C). Second, recombinant mouse ASIC1a/2a heteromers generate currents that desensitize faster than ASIC1a homomers (Askwith et al., 2004). In contrast, ASICs in O-LM cells (putative “ASIC1a/2a” heteromers) significantly desensitize slower than those (putative “ASIC1a” homomers) in BCs (Fig. 3D). These could be attributed to the differences in expression systems.
The estimated values of γ are not significantly different among the three groups. Notably, single-channel conductances of native ASICs compare well with those measured directly from unitary currents (from 4.2 pS under 10 mm [Ca2+]o to 11.2 pS under 1 mm [Ca2+]o) (Immke and McCleskey, 2003). Also, the values of Po, max at pH 5 are not significantly different between O-LM cells and CA1 PNs. As for BCs, analysis of cumulative desensitization reveals that desensitization of ASICs in nucleated patches of BCs develops more rapidly than those of PNs and O-LM cells during repetitive application of acid pulses (Fig. 3G). This is in agreement with the suggestion that the open probability of ASICs in BCs is relatively low by the nonstationary fluctuation analysis.
Possible functions of ASICs in perisomatic and dendritic inhibitory interneurons
Although our understanding of interneuron heterogeneity is still far from being complete, a major dichotomy in the inhibitory control of pyramidal cells has already been established (Freund and Katona, 2007). Dendritic inhibitory interneurons (for instance, O-LM cells) are responsible for the control of the efficacy and plasticity of glutamatergic inputs from specific sources that terminate in the same dendritic domain (Miles et al., 1996). On the other hand, perisomatic inhibitory interneurons (for instance, BCs) control the output of pyramidal cells (Miles et al., 1996). In addition, several intrinsic properties (see Introduction of this study) of these two major types of interneurons are found to be very different. In this study, we uncover the expression of ASICs as a novel cell type-specific property which might underlie their differences in synaptic transmission and relative susceptibility to brain injury.
Several lines of evidence suggest that ASICs play crucial roles in synaptic transmission. First, long-term potentiation, a form of synaptic plasticity underlying learning and memory, is abrogated at Schaffer collateral-CA1 pyramidal cell synapses in ASIC1a knock-out mice (Wemmie et al., 2002). Second, presynaptic release probability is increased in hippocampal neurons from ASIC1a knock-out mice (Cho and Askwith, 2008). Finally, ASICs interact with several postsynaptic scaffolding proteins such as PSD-95, PICK1 and CaMKII (for review, see Wemmie et al., 2006). More recently, ASIC2 subunits, but not ASIC1a subunits, were shown to target ASICs to the synapse via an association with PSD-95 and loss of ASIC2 subunits decreases the percentage of spines responding to acid (Zha et al., 2009). Interestingly, our results demonstrate that ASIC2 subunit mRNAs were not detected in most BCs and relatively small ASIC currents were detected in BC dendrites. Thus, subunit composition of ASICs in different types of GABAergic inhibitory interneurons might also contribute to cell type-specific long-term plasticity at glutamatergic synapses onto hippocampal interneurons (Nissen et al., 2010).
Deletion of ASIC1a gene was shown to increase the presynaptic release probability and led to paired-pulse depression at the hippocampal glutamatergic synapses (Cho and Askwith, 2008). Conversely, overexpression of ASIC1a subunits in ASIC1a knock-out neurons increases paired-pulse ratio. Thus, relative abundance of ASICs might underlie the heterogeneity of GABAergic inhibitory outputs (Maccaferri et al., 2000). Intriguingly, consistent with this notion, we found a similar correlation between the functional ASIC current and the release probability of interneurons. In this study, BCs with relatively low ASIC expression have high release probability and exhibit paired-pulse depression at short interspike intervals (Kraushaar and Jonas, 2000; Maccaferri et al., 2000). On the contrary, O-LM cells with relatively high ASIC expression have low release probability and show no paired-pulse modulation. (Maccaferri et al., 2000).
Functional implications
Interneurons exhibit differential susceptibility to injury by epileptic insults that are accomplished by transient acidification (Morin et al., 1998; Cossart et al., 2001; Wittner et al., 2001, 2005). In experimental epilepsy, dendrite-targeting interneurons, such as O-LM cells, selectively degenerate, leading to “disinhibition” in dendritic compartments of PNs. In contrast, soma-targeting interneurons, mainly BCs, are relatively spared, resulting in enhanced somatic inhibition (Cossart et al., 2001; Wittner et al., 2005). Increasing studies showed that neurons lacking ASICs are resistant to ischemic/acid injury (Xiong et al., 2004; Gao et al., 2005; Wemmie et al., 2006). Our data show that BCs, in contrast to O-LM cells and other non-fast-spiking interneurons, have strikingly low-density and rapidly desensitizing ASICs. Furthermore, BCs have relatively low input resistance (∼134 MΩ, see Results) compared with O-LM cells (∼336 MΩ). Consequently, relatively large ASIC currents in O-LM cells during transient acidification together with the high input resistance will lead to membrane depolarization and firing of O-LM cells (Fig. 7). Thus, acidification can preferentially induce firing of O-LM cells accompanied by massive Ca2+ influx via voltage-gated Ca2+ channels and thereby might have a greater impact on O-LM cells than BCs. Interestingly, in addition to the unique ASIC expression feature, fast-spiking BCs have very efficient Ca2+ buffer capacity (Aponte et al., 2008). Quantitatively, the magnitude of Ca2+ binding ratio (κs) of BCs (κs ∼200; Aponte et al., 2008) is tenfold larger than that of O-LM cells (κs ∼20; Liao and Lien, 2009). Together, all these factors likely contribute to selective degeneration of O-LM cells and disinhibition of pyramidal cell dendrites induced by experimental epilepsy.
Perspectives
Our results point to the cell type-specific expression of ASICs in hippocampal GABAergic inhibitory microcircuits and the findings demonstrate how the distribution and proportions of ASIC subunits vary in different cells under physiological conditions. Our work provides a better understanding of how acidosis in the hippocampus could influence the network and how hippocampal acidosis might suppress seizure activity. A challenge of future studies will be to delete ASIC gene in a cell type-restricted manner to address the meaning of differential expression of ASICs in the brain.
Footnotes
This work was supported by Yen Tjing Ling Medical Foundation (CI-96-4), Ministry of Education (Aim for The Top University Grant) in Taiwan, National Health Research Institutes (Grants NHRI-EX97-9720NC), and Taiwan National Science Council (Grant 98-2321-B-010-001). We thank Dr. P. Jonas for invaluable comments on initial experiments, Dr. C. C. Askwith for providing ASIC recovery data, Drs. P. Jonas, T. C. Hwang, M. M. Poo, and C. P. Hung for critically reading the manuscript, and Dr. M. Martina for helpful advice.
References
- Alvarez de la Rosa D, Krueger SR, Kolar A, Shao D, Fitzsimonds RM, Canessa CM. Distribution, subcellular localization and ontogeny of ASIC1 in the mammalian central nervous system. J Physiol. 2003;546:77–87. doi: 10.1113/jphysiol.2002.030692. [DOI] [PMC free article] [PubMed] [Google Scholar]
- Alvarez O, Gonzalez C, Latorre R. Counting channels: a tutorial guide on channel fluctuation analysis. Adv Physiol Educ. 2002;26:327–341. doi: 10.1152/advan.00006.2002. [DOI] [PubMed] [Google Scholar]
- Aponte Y, Lien CC, Reisinger E, Jonas P. Hyperpolarization-activated cation channels in fast-spiking interneurons of rat hippocampus. J Physiol. 2006;574:229–243. doi: 10.1113/jphysiol.2005.104042. [DOI] [PMC free article] [PubMed] [Google Scholar]
- Aponte Y, Bischofberger J, Jonas P. Efficient Ca2+ buffering in fast-spiking basket cells of rat hippocampus. J Physiol. 2008;586:2061–2075. doi: 10.1113/jphysiol.2007.147298. [DOI] [PMC free article] [PubMed] [Google Scholar]
- Askwith CC, Wemmie JA, Price MP, Rokhlina T, Welsh MJ. Acid-sensing ion channel 2 (ASIC2) modulates ASIC1 H+-activated currents in hippocampal neurons. J Biol Chem. 2004;279:18296–18305. doi: 10.1074/jbc.M312145200. [DOI] [PubMed] [Google Scholar]
- Baron A, Waldmann R, Lazdunski M. ASIC-like, proton-activated currents in rat hippocampal neurons. J Physiol. 2002;539:485–494. doi: 10.1113/jphysiol.2001.014837. [DOI] [PMC free article] [PubMed] [Google Scholar]
- Bolshakov KV, Essin KV, Buldakova SL, Dorofeeva NA, Skatchkov SN, Eaton MJ, Tikhonov DB, Magazanik LG. Characterization of acid-sensitive ion channels in freshly isolated rat brain neurons. Neuroscience. 2002;110:723–730. doi: 10.1016/s0306-4522(01)00582-6. [DOI] [PubMed] [Google Scholar]
- Chen X, Kalbacher H, Gründer S. The Tarantula toxin psalmotoxin 1 inhibits acid-sensing ion channel (ASIC) 1a by increasing its apparent H+ affinity. J Gen Physiol. 2005;126:71–79. doi: 10.1085/jgp.200509303. [DOI] [PMC free article] [PubMed] [Google Scholar]
- Cho JH, Askwith CC. Presynaptic release probability is increased in hippocampal neurons from ASIC1 knockout mice. J Neurophysiol. 2008;99:426–441. doi: 10.1152/jn.00940.2007. [DOI] [PubMed] [Google Scholar]
- Cobb SR, Buhl EH, Halasy K, Paulsen O, Somogyi P. Synchronization of neuronal activity in hippocampus by individual GABAergic interneurons. Nature. 1995;378:75–78. doi: 10.1038/378075a0. [DOI] [PubMed] [Google Scholar]
- Coryell MW, Wunsch AM, Haenfler JM, Allen JE, Schnizler M, Ziemann AE, Cook MN, Dunning JP, Price MP, Rainier JD, Liu Z, Light AR, Langbehn DR, Wemmie JA. Acid-sensing ion channel-1a in the amygdala, a novel therapeutic target in depression-related behavior. J Neurosci. 2009;29:5381–5388. doi: 10.1523/JNEUROSCI.0360-09.2009. [DOI] [PMC free article] [PubMed] [Google Scholar]
- Cossart R, Dinocourt C, Hirsch JC, Merchan-Perez A, De Felipe J, Ben-Ari Y, Esclapez M, Bernard C. Dendritic but not somatic GABAergic inhibition is decreased in experimental epilepsy. Nat Neurosci. 2001;4:52–62. doi: 10.1038/82900. [DOI] [PubMed] [Google Scholar]
- Du J, Zhang L, Weiser M, Rudy B, McBain CJ. Developmental expression and functional characterization of the potassium-channel subunit Kv3.1b in parvalbumin-containing interneurons of the rat hippocampus. J Neurosci. 1996;16:506–518. doi: 10.1523/JNEUROSCI.16-02-00506.1996. [DOI] [PMC free article] [PubMed] [Google Scholar]
- Efron B, Tibshirani RJ. An introduction to the bootstrap. London: Chapman and Hall/CRC; 1998. [Google Scholar]
- Engel D, Jonas P. Presynaptic action potential amplification by voltage-gated Na+ channels in hippocampal mossy fiber boutons. Neuron. 2005;45:405–417. doi: 10.1016/j.neuron.2004.12.048. [DOI] [PubMed] [Google Scholar]
- Freund TF, Buzsáki G. Interneurons of the hippocampus. Hippocampus. 1996;6:347–470. doi: 10.1002/(SICI)1098-1063(1996)6:4<347::AID-HIPO1>3.0.CO;2-I. [DOI] [PubMed] [Google Scholar]
- Freund TF, Katona I. Perisomatic inhibition. Neuron. 2007;56:33–42. doi: 10.1016/j.neuron.2007.09.012. [DOI] [PubMed] [Google Scholar]
- Gao J, Duan B, Wang DG, Deng XH, Zhang GY, Xu L, Xu TL. Coupling between NMDA receptor and acid-sensing ion channel contributes to ischemic neuronal death. Neuron. 2005;48:635–646. doi: 10.1016/j.neuron.2005.10.011. [DOI] [PubMed] [Google Scholar]
- Gentet LJ, Stuart GJ, Clements JD. Direct measurement of specific membrane capacitance in neurons. Biophys J. 2000;79:314–320. doi: 10.1016/S0006-3495(00)76293-X. [DOI] [PMC free article] [PubMed] [Google Scholar]
- Hartveit E, Veruki ML. Studying properties of neurotransmitter receptors by nonstationary noise analysis of spontaneous postsynaptic currents and agonist-evoked responses in outside-out patches. Nat Protoc. 2007;2:434–448. doi: 10.1038/nprot.2007.47. [DOI] [PubMed] [Google Scholar]
- Hille B. Ion channels of excitable membranes. Ed 3. Sunderland, MA: Sinauer; 2001. [Google Scholar]
- Immke DC, McCleskey EW. Protons open acid-sensing ion channels by catalyzing relief of Ca2+ blockade. Neuron. 2003;37:75–84. doi: 10.1016/s0896-6273(02)01130-3. [DOI] [PubMed] [Google Scholar]
- Jonas P, Bischofberger J, Fricker D, Miles R. Interneuron diversity series: fast in, fast out—temporal and spatial signal processing in hippocampal interneurons. Trends Neurosci. 2004;27:30–40. doi: 10.1016/j.tins.2003.10.010. [DOI] [PubMed] [Google Scholar]
- Klausberger T, Somogyi P. Neuronal diversity and temporal dynamics: the unity of hippocampal circuit operations. Science. 2008;321:53–57. doi: 10.1126/science.1149381. [DOI] [PMC free article] [PubMed] [Google Scholar]
- Klausberger T, Magill PJ, Márton LF, Roberts JD, Cobden PM, Buzsáki G, Somogyi P. Brain-state- and cell-type-specific firing of hippocampal interneurons in vivo. Nature. 2003;421:844–848. doi: 10.1038/nature01374. [DOI] [PubMed] [Google Scholar]
- Koh DS, Geiger JR, Jonas P, Sakmann B. Ca2+-permeable AMPA and NMDA receptor channels in basket cells of rat hippocampal dentate gyrus. J Physiol. 1995;485:383–402. doi: 10.1113/jphysiol.1995.sp020737. [DOI] [PMC free article] [PubMed] [Google Scholar]
- Kraushaar U, Jonas P. Efficacy and stability of quantal GABA release at a hippocampal interneuron-principal neuron synapse. J Neurosci. 2000;20:5594–5607. doi: 10.1523/JNEUROSCI.20-15-05594.2000. [DOI] [PMC free article] [PubMed] [Google Scholar]
- Liao CW, Lien CC. Estimating intracellular Ca2+ concentrations and buffering in a dendritic inhibitory hippocampal interneuron. Neuroscience. 2009;164:1701–1711. doi: 10.1016/j.neuroscience.2009.09.052. [DOI] [PubMed] [Google Scholar]
- Lien CC, Jonas P. Kv3 potassium conductance is necessary and kinetically optimized for high-frequency action potential generation in hippocampal interneurons. J Neurosci. 2003;23:2058–2068. doi: 10.1523/JNEUROSCI.23-06-02058.2003. [DOI] [PMC free article] [PubMed] [Google Scholar]
- Lien CC, Martina M, Schultz JH, Ehmke H, Jonas P. Gating, modulation and subunit composition of voltage-gated K+ channels in dendritic inhibitory interneurones of rat hippocampus. J Physiol. 2002;538:405–419. doi: 10.1113/jphysiol.2001.013066. [DOI] [PMC free article] [PubMed] [Google Scholar]
- Liss B, Roeper J. Correlating function and gene expression of individual basal ganglia neurons. Trends Neurosci. 2004;27:475–481. doi: 10.1016/j.tins.2004.06.007. [DOI] [PubMed] [Google Scholar]
- Maccaferri G, Roberts JD, Szucs P, Cottingham CA, Somogyi P. Cell surface domain specific postsynaptic currents evoked by identified GABAergic neurones in rat hippocampus in vitro. J Physiol. 2000;524:91–116. doi: 10.1111/j.1469-7793.2000.t01-3-00091.x. [DOI] [PMC free article] [PubMed] [Google Scholar]
- Markram H, Toledo-Rodriguez M, Wang Y, Gupta A, Silberberg G, Wu C. Interneurons of the neocortical inhibitory system. Nat Rev Neurosci. 2004;5:793–807. doi: 10.1038/nrn1519. [DOI] [PubMed] [Google Scholar]
- Martina M, Schultz JH, Ehmke H, Monyer H, Jonas P. Functional and molecular differences between voltage-gated K+ channels of fast-spiking interneurons and pyramidal neurons of rat hippocampus. J Neurosci. 1998;18:8111–8125. doi: 10.1523/JNEUROSCI.18-20-08111.1998. [DOI] [PMC free article] [PubMed] [Google Scholar]
- Mazzuca M, Heurteaux C, Alloui A, Diochot S, Baron A, Voilley N, Blondeau N, Escoubas P, Gélot A, Cupo A, Zimmer A, Zimmer AM, Eschalier A, Lazdunski M. A tarantula peptide against pain via ASIC1a channels and opioid mechanisms. Nat Neurosci. 2007;10:943–945. doi: 10.1038/nn1940. [DOI] [PubMed] [Google Scholar]
- McBain CJ, Fisahn A. Interneurons unbound. Nat Rev Neurosci. 2001;2:11–23. doi: 10.1038/35049047. [DOI] [PubMed] [Google Scholar]
- Miles R, Tóth K, Gulyás AI, Hájos N, Freund TF. Differences between somatic and dendritic inhibition in the hippocampus. Neuron. 1996;16:815–823. doi: 10.1016/s0896-6273(00)80101-4. [DOI] [PubMed] [Google Scholar]
- Morin F, Beaulieu C, Lacaille JC. Selective loss of GABA neurons in area CA1 of the rat hippocampus after intraventricular kainate. Epilepsy Res. 1998;32:363–369. doi: 10.1016/s0920-1211(98)00033-3. [DOI] [PubMed] [Google Scholar]
- Nissen W, Szabo A, Somogyi J, Somogyi P, Lamsa KP. Cell type-specific long-term plasticity at glutamatergic synapses onto hippocampal interneurons expressing either parvalbumin or CB1 cannabinoid receptor. J Neurosci. 2010;30:1337–1347. doi: 10.1523/JNEUROSCI.3481-09.2010. [DOI] [PMC free article] [PubMed] [Google Scholar]
- Pouille F, Scanziani M. Routing of spike series by dynamic circuits in the hippocampus. Nature. 2004;429:717–723. doi: 10.1038/nature02615. [DOI] [PubMed] [Google Scholar]
- Sík A, Hájos N, Gulácsi A, Mody I, Freund TF. The absence of a major Ca2+ signaling pathway in GABAergic neurons of the hippocampus. Proc Natl Acad Sci U S A. 1998;95:3245–3250. doi: 10.1073/pnas.95.6.3245. [DOI] [PMC free article] [PubMed] [Google Scholar]
- Stuart GJ, Dodt HU, Sakmann B. Patch-clamp recordings from the soma and dendrites of neurons in brain slices using infrared video microscopy. Pflugers Arch. 1993;423:511–518. doi: 10.1007/BF00374949. [DOI] [PubMed] [Google Scholar]
- Waldmann R, Champigny G, Bassilana F, Heurteaux C, Lazdunski M. A proton-gated cation channel involved in acid-sensing. Nature. 1997;386:173–177. doi: 10.1038/386173a0. [DOI] [PubMed] [Google Scholar]
- Wemmie JA, Chen J, Askwith CC, Hruska-Hageman AM, Price MP, Nolan BC, Yoder PG, Lamani E, Hoshi T, Freeman JH, Jr, Welsh MJ. The acid-activated ion channel ASIC contributes to synaptic plasticity, learning and memory. Neuron. 2002;34:463–477. doi: 10.1016/s0896-6273(02)00661-x. [DOI] [PubMed] [Google Scholar]
- Wemmie JA, Price MP, Welsh MJ. Acid-sensing ion channels: advances, questions and therapeutic opportunities. Trends Neurosci. 2006;29:578–586. doi: 10.1016/j.tins.2006.06.014. [DOI] [PubMed] [Google Scholar]
- Wittner L, Maglóczky Z, Borhegyi Z, Halász P, Tóth S, Eross L, Szabó Z, Freund TF. Preservation of perisomatic inhibitory input of granule cells in the epileptic human dentate gyrus. Neuroscience. 2001;108:587–600. doi: 10.1016/s0306-4522(01)00446-8. [DOI] [PubMed] [Google Scholar]
- Wittner L, Eross L, Czirják S, Halász P, Freund TF, Maglóczky Z. Surviving CA1 pyramidal cells receive intact perisomatic inhibitory input in the human epileptic hippocampus. Brain. 2005;128:138–152. doi: 10.1093/brain/awh339. [DOI] [PubMed] [Google Scholar]
- Xiong ZG, Zhu XM, Chu XP, Minami M, Hey J, Wei WL, MacDonald JF, Wemmie JA, Price MP, Welsh MJ, Simon RP. Neuroprotection in ischemia: blocking calcium-permeable acid-sensing ion channels. Cell. 2004;118:687–698. doi: 10.1016/j.cell.2004.08.026. [DOI] [PubMed] [Google Scholar]
- Xiong ZG, Pignataro G, Li M, Chang SY, Simon RP. Acid-sensing ion channels (ASICs) as pharmacological targets for neurodegenerative diseases. Curr Opin Pharmacol. 2008;8:25–32. doi: 10.1016/j.coph.2007.09.001. [DOI] [PMC free article] [PubMed] [Google Scholar]
- Zha XM, Wemmie JA, Green SH, Welsh MJ. Acid-sensing ion channel 1a is a postsynaptic proton receptor that affects the density of dendritic spines. Proc Natl Acad Sci U S A. 2006;103:16556–16561. doi: 10.1073/pnas.0608018103. [DOI] [PMC free article] [PubMed] [Google Scholar]
- Zha XM, Costa V, Harding AM, Reznikov L, Benson CJ, Welsh MJ. ASIC2 subunits target acid-sensing ion channels to the synapse via an association with PSD-95. J Neurosci. 2009;29:8438–8446. doi: 10.1523/JNEUROSCI.1284-09.2009. [DOI] [PMC free article] [PubMed] [Google Scholar]
- Ziemann AE, Schnizler MK, Albert GW, Severson MA, Howard MA, 3rd, Welsh MJ, Wemmie JA. Seizure termination by acidosis depends on ASIC1a. Nat Neurosci. 2008;11:816–822. doi: 10.1038/nn.2132. [DOI] [PMC free article] [PubMed] [Google Scholar]