

Abstract
Neurons in the adult CNS do not spontaneously regenerate after injuries. The glycosaminoglycan keratan sulfate is induced after spinal cord injury, but its biological significance is not well understood. Here we investigated the role of keratan sulfate in functional recovery after spinal cord injury, using mice deficient in N-acetylglucosamine 6-O-sulfotransferase-1 that lack 5D4-reactive keratan sulfate in the CNS. We made contusion injuries at the 10th thoracic level. Expressions of N-acetylglucosamine 6-O-sulfotransferase-1 and keratan sulfate were induced after injury in wild-type mice, but not in the deficient mice. The wild-type and deficient mice showed similar degrees of chondroitin sulfate induction and of CD11b-positive inflammatory cell recruitment. However, motor function recovery, as assessed by the footfall test, footprint test, and Basso mouse scale locomotor scoring, was significantly better in the deficient mice. Moreover, the deficient mice showed a restoration of neuromuscular system function below the lesion after electrical stimulation at the occipito-cervical area. In addition, axonal regrowth of both the corticospinal and raphespinal tracts was promoted in the deficient mice. In vitro assays using primary cerebellar granule neurons demonstrated that keratan sulfate proteoglycans were required for the proteoglycan-mediated inhibition of neurite outgrowth. These data collectively indicate that keratan sulfate expression is closely associated with functional disturbance after spinal cord injury. N-acetylglucosamine 6-O-sulfotransferase-1-deficient mice are a good model to investigate the roles of keratan sulfate in the CNS.
Introduction
Neurons in the adult mammalian CNS do not spontaneously regenerate after injuries. Many factors contribute to this lack of repair, including a lack of growth-promoting factors (Widenfalk et al., 2001), the poor intrinsic regenerative capacity of CNS neurons (Neumann and Woolf, 1999), inhibitory factors associated with CNS myelin (Filbin, 2003; McGee and Strittmatter, 2003; Schwab, 2004), chemorepulsive molecules (De Winter et al., 2002), and glial scar-associated inhibitors such as chondroitin sulfate (CS) proteoglycans (CSPGs) (Silver and Miller, 2004).
The extracellular matrix of the adult CNS has a unique composition. Instead of collagens, laminin-1, and fibronectin, this matrix is rich in hyaluronic acid and CSPGs (Ruoslahti, 1996). CSPGs are reinduced after injury and inhibit neuronal axon regrowth. The inhibitory function of CSPGs on axonal outgrowth is primarily ascribed to their covalently attached CS-glycosaminoglycans, since the ablation of CS by use of chondroitinase ABC or a DNA enzyme that acts on xylosyltransferase enhances neuronal axon growth in CNS injury (Moon et al., 2001; Bradbury et al., 2002; Grimpe and Silver, 2004). For example, the axon growth of dopamine neurons is enhanced by chondroitinase ABC treatment after nigrostriatal tract transaction (Moon et al., 2001). Chondroitinase ABC treatment has been shown to enhance functional recovery after spinal cord injury in a rat model (Bradbury et al., 2002). It is known that CSPGs activate the Rho–Rho kinase pathway via an unknown receptor, leading to suppression of axonal growth (Borisoff et al., 2003; Mueller et al., 2005).
Keratan sulfate (KS) is another glycosaminoglycan. It is composed of repeating disaccharide units of galactose and N-acetylglucosamine (GlcNAc), where the C6 position of GlcNAc is always sulfated. The 5D4 antibody is commonly used for detection of KS, and it has been demonstrated that 5D4-reactive KS is induced in a rat model of spinal cord injury (Jones and Tuszynski, 2002). The reaction sequence for the biosynthesis of KS consists of N-acetylglucosaminylation, 6-sulfation of a GlcNAc residue exposed at the nonreducing end, and galactosylation (Habuchi et al., 2006; Kitayama et al., 2007). Because GlcNAc sulfation at the C6 position is necessary for KS chain elongation (Kitayama et al., 2007), failure of this sulfation leads to loss of KS synthesis. That is, deficiency of human N-acetylglucosamine 6-O-sulfotransferase-5 (GlcNAc6ST-5) leads to loss of corneal KS synthesis (Akama et al., 2000), and lack of mouse GlcNAc6ST-1 causes loss of 5D4-reactive KS expression in the CNS (Zhang et al., 2006). In this study, to investigate the biological significance of KS in neurological function, we applied a contusion spinal cord injury model to N-acetylglucosamine 6-O-sulfotransferase-1-deficient mice and found that these mice showed better functional recovery than their wild-type counterparts.
Materials and Methods
Mice.
GlcNAc6ST-1−/− mice were produced using D3 embryonic stem cells and an ordinary gene-targeting technology as described previously (Hemmerich et al., 2001). GlcNAc6ST-1+/− mice obtained after backcrossing with C57BL/6J for more than 11 generations were interbred. The littermates obtained were used for the spinal cord injury experiments. These mice were maintained in the animal facilities of Nagoya University. All experiments were performed in accordance with protocols approved by the institutional animal committee.
Spinal cord injury model.
We anesthetized adult C57BL/6J mice, their wild-type littermates, and GlcNAc6ST-1−/− mice (female, 8 weeks old, 20–30 g) using an intraperitoneal injection of pentobarbital sodium (50 mg/kg). After laminectomy at the 10th thoracic spinal lamina, we exposed the dorsal surface of the dura mater. A bilateral contusion injury was created by delivering a 100 kdyn force to the cord using a commercially available spinal cord injury device (Infinite Horizon Impactor; Precision Systems and Instrumentation). Sham controls were subjected to laminectomy only. As postoperative care, the bladder was compressed by manual abdominal pressure twice per day until bladder function was restored, and prophylactic antibiotic treatment [1.0 ml of Bactramin (Roche) in 500 ml of acidified water] was maintained for 1 week. The numbers of mice used and mortality are summarized in supplemental Table 1 (available at www.jneurosci.org as supplemental material).
Reagents.
Anti-KS 5D4 and anti-CS CS-56 monoclonal antibodies were purchased from Seikagaku. A biotin labeling kit-NH2 was used for biotinylation of the 5D4 antibody and purchased from Dojindo Molecular Technologies. CD11b monoclonal antibody was from BioLegend; Cy3-conjugated anti-glial fibrillary acidic protein (GFAP) monoclonal antibody was from Sigma; anti-Iba1 polyclonal rabbit antibody was from Wako; anti-platelet-derived growth factor receptor (PDGFr) polyclonal rabbit antibody was from Thermo Fisher Scientific Anatomical Pathology; anti-GAP-43 polyclonal rabbit antibody was from Millipore Bioscience Research Reagents; anti-serotonin (5HT) polyclonal rabbit antibody was from ImmunoStar; anti-type IV collagen polyclonal rabbit antibody was from LSL; and protein kinase Cγ was from Santa Cruz Biotechnology. Cy3- or Cy2-conjugated streptavidin and Cy3-conjugated anti-mouse IgM were from Jackson ImmunoResearch; Cy3-conjugated anti-rabbit IgG was from Zymed; and fluorescein isothiocyanate (FITC)-conjugated anti-rat IgG was from Sigma. FluorSave was obtained from Calbiochem.
Immunohistochemistry.
Mice were perfused transcardially under deep ether anesthesia with buffered 4% paraformaldehyde. The spinal cords were removed, postfixed in 4% paraformaldehyde overnight, and cryoprotected in buffered 30% sucrose during the subsequent night. Tissues were cut into 12 μm sections with a cryostat and mounted on glass slides. Sections were blocked in PBS containing 3% bovine serum albumin (BSA) and 5% normal mouse serum for staining of biotin-conjugated anti-KS 5D4 or blocked in PBS containing 1% BSA and 10% normal goat serum for other immunohistochemistry. Sections were then incubated with the primary antibodies at 100× dilution in a blocking solution overnight at 4°C in PBS containing 3% BSA and 5% normal mouse serum or overnight at 4°C in 1% BSA and 10% normal goat serum. After rinsing in PBS, the sections were incubated with the secondary antibody (Cy3- or Cy2-conjugated streptavidin, 1:100; Cy3-conjugated goat anti-rabbit IgG, 1:100; Cy3-conjugated goat anti-mouse IgM, 1:100; or FITC-conjugated goat anti-rat IgG, 1:100) for 60 min at room temperature. Subsequently, the sections were rinsed in PBS, mounted with FluorSave, and examined by confocal microscopy (MRC 1024; Bio-Rad). GAP-43 staining was performed using 3,30-diaminobenzidine (Wako).
Anterograde labeling of the cortico-spinal tract.
Eight weeks after injury, descending corticospinal tract (CST) fibers were labeled with biotin-dextran amine (BDA; 10% in saline; 3.2 μl per cortex; molecular weight, 10,000; Invitrogen) injected under anesthesia at the left and the right motor cortices (coordinates: 2 mm posterior to the bregma, 2 mm lateral to the bregma, 0.5 mm depth). For each injection, 0.2 μl of BDA was delivered for a period of 30 s via a 15–20-μm-inner-diameter glass capillary attached to a microliter syringe (ITO). Two weeks after BDA injection, the animals were killed by perfusion with PBS followed by 4% paraformaldehyde. The spinal cords were dissected, postfixed overnight in the same fixatives, and cryopreserved in 30% sucrose in PBS. A 20 mm length of spinal cord 10 mm rostral and 10 mm caudal to the lesion site was embedded in Tissue Tek OCT. These blocks were sectioned in the transverse plane (25 μm). Sections were blocked in PBS with 0.3% Triton X-100 for 4 h and incubated for 2 h with Alexa Fluor 488-conjugated streptavidin (1:400; Invitrogen) in PBS with 0.05% Tween 20. We then took serial cross sections of the spinal cord and performed quantitative analysis of the distribution of the axons. Degrees of BDA uptake were assessed by counting the total number of fibers in the cross section 5 mm rostral to the lesioned site, where the CST was intact. For quantification of the number of labeled corticospinal axons 5 mm caudal to the lesion site, the number of labeled fibers was counted in the gray matter and divided by the number of labeled corticospinal axons 10 mm above the lesion for each animal. The labeled fibers were counted using MetaMorph software. Light intensity and thresholding values were maintained at constant levels for all analyses.
Reverse transcription-PCR.
The forward primer 5′-AAGCCTACAGGTGGTGCGAA-3′ and reverse primer 5′-CAGGACTGTTAACCCGCTCA-3′ were used for reverse transcription (RT)-PCR for GlcNAc6ST-1 expression, and the forward primer 5′-GGTGGAGGTCGGAGTCAACG-3′ and reverse primer 5′-CAAAGTTGTCATGGATGACC-3′ were used for RT-PCR for glyceraldehyde 3-phosphate dehydrogenase (GAPDH) expression. SuperScript III reverse transcriptase (Invitrogen) was used to synthesize cDNA.
Morphometry.
The epicenter of a lesion was determined by hematoxylin and eosin staining of several of the serial 12 μm sections. All the image analyses were performed using spinal cord samples prepared from six sagittal sections at 12 μm intervals (three sections on either side of the midline, which was identified by the appearance of the central tube), and all the axial image analyses in Figure 6 were performed using spinal cord samples from positions 5 mm caudal to the lesion site. Statistical analyses were performed for five mice for each experimental group. To count reactive astrocytes, standardized areas for sampling in six sections from each animal in each group were identified as a 600-μm-wide band of spinal cord adjoining the cord–lesion interface in each section.
Figure 6.
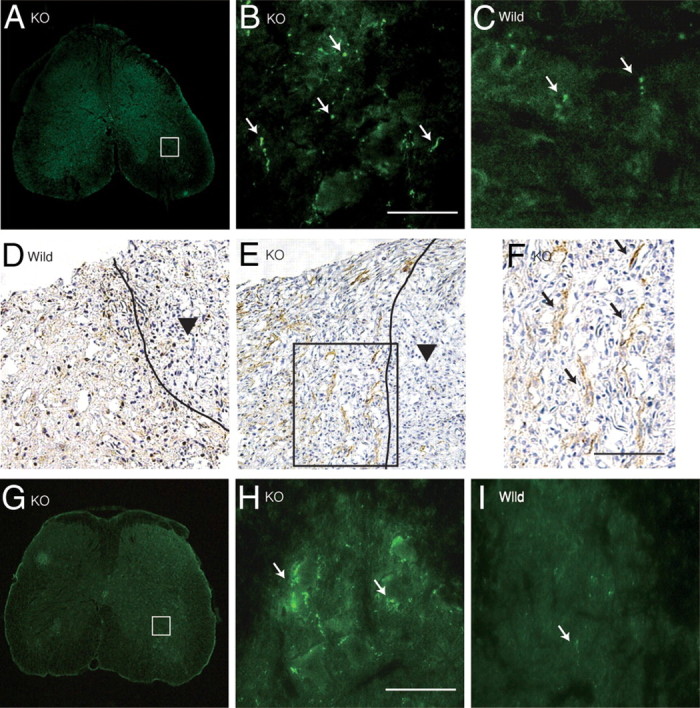
Axonal growth. 5HT staining of the ventral horn (A–C; 5 mm distal to the lesion), GAP43 staining (D–F), and tracer-fiber counts of the CST (BDA-positive fibers) (G–I; 5 mm caudal to the lesion) are shown for GlcNAc6ST-1−/− (A, B, E–H) and wild-type (C, D, I) mice. Scale bar, 50 μm. Higher-magnification figures of the boxed areas in A, E, and G are shown in B, F, and H, respectively. The arrows in B, C, F, H, and I indicate 5HT-, GAP43-, and BDA-positive fibers, respectively. The arrowheads in D and E indicate the contusion area. The drawn lines indicate the margins of the lesion core. Five mice were used for each genotype at 4 weeks after injury. The sections in A–C, G, H, and I are the axial sections of the injured spinal cord. The sections in D–F are the midline sagittal sections of the injured spinal cord. KO, Knock-out.
Mean values for each animal were then compared. Light intensity and thresholding values were maintained at constant levels for all analyses by a computer-driven microscope stage (MetaMorph Offline version 6.3 r2; Molecular Devices). The amounts of fibrous tissue and axonal outgrowth of the wound area were assessed by counting signals visualized by staining with anti-type IV collagen, CD11b, CS-56, GAP-43, and 5HT antibodies, respectively, for 640 × 2200 μm2 counting frames around a lesion. Data were collected for at least five mice with each genotype in each experiment.
Footfall test.
Mice were subjected to the grid runway test to assess locomotor function recovery at 6 weeks after injury. Performance on a wire grid was evaluated for 3 min by counting footfalls. A footfall was defined as either hindpaw missing a rung and extending through the space between adjacent grids. The wire grid was positioned flat and was 7 × 11 inches with grid squares of 0.35 × 0.35 inches. The number of footfalls was counted for five mice in each group.
Footprint test.
In the footprint analysis, the hindpaws were covered with ink to record walking patterns during continuous locomotion across a paper runway (1.2 × 12 inches) at 6 weeks after injury, and the stride lengths were calculated. Strides were analyzed only when mice ran with constant velocity. All strides on the first and last 5 cm of the passage were excluded because of changing velocity.
Behavioral testing.
The locomotor performance of animals was analyzed using the Basso mouse scale (BMS) open-field score (Basso et al., 2006) for 8 weeks, since the BMS has been shown to be a valid locomotor rating scale for mice. The evaluations were made by two blind observers for all analyzed groups. Briefly, the BMS is a nine-point scale that provides a gross indication of locomotor ability and determines the phases of locomotor recovery and features of locomotion. The BMS score was determined for seven mice in each group.
Electrophysiology.
In terminal electrophysiological experiments, after an intraperitoneal injection of ketamine (100 mg/kg), short trains of five square-wave stimuli of 0.5 ms duration with an interstimulus interval of 2 ms were delivered through the occipito-cervical area by small electrode balls, and needle electrodes were placed in both hindlimbs. The active electrode was placed in the muscle belly, and the reference electrode was placed near the distal tendon of the muscle in each limb. The ground electrode was placed subcutaneously between the coil and the recording electrodes. The onset latency was measured as the length of time in milliseconds between the stimulus and the onset of the first wave. One hundred responses were averaged and stored for off-line analysis of latency.
Cell culture.
Sprague Dawley rats at postnatal days 7–9 were killed, and the cerebella were collected. The meninges were carefully removed with fine forceps, and the remaining tissues were minced and digested using a Papain Dissociation System (Worthington). Dissociated cells were applied to a 35/60% two-step Percoll gradient and centrifuged at 3000 × g for 15 min. Cerebellar granule neurons at the interface were collected. Cells were suspended in Neurobasal medium (Invitrogen) supplemented with 2% B27 (Invitrogen), 2 mm glutamine, an additional 20 mm KCl, 50 U/ml penicillin, and 50 μg/ml streptomycin.
Substrate preparation.
Four-well chamber slides (NUNC) were coated with 20 μg/ml poly-l-lysine (PLL; Sigma) and left overnight at 4°C and then were coated with chick brain proteoglycans (Millipore Bioscience Research Reagents) or the other indicated substrates and left for 4 h at 37°C. If indicated, proteoglycans were treated with 200 mU/ml chondroitinase ABC or 5 mU/ml keratanase II derived from Bacillus sp. Ks36 (Seikagaku) in PBS at 37°C. Other substrate materials included poly-l-ornithine, myelin-associated glycoprotein (Sigma), Nogo, oligodendrocyte myelin glycoprotein (R & D Systems), KS and chondroitin sulfate C (Seikagaku).
Cell adhesion assay.
Cerebellar granule neurons were seeded onto chick proteoglycan-coated chamber slides at 2.0 × 10⁵ per well. After 2 h, nonadherent cells were washed out with PBS, and adherent cells were visualized by nuclear staining with 4′,6-diamidino-2-phenylindole (DAPI). The number of adherent cells was counted under 200× magnification (six fields).
Neurite outgrowth assays.
Cerebellar granule neurons were seeded onto four-well chamber slides at 2.0 × 10⁵ per well. Twenty-four hours after seeding, the neurons were fixed with 4% paraformaldehyde/PBS and stained with anti-neuron-specific β-tubulin (Covance) to visualize neurites. Neurite lengths were measured from at least 100 neurons that had neurites longer than twice the cell body diameter, per condition from duplicate wells, and quantified as described previously (Ughrin et al., 2003).
Isolation and purification of proteoglycans from mouse brains.
Whole brains were isolated from C57BL/6J mice (postnatal day 5). Tissues were homogenized in PBS containing 10 mm N-ethylmaleimide and protease inhibitor mixtures (Nacalai Tesque) using a Dounce-type homogenizer. Homogenates were centrifuged at 24,000 × g for 30 min, and supernatants were applied to DEAE-Sepharose (GE Healthcare). Samples were washed three times with wash buffer (50 mm Tris-HCl, pH 7.5, 2 m urea, 0.25 m NaCl, 20 mm EDTA, 0.2 mm PMSF, 1 mm N-ethylmaleimide), and the proteoglycans were eluted with 2 m NaCl. The eluent was concentrated using a size-exclusion spin column (molecular weight cutoff, 100 kDa), and the protein concentration was determined using a Micro BCA Protein Assay kit (Thermo Fisher Scientific).
Spot assay.
PLL-coated chamber slides were air dried and spotted with 5 μl of proteoglycans (10 μg/ml) from mouse brains. The spotted area was visualized by staining with rhodamine B (10 μg/ml). If indicated, proteoglycans were predigested with keratanase (500 mU/ml) and keratanase II (5 mU/ml) at 37°C for 2 h before spotting. Cerebellar granule neurons were seeded onto four-well chamber slides at 1.0 × 10⁵ or 1.0 × 10⁶ per well.
Coating efficiency.
Five microliters of aggrecan (50 μg/ml), which had been treated with or without keratanase (500 mU/ml) and keratanase II (5 mU/ml) at 37°C for 2 h, were spotted onto PLL-coated chamber slides. After overnight incubation at 37°C, the coated aggrecan was visualized using an anti-CS antibody (CS56), followed by Alexa-488-conjugated anti-mouse IgM antibody.
Statistical analysis.
Statistical analyses were performed with an unpaired two-tailed Student's t test for single comparisons and one-way ANOVA for multiple comparisons. For the footfall and footprint scores, repeated-measures ANOVA and the Mann–Whitney U test were used. In all statistical analyses, values of p < 0.05 were considered to indicate significance. To obtain the data for statistical analyses, the investigators were blinded to the genotypes in all procedures.
Results
Induction of KS expression after spinal cord injury in wild-type mice
We used a contusion injury model of the spinal cord to investigate the significance of KS in neurological function after injuries. The contusion injury of the spinal cord was made at the 10th thoracic level with 100 kdyn using an Infinite Horizon Impactor. To reveal the expression and localization of KS, 5D4, an anti-KS monoclonal antibody, was used. 5D4-reactive KS expression was induced around the core lesion, reached a maximum level around 5–7 d after injury in wild-type mice (Fig. 1A), and was not detected at all in GlcNAc6ST-1−/− mice (Fig. 1B–D). GlcNAc6ST-1 expression was also enhanced in injured wild-type mice (Fig. 1E).
Figure 1.
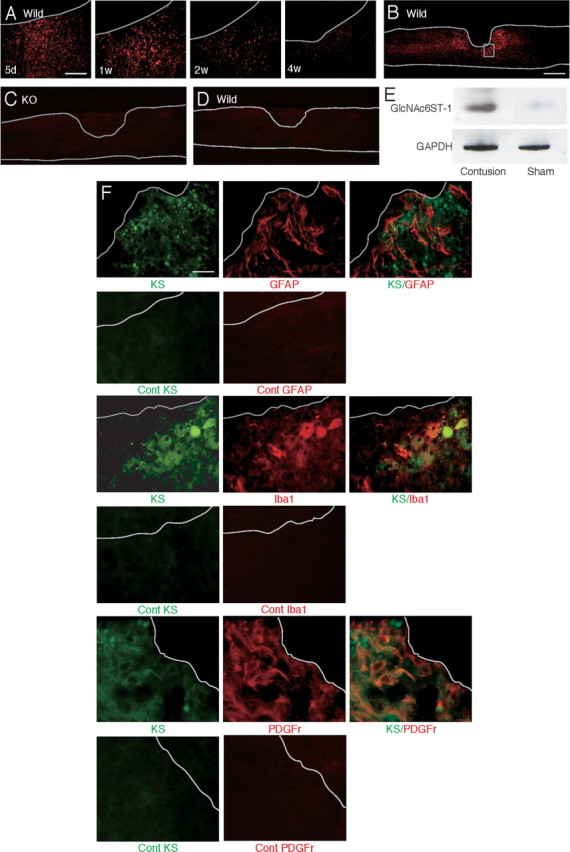
KS expression after spinal cord injury. A, Expression profile of 5D4-reactive KS in wild-type mice after spinal cord injury. Scale bar, 100 μm. d, Day; w, week. B–D, KS was expressed around the lesion center 7 d after injury in wild-type mice (B) but was not detected in GlcNAc6ST-1−/− mice (KO; C) or isotype-matched IgG controls (D). E, RT-PCR for GlcNAc6ST-1 and GAPDH was performed for samples from the wild-type mouse spinal cord 7 d after injury or sham operation. F, Double staining for KS and a glial cell marker. Reactive astrocytes (GFAP), microglia (Iba1), and oligodendrocyte precursors (PDGF receptors) were examined. Scale bar, 50 μm. The sections shown are midline sagittal sections of the injured spinal cord. The drawn lines indicate the margins of the lesion core (A) and the outline of the spinal cord (B, C).
Antibodies against GFAP, Iba1, and PDGFr were used to identify KS-expressing cells. 5D4-reactive KS did not overlap GFAP, but a portion of the Iba1-positive cells overlapped 5D4-reactive cells (Fig. 1F). Almost all PDGFr-positive cells were 5D4 positive (Fig. 1F). These data indicated that KS was mainly expressed by oligodendrocyte precursor cells (PDGFr positive) and partially expressed by microglia (Iba1 positive), which is consistent with the 5D4-reactive KS expression previously reported in a rat spinal cord injury model (Jones and Tuszynski, 2002).
CST, CS expression, and inflammatory cell accumulation
Protein kinase C-γ is a marker for the CST. Protein kinase C-γ immunoreactivity was observed in the dorsal column and lamina II of the spinal cords of uninjured mice (Fig. 2A, arrows and arrowheads, respectively) at the T5 level of the cord. The immunoreactivity was similar in wild-type and GlcNAc6ST-1−/− mice (Fig. 2A), and the BMS locomotor score before spinal cord injury was also similar in both groups (data not shown), indicating that the CST had formed in a normal fashion in GlcNAc6ST-1−/− mice and thus that these mice could be used for the motor function analyses.
Figure 2.

CST and CS expression after injury. A, The CST was stained with anti-protein kinase Cγ antibody (arrow). Densely packed immunofluorescent small cells are located in the inner part of lamina II of the substantia geratinosa (arrowhead) on the axial section. Scale bar, 200 μm. The sections shown are axial sections of the injured spinal cord. B, CS expression was determined with CS-56 antibody. Scale bar, 500 μm. The sections shown are the midline sagittal sections of the injured spinal cord. The drawn lines indicate the outline of the spinal cord. C, Quantification of CS expression. Five mice for each genotype at each time point were examined. Quantification data are the means ± SEM. ns, Not significant (Student's t test). w, Week; KO, knock-out.
In contrast to KS expression, CS expression in GlcNAc6ST-1−/− mice as judged by CS-56 immunoreactivity was comparable to that in wild-type mice (Fig. 2B,C). Furthermore, CD11b (a marker of monocytes/macrophages and granulocytes)-positive inflammatory cells were accumulated in the lesion to a similar extent in wild-type and GlcNAc6ST-1−/− mice (data not shown).
Motor function
We next evaluated functional recovery after injury. The footfall test and footprint test were used to objectively evaluate motor function. For the footfall test, mice were placed on a lattice of thin metal wires. This test requires accurate limb placement and precise motor control. Intact animals cross the grid without making footfalls, whereas a paralytic foot tends to fall from the lattice during movement. The numbers of footfalls were comparable between wild-type and GlcNAc6ST-1−/− mice 3 d after injury (Fig. 3A). GlcNAc6ST-1−/− mice gradually recovered and, at 4–6 weeks after injury, showed footfall counts comparable to those of sham-operated mice (Fig. 3A). In contrast, wild-type mice still showed frequent footfalls at 4 and 6 weeks after injury (Fig. 3A; see movie in supplemental Fig. S1, available at www.jneurosci.org as supplemental material).
Figure 3.
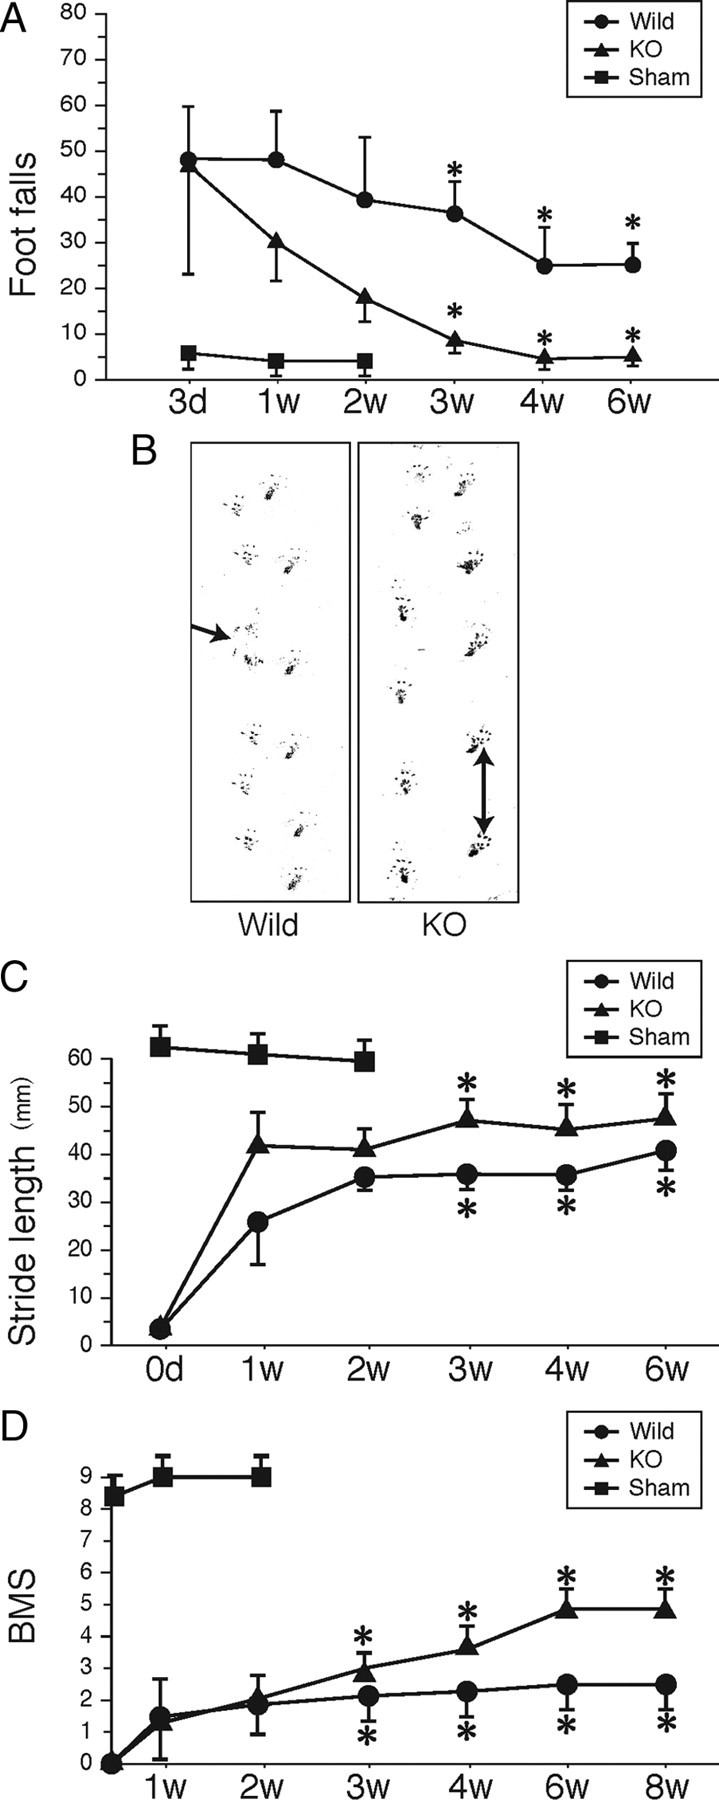
Footfall and footprint tests and BMS scoring. A, Footfall test. The graph shows data from five mice for each genotype at each time point. B, Representative photos of the footprint test taken 4 weeks after injury. The arrow indicates a toe drop. C, Data of the footprint test are quantified. Five mice were used for each genotype at each time point. Quantification data are the means ± SEM (repeated-measures ANOVA and the Mann–Whitney U test). D, BMS scoring. The graph shows data from seven mice for each genotype at each time point. *p < 0.05 (wild-type vs GlcNAc6ST-1−/− mice). d, Day; w, week; KO, knock-out.
On the footprint test, GlcNAc6ST-1−/− mice showed a well balanced and organized walk at 4 weeks after injury, whereas wild-type mice showed a disorganized walk, sometimes with toe drop (Fig. 3B, arrow). The profiles of stride length deduced from the footprints clearly demonstrated that the recovery of motor function was significantly better in GlcNAc6ST-1−/− mice (Fig. 3C).
We also performed BMS locomotor scoring for 8 weeks. There was a significantly better recovery in the GlcNAc6ST-1−/− mice than in the wild-type controls (Fig. 3D). These data were consistent with those of our footfall scoring and footprints, in which a significant recovery was observed from 3 weeks after the spinal cord injury (Fig. 3B–D). Using the same mice as used for BMS scoring, we also examined the footfall test results over a longer period (supplemental Fig. S2 and Table 1, available at www.jneurosci.org as supplemental material) and confirmed the reproducibility of the data in Figure 3A. These mice were also compared with hemisection and total section models as described below.
Next, to confirm that our 100 kdyn contusion model inflicted an injury of sufficient severity, we subjected additional mice to total section and hemisection injuries and compared their motor function with that of our 100 kdyn contusion injury model. In the footfall test, the hemisection model showed a substantial degree of spontaneous recovery, reaching an almost normal level 6 weeks after spinal cord injury, whereas the total section model showed a severe motor function disturbance even 6 weeks after injury. The 100 kdyn contusion injury was more severe than the hemisection injury but milder than the total section injury (supplemental Fig. S2, available at www.jneurosci.org as supplemental material). Furthermore, in the BMS scores of wild-type mice, we did not observe spontaneous recovery of motor function even 8 weeks after contusion injury (Fig. 3D). Together, these results suggest that our contusion model was sufficiently severe and was appropriate for evaluating functional recovery after spinal cord injury.
Motor-evoked potential has been widely used in clinical and animal trials of spinal cord injury to evaluate the neuromuscular system function. In the present work, the latency of motor-evoked potential was measured to also objectively evaluate motor function. Mice received electrical stimuli at the occipito-cervical area, and the motor-evoked potential was recorded at both hindlimbs. The latency of the motor-evoked potential was measured from the onset of the stimulus to the first response of each wave. At 1 week after injury, the latency was elongated to a similar extent in wild-type and GlcNAc6ST-1−/− mice, but at 6 weeks after injury, the latency of GlcNAc6ST-1−/− mice became comparable to that of the sham-operated controls, whereas that of wild-type mice was significantly longer (Fig. 4). These data support the conclusion that functional recovery was significantly better in GlcNAc6ST-1−/− mice.
Figure 4.
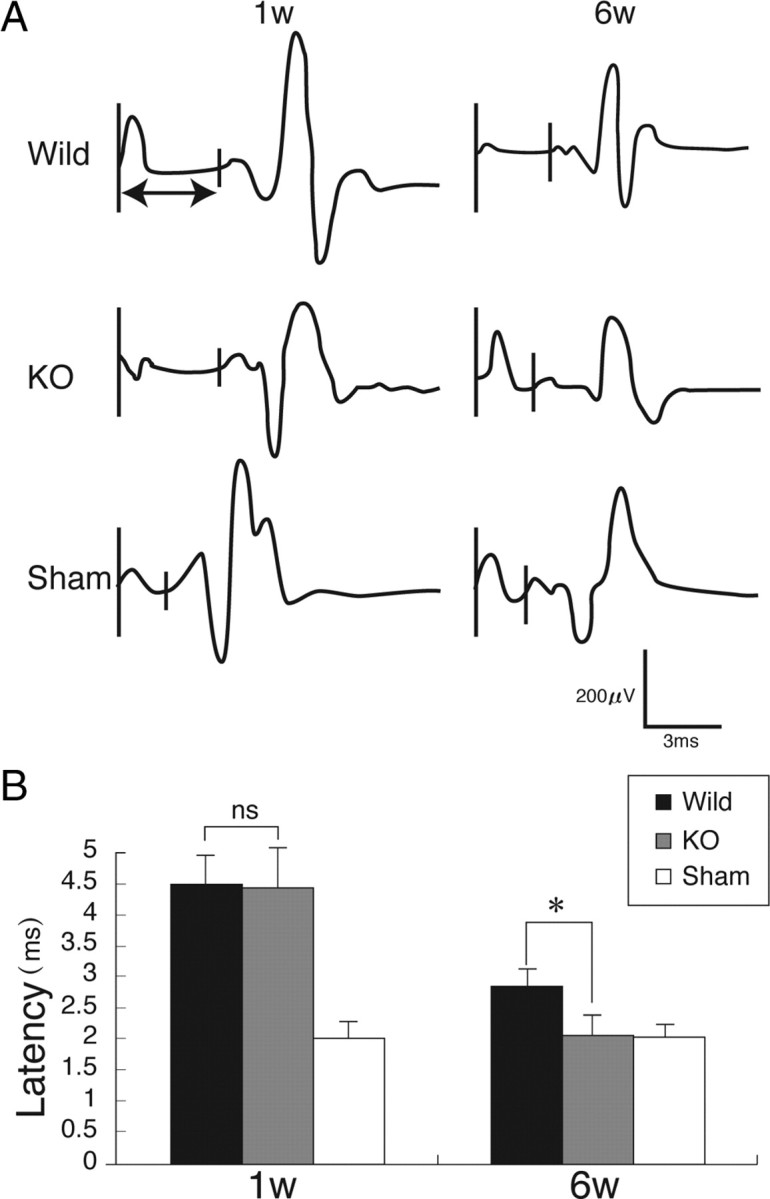
Motor-evoked potential. A, Representative profiles of motor-evoked potentials are shown. B, Latency times were quantified. Five mice were used for each genotype at each time point. *p < 0.05. Quantification data are the means ± SEM (one-way ANOVA). W, week; KO, knock-out; ns, not significant.
Glial scar formation
We next examined glial scar formation. Accumulation of GFAP-positive reactive astrocytes appeared after injury in both wild-type and GlcNAc6ST-1−/− mice. However, their accumulation was weaker in GlcNAc6ST-1−/− mice than in wild-type mice: the GFAP-positive area in a region of 600 μm width around the lesion core was significantly smaller in GlcNAc6ST-1−/− mice (Fig. 5A–C). An important marker for glial scarring is collagen IV, which appears in the late stages of glial scarring (Liesi and Kauppila, 2002). In the present study, collagen IV expression in the injured area became apparent 7 d after injury in both wild-type and GlcNAc6ST-1−/− mice, but the margin was unclear. There was no difference in scar area (the collagen IV-positive area) between the two genotypes. The margin of the scar area became clear at 4 weeks after injury, and the scar area was significantly reduced in GlcNAc6ST-1−/− mice (Fig. 5D,E).
Figure 5.
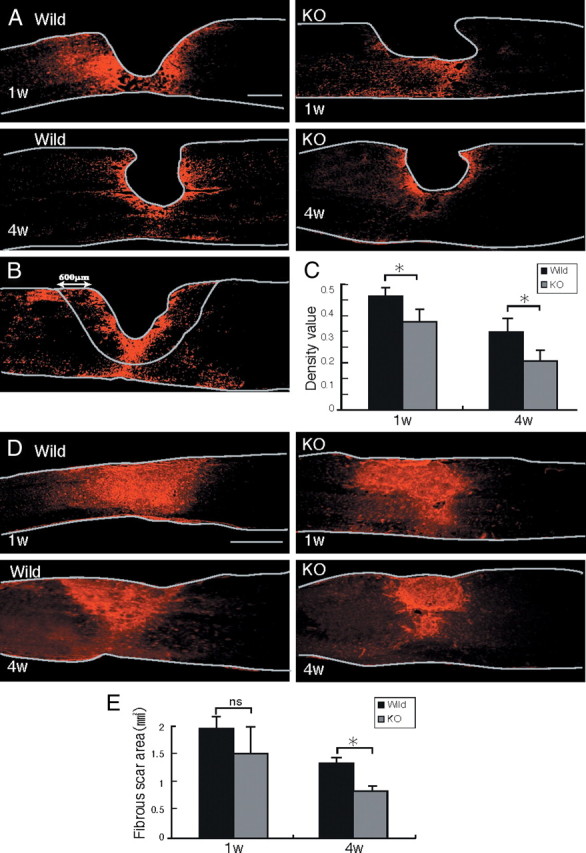
Reactive astrocyte accumulation and collagen IV deposition. A, Representative photos for GFAP expression are shown. Scale bar, 500 μm. The drawn lines indicate the margins of the lesion core and the outline of the spinal cord. B, The GFAP-positive area in a field of 600 μm width around the lesion center (lack of GFAP signal) was measured. The drawn lines indicate the outline of the spinal cord and the measured area. C, The GFAP-positive area is summarized in the graph. Five mice were used for each genotype at each time point. *p < 0.05. D, Representative photos for collagen IV expression are shown. Scale bar, 500 μm. The drawn lines indicate the outline of the spinal cord. E, The collagen IV-positive areas are summarized in the graph. Five mice were used for each genotype at each time point. *p < 0.05. Quantification data are the means ± SEM (Student's t test). The sections shown are midline sagittal sections of the injured spinal cord. W, week; KO, knock-out; ns, not significant.
Neuronal axon growth
Regeneration of the serotonergic descending raphespinal tract may partly explain the reason for motor function recovery after spinal cord injury in rodents (Kim et al., 2004). We stained tissues 5 mm distal to the lesion for 5-hydroxytryptamine (5HT), since serotonergic axons are 5HT positive. 5HT-positive fibers were more abundantly found in the ventral horn of the gray matter in GlcNAc6ST-1−/− mice than in wild-type mice (5HT-positive area: wild-type, 972 ± 1080 vs GlcNAc6ST-1−/−, 7120 ± 1168 μm2; p < 0.005) (Fig. 6A–C). Positive GAP-43 staining reflects axon regeneration and sprouting (Tetzlaff and Bisby, 1989; King et al., 2001). GAP-43-positive axons were also much more abundant in GlcNAc6ST-1−/− mice than in wild-type mice at 4 weeks after injury (GAP-43-positive fiber counts/150,000 μm2: wild-type, 1962 ± 1522 vs GlcNAc6ST-1−/−, 6631 ± 1090; p < 0.005) (Fig. 6D–F). Moreover, we investigated axonal growth in the CST. In tracer-fiber counts for the CST, the number of BDA-positive fibers was increased in the region caudal to the epicenter in GlcNAc6ST-1−/− mice, particularly in the gray matter in this region (Fig. 6G–I). For quantification of the number of labeled BDA, the number of labeled fibers was counted in the gray matter 5 mm caudal to the lesion and divided by the number of labeled corticospinal axons 10 mm rostral to the lesion for each animal. There was a significant difference between wild-type and GlcNAc6ST-1−/− mice (BDA-positive fibers in caudal region/rostral region: wild-type, 1.9 ± 1.1% vs GlcNAc6ST-1−/−, 6.9 ± 1.0%; p < 0.005).
Chondroitinase ABC promotes collateral sprouting of spared fibers in the cuneate nucleus after cervical spinal cord injury (Massey et al., 2006), suggesting that proteoglycans limit not only axon regeneration but also sprouting. Our data on 5HT staining, GAP-43 staining, and CST tracer-fiber counts are in line with this idea.
Requirement of KS for the proteoglycan-mediated inhibition of neurite growth
To further explore the underlying mechanisms involving KS in the functional disturbance, we performed in vitro experiments. We first asked whether KS was sufficient to inhibit neurite growth. However, glycosaminoglycans (KS and CS), whether administered singly or in combination, did not inhibit neurite outgrowth (Fig. 7A). Thus, we focused on the role of KS chains on proteoglycans.
Figure 7.
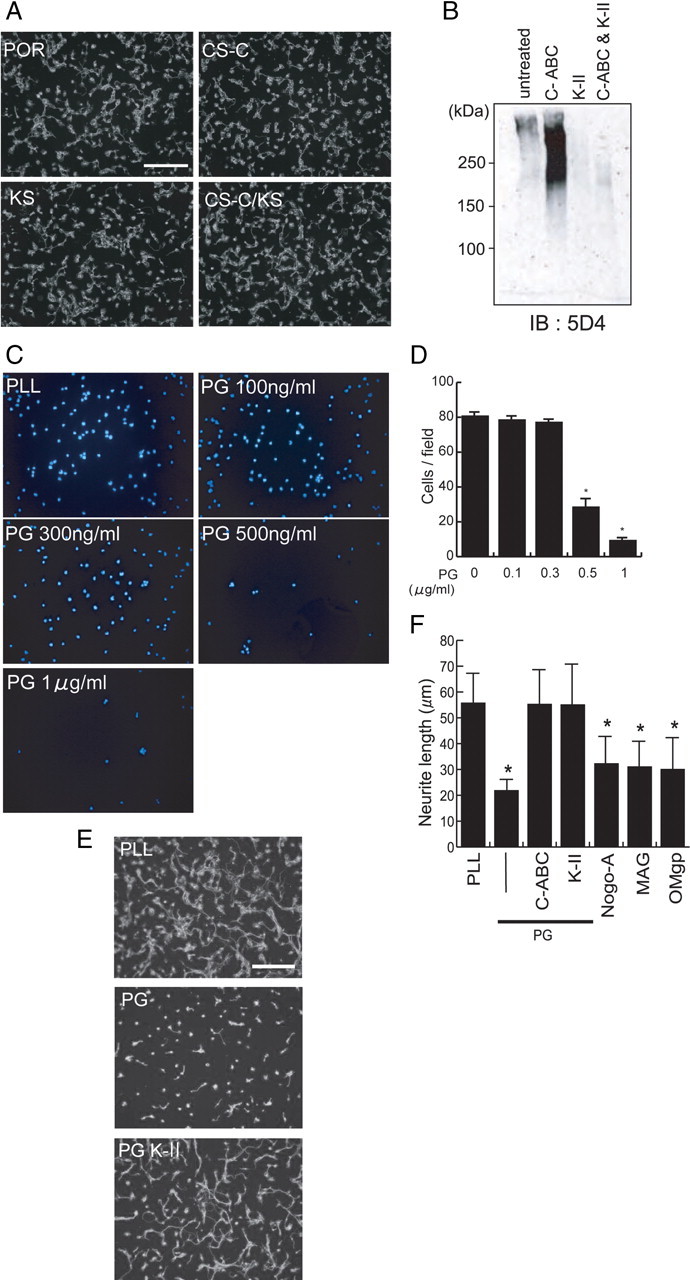
Requirement of KS for the proteoglycan-mediated inhibition of neurite outgrowth. A, Postnatal day 8 (P8) rat cerebellar granule neurons were cultured on poly-l-ornithine (POR), POR plus chondroitin sulfate C (CS-C) (20 μg/ml), or POR plus KS (20 μg/ml). Scale bar, 100 μm. B, Chick brain proteoglycans contained KS. Chick brain proteoglycans (CC117; Millipore) were digested with chondroitinase ABC (C-ABC; 500 mU/ml), keratanase II (K-II; 5 mU/ml), or both and subjected to Western blot analysis. Note that C-ABC treatment revealed KS epitopes. C, P8 rat cerebellar granular neurons were cultured on PLL or proteoglycan (PG) extracted from chick brains. To count adhered cells, the nucleus was stained with DAPI, and the cell number was counted for six fields under 200× magnification. D, The quantification of C. Data represent the average cell number ± SD. *p < 0.01, versus 0 μg of PG. E, P8 rat cerebellar granular neurons were cultured on PLL or PG extracted from chick brains. Keratanase II treatment restored the neurite outgrowth. Scale bar, 100 μm. F, The quantification of E. Data represent the average neurite length ± SD. *p < 0.05 versus PLL. PG (300 ng/ml), C-ABC (200 mU/ml), K-II (5 mU/ml), Nogo (800 ng/ml), myelin-associated glycoprotein (MAG) (400 ng/ml), and oligodendrocyte myelin glycoprotein (OMgp) (400 ng/ml) were used.
Proteoglycans purified from the brains of chicks contained both KS and CS, because the 5D4-reactive smear appeared more strongly after the CS-degrading enzyme chondroitinase ABC treatment, and the smear disappeared after keratanase II treatment on Western blot analysis (Fig. 7B). As it is known that proteoglycans inhibit not only neurite outgrowth but also cell adhesion to the substrate (Kaneko et al., 2007), we examined whether the proteoglycans used in this study would inhibit cell–substrate adhesion. As shown in Figure 7, C and D, the number of cells adhered to the substrate decreased as the concentration of coated proteoglycans increased. However, if the proteoglycan concentration was lower than 300 ng/ml, the number of cells adhering to the proteoglycans was comparable to the number adhering to the PLL-coated slides (Fig. 7C,D). Therefore, we decided to use the condition of 300 ng/ml proteoglycans for coating in the neurite outgrowth assay, so that we could discriminate the effect of proteoglycans on neurite outgrowth from that on cell–substrate adhesion.
Proteoglycans coated on the substratum strikingly inhibited the neurite outgrowth of primary neurons compared with the PLL control (Fig. 7E,F). Molecules derived from myelin, such as Nogo, myelin-associated glycoprotein, and oligodendrocyte-myelin glycoprotein, are known as strong in vivo inhibitors of axonal regrowth. Our in vitro assay showed that these molecules also inhibit the neurite outgrowth of primary granular neurons from the rat cerebellum (Fig. 7F). Notably, the KS-degrading enzyme keratanase II blocked the proteoglycan-mediated inhibition, and this blocking effect was comparable to that of chondroitinase ABC (Fig. 7E,F).
Finally, we developed an assay system, the spot assay, and used it to examine the activity of mouse brain proteoglycans. We first confirmed that the mouse brain proteoglycans indeed contained both KS and CS (Fig. 8A). We then spotted these proteoglycans with rhodamine B, so that the spots appeared red (Fig. 8B). Whereas neurites of the primary neurons frequently crossed into the spots in the control (rhodamine B alone) (Fig. 8B, top), neurites of neurons in the surrounding area did not enter into the spots of the mouse brain proteoglycans (Fig. 8B, middle). However, if the proteoglycans were treated with keratanase, neurites of neurons in the surrounding area could enter the spots (Fig. 8B, bottom). This phenomenon was more clearly demonstrated if the seeded cell number was decreased (Fig. 8C). Therefore, this in vitro assay using brain proteoglycans mimicked the in vivo failure of axonal regrowth into the lesions of spinal cord injury and the reversal of this failure in KS-deficient mice.
Figure 8.
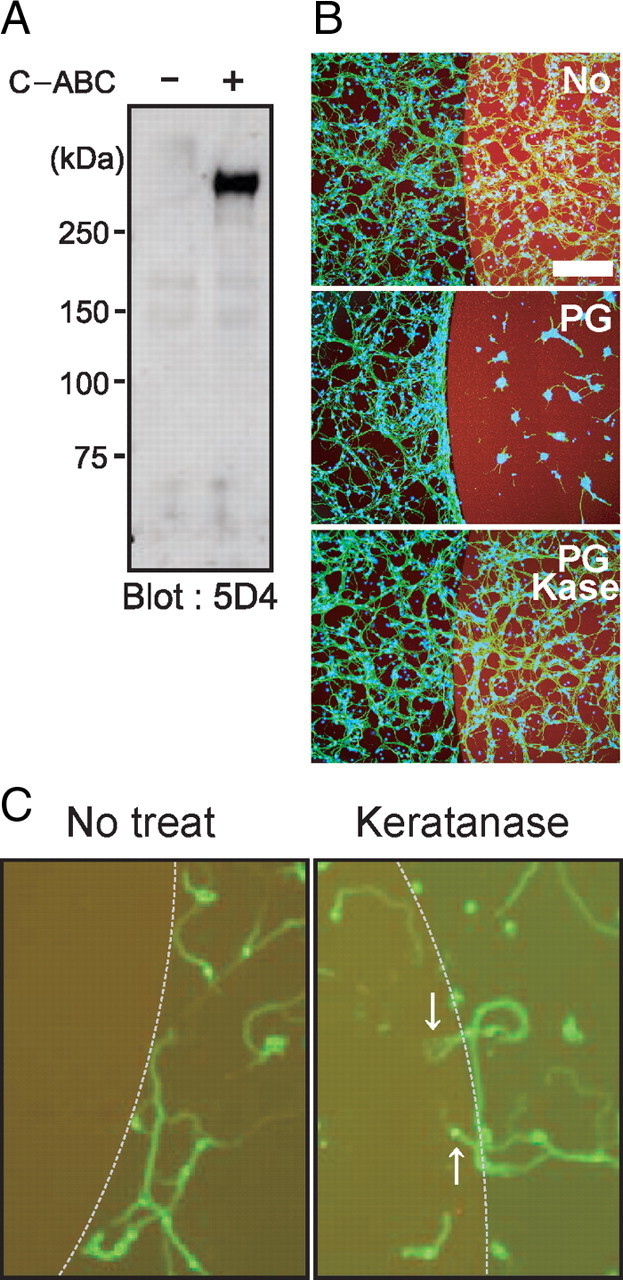
Spot assay. A, Proteoglycans from mouse brain were subjected to Western blot analysis. Note that C-ABC treatment revealed KS epitopes. B, C, Spot assay. Mouse brain proteoglycans at 3 μg/ml were spotted, and primary granular neurons from the rat cerebellum were seeded. Proteoglycans inhibited neurite entry into the spot, whereas keratanase treatment allowed entry. Different cell numbers were used for B and C (1.0 × 10⁶ or 1.0 × 10⁵ per well, respectively). Scale bar, 100 μm.
To examine the possibility that keratanase decreases the efficiency of proteoglycan binding to the substrate, we used the KS/CSPG aggrecan for spotting and visualized spots with the anti-CS antibody CS56. However, we did not observe any difference between spots with and without predigestion with keratanase (supplemental Fig. S3, available at www.jneurosci.org as supplemental material).
Discussion
There have been only a few studies on the relationship between KS and the nervous system. KS expression is induced in the injured CNS after cortical stab wounds in neonatal rats and in the postcomissural fornix after lesioning in adult rats (Geisert and Bidanset, 1993; Stichel et al., 1999). KS expression is also enhanced in reactive microglia and oligodendrocyte progenitors after rat spinal cord injury (Jones and Tuszynski, 2002). After unilateral axotomy of the nigrostriatal tract in adult rats, CSPGs and keratan sulfate proteoglycans (KSPGs) are predominantly found in the lesion surround where reactive astrocytes, activated microglia, and adult precursor cells are abundant (Moon et al., 2002). We previously found enhanced axonal growth in cortical stab wounds in GlcNAc6ST-1−/− mice, but we were not able to investigate the neurological function of these mice at that time (Zhang et al., 2006). In the present study, GlcNAc6ST-1−/− mice exhibited better motor function recovery and enhanced regeneration of the serotonergic descending raphespinal tract axons and CST axons after spinal cord injury, compared with wild-type mice. In support of these data, we also found that the KS-degrading enzyme keratanase reversed the proteoglycan-mediated inhibition of neurite outgrowth in vitro. In light of these results, the present study is the first to demonstrate a possible link between KS and neurological function and indicates that GlcNAc6ST-1−/− mice are a good model for investigating the roles of KS in the CNS.
It is of note that neither CS nor KS was sufficient to inhibit neurite outgrowth in vitro. However, CS or KS degradation blocked the inhibitory activity of proteoglycans both from chick brains and mouse brains. These results suggest that KS is required for the proteoglycan-mediated inhibition of neurite outgrowth. To our surprise, the effect of KS degradation on this inhibition was comparable to that of CS degradation. Thus, it will be interesting to ask whether KS degradation also promotes functional recovery after neuronal injuries as CS degradation does.
Among the numerous methods available to assess the recovery of locomotor functions, the Basso, Beattie, and Bresnahan (BBB) locomotor scale is a popular choice, because it measures functional changes in voluntary hindlimb movements. In this study, we first used the BBB locomotor scale using five mice in each group, and although we found a slight difference in recovery between the GlcNAc6ST-1−/− mice and controls, the difference did not reach the level of statistical significance (p = 0.07; data not shown). Several locomotor parameters recover differently in mice than in other species (e.g., coordination and paw position recover simultaneously, trunk stability improves earlier, and trunk and hindlimb spasms occur later). These differences limit the sensitivity of the BBB for mice and necessitate a ranking of locomotor attributes unique to mice. To overcome this limitation, a BMS scale was developed for mice (Basso et al., 2006); we applied this locomotor scale using seven mice in each group for 8 weeks and detected a significantly better recovery in the GlcNAc6ST-1−/− mice than in the wild-type controls (Fig. 3D). This result was consistent with the footfall, footprint, and motor-evoked potential results. Collectively, the above findings led us to conclude that functional recovery was promoted in GlcNAc6ST-1−/− mice.
The findings of the motor-evoked potential test were consistent with those of the footfall test, footprint test, and BMS scoring. Because the motor-evoked potential test uses only the combination of electric stimulus and response, it can be objectively evaluated. It has recently been shown that motor-evoked potentials have good sensitivity for recording reductions in central conduction latencies (Pluchino et al., 2003; Biffi et al., 2004). In the present study, the responses showed normal configurations, but latency was delayed in the wild-type mice. These electrophysiological data support the idea that the functional recovery of GlcNAc6ST-1−/− mice is remarkably enhanced. However, there may be numerous mechanisms underlying these differences in latency: the conduction differences could be mediated not only by differences in axon regrowth or myelination but also by synaptic reorganization, such as synaptic sprouting, activation of silent synapses, and biochemical synaptic strengthening. Moreover, the type of stimulation used could have activated many descending axon tracts, including not only the CST but also other tracts, such as the rubrospinal, vesitbulospinal, reticulospinal, and propriospinal tracts.
In the present study, we found that most PDGFr-positive cells and a portion of the Iba1-positive cells were KS positive at 7 d after spinal cord injury (Fig. 1). We also found that a portion of the Iba1-positive cells were also KS positive at 3 d, a time point at which most of the Iba1-positive cells were expected to be resident microglia, not macrophages (data not shown). Consistent with this, we have recently reported that primary cultured microglia express KS, and this expression is enhanced by TGF-β, a microglia-activating cytokine usually induced after neuronal injuries (Yin et al., 2009). Considering these results together, it is most likely that, in addition to oligodendrocyte precursor cells (PDGFr positive), activated microglia are a main source of KSPG.
Regarding the reduction of glial scarring in GlcNAc6ST-1−/− mice, whether or not this phenomenon assisted in the functional recovery of these mice is a subject for future debate. Although it is known that glial scars formed in part by reactive astrocytes inhibit axonal sprouting and functional restoration after spinal cord injury (Menet et al., 2003), reactive astrocytes support repair of the blood–brain barrier, prevent inflammatory cell infiltration, and protect neurons and oligodendrocytes (Bush et al., 1999; Faulkner et al., 2004). At least in the subacute phase (within 2 weeks after spinal cord injury), the accumulation of reactive astrocytes helps to repair tissue and restore function (Okada et al., 2006). In this context, our findings are complex. That is, we found that the reactive astrocyte accumulation was significantly lower in GlcNAc6ST-1−/− mice than wild-type mice both at 1 and 4 weeks after injury, whereas the collagen deposition of the GlcNAc6ST-1−/− mice was lower only 4 weeks after injury. It is known that the reactive astrocytes and cells invading into the lesion (i.e., fibroblasts, meningeal cells, and Schwann cells) produce extracellular matrix, including collagen IV (Schwab and Bartholdi, 1996; Fawcett and Asher, 1999; Condic and Lemons, 2002; Buss et al., 2007). However, the influence of collagen IV expression on plasticity and regeneration at the lesion site in vivo has been controversial and remains to be elucidated (Shiga and Oppenheim, 1991; Stichel et al., 1999; Weidner et al., 1999; Buss et al., 2007). Thus, our present study has, at least, demonstrated a close association between diminished KS expression and suppressed reactive astrocyte accumulation and collagen IV deposition, although the underlying mechanisms are still elusive.
KS seems to be the most important factor in accounting for the phenotype of GlcNAc6ST-1−/− mice in this study, but we need to exclude the possibility that sulfation modifications on other sugar structures are mediated by GlcNAc6ST-1 and play a role in neuronal function. Other than KS, the only product of GlcNAc6ST-1 thus far identified is sialyl 6-sulfo LeX, which is a determinant of l-selectin and plays a critical role in lymphocyte recruitment (Uchimura K et al., 2004). GlcNAc sulfation of sialyl 6-sulfo LeX is mediated either by GlcNAc6ST-1 or -2 (Hemmerich et al., 2001; Uchimura et al., 2004). GlcNAc6ST-1−/− mice show reduced lymphocyte homing to lymph nodes, and mice doubly deficient in GlcNAc6ST-1 and -2 show significantly greater reduction of lymphocyte homing (Uchimura et al., 2004, 2005; Kawashima et al., 2005). However, we observed a similar degree of CD11b-positive inflammatory cell infiltration in wild-type and GlcNAc6ST-1−/− mice. Therefore, it is not likely that sialyl 6-sulfo LeX was responsible for the difference in motor function between the wild-type and GlcNAc6ST-1−/− mice in the present study. Furthermore, we obtained evidence that the KS-degrading enzyme keratanase promotes neurite outgrowth, which is inhibited by proteoglycans. Together, our data strongly suggest that the GlcNAc6ST-1 product KS plays a critical role in functional disturbance after spinal cord injury.
Footnotes
This work was supported in part by Ministry of Education, Culture, Sports, Science and Technology (MEXT) Grants-in-Aid 18390099 and 20390092 to K.K.; by funds from the 21st Century Centers of Excellence (COE) Program and Global COE Program of MEXT to Nagoya University; and by the Uehara Foundation. We thank T. Muramatsu (Aichi Gakuin University, Nagoya, Japan) for continuous support of this study.
References
- Akama TO, Nishida K, Nakayama J, Watanabe H, Ozaki K, Nakamura T, Dota A, Kawasaki S, Inoue Y, Maeda N, Yamamoto S, Fujiwara T, Thonar EJ, Shimomura Y, Kinoshita S, Tanigami A, Fukuda MN. Macular corneal dystrophy type I and type II are caused by distinct mutations in a new sulphotransferase gene. Nat Genet. 2000;26:237–241. doi: 10.1038/79987. [DOI] [PubMed] [Google Scholar]
- Basso DM, Fisher LC, Anderson AJ, Jakeman LB, Mctigue DM, Popovich PG. Basso mouse scale for locomotion detects differences in recovery after spinal cord injury in five common mouse strains. J Neurotrauma. 2006;23:635–659. doi: 10.1089/neu.2006.23.635. [DOI] [PubMed] [Google Scholar]
- Biffi A, De Palma M, Quattrini A, Del Carro U, Amadio S, Visigalli I, Sessa M, Fasano S, Brambilla R, Marchesini S, Bordignon C, Naldini L. Correction of metachromatic leukodystrophy in the mouse model by transplantation of genetically modified hematopoietic stem cells. J Clin Invest. 2004;113:1108–1110. doi: 10.1172/JCI19205. [DOI] [PMC free article] [PubMed] [Google Scholar]
- Borisoff JF, Chan CC, Hiebert GW, Oschipok L, Robertson GS, Zamboni R, Steeves JD, Tetzlaff W. Suppression of Rho-kinase activity promotes axonal growth on inhibitory CNS substrates. Mol Cell Neurosci. 2003;2:405–416. doi: 10.1016/s1044-7431(02)00032-5. [DOI] [PubMed] [Google Scholar]
- Bradbury EJ, Moon LD, Popat RJ, King VR, Bennett GS, Patel PN, Fawcett JW, McMahon SB. Chondroitinase ABC promotes functional recovery after spinal cord injury. Nature. 2002;416:636–640. doi: 10.1038/416636a. [DOI] [PubMed] [Google Scholar]
- Bush TG, Puvanachandra N, Horner CH, Polito A, Ostenfeld T, Svendsen CN, Mucke L, Johnson MH, Sofroniew MV. Leukocyte infiltration, neuronal degeneration, and neurite outgrowth after ablation of scar-forming, reactive astrocytes in adult transgenic mice. Neuron. 1999;23:297–308. doi: 10.1016/s0896-6273(00)80781-3. [DOI] [PubMed] [Google Scholar]
- Buss A, Pech K, Kakulas BA, Martin D, Schoenen J, Noth J, Brook GA. Growth-modulating molecules are associated with invading Schwann cells and not astrocytes in human traumatic spinal cord injury. Brain. 2007;130:940–953. doi: 10.1093/brain/awl374. [DOI] [PubMed] [Google Scholar]
- Condic ML, Lemons ML. Extracellular matrix in spinal cord regeneration: getting beyond attraction and inhibition. Neuroreport. 2002;13:37–48. doi: 10.1097/00001756-200203040-00002. [DOI] [PubMed] [Google Scholar]
- De Winter F, Holtmaat AJ, Verhaagen J. Neuropilin and class 3 semaphorins in nervous system regeneration. Adv Exp Med Biol. 2002;515:115–139. doi: 10.1007/978-1-4615-0119-0_10. [DOI] [PubMed] [Google Scholar]
- Faulkner RJ, Julia E. Herrmann, Michael J. Woo, Keith E. Tansey, Ngan B. Doan, Michael V. Sofroniew. Reactive Astrocytes Protect Tissue and Preserve Function after Spinal Cord Injury. J Neurosci. 2004;24:2143–2155. doi: 10.1523/JNEUROSCI.3547-03.2004. [DOI] [PMC free article] [PubMed] [Google Scholar]
- Fawcett JW, Asher RA. The glial scar and central nervous system repair. Brain Res Bull. 1999;49:377–391. doi: 10.1016/s0361-9230(99)00072-6. [DOI] [PubMed] [Google Scholar]
- Filbin MT. Myelin-associated inhibitors of axonal regeneration in the adult mammalian CNS. Nat Rev Neurosci. 2003;4:703–713. doi: 10.1038/nrn1195. [DOI] [PubMed] [Google Scholar]
- Geisert EE, Jr, Bidanset DJ. A central nervous system keratan sulfate proteoglycan: localization to boundaries in the neonatal rat brain. Brain Res Dev Brain Res. 1993;75:163–173. doi: 10.1016/0165-3806(93)90020-b. [DOI] [PubMed] [Google Scholar]
- Grimpe B, Silver J. Novel DNA enzyme reduces glycosaminoglycan chains in the glial scar and allows microtransplanted dorsal root ganglia axons to regenerate beyond lesions in the spinal cord. J Neurosci. 2004;24:1393–1397. doi: 10.1523/JNEUROSCI.4986-03.2004. [DOI] [PMC free article] [PubMed] [Google Scholar]
- Habuchi H, Habuchi O, Uchimura K, Kimata K, Muramatsu T. Determination of substrate specificity of sulfotransferases and glycosyltransferases (proteoglycans) Methods Enzymol. 2006;416:225–243. doi: 10.1016/S0076-6879(06)16014-0. [DOI] [PubMed] [Google Scholar]
- Hemmerich S, Bistrup A, Singer MS, van Zante A, Lee JK, Tsay D, Peters M, Carminati JL, Brennan TJ, Carver-Moore K, Leviten M, Fuentes ME, Ruddle NH, Rosen SD. Sulfation of L-selectin ligands by an HEV-restricted sulfotransferase regulates lymphocyte homing to lymph nodes. Immunity. 2001;15:237–247. doi: 10.1016/s1074-7613(01)00188-1. [DOI] [PubMed] [Google Scholar]
- Jones LL, Tuszynski MH. Spinal cord injury elicits expression of keratan sulfate proteoglycans by macrophages, reactive microglia, and oligodendrocyte progenitors. J Neurosci. 2002;22:4611–4624. doi: 10.1523/JNEUROSCI.22-11-04611.2002. [DOI] [PMC free article] [PubMed] [Google Scholar]
- Kaneko M, Kubo T, Hata K, Yamaguchi A, Yamashita T. Repulsion of cerebellar granule neurons by chondroitin sulfate proteoglycans is mediated by MAPK pathway. Neurosci Lett. 2007;423:62–67. doi: 10.1016/j.neulet.2007.06.038. [DOI] [PubMed] [Google Scholar]
- Kawashima H, Petryniak B, Hiraoka N, Mitoma J, Huckaby V, Nakayama J, Uchimura K, Kadomatsu K, Muramatsu T, Lowe JB, Fukuda M. N-acetylglucosamine-6-O-sulfotransferases 1 and 2 cooperatively control lymphocyte homing through L-selectin ligand biosynthesis in high endothelial venules. Nat Immunol. 2005;6:1096–1104. doi: 10.1038/ni1259. [DOI] [PubMed] [Google Scholar]
- Kim JE, Liu BP, Park JH, Strittmatter SM. Nogo-66 receptor prevents raphespinal and rubrospinal axon regeneration and limits functional recovery from spinal cord injury. Neuron. 2004;44:439–451. doi: 10.1016/j.neuron.2004.10.015. [DOI] [PubMed] [Google Scholar]
- King CE, Canty AJ, Vickers JC. Alterations in neurofilaments associated with reactive brain changes and axonal sprouting following acute physical injury to the rat neocortex. Neuropathol Appl Neurobiol. 2001;27:115–126. doi: 10.1046/j.1365-2990.2001.00317.x. [DOI] [PubMed] [Google Scholar]
- Kitayama K, Hayashida Y, Nishida K, Akama TO. Enzymes responsible for synthesis of corneal keratan sulfate glycosaminoglycans. J Biol Chem. 2007;282:30085–30096. doi: 10.1074/jbc.M703695200. [DOI] [PubMed] [Google Scholar]
- Liesi P, Kauppila T. Induction of type IV collagen and other basement-membrane-associated proteins after spinal cord injury of the adult rat may participate in formation of the glial scar. Exp Neurol. 2002;173:31–45. doi: 10.1006/exnr.2001.7800. [DOI] [PubMed] [Google Scholar]
- Massey JM, Hubscher CH, Wagoner MR, Decker JA, Amps J, Silver J, Onifer SM. Chondroitinase ABC digestion of the perineuronal net promotes functional collateral sprouting in the cuneate nucleus after cervical spinal cord injury. J Neurosci. 2006;26:4406–4414. doi: 10.1523/JNEUROSCI.5467-05.2006. [DOI] [PMC free article] [PubMed] [Google Scholar]
- McGee AW, Strittmatter SM. The Nogo-66 receptor: focusing myelin inhibition of axon regeneration. Trends Neurosci. 2003;26:193–198. doi: 10.1016/S0166-2236(03)00062-6. [DOI] [PubMed] [Google Scholar]
- Menet V, Prieto M., Privat A., Giménez y Ribotta M. Axonal plasticity and functional recovery after spinal cord injury in mice deficient in both glial fibrillary acidic protein and vimentin genes. Proc Natl Acad Sci U S A. 2003;100:8999–9004. doi: 10.1073/pnas.1533187100. [DOI] [PMC free article] [PubMed] [Google Scholar]
- Moon LD, Asher RA, Rhodes KE, Fawcett JW. Regeneration of CNS axons back to their target following treatment of adult rat brain with chondroitinase ABC. Nat Neurosci. 2001;4:465–466. doi: 10.1038/87415. [DOI] [PubMed] [Google Scholar]
- Moon LD, Asher RA, Rhodes KE, Fawcett JW. Relationship between sprouting axons, proteoglycans and glial cells following unilateral nigrostriatal axotomy in the adult rat. Neuroscience. 2002;109:101–117. doi: 10.1016/s0306-4522(01)00457-2. [DOI] [PubMed] [Google Scholar]
- Mueller BK, Mack H, Teusch N. Rho kinase, a promising drug target for neurological disorders. Nat Rev Drug Discov. 2005;4:387–398. doi: 10.1038/nrd1719. [DOI] [PubMed] [Google Scholar]
- Neumann S, Woolf CJ. Regeneration of dorsal column fibers into and beyond the lesion site following adult spinal cord injury. Neuron. 1999;23:83–91. doi: 10.1016/s0896-6273(00)80755-2. [DOI] [PubMed] [Google Scholar]
- Okada S, Nakamura M, Katoh H, Miyao T, Shimazaki T, Ishii K, Yamane J, Yoshimura A, Iwamoto Y, Toyama Y, Okano H. Conditional ablation of Stat3 or Socs3 discloses a dual role for reactive astrocytes after spinal cord injury. Nat Med. 2006;12:829–834. doi: 10.1038/nm1425. [DOI] [PubMed] [Google Scholar]
- Pluchino S, Quattrini A, Brambilla E, Gritti A, Salani G, Dina G, Galli R, Del Carro U, Amadio S, Bergami A, Furlan R, Comi G, Vescovi AL, Martino G. Injection of adult neurospheres induces recovery in a chronic model of multiple sclerosis. Nature. 2003;422:688–694. doi: 10.1038/nature01552. [DOI] [PubMed] [Google Scholar]
- Ruoslahti E. Brain extracellular matrix. Glycobiology. 1996;6:489–492. doi: 10.1093/glycob/6.5.489. [DOI] [PubMed] [Google Scholar]
- Schwab ME. Nogo and axon regeneration. Curr Opin Neurobiol. 2004;14:118–124. doi: 10.1016/j.conb.2004.01.004. [DOI] [PubMed] [Google Scholar]
- Schwab ME, Bartholdi D. Degeneration and regeneration of axons in the lesioned spinal cord. Physiol Rev. 1996;76:319–370. doi: 10.1152/physrev.1996.76.2.319. [DOI] [PubMed] [Google Scholar]
- Shiga T, Oppenheim RW. Immunolocalization studies of putative guidance molecules used by axons and growth cones of intersegemental interneurons in the chick embryo spinal cord. J Comp Neurol. 1991;310:234–252. doi: 10.1002/cne.903100208. [DOI] [PubMed] [Google Scholar]
- Silver J, Miller JH. Regeneration beyond the glial scar. Nat Rev Neurosci. 2004;5:146–156. doi: 10.1038/nrn1326. [DOI] [PubMed] [Google Scholar]
- Stichel CC, Hermanns S, Luhmann HJ, Lausberg F, Niermann H, D'Urso D, Servos G, Hartwig HG, Müller HW. Inhibition of collagen IV deposition promotes regeneration of injured CNS axons. Eur J Neurosci. 1999;11:632–646. doi: 10.1046/j.1460-9568.1999.00466.x. [DOI] [PubMed] [Google Scholar]
- Tetzlaff W, Bisby MA. Neurofilament elongation into regenerating facial nerve axons. Neuroscience. 1989;29:659–666. doi: 10.1016/0306-4522(89)90138-3. [DOI] [PubMed] [Google Scholar]
- Uchimura K, Kadomatsu K, El-Fasakhany FM, Singer MS, Izawa M, Kannagi R, Takeda N, Rosen SD, Muramatsu T. N-acetylglucosamine 6-O-sulfotransferase-1 regulates expression of L-selectin ligands and lymphocyte homing. J Biol Chem. 2004;279:35001–35008. doi: 10.1074/jbc.M404456200. [DOI] [PubMed] [Google Scholar]
- Uchimura K, Gauguet JM, Singer MS, Tsay D, Kannagi R, Muramatsu T, von Andrian UH, Rosen SD. A major class of L-selectin ligands is eliminated in mice deficient in two sulfotransferases expressed in high endothelial venules. Nat Immunol. 2005;6:1105–1113. doi: 10.1038/ni1258. [DOI] [PubMed] [Google Scholar]
- Ughrin YM, Chen ZJ, Levine JM. Multiple regions of the NG2 proteoglycan inhibit neurite growth and induce growth cone collapse. J Neurosci. 2003;23:175–186. doi: 10.1523/JNEUROSCI.23-01-00175.2003. [DOI] [PMC free article] [PubMed] [Google Scholar]
- Weidner N, Grill RJ, Tuszynski MH. Elimination of basal lamina and the collagen “scar” after spinal cord injury fails to augment corticospinal tract regeneration. Exp Neurol. 1999;160:40–50. doi: 10.1006/exnr.1999.7200. [DOI] [PubMed] [Google Scholar]
- Widenfalk J, Lundströmer K, Jubran M, Brene S, Olson L. Neurotrophic factors and receptors in the immature and adult spinal cord after mechanical injury or kainic acid. J Neurosci. 2001;21:3457–3475. doi: 10.1523/JNEUROSCI.21-10-03457.2001. [DOI] [PMC free article] [PubMed] [Google Scholar]
- Yin J, Sakamoto K, Zhang H, Ito Z, Imagama S, Kishida S, Natori T, Sawada M, Matsuyama Y, Kadomatsu K. Transforming growth factor-beta1 upregulates keratan sulfate and chondroitin sulfate biosynthesis in microglia after brain injury. Brain Res. 2009;1263:10–22. doi: 10.1016/j.brainres.2009.01.042. [DOI] [PubMed] [Google Scholar]
- Zhang H, Muramatsu T, Murase A, Yuasa S, Uchimura K, Kadomatsu K. N-Acetylglucosamine 6-O-sulfotransferase-1 is required for brain keratan sulfate biosynthesis and glial scar formation after brain injury. Glycobiology. 2006;16:702–710. doi: 10.1093/glycob/cwj115. [DOI] [PubMed] [Google Scholar]