Abstract
How much neocortical development depends on connections remains elusive. Here, we show that Celsr3|Dlx mutant mice have no extrinsic neocortical connections yet survive to postnatal day 20, acquire a basic behavioral repertoire, and display spontaneous hyperactivity, with abnormal light/dark activity cycling. Except for hallmarks related to thalamic input, such as barrels in somatosensory cortex, cortical arealization and laminar maturation proceeded normally. However, the tangential extension of the mature cortex was diminished, with radial thickness less severely affected. Deep layer neurons were reduced in number, and their apical and basal dendritic arbors were blunted, with reduced synapse density. Interneurons reached the cortex, and their density was comparable with wild type. The excitability of mutant pyramidal neurons, measured in vitro in patch-clamp experiments in acute slices, was decreased. However, their firing activity in vivo was quite similar to the wild type, except for the presence of rapid firing exhaustion in some mutant neurons. Local field potential and electrocorticogram showed similar range of oscillations, albeit with higher frequency peaks and reduced left–right synchrony in the mutant. Thus, “protomap” formation, namely cortical lamination and arealization, proceed normally in absence of extrinsic connections, but survival of projection neurons and acquisition of mature morphological and some electrophysiological features depend on the establishment of normal cortical–subcortical relationships.
Introduction
The neocortex is characterized by two anatomical patterns that are essential to its normal function. It is tangentially partitioned into architectonic and modality specific areas that form a functional map. Furthermore, its radial organization into six layers reflects its intrinsic and extrinsic connectivity. In rodents, both organizations are mature by the end of the third week.
A long-standing debate concerns the role of intrinsic versus extrinsic determinants in shaping the cortex. The embryonic cortex is patterned in response to morphogenetic fields generated by gradients of diffusible factors (Hébert and Fishell, 2008), which regulate a transcription factor code responsible for cortical neuronal determination and differentiation (Grove and Fukuchi-Shimogori, 2003; Shimogori et al., 2004; Mallamaci and Stoykova, 2006; Rash and Grove, 2006; O'Leary et al., 2007; Hébert and Fishell, 2008). Most neocortical neurons are generated in ventricular and subventricular zones (Molyneaux et al., 2007), from which postmitotic excitatory glutamatergic neurons migrate radially (Rakic, 1988). In addition, GABAergic inhibitory interneurons are generated in ganglionic eminences in basal forebrain and migrate to the cortex tangentially (Anderson et al., 1997a; Lavdas et al., 1999; Métin et al., 2006). Early radially migrating neurons form the preplate, a loose horizontal network (Caviness, 1982; Allendoerfer and Shatz, 1994). From embryonic day 13.5 (E13.5), neurons with a radial orientation populate the cortical plate (CP), which expands from inside to outside. Early CP neurons become corticothalamic projection neurons in cortical layer 6. Subcerebral projection neurons settle in layer 5, whereas neurons destined to layers 4, 3, and 2 are principally connected to other cortical neurons. These complex processes result into the formation of the protomap, independently from connections with extracortical structures (Rakic, 1988).
From E14.5 onward, afferents, particularly from dorsal thalamus, reach the cortex and participate in the formation of sensory and motor maps (Price et al., 2006). The fine mapping of the cortex is dependent on interactions with afferent stimuli relayed by thalamocortical fibers (Hooks and Chen, 2007; Inan and Crair, 2007) and efferent cortical projections.
The importance of intrinsic factors in setting the protomap was best demonstrated previously using transcription factor mutant mice (Bishop et al., 2003; O'Leary et al., 2007). However, inactivation of transcription factors is likely to perturb cell fate, and many mutants die perinatally, preventing the study of cortical maturation. Here, we addressed the question by studying Celsr3|Dlx mice, in which Celsr3 is inactivated in basal telencephalic areas, but not in cortex nor in dorsal thalamus. Cortical cell fate is unaffected, yet all three components of the internal capsule—thalamocortical, corticothalamic, and subcerebral (Molyneaux et al., 2007)—are fully defective (Zhou et al., 2008). Quite unexpectedly, Celsr3|Dlx mutants survive up to days 20–21, when cortical laminar and areal development is basically complete, but before the onset of the critical period (Sugiyama et al., 2008), allowing for the first time the investigation of cortical maturation in the absence of extracortical connections, a situation that we propose to name “(neo)cortex isolé in vivo.”
Materials and Methods
Mutant mice.
All animal procedures were approved by animal ethics committees of the Université Catholique de Louvain. Cre-expressing mice Dlx5/6-Cre have been described previously (Stenman et al., 2003). Thy1-YFP transgenic mice (Feng et al., 2000) were obtained from The Jackson Laboratory. Celsr3|Dlx mice are on a mixed background that includes CD1 and 129; a mixed background is necessary to obtain mutant animals that survive beyond the early postnatal period. All data reported are based on analysis of at least three mutant and three control animals.
Open-field locomotor activity.
Postnatal day 17 (P17) mice [mutant, n = 3; wild-type (WT) littermates, n = 3] were individually placed in the open-field apparatus consisting of a rectangular area (10 cm wide × 12 cm long × 60 cm high) under bright illumination (500 lux). Experiments were performed from 1:00 P.M. to 1:00 P.M. on the next day, and the light was off at 6:00 P.M. and on at 6:00 A.M. automatically. The EthoVision system (Noldus) was used for recording and extracting parameters, and the moving distance was measured during observation sessions of 5 min for 23 consecutive hours.
Histology and immunohistochemistry.
For histological examination, 8-μm-thick paraffin sections were stained with cresyl violet to assess neuronal density and cortical architectonics, with Luxol Fast Blue to reveal myelin, and with the Bodian stain to visualize axons, as described previously (Prophet et al., 1992). Thy1-YFP and Dlx5/6-GFP were visualized in 50–100 μm vibratome sections directly under fluorescence microscopy. For immunohistochemistry, 8 μm paraffin sections were incubated with the following primary antibodies: rabbit anti-GFAP (1:1000; Millipore Bioscience Research Reagents), rabbit anti-Cux1 (1:200; Santa Cruz), rabbit anti-Foxp1 (1:500; gift from Edward Morrisey, University of Pennsylvania, Philadelphia, PA), rabbit anti-Tbr1 (1:2500; gift from Robert Hevner, University of Washington, Seattle, WA), mouse anti-5-bromodeoxyuridine (BrdU) (1:35; BD Biosciences), rabbit anti-calbindin (1:500; Swant), rabbit anti-calretinin (1:500; Swant), rabbit anti-parvalbumin (1:500; Swant), rabbit anti-neuropeptide Y (1:300; gift from G. Pelletier, Université Laval, Montreal, QC, Canada), and anti-reelin G10 (1:2000) (de Bergeyck et al., 1998). Primary antibodies were detected with a mouse–rabbit ABC kit (Dako).
In situ hybridization.
The 100-μm-thick sagittal sections were prepared with a vibratome. Floating sections was processed for in situ hybridization with probe incubation at 65°C for 16–20 h. Digoxigenin-labeled RNA probes were prepared and used as described previously (Tissir et al., 2004) at a concentration 1 μg/ml. Plasmid cDNAs were kindly provided by Anastassia Stoykova (Max-Planck-Institute, Göttingen, Germany).
Whole-cell patch-clamp recordings.
Cortical neurons were recorded in 250 μm acute slices from P15 to P21 litter-matched animals. Slice preparation and whole-cell recording were performed as described previously (Gall et al., 2003). The extracellular solution used for slice preparation and perfusion contained the following (in mm): 126 NaCl, 1.6 KCl, 1.2 Na2HPO4·H2O, 1 MgCl2, 2 CaCl2, 18 NaHCO3, 11 glucose. Recordings were made using an EPC-10 amplifier (HEKA) in the fast current-clamp mode. Membrane potential signal was filtered using a cutoff frequency of 2 kHz and subsequently digitized at 10 kHz using the acquisition software Patchmaster (HEKA). Patch pipettes were pulled from borosilicate glass capillaries with a resistance of 5∼9 MΩ. The pipette solution contained the following (in mm): 119 KMeSO4, 1 MgCl2, 0.1 CaCl2, 10 HEPES, 1 EGTA, 12 phosphocreatine, 2 Na2ATP, 0.7 Na2GTP, 0.2% biocytin, pH 7.2∼7.3 with KOH, 280∼300 mOsm/L. Large pyramidal neurons in cortical layer 5 were identified by using infrared differential interference contrast microscopy (Axioskop 2FS; 40×/0.80 W; Zeiss). Data were analyzed with Igor Pro software (Wavemetrics) using the Neuromatic plugin (http://www.neuromatic.thinkrandom.com/). To ensure that the series resistance remains stable during recordings, passive cellular parameters were extracted from voltage-clamp traces by analyzing current relaxation induced by a 10 mV step change from a holding potential of −70 mV (D'Angelo et al., 1995). Intrinsic excitability was investigated by setting resting membrane potential at −80 mV and injecting 1 s steps of depolarizing current (from 50 pA to 1 nA in 50 pA increments). The characteristic parameters of the action potential were estimated using the first sweep above threshold for action potentials generation. The maximal slopes of the action potentials and width were measured using the first four spikes from one sweep, and the amplitude of both the action potentials and the afterhyperpolarization (AHP) were obtained from the second to fourth spikes. Parameters of action potentials are reported as mean ± SEM and were compared using Student's t test.
Morphology of pyramidal cells.
After the whole-cell recording, slices were fixed in 4% paraformaldehyde overnight at 4°C. Staining of biocytin-injected neurons was done with diaminobenzidine (DAB) after incubation with an ABC kit (Dako), or by fluorescence using streptavidin-FITC (1:200; BD Biosciences Pharmingen). Neuronal morphology was studied by doing camera lucida drawings (DAB staining) and by confocal microscopy. Images of the fluorescent cells were acquired using a LSM 510 META laser-scanning confocal system (Zeiss) mounted on an Axiovert 200M inverted microscope (Zeiss) equipped with c-Achroplan NIR 40×/0.8 W objective (Zeiss). The excitation beam of an argon laser (488 nm) and bandpass emission filters (500–550 nm) were used for selective detection of the green fluorochrome. Sequential optical sections of 2048 × 2048 pixels were taken at 0.9 μm intervals along the z-axis to allow three-dimensional reconstruction. Possible distortion caused by the histological processing has been shown to cause <5% error on estimated length (Roth and Häusser, 2001). Basal dendritic branches in WT and mutant were compared using Sholl analysis and nonparametric Kolmogorov–Smirnov test. Spine density was measured under 100× objective (DAB staining) and on FITC-stained neurons using confocal microscopy. Dendritic spine density was evaluated in similar segments defined 100 μm from the distal terminal endings. Spines numbers per unit length were obtained by visually counting the spines on z-projections and dividing by the length of the dendritic segments considered.
Electrophysiological recordings in vivo.
Mice were anesthetized with xylido-dihydrothiazin (Rompun; Bayer; 10 mg/kg) and ketamine (Ketalar; Pfizer; 100 mg/kg). In addition, local anesthesia [0.5 ml of lidocaine and adrenaline (1:80,000; xylocaine; AstraZeneca)] was administered subcutaneously during preparation. Two bolts were cemented to the skull to immobilize the head during recording sessions, and a silver reference electrode was placed on the surface of the occipital cortex. A craniostomy was performed at the level of the parietal cortex before the recording sessions, which were initiated 1 h after anesthesia when mice were alert and had recovered from anesthesia. Single- and multiple-unit recordings were performed with four linearly arranged, quartz-insulated, platinum–tungsten fiber microelectrodes (1.5–5 MΩ) (outer and shaft diameter of 80 and 25 μm, respectively) with 250 μm interelectrode spacing. Electrode penetration were made via DC micromotors (resolution of 0.27 μm) as described previously (Eckhorn and Thomas, 1993), allowing recording of the depth location. For each recorded neuron, optimization of spike amplitude was performed before the onset of recording. After amplification (1000–2000×) and bandpass filtering (10 Hz to 10 kHz), unit activity was stored on 4 mm digital audio tapes (Sony PCM-R5 coupled with Biologic DRA400), transferred to a Pentium III personal computer with analog-to-digital converter boards (Power 1401; Cambridge Electronic Design), and treated on-line and off-line by Spike2 CED software (Cambridge Electronic Design). The recorded data were digitized continuously at 10 kHz. The regularity of the cell was measured by the coefficient of variation (CV), defined as the quotient between the SD and the mean of the interspike intervals. Local field potential (LFP) was analyzed using a 16,384-point fast Fourier transform computed from 4 s recording samples. In three mutants and three WT mice, electrocorticograms (ECOGs) were recorded 30 min and 1 h after similar anesthesia, using exposed tips of 100 μm Teflon-coated silver wires, located 1.5 mm posterior and 3.0 mm lateral to the bregma. To test the spatial coherence of ECOG recordings between the left–right sides, cross-correlation functions between each set of two ECOGs (α1, α2) were calculated. The span of time lags or leads was analyzed for a time window (T) corresponding to a recording period of 4 s. The cross-correlation function between two functions (e.g., α1 and α2) was defined as follows:
 |
where μi and σi are the mean value and the variance of αi, and τ is the lag between the two functions. When the signals α1(t) and α2(t) are statistically correlated, their cross-correlation function displays a peak (a significant cross-correlation function maximum) or a trough (a significant cross-correlation function minimum) at the abscissa τ*. Positive values of τ* denote a time lead of α1(t) relative to α2(t), whereas negative values denote a time lag. Unless stated otherwise, one-way ANOVA followed by Bonferroni's multiple post hoc comparison was used for statistical analysis, with p < 0.05 considered significant. Data are reported as mean ± SD.
Results
Animal model
Conditional, “floxed” Celsr3 mutant mice (Celsr3 f/f) were crossed with double heterozygous (Celsr3+/−; Dlx5/6-Cre/+) mice, to generate Celsr3f/−; Dlx5/6 Cre/+ mutant mice, referred to as Celsr3|Dlx. Dlx5/6-Cre transgenic mice express strongly the Cre recombinase in the basal telencephalon and ventral diencephalon (Stenman et al., 2003). We showed previously that all three components of the internal capsule, namely thalamocortical, corticothalamic, and subcerebral (e.g., corticospinal) projections are completely absent in Celsr3|Dlx mice (Zhou et al., 2008).
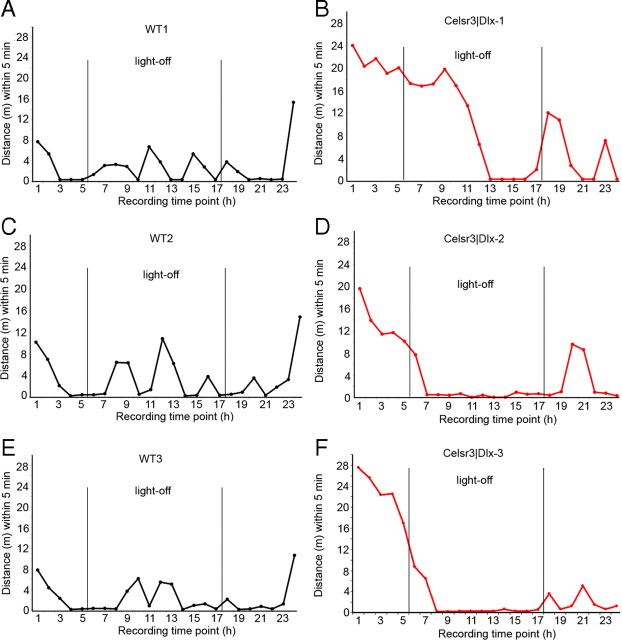
From birth, Celsr3|Dlx mice were smaller than WT littermates, and this became increasingly evident until their death around P20, when their mean body weight was 4.89 ± 0.84 g (n = 12), compared with 11.64 ± 1.30 g (n = 26) for WT littermates. Apart from their small size, other hallmarks of postnatal development, such as eyelid opening, occurred at the normal time. The most evident phenotypic trait was their general weakness, failure to thrive, and ataxia of gait. Intriguingly, although they lacked all extracortical connections, these mice were able to eat, drink, and move. They attempted to escape when handled, would occasionally try to bite, and swam almost like WT mice at the same age (supplemental Movie S1, available at www.jneurosci.org as supplemental material). Although Celsr3|Dlx mice were too weak to undergo behavioral conditional training and testing, we were able to perform a few simple tests and to study their activity during 23 h sessions in the open field. Mutant mice could walk without falling on a suspended bar but performed poorly in visually guided tasks, such as walking on a “trompe l'oeil,” where they failed consistently. As shown in Figure 1, mutants displayed prominent spontaneous hyperactivity in the open field for several hours during lighting, whereas WT went to rest after an initial exploratory activity. In darkness, WT mice became normally active, and mutants remained very active, until they stopped activity abruptly at any time, perhaps because of physical exhaustion. When lighting was restored, WT mice returned to rest, whereas Celsr3|Dlx mutants paradoxically moved erratically, indicating defective light/dark cycling activity.
Figure 1.
Abnormal behavior of Celsr3|Dlx mice in the open field. A–F, Three WT (WT1–WT3) and three Celsr3|Dlx mutants were studied in the open field for 23 h. The hyperactivity of the mutants as well as their aberrant or absent response to the light–dark cycle are evident.
Normal areal and laminar patterning, and neurogenesis in neocortex isolé
At the end of maturation, the mutant hemispheres were reduced in size, with atrophy of the neocortex, striatum, and thalamus (Fig. 2A–D). The surface corresponding to these structures, estimated by comparing mutant and WT in Nissl-stained sections, was reduced by ∼16, 16, and 40%, respectively, for neocortex, striatum, and thalamus (Table 1). The drastic atrophy of striatum and thalamus was partly attributable to the absence of fiber bundles, especially in the striatum, but also to reduced number and/or atrophy of neurons, particularly evident in the thalamus. Because of atrophy of white matter (Fig. 2E,F) and reduced neural cell numbers, the thickness of the cortical wall was decreased. As many mutant neurons in deep layers died (see below), the laminar distribution of cortical cells was less clearly defined in the mutant than in the WT. Whereas cortical size at P0 did not differ drastically in mutant versus WT mice, it did decrease progressively during cortical maturation. In contrast to that of the neocortex, the size of the hippocampal formation and piriform cortex was relatively preserved (Fig. 2C–F). Because archicortical and olfactory projections are almost unaffected in constitutive Celsr3 mutants (Tissir et al., 2005), this observation indicates that cortical atrophy was attributable to disconnection from subcortical targets (Fig. 2A,B). At P20, myelination of large fiber bundles occurred normally in mutants. However, few myelinated fibers traveled in the subcortical white matter, which was very thin (Fig. 2E,F).
Figure 2.
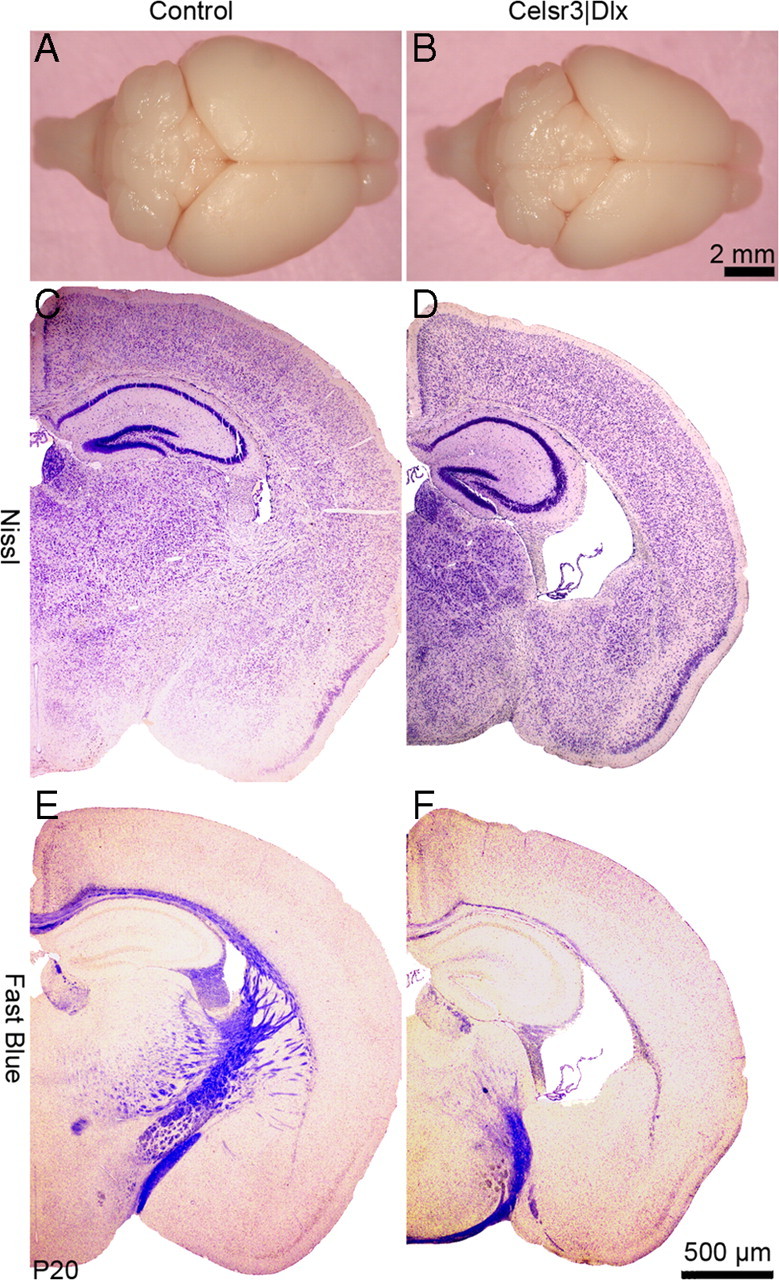
Cortical atrophy in Celsr3|Dlx mice. A, B, Macroscopic view reveals tangential atrophy of mutant hemispheres. C, D, Nissl staining shows that there is severe atrophy of thalamus, striatum, and neocortex in mutants, whereas piriform cortex and hippocampus are relatively less affected. See Tables 1 and 2 for quantification. E, F, Myelination, shown using Fast Blue staining, proceeds normally in the mutant, but there is severe atrophy of myelinated bundles in the subcortical white matter. Scale bar: C–F, 500 μm.
Table 1.
Forebrain dimensions in WT and Celsr3|Dlx mice: area of forebrain regions estimated in coronal sections
| One-half of whole area | Neocortex | Striatum | Thalamus | Pyriform cortex | |
|---|---|---|---|---|---|
| WT (mm2) | 14.37 ± 0.24 | 5.22 ± 0.14 | 1.85 ± 0.17 | 2.18 ± 0.24 | 1.43 ± 0.04 |
| Celsr3|Dlx (mm2) | 13.42 ± 0.08 | 4.40 ± 0.10 | 1.56 ± 0.17 | 1.31 ± 0.21 | 1.42 ± 0.08 |
| Reduction (%) | 6.6 | 15.7 | 15.7 | 39.9 | 0.7 |
| p (t test) | <0.01 | <0.01 | <0.01 | <0.01 | NS |
Neuronal density, estimated by counting neurons in corresponding areas in Nissl-stained coronal sections prepared at comparable levels, was reduced in mutant compared with WT littermates (Fig. 3A,B, Table 2). In addition, more GFAP-positive astrocytes were detected in the mutant than in the WT cortex (Fig. 3C,D). This was more intense in deep cortical layers, where most neuronal degeneration occurred, indicating that GFAP-positive cells and profiles reflected reactive gliosis, a consequence of increased neuronal death in mutant deep layers (Fig. 3G). Additional evidence of neuronal death was provided with the Bodian stain, which showed that the mutant cortex contained less axonal profiles than its WT counterpart (Fig. 3E,F).
Figure 3.
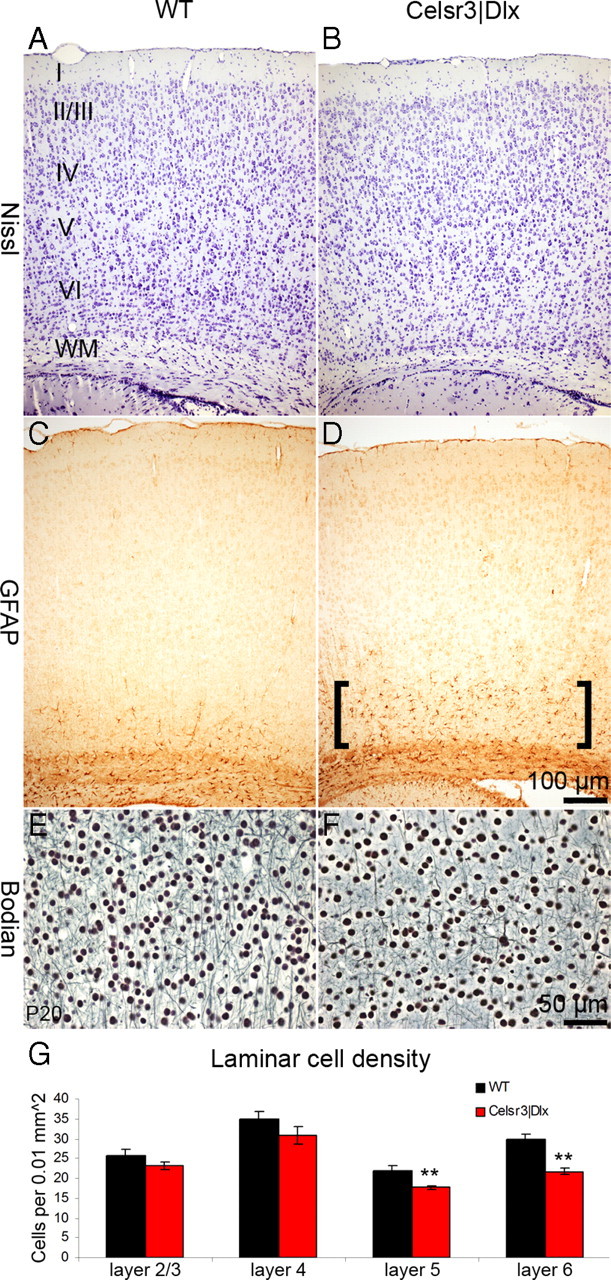
Abnormalities of cortical organization in Celsr3|Dlx mice. A, B, Nissl-stained sections show reduced neuronal density in deep mutant cortex. C, D, GFAP immunohistochemistry shows increased numbers of immunopositive astrocytes in deep cortical layers in the mutant (D, brackets). E, F, Reduction of axonal profiles in deep mutant cortex is demonstrated by the Bodian stain. G, Quantification of neuronal density in cortical layers indicates significant reduction of neuronal cell numbers in mutant layers 5 and 6. **p < 0.01, t test. Error bars indicate SEM. I–VI, Cortical layers I–VI; WM, white matter.
Table 2.
Forebrain dimensions in WT and Celsr3|Dlx mice: estimation of cell numbers by cortical layers
| Layer 2/3 | Layer 4 | Layer 5 | Layer 6 | |
|---|---|---|---|---|
| WT (number per 104 μm2) | 25.60 ± 1.72 | 35.07 ± 1.74 | 21.86 ± 1.20 | 29.79 ± 1.35 |
| Celsr3|Dlx (number per 104 μm2) | 23.18 ± 1.02 | 30.93 ± 2.25 | 17.68 ± 0.46 | 21.65 ± 0.80 |
| Reduction (%) | 9.5 | 11.8 | 19.3 | 27.3 |
| p (t test) | 0.127 | 0.088 | 0.004 | <0.001 |
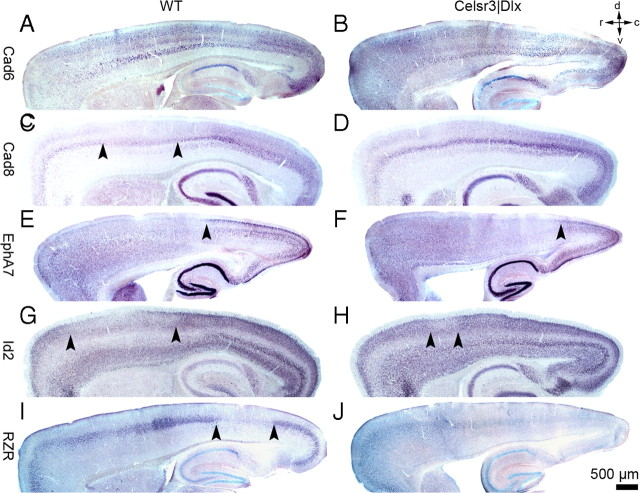
To investigate the formation of tangential, areal cortical organization, we examined expression of established areal markers whose expression is not dependent on establishment of thalamocortical connections, namely Cad6, Cad8, EphA7, Id2, and retinoid Z receptor (RZR) (Suzuki et al., 1997; Inoue et al., 1998; Nakagawa et al., 1999; Stoykova et al., 2000; Mallamaci and Stoykova, 2006; O'Leary et al., 2007; Krishna et al., 2009). Expression patterns were studied at P6, before maturation of thalamocortical connectivity, and at P20. At early postnatal stages, marker expression was comparable in both genotypes (supplemental Fig. S1, available at www.jneurosci.org as supplemental material). In contrast, at the end of maturation at P20, some significant differences were detected. In WT mice, expression of Cad6 was distributed in three layers, with a rostral-to-caudal increasing gradient. Cad8 was mostly expressed in layer 5, also with a moderate increasing rostrocaudal gradient, less sharp than that of Cad6 (Fig. 4A,C). Taking into account the diminutive tangential extension of the mutant cortex, the expression of Cad6 and Cad8 was comparable in Celsr3|Dlx mice (Fig. 4B,D). In the WT, EphA7 expression was restricted to layers 2/3 with a rostrocaudal increasing gradient and a border at the junction between the rostral and caudal tier, as described previously (Bishop et al., 2002). In Celsr3|Dlx mice, EphA7 was less strongly expressed, and the rostral border of strong EphA7 expression appeared shifted caudally (Fig. 4E,F). In the WT, Id2 was expressed in all cortical layers, except at intermediate level, with moderate rostrocaudal increasing gradient (Bishop et al., 2002). The pattern of expression was similar in mutant animals, except that the intermediate region with low expression in outer layers appeared smaller than in WT (Fig. 4G,H). RZR expression was weak and mainly restricted to layer 4 in WT mice. In mutants, it was also restricted to an intermediate cortical zone, and even weaker than in WT mice (Fig. 4I,J). Thus, apart from differences that can be attributed to atrophy of layers 4/5 and restricted tangential spreading of the mutant cortex, markers mapped almost normally in the mutant, indicating that arealization proceeds normally in the absence of connections.
Figure 4.
Protomap formation in mature Celsr3|Dlx mice. In situ hybridization studies using Cad6, Cad8, EphA7, Id2, and RZR probes in WT (A, C, E, G, I) and Celsr3|Dlx mice (B, D, F, H, J). Dorsal, ventral, rostral, and caudal are indicated in top right corner.
To assess the consequences of defective connections on radial, laminar cortical organization, we studied expression of Cux1 (Nieto et al., 2004), Foxp1 (Shu et al., 2001), and Tbr1 (Hevner et al., 2001), three markers with defined laminar distributions, at the level of the barrel field and corresponding area in WT and mutants. At early postnatal stages, all three markers were expressed similarly in mutant and WT animals (supplemental Fig. S2, available at www.jneurosci.org as supplemental material). At P20 (Fig. 5), markers were expressed in WT layer 4, where barrel walls were clearly identified in frontal sections (Fig. 5A–C, brackets). Predictably, no such differentiation was found in the mutant cortex (Fig. 5D–F). The expression of Cux1 was concentrated in upper cortical layers similarly in WT and mutant cortex (Fig. 5A,D). That of Foxp1 (Fig. 5B,E) and Tbr1 (Fig. 5C,D) was distributed to all layers, but low in layer 5. Low expression in layer 5 was less evident in mutant cortex, presumably reflecting atrophy of this layer (Fig. 5E,F, braces).
Figure 5.
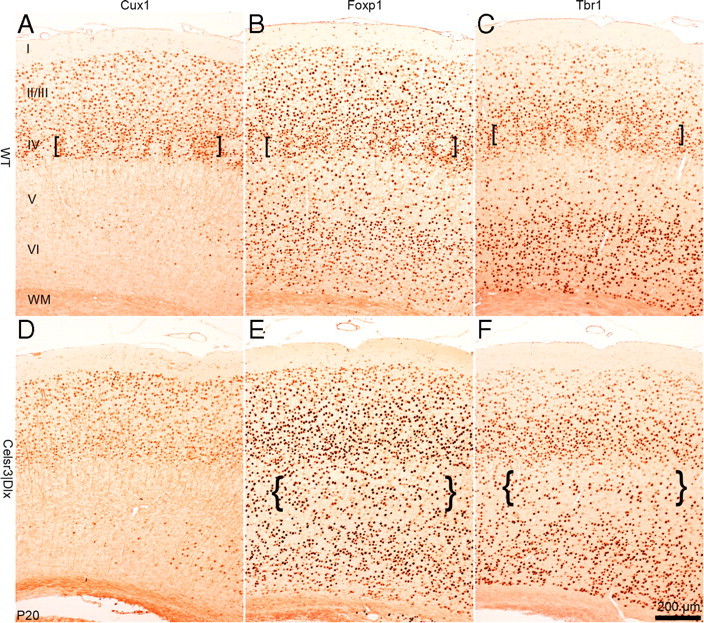
Laminar cortical organization in mature Celsr3|Dlx mice. Immunohistochemistry with Cux1, Foxp1, and Tbr1 antibodies at the level of parietal cortex in WT (A–C) and mutant (D–F) mice at P20. The brackets in A–C point to barrel walls visible in WT but not mutant mice. The braces in F and G point to artificially increased cell density because of atrophic mutant layer 5. I–VI, Cortical layers I–VI; WM, white matter.
Another key feature of cortical development is the inside–outside gradient of cortical plate neurogenesis. To investigate this, we injected BrdU to pregnant mice of both genotypes at E12.5, E13.5, and E14.5, to label cohorts migrating to progressively more superficial levels and performed immunohistochemical detection of BrdU at P8, when migration to the neocortex is almost complete. As shown in Figure 6, neurons generated at E12.5, E13.5, and E14.5 settled in deep, intermediate, and upper cortical layers, respectively, both in WT and mutant cortex. Together, the results obtained with lamina-specific markers and BrdU labeling show that, except for features related to differentiation of layer 4, which was incomplete in the absence of thalamocortical input, the acquisition of laminar identity proceeded normally and neuron generation was not affected in the mutant cortex.
Figure 6.
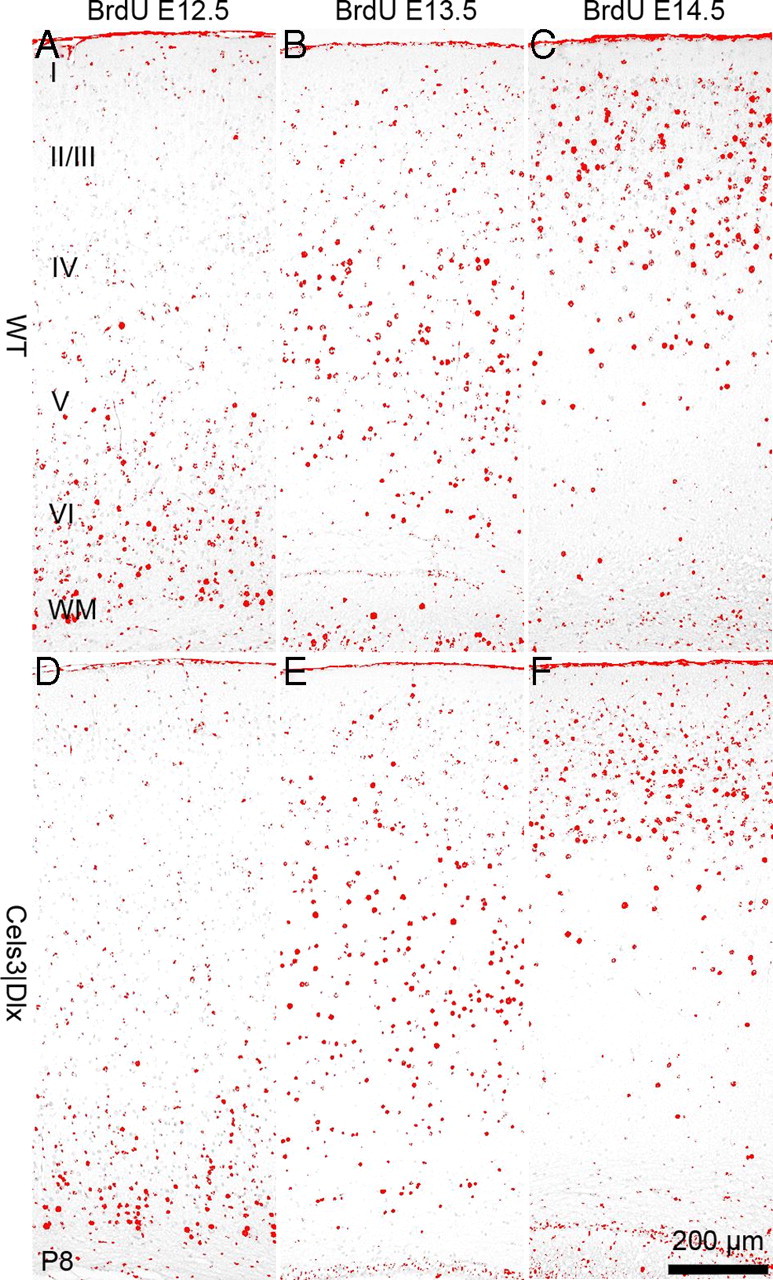
Corticogenesis in normal and Celsr3|Dlx mice. BrdU was administered to pregnant females at E12.5 (A, D), E13.5 (B, E), and E14.5 (C, F), and WT and mutant littermates were processed at P8. The distribution of BrdU-labeled nuclei is comparable in both genotypes. I–VI, Cortical layers I–VI; WM, white matter.
Interneurons from ganglionic eminences migrate to cortex isolé
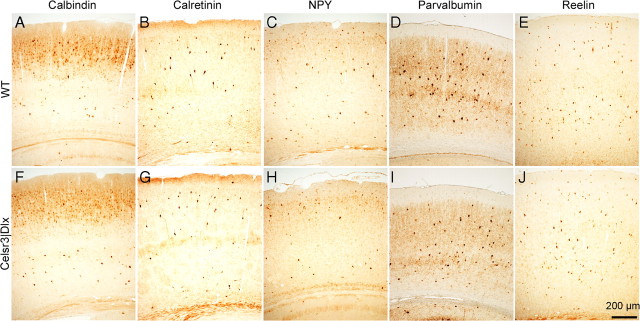
GABAergic inhibitory interneurons, estimated to 20% of cortical neurons, are derived from the medial and caudal ganglionic eminences in the basal telencephalon, and migrate tangentially to the cortex (Anderson et al., 1997b; Fishell, 2007). Tangential migration proceeds independently of radial glia and has been proposed to use developing corticofugal axons as substrate (Denaxa et al., 2001). In constitutive Celsr3 mutant mice, Map2-positive interneurons are able to migrate tangentially to the cortex despite absence of corticofugal axons (Tissir et al., 2005), suggesting that cortical axons are not absolutely required. However, recent work showed that some late-born interneurons fail to migrate efficiently in Celsr3 mutants (Ying et al., 2009). Using the EGFP (enhanced green fluorescent protein) reporter under Dlx5/6 enhancer that labels all derivatives from ganglionic eminences (Stenman et al., 2003), we found that Dlx5/6-positive cells were present in similar density in the cerebral cortex and hippocampus in both WT and mutant mice (supplemental Fig. S3, available at www.jneurosci.org as supplemental material), suggesting that sufficient numbers of interneurons were able to reach neocortex isolé. To examine further whether different classes of interneurons were normally represented in the mutant cortex, we estimated the distribution and density of subsets of GABAergic neurons, using immunohistochemistry with antibodies against calbindin, calretinin, neuropeptide Y (NPY) (Markram et al., 2004; Ascoli et al., 2008), parvalbumin (Sugiyama et al., 2008), and reelin (de Bergeyck et al., 1998). At P20 (Fig. 7), all five classes of interneurons were detected in the mutant cortex at normal densities and with normal radial distribution patterns. Because the whole neocortex was atrophic in those mice, the observation of a normal density indicates that absolute numbers of GABAergic neurons were reduced, either because their tangential migration was compromised (Ying et al., 2009) and/or because their number was adjusted to the number of projection neurons—their principal afferent source as well as target—during cortical maturation.
Figure 7.
Interneuron density and distribution in normal and Celsr3|Dlx mice. Immunohistochemical staining with calbindin (A, F), calretinin (B, G), NPY (C, H), parvalbumin (D, I), and reelin (E, J) in WT (A–E) and mutant (F–J) cortex at P20. The distribution and density of labeled cells are similar in both genotypes.
Projection neurons in neocortex isolé are atrophic
As described above, cortical areal and laminar development, as well as radial and tangential migration of various types of cortical neurons proceeded quite normally during development of the neocortex isolé, yet this neocortex was very atrophic at the end of maturation, presumably because of increased death of neurons that depend on establishment of extracortical connections. We were unable to document apoptosis by using activated caspase 3 immunohistochemistry, presumably because cell death proceeded very progressively, and the presence of physiological apoptosis in the WT cortex (Finlay and Slattery, 1983; Pulvers and Huttner, 2009) hampered accurate estimation of subtle differences. We crossed our mutant mice with Thy1-YFP transgenic mice in which layer 5 neurons express yellow fluorescent protein (YFP) from P10 (Feng et al., 2000). In the WT cortex, YFP-positive neurons were highly restricted in layer 5, but their number was dramatically reduced in the mutant, indicating that most layer 5 projection neurons died in the absence of subcortical projections (Fig. 8A,B).
Figure 8.
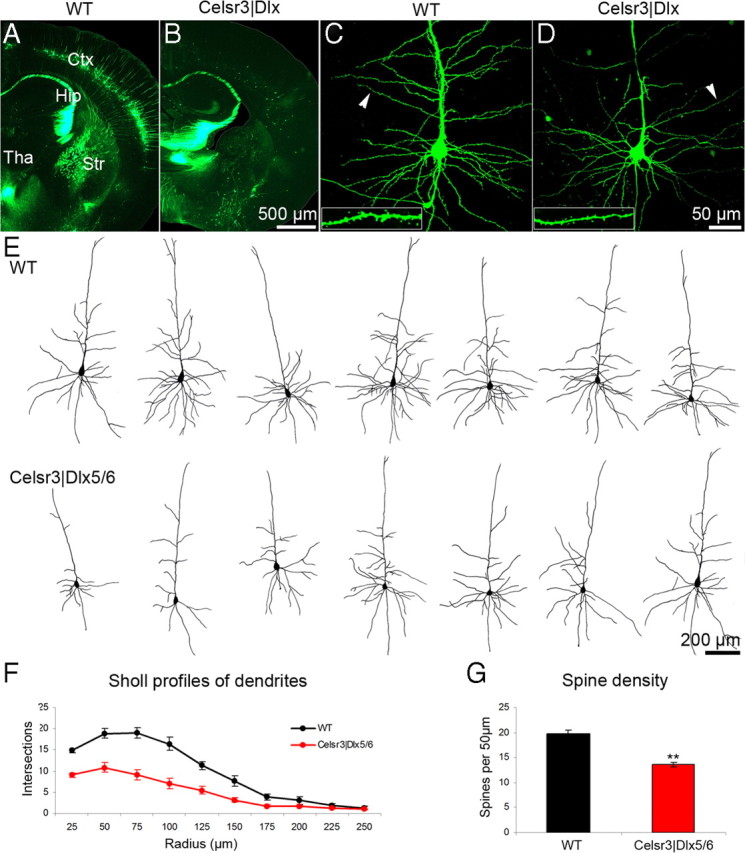
Pyramidal neurons in WT and Celsr3|Dlx mice. A, B, Crosses with Thy1-GFP mice label hippocampal and layer 5 pyramidal cells. Absence of layer 5 in Celsr3|Dlx mice is evident. C, D, Examples of biocytin/fluorescence labeled pyramidal cells in WT and mutant mice. E, Examples of biocytin/DAB-labeled pyramidal cells in both genotypes. F, Sholl analysis demonstrates dendritic atrophy in mutant versus WT pyramidal cells. G, Reduction in spine density in mutant versus WT. **p < 0.01, t test. Error bars indicate SEM. Ctx, Cortex; Hip, hippocampus; Tha, thalamus; Str, striatum.
The morphology of surviving projection neurons was studied using Golgi impregnation. The shape of mutant pyramidal cells was preserved, with a single axonal shaft and profuse basal and apical dendritic branches. However, the number and length of basal dendrites looked significantly reduced. To refine these findings, we stained neurons by injecting biocytin through patch recording pipettes, followed by incubation with streptavidin-conjugated FITC or the avidin–biotinylated peroxidase complex and visualization by confocal microscopy (8 neurons of each genotype) (Fig. 8C,D), or by DAB staining for normal microscopic examination (10 neurons of each genotype) (Fig. 8E). A Sholl analysis of dendritic arbors (Sholl, 1953) further demonstrated their atrophy in the neocortex isolé, confirming the impression obtained from Golgi impregnation (Fig. 8F).
To assess the development of spines on pyramidal dendrites, we estimated spine density in the eight WT and eight mutant neurons reconstructed using confocal microscopy. Spines were counted in five segments selected at comparable levels in basal dendrites of each neuron (Fig. 8C,D, insets), and spine density was expressed per 50 μm as described in Materials and Methods. In the mutant, spine density was significantly reduced compared with that in the control (Fig. 8G), indicating abnormal local microcircuit development in the neocortex isolé.
Pyramidal neurons of neocortex isolé have reduced electrical excitability in vitro
To compare electrophysiological properties of projection neurons, the intrinsic excitability of large pyramidal neurons in acute brain slices was characterized using the whole-cell configuration of the patch-clamp technique. As shown in Table 3, passive physiological parameters such as resting membrane potential, input resistance (Rin), and membrane capacitance were similar in WT and mutant neurons. The normal membrane capacitance in mutant neurons was somewhat unexpected, given the atrophy of dendritic arborizations described above. However, although the estimation of membrane capacitance through somatic recording is very reliable for cells that have a compact electrotonic structure, it is more delicate in large cells with extended processes such as pyramidal neurons. Thus, presumably, morphological alterations of dendritic trees have little influence on this parameter, which is mainly dependent on the size of the soma that was not significantly affected in the mutant.
Table 3.
Excitability of pyramidal neurons in slices
| Parameters | WT (n = 20) | Celsr3 Dlx (n = 19) |
|---|---|---|
| Vresting (mV) | −71.2 ± 1.6 | −70.3 ± 0.8 |
| Rin (MΩ) | 363.4 ± 35.3 | 399.8 ± 37.1 |
| Cm (pF) | 105.5 ± 7.3 | 100.6 ± 7.3 |
| Threshold current (pA) | 90.9 ± 9.1 | 117.9 ± 10.0* |
| Threshold voltage (mV) | −40.7 ± 1.6 | −32.0 ± 1.4** |
| Latency of 1st AP (s) | 0.08 ± 0.02 | 0.09 ± 0.02 |
| AHP (mV) | −54.3 ± 1.9 | −43.2 ± 1.5** |
| Half-width (ms) | 1.58 ± 0.17 | 2.47 ± 0.23** |
| Maximal slope of rise (mV/ms) | 261.3 ± 19.8 | 158.9 ± 11.4** |
| Maximal slope of fall (mV/ms) | −39.6 ± 3.7 | −21.9 ± 2.3** |
| AP amplitude (mV) | 85.9 ± 2.8 | 68.2 ± 2.2** |
AP, Action potential.
*p < 0.05,
**p < 0.01, t test.
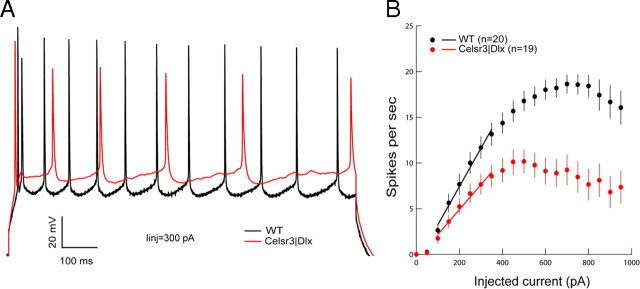
Intrinsic electrophysiological characteristics were investigated using current-clamp recordings with 50 pA stepwise increase of injected current (Tables 1, 2; Fig. 9A,B). The current needed to trigger the first action potential, and the voltage threshold for action potential generation, were respectively increased by 32 and 25% in mutant versus WT neurons (p < 0.01), whereas the amplitude of action potentials and of AHP were significantly decreased (p < 0.01). The width of the action potential at half-height, and the slope of rise and fall were increased in mutant neurons (p < 0.01). Adaptation of amplitude and frequency of the spikes occurred in recordings from both genotypes when high current injection was applied. Therefore, we used the spike number per sweep (1 s) instead of spike frequency to analyze the electrical responsiveness. In WT cells, the spike number increased after gradual increment of injected current, to reach its maximum at an applied current of 750 pA. However, the maximal discharge rate was obtained at 400 pA current in mutant cells, and that rate (9.2 ± 1.3) was much lower than that in WT (14.4 ± 1.1; p < 0.01). The linear slope factor of the initial part in the current-spike number plots is considered a reliable and sensitive parameter of neuronal excitability. This slope factor was significantly reduced in mutant cells (1.32 ± 0.20 Hz · pA−1; p < 0.01) (Fig. 9B) compared with WT (1.92 ± 0.14 Hz · pA−1) (Fig. 9B). These results demonstrate that the membrane of mutant pyramidal neurons was less excitable than that of WT cells.
Figure 9.
Electrophysiological properties of pyramidal cells in WT and Celsr3|Dlx mice. A, Comparison of action potentials generated at a same level of injected current in both genotypes. B, Summary plot of discharge frequency as a function of stepwise injected current showing in the mutant cells, the decreased maximum frequency level, and the difference in the slope of the linear part of the current–frequency plot used as a measure of the intrinsic pyramidal cell excitability.
In vivo electrophysiology of cortical neurons and electrocorticogram
The firing behavior of WT and mutant cortical neurons was also studied in awake mice at the level of the parietal cortex, where we recorded the spontaneous activity of isolated neurons, the related LFP and the ECOG. Based on recordings of 70 mutant and 45 WT neurons, different firing behaviors, from regular-spiking to bursting, were identified in equal proportion in both genotypes (Fig. 10A,B). The distribution, mean value, and CV of spontaneous firing rates were similar in both groups (Table 4). Spike shapes, which were mainly triphasic, were also similar in both genotypes. In contrast, spike duration was significantly shorter in mutant versus WT neurons. In 21 mutant neurons, a specific decrement of the spike amplitude occurred (Fig. 10C–E): the spontaneous firing vanished rapidly (mean of 1.57 ± 1.43 s, ranged from 0.22 to 4.5 s) following in each case a linear regression with time (mean correlation coefficient of 0.89 ± 0.07) (Fig. 10F). This abnormal behavior was never observed in WT neurons. The LFP profile recorded in the mutant correspond to the classical rhythmic activity present in the awake state showing a dominant frequency peak in the beta–gamma range and two side peaks in the alpha and the higher gamma bands. However, for each of these oscillatory components, the mutant showed higher frequency values (12.4 ± 2.4 Hz for alpha, 21.2 ± 3.5 Hz for beta–gamma, and 32.9 ± 3.8 Hz for higher gamma in the mutant vs 9.5 ± 3.1 Hz for alpha, 16.3 ± 2.9 Hz for beta–gamma, and 28.3 ± 4.3 Hz for higher gamma peak in the WT; p < 10−4).
Figure 10.
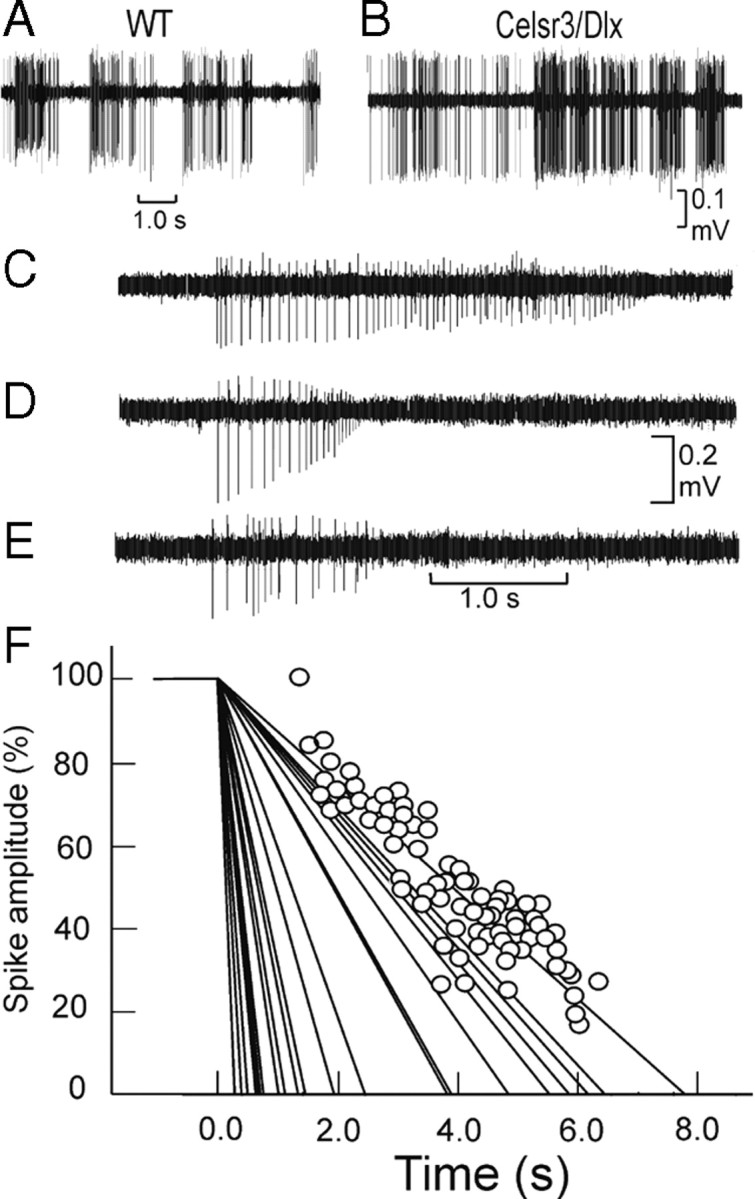
Firing properties of pyramidal cells. A, B, Example of spontaneous discharges in WT (A) and Celsr3|Dlx (B) mice. C–E, Firing rate exhaustion in Celsr3|Dlx mice pyramidal neurons in vivo. C–E, Illustration of this phenomenon in three different Celsr3|Dlx neurons. F, Linear regression analysis of each spike amplitude in function of time for the 21 neurons with firing rate exhaustion. The individual values are illustrated for one of these regression lines. For a convenient illustration, for each neuron, the maximal amplitude calculated by the regression lines has been adjusted at time 0.
Table 4.
Firing properties of pyramidal neurons in vivo
| Parameters | WT (n = 45) | Celsr3 Dlx (n = 59) |
|---|---|---|
| Spontaneous firing rate (Hz) | 9.0 ± 9.1 | 8.8 ± 9.5 |
| CV of the firing rate | 0.96 ± 0.52 | 1.07 ± 0.70 |
| Total spike duration (ms) | 10.38 ± 2.46 | 8.75 ± 1.89*** |
| Duration of depolarization (ms) | 1.23 ± 0.33 | 0.96 ± 0.32*** |
| Time to depolarization peak (ms) | 0.74 ± 0.33 | 0.50 ± 0.28*** |
| Spike depolarization amplitude (mV) | 0.27 ± 0.14 | 0.21 ± 0.12 |
| Mid amplitude duration (ms) | 0.39 ± 0.07 | 0.38 ± 0.09 |
| Slope of rise (mV/ms) | 0.49 ± 0.46 | 0.58 ± 0.76 |
| Slope of fall (mV/ms) | 0.55 ± 0.33 | 0.60 ± 0.64 |
| Duration to the AHP peak (ms) | 2.64 ± 1.28 | 2.05 ± 1.05** |
**p < 0.01,
***p < 0.001, t test.
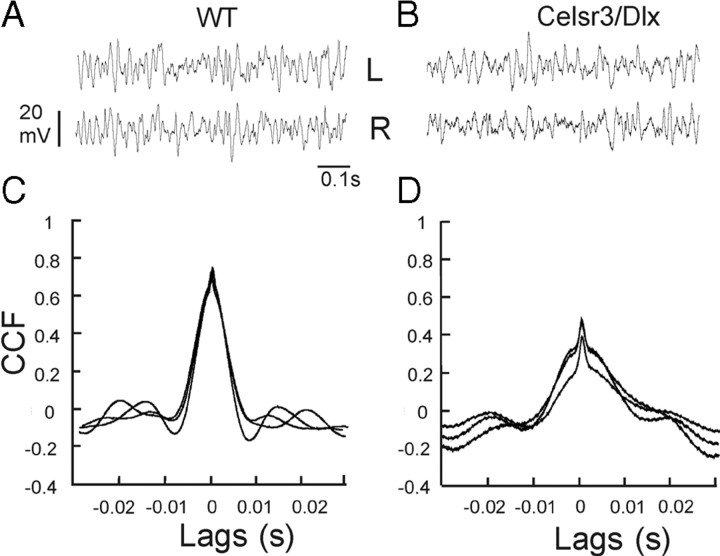
ECOG recordings in three WT and three mutant mice, performed in freely moving animals, corroborated the LFP data recorded in head-restrained animals and confirmed that cortical oscillations were present in mutant as in WT cortex (Fig. 11A,B). Although the frequency peaks of the ECOG were the same 1 h after the anesthesia [27.1 ± 5.5 Hz in WT (n = 30) vs 25.6 ± 7.2 Hz (n = 74) in the mutant], they were higher 30 min after the anesthesia in the mutant [25.0 ± 2.6 Hz in WT (n = 48) vs 32.7 ± 1.6 Hz (n = 24) in mutants; p < 10−4]. ECOG oscillations in the left and right hemispheres were more synchronous in WT (Fig. 11C) than in the mutant (Fig. 11D) (mean cross-correlation coefficient of 0.40 ± 0.12, 30 min after anesthesia and 0.7 ± 0.10 1 h after in WT vs 0.11 ± 0.02 and 0.47 ± 0.10, respectively, in the mutant; p < 10−4).
Figure 11.
ECOG in awake WT and Celsr3|Dlx mice. A, B, ECOG recorded in the left (L) and right (R) parietal cortex in WT (A) and Celsr3|Dlx mice (B). C, D, Cross-correlation analysis of the ECOG in WT (C) and in Celsr3|Dlx mice (D). CCF, Cross-correlation function.
Discussion
Here, we studied Celsr3|Dlx mice, in which the neocortex is isolated because of the absence of corticothalamic, thalamocortical, and corticosubcortical connections (Zhou et al., 2008). These mutant mice can survive for 3 weeks, until cortical maturation is basically complete, allowing for the first time the study of cortical maturation in the absence of extracortical influence. They cannot survive beyond P21, however, and die before the critical period (Hensch, 2005). Apart from their weakness and small size, these mice display a basic behavioral repertoire. The cortical protomap (Rakic, 1988; O'Leary et al., 2007; Hébert and Fishell, 2008) forms initially normally, both in terms of areal partitioning and laminar organization. At the end of maturation, hallmarks of thalamic afferents such as barrels and layer 4 are absent, and the isolated cortex is atrophic, with death of many projection neurons and profuse reduction of dendritic arbors in surviving cortical neurons. Various classes of interneurons originating from ganglionic eminences are present in normal density in the isolated cortex, indicating that their migration does not depend on guiding axons, and that absolute numbers may be reduced in proportion to decreased populations of glutamatergic target cells. Patch-clamp studies in slices showed that mutant neurons displayed all electrophysiological features of normal neurons but were globally hypoexcitable. In in vivo recordings, discharges vanished rapidly in 25% of recorded mutant neurons, reflecting hypoexcitability measured in slices. Finally, in mutant mice, the ECOG displayed oscillations peaking in the beta range as in the WT but with higher frequency peak, and the left–right synchrony of these oscillations was reduced in mutants.
Behavior without functional neocortex
Given the anatomical and functional importance of the cortex in mammals, the observation that mice were able to survive, eat, drink, walk, swim, and to display a normal basic behavioral repertoire in the absence of any functional neocortex, was rather unexpected. Celsr3|Dlx mutant mice performed abnormally in the open-field test, in which they displayed aberrant hyperlocomotion and failed to react to light/dark transitions like WT controls, indicating defective visual perception and/or circadian rhythm generation. Unfortunately, their poor general health precluded studies involving conditioning. Although the role of thalamic input in shaping cortical areas such as the barrel field or visual cortex and in controlling their function is well established, the participation of thalamocortical and cortical efferent pathways in behavioral traits such as visual behavior or whisker-related orientation is less clear. It is known that rodents rely heavily on subcortical systems such as retinotectal for vision (Schneider, 1969), and on extrapyramidal systems for movement control. Our data confirm that the role of the cortex in rodents is clearly less essential than what is often assumed. They support the view that the rodent brain is not similar to that of protomammals and, unlike what happened in the primate lineage, evolved toward a simplification of cortex and increased relative importance of extracortical centers (Tissir and Goffinet, 2007). Our mutant mouse model may prove useful to studies aimed at defining the respective roles of cortical and subcortical mechanisms in brain and behavioral plasticity, for example after cortical lesions.
Key phenotypic features in Celsr3|Dlx mice included retarded growth and abnormal movements that lead to death around P20. A similar phenotype was observed in Celsr3|Foxg1 mice, in which Celsr3 is inactivated in all forebrain except dorsal thalamus, confirming that these anomalies are related to defects in forebrain wiring. Although the abnormal gait is evocative of cerebellar dysfunction, the cerebellar system is not a target of Dlx5/6-Cre or Foxg1-Cre, and no evident morphological abnormalities were found in the cerebellum or precerebellar nuclei in Celsr3|Dlx or Celsr3|Foxg1 mice. However, wiring of basal ganglia should be widely affected in Celsr3|Dlx mice. Similarly, retarded growth might be related to defective circuit wiring in the hypothalamus and nearby areas related to feeding and growth regulation. Whether abnormal connectivity in basal ganglia and hypothalamic areas account for the phenotypic abnormalities remains to be studied further.
Interneuron density and distribution in cortex isolé
The cortex isolé is very atrophic at the end of maturation, mainly because of death of large projection neurons. In contrast, the global density of interneurons, estimated by numbers of cortical cells that express the Dlx5/6 transgene, and density/distribution of five subclasses of interneurons, are similar at P20 in mutant and WT cortex. Among GABAergic interneurons, parvalbumin-positive ones develop late and are implicated in the critical period at P23–P30 (Sugiyama et al., 2008). The death of mutant animals before P21 precluded studies of parvalbumin neurons and the critical period in our model. That sufficient numbers of interneurons are able to reach the cortical ribbon in the absence of corticofugal connections, is in line with initial studies of Celsr3 mutant mice (Tissir et al., 2005) and in agreement with the hypoexcitability of mutant pyramidal neurons observed in slices and normal excitability in vivo. At first sight, this may seem to contradict a recent work, in which decreased migration of late born interneurons was shown in constitutive Celsr3 mutant mice (Ying et al., 2009). However, the latter study shows that the defective tangential migration of mutant interneurons is partial. The observation of normal density of interneurons in the atrophic cortex isolé clearly indicates that their absolute number, which is very hard to estimate, is reduced in proportion to cortical volume. Defects in tangential migration may explain this overall reduction in global interneuron numbers. However, it is also possible that interneuron numbers at the end of maturation are adjusted to the population of projection neurons that provide their main input and output. Mechanisms that regulate the dispersion and distribution of interneurons at the end of migration begin to be unraveled (Bortone and Polleux, 2009). However, as far as we know, those that adjust the relative numbers of GABAergic and glutamatergic cortical cells during cortical maturation remain elusive. Our observations suggest that such regulatory mechanisms do indeed play an important role, and the Celsr3|Dlx mutant mouse provides a useful tool to probe that question further.
Electrical properties of cortex isolé
The hypoexcitability of pyramidal neurons recorded in slices was less evident in in vivo recordings. Indeed, decreased excitability observed in slices was only reflected in awake state by a shortened spike duration in mutant neurons, with rapid exhaustion of discharges in a minority of them. Shorter spike duration is unlikely to result from changes in spike amplitude, because the slope of rise, greatly decreased in vitro, was not altered in vivo. Perhaps intracortical connections (network effect throughout reverberant and inhibitory loops) or uncontrolled local factors such as neurohormonal or trophic actions may compensate in vivo the intrinsic weakness of the neuronal machinery displayed in vitro.
Electrocorticographic oscillations are generally thought to be driven by reciprocal thalamocortical connections and require synchronization among apical dendrites of cortical neurons. The presence of cortical oscillations in absence of thalamocortical connections indicates that cortical organization is sufficient to drive intrinsic cycles of electrical activity, perhaps between superficial and deeper cortical layers. LFP and ECOG oscillations in cortex isolé occur in comparable albeit faster frequency ranges than in WT, suggesting that thalamocortical connectivity exert some modulation on the frequency of oscillations.
The decrease of ECOG synchrony between the left and right mutant hemispheres could be explained by the absence of corticothalamic and thalamocortical connections. The intracortical synchronization of spontaneous gamma oscillations is accompanied by synchronized activity in corticothalamic system (Steriade et al., 1998). In WT, the corticothalamic feedback produces coherent activity by recruiting thalamic circuitry via reticular neurons (Contreras et al., 1996). A more recent study (Vicente et al., 2008) showed that long-range cortical synchrony associated with cortico–thalamo–cortical loops is compatible with synchronization across large distances with zero phase lag, as presently observed in WT mice. The preservation of zero phase synchrony in the mutant indicates that the common mechanisms of zero phase synchronization proposed for the gamma oscillation (Traub et al., 1996; Bazhenov et al., 2008) is conserved in cortex isolé. Callosal commissure may play an important role in facilitating interhemispheric coherence, as demonstrated in lesion studies (Engel et al., 1991). The presence of faster rhythms in awake mutant mice, associated to hypoexcitability of pyramidal neurons in slices may appear paradoxical. Indeed, the absence of the two parallel activating pathways (the brainstem–thalamo–cortical and the brainstem–nucleus basilis–cortical) associated to intrinsic weakness would rather be predicted to slow down rather than accelerate the oscillations of cortical network. The shift of the LFP frequency peaks toward higher values in the mutant might be related to the absence of influence of the ∼10 Hz oscillation supported by the thalamocortical reverberant system (Contreras et al., 1996; Steriade et al., 1998).
In sum, the cortical protomap forms normally in Celsr3|Dlx mice despite defective cortical–subcortical connections. However, many projection neurons die during maturation and the mature cortex is severely atrophic. Surviving neurons display manifest hypoexcitability in vitro, but their activity in vivo is surprisingly conserved. Celsr3|Dlx mutant mice provide a model to assess the role of subcortical structures in brain function and to probe brain plasticity after defective cortical control.
Footnotes
This work was supported by grants from the Région Wallonne, from Actions de Recherches Concertées [ARC-186 (A.M.G.) and ARC 2008-2013 (S.N.S.)], Fonds de la Recherche Fondamentale Collective d'Initiative des Chercheurs 2.4504.01, Fonds de la Recherche Scientifique Médicale (FRSM) 3.4501.07, FRSM 3.4529.03, FRSM 3.4509.06, Interuniversity Poles of Attraction (Services Fédéraux des Affaires Scientifiques, Techniques et Culturelles; PAI p6/20), Fondation Médicale Reine Elisabeth, the Belgian Federal Science Policy Office, and the European Space Agency (AO-2004, 118) (G.C.), and Program for New Century Excellent Talents in University (NCET-09-0109; People's Republic of China) (L.Z.). We thank Kenneth Campbell for gift of Dlx5/6-Cre mice; Robert Hevner for Tbr1 antibody; Ed Morrisey for Foxp1 antibody; Georges Pelletier for anti-NPY; Anastassia Stoykova for providing probes for in situ hybridization; Valérie Bonte, Isabelle Lambermont, and Esther Paitre for technical assistance; Stéphanie Monlezun for help with the open field experiments; David Orduz for advice and help with patch clamp; and the Service d'Anatomie Pathologique (Cliniques Universitaires St. Luc) for help with histological processing.
References
- Allendoerfer KL, Shatz CJ. The subplate, a transient neocortical structure: its role in the development of connections between thalamus and cortex. Annu Rev Neurosci. 1994;17:185–218. doi: 10.1146/annurev.ne.17.030194.001153. [DOI] [PubMed] [Google Scholar]
- Anderson SA, Qiu M, Bulfone A, Eisenstat DD, Meneses J, Pedersen R, Rubenstein JL. Mutations of the homeobox genes Dlx-1 and Dlx-2 disrupt the striatal subventricular zone and differentiation of late born striatal neurons. Neuron. 1997a;19:27–37. doi: 10.1016/s0896-6273(00)80345-1. [DOI] [PubMed] [Google Scholar]
- Anderson SA, Eisenstat DD, Shi L, Rubenstein JL. Interneuron migration from basal forebrain to neocortex: dependence on Dlx genes. Science. 1997b;278:474–476. doi: 10.1126/science.278.5337.474. [DOI] [PubMed] [Google Scholar]
- Ascoli GA, Alonso-Nanclares L, Anderson SA, Barrionuevo G, Benavides-Piccione R, Burkhalter A, Buzsáki G, Cauli B, Defelipe J, Fairén A, Feldmeyer D, Fishell G, Fregnac Y, Freund TF, Gardner D, Gardner EP, Goldberg JH, Helmstaedter M, Hestrin S, Karube F, et al. Petilla terminology: nomenclature of features of GABAergic interneurons of the cerebral cortex. Nat Rev Neurosci. 2008;9:557–568. doi: 10.1038/nrn2402. [DOI] [PMC free article] [PubMed] [Google Scholar]
- Bazhenov M, Rulkov NF, Timofeev I. Effect of synaptic connectivity on long-range synchronization of fast cortical oscillations. J Neurophysiol. 2008;100:1562–1575. doi: 10.1152/jn.90613.2008. [DOI] [PMC free article] [PubMed] [Google Scholar]
- Bishop KM, Rubenstein JL, O'Leary DD. Distinct actions of Emx1, Emx2, and Pax6 in regulating the specification of areas in the developing neocortex. J Neurosci. 2002;22:7627–7638. doi: 10.1523/JNEUROSCI.22-17-07627.2002. [DOI] [PMC free article] [PubMed] [Google Scholar]
- Bishop KM, Garel S, Nakagawa Y, Rubenstein JL, O'Leary DD. Emx1 and Emx2 cooperate to regulate cortical size, lamination, neuronal differentiation, development of cortical efferents, and thalamocortical pathfinding. J Comp Neurol. 2003;457:345–360. doi: 10.1002/cne.10549. [DOI] [PubMed] [Google Scholar]
- Bortone D, Polleux F. KCC2 expression promotes the termination of cortical interneuron migration in a voltage-sensitive calcium-dependent manner. Neuron. 2009;62:53–71. doi: 10.1016/j.neuron.2009.01.034. [DOI] [PMC free article] [PubMed] [Google Scholar]
- Caviness VS., Jr Neocortical histogenesis in normal and reeler mice: a developmental study based upon [3H]thymidine autoradiography. Brain Res. 1982;256:293–302. doi: 10.1016/0165-3806(82)90141-9. [DOI] [PubMed] [Google Scholar]
- Contreras D, Destexhe A, Sejnowski TJ, Steriade M. Control of spatiotemporal coherence of a thalamic oscillation by corticothalamic feedback. Science. 1996;274:771–774. doi: 10.1126/science.274.5288.771. [DOI] [PubMed] [Google Scholar]
- D'Angelo E, De Filippi G, Rossi P, Taglietti V. Synaptic excitation of individual rat cerebellar granule cells in situ: evidence for the role of NMDA receptors. J Physiol. 1995;484:397–413. doi: 10.1113/jphysiol.1995.sp020673. [DOI] [PMC free article] [PubMed] [Google Scholar]
- de Bergeyck V, Naerhuyzen B, Goffinet AM, Lambert de Rouvroit C. A panel of monoclonal antibodies against reelin, the extracellular matrix protein defective in reeler mutant mice. J Neurosci Methods. 1998;82:17–24. doi: 10.1016/s0165-0270(98)00024-7. [DOI] [PubMed] [Google Scholar]
- Denaxa M, Chan CH, Schachner M, Parnavelas JG, Karagogeos D. The adhesion molecule TAG-1 mediates the migration of cortical interneurons from the ganglionic eminence along the corticofugal fiber system. Development. 2001;128:4635–4644. doi: 10.1242/dev.128.22.4635. [DOI] [PubMed] [Google Scholar]
- Eckhorn R, Thomas U. A new method for the insertion of multiple microprobes into neural and muscular tissue, including fiber electrodes, fine wires, needles and microsensors. J Neurosci Methods. 1993;49:175–179. doi: 10.1016/0165-0270(93)90121-7. [DOI] [PubMed] [Google Scholar]
- Engel A, Konig P, Kreiter A, Singer W. Interhemispheric synchronization of oscillatory neuronal responses in cat visual cortex. Science. 1991;252:1177–1179. doi: 10.1126/science.252.5009.1177. [DOI] [PubMed] [Google Scholar]
- Feng G, Mellor RH, Bernstein M, Keller-Peck C, Nguyen QT, Wallace M, Nerbonne JM, Lichtman JW, Sanes JR. Imaging neuronal subsets in transgenic mice expressing multiple spectral variants of GFP. Neuron. 2000;28:41–51. doi: 10.1016/s0896-6273(00)00084-2. [DOI] [PubMed] [Google Scholar]
- Finlay BL, Slattery M. Local differences in the amount of early cell death in neocortex predict adult local specializations. Science. 1983;219:1349–1351. doi: 10.1126/science.6828866. [DOI] [PubMed] [Google Scholar]
- Fishell G. Perspectives on the developmental origins of cortical interneuron diversity. Novartis Found Symp. 2007;288:21–35. discussion 35–44, 96–98. [PubMed] [Google Scholar]
- Gall D, Roussel C, Susa I, D'Angelo E, Rossi P, Bearzatto B, Galas MC, Blum D, Schurmans S, Schiffmann SN. Altered neuronal excitability in cerebellar granule cells of mice lacking calretinin. J Neurosci. 2003;23:9320–9327. doi: 10.1523/JNEUROSCI.23-28-09320.2003. [DOI] [PMC free article] [PubMed] [Google Scholar]
- Grove EA, Fukuchi-Shimogori T. Generating the cerebral cortical area map. Annu Rev Neurosci. 2003;26:355–380. doi: 10.1146/annurev.neuro.26.041002.131137. [DOI] [PubMed] [Google Scholar]
- Hébert JM, Fishell G. The genetics of early telencephalon patterning: some assembly required. Nat Rev Neurosci. 2008;9:678–685. doi: 10.1038/nrn2463. [DOI] [PMC free article] [PubMed] [Google Scholar]
- Hensch TK. Critical period plasticity in local cortical circuits. Nat Rev Neurosci. 2005;6:877–888. doi: 10.1038/nrn1787. [DOI] [PubMed] [Google Scholar]
- Hevner RF, Shi L, Justice N, Hsueh Y, Sheng M, Smiga S, Bulfone A, Goffinet AM, Campagnoni AT, Rubenstein JL. Tbr1 regulates differentiation of the preplate and layer 6. Neuron. 2001;29:353–366. doi: 10.1016/s0896-6273(01)00211-2. [DOI] [PubMed] [Google Scholar]
- Hooks BM, Chen C. Critical periods in the visual system: changing views for a model of experience-dependent plasticity. Neuron. 2007;56:312–326. doi: 10.1016/j.neuron.2007.10.003. [DOI] [PubMed] [Google Scholar]
- Inan M, Crair MC. Development of cortical maps: perspectives from the barrel cortex. Neuroscientist. 2007;13:49–61. doi: 10.1177/1073858406296257. [DOI] [PubMed] [Google Scholar]
- Inoue T, Tanaka T, Suzuki SC, Takeichi M. Cadherin-6 in the developing mouse brain: expression along restricted connection systems and synaptic localization suggest a potential role in neuronal circuitry. Dev Dyn. 1998;211:338–351. doi: 10.1002/(SICI)1097-0177(199804)211:4<338::AID-AJA5>3.0.CO;2-I. [DOI] [PubMed] [Google Scholar]
- Krishna K, Nuernberger M, Weth F, Redies C. Layer-specific expression of multiple cadherins in the developing visual cortex (V1) of the ferret. Cereb Cortex. 2009;19:388–401. doi: 10.1093/cercor/bhn090. [DOI] [PubMed] [Google Scholar]
- Lavdas AA, Grigoriou M, Pachnis V, Parnavelas JG. The medial ganglionic eminence gives rise to a population of early neurons in the developing cerebral cortex. J Neurosci. 1999;19:7881–7888. doi: 10.1523/JNEUROSCI.19-18-07881.1999. [DOI] [PMC free article] [PubMed] [Google Scholar]
- Mallamaci A, Stoykova A. Gene networks controlling early cerebral cortex arealization. Eur J Neurosci. 2006;23:847–856. doi: 10.1111/j.1460-9568.2006.04634.x. [DOI] [PubMed] [Google Scholar]
- Markram H, Toledo-Rodriguez M, Wang Y, Gupta A, Silberberg G, Wu C. Interneurons of the neocortical inhibitory system. Nat Rev Neurosci. 2004;5:793–807. doi: 10.1038/nrn1519. [DOI] [PubMed] [Google Scholar]
- Métin C, Baudoin JP, Rakić S, Parnavelas JG. Cell and molecular mechanisms involved in the migration of cortical interneurons. Eur J Neurosci. 2006;23:894–900. doi: 10.1111/j.1460-9568.2006.04630.x. [DOI] [PubMed] [Google Scholar]
- Molyneaux BJ, Arlotta P, Menezes JR, Macklis JD. Neuronal subtype specification in the cerebral cortex. Nat Rev Neurosci. 2007;8:427–437. doi: 10.1038/nrn2151. [DOI] [PubMed] [Google Scholar]
- Nakagawa Y, Johnson JE, O'Leary DD. Graded and areal expression patterns of regulatory genes and cadherins in embryonic neocortex independent of thalamocortical input. J Neurosci. 1999;19:10877–10885. doi: 10.1523/JNEUROSCI.19-24-10877.1999. [DOI] [PMC free article] [PubMed] [Google Scholar]
- Nieto M, Monuki ES, Tang H, Imitola J, Haubst N, Khoury SJ, Cunningham J, Gotz M, Walsh CA. Expression of Cux-1 and Cux-2 in the subventricular zone and upper layers II–IV of the cerebral cortex. J Comp Neurol. 2004;479:168–180. doi: 10.1002/cne.20322. [DOI] [PubMed] [Google Scholar]
- O'Leary DD, Chou SJ, Sahara S. Area patterning of the mammalian cortex. Neuron. 2007;56:252–269. doi: 10.1016/j.neuron.2007.10.010. [DOI] [PubMed] [Google Scholar]
- Price DJ, Kennedy H, Dehay C, Zhou L, Mercier M, Jossin Y, Goffinet AM, Tissir F, Blakey D, Molnár Z. The development of cortical connections. Eur J Neurosci. 2006;23:910–920. doi: 10.1111/j.1460-9568.2006.04620.x. [DOI] [PubMed] [Google Scholar]
- Prophet EB, Mills B, Arrington JB, Sobin LH, editors. Laboratory methods in histotechnology. Washington, DC: American Registry of Pathology; 1992. [Google Scholar]
- Pulvers JN, Huttner WB. Brca1 is required for embryonic development of the mouse cerebral cortex to normal size by preventing apoptosis of early neural progenitors. Development. 2009;136:1859–1868. doi: 10.1242/dev.033498. [DOI] [PubMed] [Google Scholar]
- Rakic P. Specification of cerebral cortical areas. Science. 1988;241:170–176. doi: 10.1126/science.3291116. [DOI] [PubMed] [Google Scholar]
- Rash BG, Grove EA. Area and layer patterning in the developing cerebral cortex. Curr Opin Neurobiol. 2006;16:25–34. doi: 10.1016/j.conb.2006.01.004. [DOI] [PubMed] [Google Scholar]
- Roth A, Häusser M. Compartmental models of rat cerebellar Purkinje cells based on simultaneous somatic and dendritic patch-clamp recordings. J Physiol. 2001;535:445–472. doi: 10.1111/j.1469-7793.2001.00445.x. [DOI] [PMC free article] [PubMed] [Google Scholar]
- Schneider GE. Two visual systems. Science. 1969;163:895–902. doi: 10.1126/science.163.3870.895. [DOI] [PubMed] [Google Scholar]
- Shimogori T, Banuchi V, Ng HY, Strauss JB, Grove EA. Embryonic signaling centers expressing BMP, WNT and FGF proteins interact to pattern the cerebral cortex. Development. 2004;131:5639–5647. doi: 10.1242/dev.01428. [DOI] [PubMed] [Google Scholar]
- Sholl DA. Dendritic organization in the neurons of the visual and motor cortices of the cat. J Anat. 1953;87:387–406. [PMC free article] [PubMed] [Google Scholar]
- Shu W, Yang H, Zhang L, Lu MM, Morrisey EE. Characterization of a new subfamily of winged-helix/forkhead (Fox) genes that are expressed in the lung and act as transcriptional repressors. J Biol Chem. 2001;276:27488–27497. doi: 10.1074/jbc.M100636200. [DOI] [PubMed] [Google Scholar]
- Stenman J, Toresson H, Campbell K. Identification of two distinct progenitor populations in the lateral ganglionic eminence: implications for striatal and olfactory bulb neurogenesis. J Neurosci. 2003;23:167–174. doi: 10.1523/JNEUROSCI.23-01-00167.2003. [DOI] [PMC free article] [PubMed] [Google Scholar]
- Steriade M, Timofeev I, Dürmüller N, Grenier F. Dynamic properties of corticothalamic neurons and local cortical interneurons generating fast rhythmic (30–40 Hz) spike bursts. J Neurophysiol. 1998;79:483–490. doi: 10.1152/jn.1998.79.1.483. [DOI] [PubMed] [Google Scholar]
- Stoykova A, Treichel D, Hallonet M, Gruss P. Pax6 modulates the dorsoventral patterning of the mammalian telencephalon. J Neurosci. 2000;20:8042–8050. doi: 10.1523/JNEUROSCI.20-21-08042.2000. [DOI] [PMC free article] [PubMed] [Google Scholar]
- Sugiyama S, Di Nardo AA, Aizawa S, Matsuo I, Volovitch M, Prochiantz A, Hensch TK. Experience-dependent transfer of Otx2 homeoprotein into the visual cortex activates postnatal plasticity. Cell. 2008;134:508–520. doi: 10.1016/j.cell.2008.05.054. [DOI] [PubMed] [Google Scholar]
- Suzuki SC, Inoue T, Kimura Y, Tanaka T, Takeichi M. Neuronal circuits are subdivided by differential expression of type-II classic cadherins in postnatal mouse brains. Mol Cell Neurosci. 1997;9:433–447. doi: 10.1006/mcne.1997.0626. [DOI] [PubMed] [Google Scholar]
- Tissir F, Goffinet AM. Reelin, Cajal-Retzius cells, and cortical evolution. In: Kaas JH, editor. Evolution of nervous systems. London: Elsevier; 2007. pp. 89–95. [Google Scholar]
- Tissir F, Wang CE, Goffinet AM. Expression of the chemokine receptor Cxcr4 mRNA during mouse brain development. Brain Res Dev Brain Res. 2004;149:63–71. doi: 10.1016/j.devbrainres.2004.01.002. [DOI] [PubMed] [Google Scholar]
- Tissir F, Bar I, Jossin Y, De Backer O, Goffinet AM. Protocadherin Celsr3 is crucial in axonal tract development. Nat Neurosci. 2005;8:451–457. doi: 10.1038/nn1428. [DOI] [PubMed] [Google Scholar]
- Traub RD, Whittington MA, Stanford IM, Jefferys JG. A mechanism for generation of long-range synchronous fast oscillations in the cortex. Nature. 1996;383:621–624. doi: 10.1038/383621a0. [DOI] [PubMed] [Google Scholar]
- Vicente R, Gollo LL, Mirasso CR, Fischer I, Pipa G. Dynamical relaying can yield zero time lag neuronal synchrony despite long conduction delays. Proc Natl Acad Sci U S A. 2008;105:17157–17162. doi: 10.1073/pnas.0809353105. [DOI] [PMC free article] [PubMed] [Google Scholar]
- Ying G, Wu S, Hou R, Huang W, Capecchi MR, Wu Q. The protocadherin gene Celsr3 is required for interneuron migration in the mouse forebrain. Mol Cell Biol. 2009;29:3045–3061. doi: 10.1128/MCB.00011-09. [DOI] [PMC free article] [PubMed] [Google Scholar]
- Zhou L, Bar I, Achouri Y, Campbell K, De Backer O, Hebert JM, Jones K, Kessaris N, de Rouvroit CL, O'Leary D, Richardson WD, Goffinet AM, Tissir F. Early forebrain wiring: genetic dissection using conditional Celsr3 mutant mice. Science. 2008;320:946–949. doi: 10.1126/science.1155244. [DOI] [PMC free article] [PubMed] [Google Scholar]


