

Abstract
Flexible sensorimotor planning is the basis for goal-directed behavior. We investigated the integration of visuospatial information with context-specific transformation rules during reach planning. We were especially interested in the relative timing of motor-goal decisions in monkey dorsal premotor cortex (PMd) and parietal reach region (PRR). We used a rule-based mapping task with different cueing conditions to compare task-dependent motor-goal latencies. The task allowed us a separation of cue-related from motor-related activity, and a separation of activity related to motor planning from activity related to motor initiation or execution. The results show that selectivity for the visuospatial goal of a pending movement occurred earlier in PMd than PRR whenever the task required spatial remapping. Such remapping was needed if the spatial representation of a cue or of a default motor plan had to be transformed into a spatially incongruent representation of the motor goal. In contrast, we did not find frontoparietal latency differences if the spatial representation of the cue or the default plan was spatially congruent with the motor goal. The fact that frontoparietal latency differences occurred only in conditions with spatial remapping was independent of the subjects' partial a priori knowledge about the pending goal. Importantly, frontoparietal latency differences existed for motor-goal representations during movement planning, without immediate motor execution. We interpret our findings as being in support of the hypothesis that latency differences reflect a dynamic reorganization of network activity in PRR, and suggest that the reorganization is contingent on frontoparietal projections from PMd.
Introduction
Goal-directed behavior is guided by spatial sensory input in combination with context-specific rules. This way, the same sensory input can lead to a wide variety of motor outputs. The reciprocally connected posterior parietal cortex (PPC) and dorsal premotor cortex (PMd) are believed to mediate such space–context integration (Mitz et al., 1991; Kalaska, 1996; Wise et al., 1996; 1997; Kalaska et al., 1997; Passingham et al., 2000; Eliassen et al., 2003; Wallis and Miller, 2003; Stoet and Snyder, 2004; Buneo and Andersen, 2006; Cisek, 2007; Pesaran et al., 2008). For example, neurons in the parietal reach region (PRR) (Gail and Andersen, 2006; Gail et al., 2009) and PMd (Boussaoud and Wise, 1993; di Pellegrino and Wise, 1993; Crammond and Kalaska, 1994, 2000) show sustained motor-goal tuning when the reach goal has to be inferred from a spatial cue by applying a context-specific transformation rule.
How is such space–context integration accomplished, and what is the functional role of reciprocal frontoparietal projections? Network models of space–context integration have suggested frontoparietal projections to help sustain motor-goal memory (Cisek, 2006) or to mediate context-specific visuomotor transformations via gain modulation (Brozović et al., 2007; Gail et al., 2009). Also, frontoparietal neural latency differences (LDs) were shown for motor-related activity around the time of movement initiation (Kalaska et al., 1983; Johnson et al., 1996), which nourished the ideas that frontoparietal LDs could reflect corollary discharge signals (Mountcastle et al., 1975; Bioulac and Lamarre, 1979; Kalaska et al., 1983; Seal and Commenges, 1985; Johnson et al., 1996) and parietal cortex might be involved in internal forward modeling for current state estimation during motor control (Mulliken et al., 2008; Shadmehr and Krakauer, 2008). Finally, for motor planning activity before movement initiation frontoparietal LDs and transient bidirectional frontoparietal interactions are pronounced specifically during decision-making tasks, but not for tasks with direct cueing (Pesaran et al., 2008). This suggests that the functional interdependencies between frontal and parietal areas are task dependent (Kalaska and Crammond, 1992; Cisek, 2006; 2007).
We tested how compatible frontoparietal LDs are with the above ideas. We asked specifically whether frontoparietal LDs are the consequence of a corollary discharge signal, and in which way they depend on cognitive decision processes. Different from previous studies, we explicitly isolated the latencies of motor planning activity from cue- or movement-related activity by using a pro-reach/anti-reach task (Crammond and Kalaska, 1994; Zhang et al., 1997; Gail and Andersen, 2006) in combination with partial precueing (Lecas et al., 1986; Riehle and Requin, 1989; Riehle, 1991; Hoshi and Tanji, 2000; Nakayama et al., 2008).
The pattern of frontoparietal LDs that we found in our study suggests that slower motor-goal representations in PRR than PMd reflect a need for the buildup or reorganization of spatial representations in PRR during spatial remapping tasks, independent of corollary discharge or decision signals. We will discuss how far the results could indicate the existence of prospective internal forward model predictions triggered by motor planning rather than by motor execution.
Materials and Methods
Tasks and control of behavior.
With our task, we wanted to test how the dynamics of motor-goal decisions and their cortical representations depend on whether the subjects had to perform a memory or reaction-time (RT) task. Further, we aimed to test how partial advance information (precueing) about the to-be-performed reach influences the dynamics of motor-goal decisions.
To separate neural motor-goal representations from other neural signals, we used an anti-reach task design (Gail and Andersen, 2006). The anti-reach task required the subjects to map a spatial instruction cue onto one of two reach goals, either at the location of the cue (pro) or opposite to it (anti). The spatial transformation rule was instructed with a colored context cue (Fig. 1A) (see below for details). The motor goal could only be defined uniquely by the combination of both cues. The eight reach conditions (two context conditions × four cue directions) were randomly interleaved.
Figure 1.

Anti-reach task with different cueing conditions and visuomotor tuning in PMd and PRR. A, Memory-guided anti-reach task. The left sequence shows an example of a pro-trial, the right an example of an anti-trial in the RS condition. Black and white central squares represent the eye- and hand-fixation stimuli. The central colored frame represents the contextual cue instructing the transformation rule pro or anti, and the peripheral white circle represents the spatial cue. The target position is indicated by the dotted circle. Arrows and dotted circles are for demonstration purpose only and were not shown to the subjects. Note that a go-cue period of 170 ms is only relevant for other cueing conditions, as in B. B, In four cueing conditions, the contextual and spatial cue could be presented simultaneously or separately either before or after a variable memory period: transformation rule and spatial cue presented as precue (RS condition), no precue (N; rule and spatial cue as go-cue), only rule as precue (R; spatial cue as go-cue), or only spatial cue as precue (S; rule as go-cue). C, PSTHs and raster plots of a PRR example neuron. This example motor-goal neuron shows a dynamic switching for cue- to motor-related tuning in response to the precue (shaded area) in the RS condition. Neuronal activities are shown for spatial cues presented at 270° (left panel; MD) and 90° (right panel; NP). Polar plots show the directional tuning of the neuron between 100 and 200 ms (cue period), and 400 and 700 ms (memory period) relative to the cue position separately for pro- and anti-trials. D, Visuomotor dynamics in the population of PMd and PRR neurons. The percentage of spatially tuned neurons of all recorded neurons is plotted for PMd (top) and PRR (bottom) for the first 450 ms after onset of the precue in the RS condition. Blue bars reflect the percentage of neurons with cue-related tuning, green bars reflect motor-related tuning, and red bars reflect spatially undefined tuning (see Materials and Methods).
Different cueing conditions were realized by presenting the cues either before (precue period) or after (go-cue period) an instructed delay. The precue consisted of the contextual and the spatial cue together [rule and spatial condition (RS)], only the spatial cue [spatial-only condition (S)], only the contextual cue [rule-only condition (R)], or nothing [null condition (N)]. The four cueing conditions were randomly mixed in small blocks of 10–20 trials (Fig. 1B).
Stimuli were presented on an LCD screen (19 inch ViewSonic LCD VX922; onset latencies corrected). The contextual cue consisted of a colored frame around the small, central red eye and white hand fixation points, and instructed the subject to reach toward (green = pro) or diametrically opposite (blue = anti) of the spatial cue. The peripheral and color-neutral spatial cue was located left, right, above, or below the central fixation points at 9 cm eccentricity [14.5° visual angle (VA)].
The exact timeline of the trials was as follows (Fig. 1A): Monkeys initiated the trials by acquiring central eye fixation (tolerance: 2.5–4.0° VA; 224 Hz CCD camera, ET-49B, Thomas Recording) and hand fixation at a touch screen (tolerance: 4.0° VA; IntelliTouch screen, ELO Systems). A variable-length fixation period (500–1000 ms) was followed by the brief precue period (200 ms). The monkeys had to keep eye and hand fixation for the memory period (800–2000 ms), before the hand fixation stimulus disappeared (go-signal). In non-RS trials, a simultaneous go-cue was flashed (170 ms) and completed the missing information to uniquely specify the reach goal. Monkeys had to reach toward the instructed goal within a maximum of 700–1000 ms (movement period; reach tolerance: 5.7° VA) and hold the goal position for 300–400 ms (feedback period). Visual feedback indicated the correct movement goal (filled circle of the same color as the contextual cue at the goal location) during the last 300 ms of the feedback period, i.e., only once the monkey had finished the reach. Eye fixation had to be kept throughout the trial. Liquid reward and acoustic feedback indicated correct (high pitch tone, reward) or incorrect (low pitch tone, no reward) behavior.
Animal preparation and neural recordings.
Two male rhesus monkeys (Macaca mulatta; monkey S and monkey A) were trained to perform the anti-reach task with partial precueing. The recording procedure was as in previous experiments (Gail et al., 2009). In brief, monkeys were implanted with a titanium head holder and two magnetic resonance imaging (MRI)-compatible recording chambers, custom-fit to the monkeys' heads (3di). Chamber positioning above PRR [Horsley Clarke coordinates: 6 mm/8.5 mm (monkey S/monkey A) contralateral; 10 mm/9.5 mm posterior], and PMd (13 mm/13.5 mm contralateral; 17 mm/19.8 mm anterior) was guided by presurgical structural MRI and confirmed by postsurgical MRI. Sustained direction-selective neural responses during center-out reach planning (memory period) were used as a physiological signature in both areas to confirm the region of interest. Both chambers were implanted contralaterally to the handedness of the monkey (monkey A, left hemisphere; monkey S, right hemisphere). All surgical and imaging procedures were conducted under general anesthesia.
We used two five-channel microdrives (“mini-matrix”; Thomas Recording) for extracellular recordings, mostly simultaneously in each chamber. The raw signals of the electrodes were preamplified (20×; Thomas Recording), bandpass filtered, and amplified (154 Hz to 8.8 kHz; 400–800×; Plexon) before online spike sorting was conducted (Sort Client; Plexon). Spike times and spike waveforms were recorded and later subjected to additional offline sorting (Offline Sorter; Plexon).
Animal care and all experimental procedures were conducted in accordance with German laws governing animal care.
Time-resolved directional and rule selectivity in individual neurons.
Time-resolved analysis of directional and rule selectivity was conducted to reveal the cortical dynamics of motor-goal decisions. The analysis time window was between 200 ms before onset of the relevant cue and 450 ms after cue onset. In the RS condition, the time around the precue was analyzed. In the N, R, and S conditions, the time around the go-cue was analyzed. All recorded and sufficiently well isolated units were included in the analysis, regardless of their tuning properties, unless explicitly stated otherwise.
For time-continuous analyses, we used spike densities, which were computed by convolving each spike with a causal kernel, which was defined as follows:
 |
where R(t) is the spike density at time point t. The rise time constant τg was set to 2 ms, and the decay time constant τd was set to 20 ms (Thompson et al., 1996; Monosov et al., 2008). Average spike densities across trials with identical conditions (9–15 repetitions per condition) were sampled at 1 ms resolution and aligned to the onset of either the precue or the go-cue. To reduce variability in the time-resolved tuning analyses of individual neurons (see below), we additionally used a sliding window of 20 ms length, within which the spike densities were averaged and which was shifted in steps of 1 ms.
Time-resolved rule selectivity (context tuning) was defined by a significant difference (rank sum test) between the average spike densities in pro- and anti-trials in the memory period of the R condition. The analysis was conducted in each time bin.
Time-resolved directional selectivity was quantified with a directional tuning vector (DTV). It is defined as the vector average across all center-out cue directions u→i (unit vectors) weighted with the corresponding mean spike rates rij of neuron j as follows:
 |
The direction α of the DTV can take any value between 0° and 360°. The DTV was defined relative to the location of the spatial cue, i.e., 0° corresponds to a rightward cue. The significance of directional tuning was tested with a nonparametric one-way ANOVA (Kruskal–Wallis, α = 0.05, unless stated otherwise) plus an additional criterion. The criterion required that the length of the DTV had to be >0.2, after the DTV was normalized to the spike density at the direction with the maximal response in that time bin. The fixed criterion of 0.2 was arbitrary, but varying it between 0.15 and 0.25 did not change our conclusions. With this criterion, we excluded neurons with a bimodal tuning close to symmetric. Such symmetric bimodal tuning could represent two potential motor goals instead of one selected motor goal and would be characterized by a significant ANOVA but a DTV length close to zero (see S-4, available at www.jneurosci.org as supplemental material). The DTV was computed in every time bin, separately for pro- and anti-trials, and separately within each cueing condition.
Cue-related versus motor-related tuning.
The anti-reach task design allowed separating cue-related from motor-related tuning by comparing the directional selectivity in pro- and anti-reaches (Gail and Andersen, 2006). A neuron's instantaneous (bin-to-bin) directional tuning was categorized according to the absolute difference in DTV direction between pro- and anti-trials in each time bin: cue-related tuning (|Δα| < 45°), motor-related tuning (|Δα| > 135°), or spatially undefined tuning (else). This definition of instantaneous tuning depended on a direct bin-wise comparison of spatial tuning between pro- and anti-trials in each cueing condition.
As known from previous studies (Crammond and Kalaska, 1994; Gail and Andersen, 2006), spatiotemporal tuning profiles of individual neurons in PMd and PRR can change over time from cue related to motor related (Fig. 1C), whereas other neurons may show motor-related tuning from the earliest onset of their response. The activity profile of the example neuron in Figure 1C shows the changing tuning properties of the neuron between the time windows 100–200 ms (cue period) and 400–700 ms (memory period). Figure 1D shows the number of cue- and motor-related neurons as a fraction of all recorded neurons over the time of the trial in PMd and PRR.
We characterized the neurons according to their spatiotemporal response profiles. We considered neurons to have a significant cue-related response when the instantaneous cue-related tuning in the RS condition persisted in at least 90% of 30 consecutive time bins within 200 ms after the onset of the precue (an equivalent definition of cue-related response could be achieved for responses following the go-cue in the N condition, which did not change our results). We defined neurons as motor-goal neurons when they showed significant movement planning activity. Motor planning activity was defined as motor-related tuning for at least 90% of 50 consecutive time bins within 450 ms after precue onset in the RS condition. The different number of time bins for a cue-related response and motor planning activity was set because the cue response is transient, whereas the motor-related response is more sustained. We defined neurons as perimovement neurons that did not show motor planning activity but that at some point in time after the go-cue were motor tuned.
Finally, we defined a time-invariant, motor-related preferred direction (PD) for each neuron. The PD was computed by averaging the tuning vectors in pro-reaches over all time bins of the analysis time window in which the neuron showed significant instantaneous motor-related tuning. The PD was computed separately within each cueing condition.
Determination of motor-goal latencies separately in pro- and anti-trials.
If motor-goal latencies in a cortical area were different in pro- and anti-trials, then the analysis of instantaneous motor-related tuning would reveal the time course of the motor-goal tuning in the slower of two conditions (pro or anti), since instantaneous tuning is based on an bin-to-bin comparison between pro- and anti-trials.
To analyze motor-goal latencies separately in pro- and anti-trials, we needed to extract the time courses of cue- versus motor-related tuning in pro- and anti-trials separately. We accomplished this with two measures. First, we restricted our data set to neurons that did not show cue-related responses. Cue-related responses are indistinguishable from motor-related responses in pro-reaches, since cue and motor goals are spatially identical in this case. Hence, cue-related responses would confound measurements of motor-goal latencies in pro-trials. Second, we compared the instantaneous tuning direction of a neuron in the currently considered context (pro or anti) with the time-invariant PD of this neuron (see definition in the previous section) to decide on the time-resolved cue versus motor relatedness within this context.
Determination of motor-goal latencies in reaction-time conditions.
Motor-related tuning could result either from motor planning activity or from perimovement activity (corollary discharge or sensory feedback about the movement). In the RT conditions (N, R, S), the isolation of motor-goal latencies (planning activity) from motor feedback (perimovement activity) was not guaranteed without further precautions. (Only the motor-related tuning in the memory period of the RS condition could be directly considered motor-goal tuning, since movements in these trials were initiated much later.) To isolate motor-goal latencies from latencies of perimovement activity in RT conditions, we separately conducted our latency analyses within either a population of exclusive motor-goal neurons, i.e., neurons that showed significant motor planning activity, or within the complementary population of perimovement neurons.
Population analyses of motor-related tuning.
We characterized the motor-related tuning in neural populations in two ways. First, we computed average peristimulus time histograms (PSTHs) across neurons of each cortical area and within each different cueing condition. We did this to illustrate general neural response properties as a function of time. Second, we computed the time-resolved fraction of motor-tuned neurons (recruitment curves) in each cortical area and cueing condition for statistical analyses. We excluded neurons with cue-related responses to show the motor-related time courses.
PSTHs across neurons were computed as the average response in the direction of each neuron's maximal response [PSTH for maximum direction (MD)] and, separately, in the opposite direction [nonpreferred direction (NP)]. The maximum direction for each neuron was defined as the direction with the maximal average response across time and trials in pro-trials within the time window of 200–350 ms after cue onset (precue in RS; go-cue in N, R, and S conditions). A time window shorter than the analysis time window was chosen because in PMd the activity of the neurons starts to decrease around 300 ms after the go-cue (see Fig. 2C,D). Note that the MD and NP directions are restricted to the discrete cue directions left, right, up, and down, since only for these directions PSTHs can be computed. The response of each neuron was normalized to its maximal response within the 200–350 ms time window and within each task condition before averaging across neurons. Average PSTHs across neurons were calculated separately for pro- and anti-trials in MD and NP for each cueing condition. Neurons that did not show significant directional selectivity in any time bin during the analysis time window in either pro- or anti-trials were excluded from this analysis. Because of the necessary normalization, random fluctuations in such nontuned neurons would be inappropriately amplified, and would contribute to the average PSTH with similar weight as strongly tuned neurons.
Figure 2.

Dynamics of motor-related tuning in PMd and PRR in memory and reaction-time conditions. A, B, Data for pro-trials (left column, green) and anti-trials (right column, blue) aligned to the onset of the precue in the RS condition (memory). Shaded areas indicate the time of cue visibility. C, D, Equivalent data aligned to the onset of the go-cue in the N condition (reaction time). Gray arrows in D indicate mean RT across 176 recording sessions. A, C, PSTHs: Mean ± SE (shaded) of PMd (dark colors) and PRR (light colors) normalized population activity in MD (solid) and NP (dotted). B, D, Recruitment curves: fraction of neurons tuned in PMd (red) and PRR (yellow) in each time bin relative to the number of neurons tuned for the pro- or anti-goal in any time bin of the analysis time window (numbers in legend). Latencies in each condition were determined via a threshold criterion. Frontoparietal LDs between PMd and PRR were tested with a randomization test (see Materials and Methods). The histogram insets show the distribution of LDs with randomized data compared with the LD of the original sample (red arrow). The p values indicate the significance of the LDs. PMd showed earlier motor-related tuning than PRR in anti-reaches but not in pro-reaches, both in the RS and N condition.
Recruitment curves denote the fraction of neurons that were motor tuned in a specific time bin relative to the total number of neurons that were motor tuned in any time bin of the analysis time window (see Fig. 2B). Recruitment curves in our experiment have two advantages over PSTH comparisons. First, normalization and averaging of neural responses were not needed for computing recruitment curves. Averaging across neurons, as done for population PSTHs, typically cannot account for the different response profiles of the individual neurons. For example, many neurons have very low baseline firing and show brisk response onsets after cue presentation, whereas others have high baseline levels and might exhibit their directional selectivity by small excitatory responses to one cue direction and strong inhibitory responses to other directions. Also, normalization tends to boost weak, noisy responses. Second, the recruitment curves are based on tuning functions that interpolate between all four measured directions. The comparison between MD and NP in PSTHs is restricted to two of the four measured directions. As a consequence, PSTHs are less sensitive for neurons with oblique PDs and broad tuning, which is not the case for recruitment curves. For these reasons, we based our statistical analyses on the recruitment curves and use PSTHs only for illustration purposes.
Quantification of neural LDs.
We determined motor-goal latencies by a threshold criterion for the neuronal recruitment curves (for controls and alternatives, see S1–S3, available at www.jneurosci.org as supplemental material). Latency of motor tuning within each condition was defined as the average time relative to cue onset at which the fraction of motor-tuned neurons exceeded each of seven threshold levels for at least 100 ms. Seven equidistant threshold levels were defined relative to the following baseline: Th(p) = baseline + (p × (1 − baseline)), where “baseline” refers to the average fraction of tuned neurons in the 200 ms before cue onset. The p value was set to 0.05, 0.1, 0.15, 0.2, 0.25, 0.3, and 0.35 to characterize the early tuning onset of the fastest ∼35% of neurons. The average across seven thresholds was built to become less sensitive to minor random fluctuations. Note that absolute latencies depend on the choice of thresholds, and hence are of limited conclusiveness. We statistically analyzed only latency differences between conditions or neural populations.
Pairwise neural LDs between task conditions or cortical areas were computed and tested for being different from zero. Averaging across absolute latencies measured with multiple threshold levels would induce artificial variance and compromise statistical power. Therefore, we computed the LDs separately for each threshold level and only then computed the average LD across thresholds. Permutation tests (N = 10,000 samples) were used to estimate the probability that the original sample indicates a significant difference from zero. In each permutation, each neuron's tuning data were randomly assigned to one of the two task conditions or cortical areas in consideration, such that the numbers of neurons in both populations were the same as in the original sample. The resulting p value represents the percentage of random permutations leading to an LD larger or equal to the original sample. A difference was considered significant if the p value was <5%.
Neural response latencies and behavioral reaction times.
Behavioral RTs were defined as the median time from onset of the go-cue until the release of the touch screen within each recording session and task condition. Average RTs were computed across recording sessions. RT differences between pro- and anti-trials were tested with a paired t test across sessions and within each task condition.
To relate motor-goal latencies of individual neurons to behavioral RTs, we analyzed motor-goal latencies after the go-cue in all RT conditions (N, R, and S) on a trial-by-trial basis. We used a threshold criterion to define latencies in those trials where the neurons showed a good-enough response to the pending motor goal: post-go-cue, single-trial activity needed to exceed baseline activity (= mean spike density of the last 200 ms of the N condition memory period) by at least three times its SD for at least 100 ms within the analysis time window. To cope with the sparse spike events in low-firing neurons, we estimated spike densities in single trials with a Gaussian kernel of width σ = 50 ms, as follows:
 |
The Gaussian kernel resulted in stronger smoothing than the EPSP kernel used for the trial-average data above. In the RS condition, the onset of motor-goal tuning (after the precue) is not related to the RT (after the go-cue); therefore, single-trial latencies in the RS condition were not taken into account. Nontuned neurons and neurons with a cue-related response (see above) were excluded from the analysis to avoid confounds.
We removed RT and single-trial neural latency outliers for the trial-to-trial regression analysis between RTs and neural latencies. A value was classified as an outlier if its distance from the median was >1.5 times the interquartile range (distance between the 75th and 25th percentiles). Since only a small fraction of trials allowed determination of neural response latencies, data from all RT conditions were merged, and linear regression curves were calculated for all neurons in which single trial latencies could be estimated in at least 10 trials.
Results
Extracellular single-neuron spiking activities were recorded from 258 neurons in PRR (monkey S, 99; monkey A, 159) and 192 neurons in PMd (monkey S, 74; monkey A, 118) while the monkeys performed the anti-reach task with partial precueing (Fig. 1). The average performance of monkey S was 77%/77% (pro/anti) in the RS condition, 80%/79% in the N condition, 75%/75% in the R condition, and 79%/79% in the S condition. The average performance of monkey A was 86%/86% in the RS condition, 86%/85% in the N condition, 85%/83% in the R condition, and 85%/84% in the S condition for pro- and anti-reaches, respectively. Errors were mainly caused by ocular fixation breaks and not by incorrect target choices. The choice of the monkey for a reach target was correct in 97% for monkey S, and in 99% for monkey A.
Motor-goal latencies after simultaneous cueing of transformation rule and spatial information
Is motor planning activity represented earlier in either PMd or PRR? If there is an LD, do the LDs depend on a motor command or motor execution, or do they also exist for planning activity proper? To answer these questions, we first analyzed motor-goal tuning latencies in PMd and PRR, when the monkeys were instructed simultaneously with both the transformation rule (pro/anti) and the spatial cue. We compared motor-goal latencies in response to the simultaneous cues in instructed-delay trials (precue in the RS condition) and in reaction-time trials (go-cue in the N condition). If motor-goal latency differences exist in both conditions—especially if they exist after the precue at the beginning of an instructed delay—then they must be independent of motor execution and represent dynamics of motor planning. If latency differences only existed after a go-cue immediately before or during motor execution, then they should be related to corollary discharge or motor-related sensory feedback. The anti-reach task allowed us to separate cue- from motor-related responses (Fig. 1C,D) and to extract motor-goal latencies separately in each context (pro and anti). For analyses of motor-goal latencies separately within each context we had to restrict the neurons to those that did not show cue-related responses (see Materials and Methods). In PMd, 175 of 192 neurons (91%) fulfilled this criterion. In PRR, this was the case for 215 of 258 neurons (83%, RS condition). Because of this necessary constraint, our conclusions—strictly speaking—are limited to neurons without a cue-related response. However, since the fraction of neurons with a cue-related response is small, and only a subpopulation of these would qualify for our analyses because of additional selection criteria, we do not expect that these few neurons would change the results in any significant way.
Figure 2 shows the population PSTHs and fraction of significantly motor-tuned neurons (recruitment curves) in PMd and PRR for pro- and anti-reaches in the RS condition (Fig. 2A,B) and N condition (Fig. 2C,D). In the pro-trials of the RS condition, the population PSTHs in PMd and PRR were practically identical (Fig. 2A, left). In the anti-trials, on the other hand, the average PRR response to the MD had a higher latency than the PMd response (Fig. 2A, right). Correspondingly, there was no significant LD between PMd and PRR for pro-reaches (p > 0.05, randomization test), but there was for anti-reaches (LDPRR—PMd = 41 ms, p = 0.0022) in the memory period of the RS condition (Fig. 2B). In the movement period of the N condition, the results look similar (for a more in-depth discussion of potential differences, see supplemental Fig. S4, available at www.jneurosci.org as supplemental material). There was no LD between PMd and PRR for pro-reaches, whereas in anti-reaches the motor tuning emerged earlier in PMd than in PRR (LDPRR—PMd = 22 ms, p = 0.0037). The fact, that the LD is present at the beginning of motor-goal memory trials (RS condition), at a time when the corresponding motor command will be issued at earliest ∼1–1.5 s later, suggests that the LD is related to the decision process about the motor goal or movement planning, rather than to movement execution.
Spatial remapping induces differences in motor-goal latencies between PMd and PRR
In the N as well as the RS condition, spatial and rule information were presented together, and in both conditions motor-goal tuning was earlier in PMd than PRR, but only for anti-reaches. What factors determine the time course of motor-goal decisions in the frontoparietal network? Is it possible to influence the LDs between PMd and PRR by changing the temporal sequence in which spatial and rule information are provided? We tested the influence of presenting rule information before spatial information (R condition) and of presenting spatial information before rule information (S condition). The results are shown in Figure 3. In the R condition (Fig. 3A), there was no frontoparietal LD for pro-goals (p > 0.05), but for anti-goals motor tuning occurred earlier in PMd than PRR (LDPMd—PRR = 27 ms, p = 0.0026). In contrast, in the S condition (Fig. 3B) there was a trend for earlier motor tuning in PMd than PRR in pro-reaches. The LD was close to significant when we selected the neurons according to the standard criterion for spatial tuning, as defined in Materials and Methods (LDPRR—PMd = 19 ms, p = 0.057) (Fig. 3B). It was significant (LDPRR—PMd = 25 ms, p = 0.026) when neurons were selected according to a stricter tuning criterion, which we did as a control (supplemental Fig. S1, available at www.jneurosci.org as supplemental material). There was no significant LD in anti-reaches in the S condition (LDPRR—PMd = 3 ms, p > 0.05) for either selection criterion (Fig. 3B; supplemental Fig. S1, available at www.jneurosci.org as supplemental material). Note that the higher baseline level in the S anti-trials can be explained by the spatial tuning during the S condition memory period, as will be discussed below.
Figure 3.

Dynamics of motor-related tuning in conditions with partial precueing. All the conventions for the recruitment curves are as in Figure 2D. A, Recruitment curves for the R condition. B, Recruitment curves for the S condition. Conditions that required spatial remapping (R-anti, S-pro) showed earlier motor-related tuning in PMd than PRR, whereas conditions without remapping (R-pro, S-anti) showed no LDs. See Results and Figure 5 for details on why S-pro, and not S-anti, required spatial remapping from the monkeys. Note that the LD in S-pro was significant when selecting neurons according to a stricter criterion (supplemental Fig. S1, available at www.jneurosci.org as supplemental material).
The results of the RS, N, and R conditions, which showed LDs only for anti-goals but not for pro-goals, suggest that the frontoparietal LDs could reflect the process of spatial remapping required in anti- but not pro-reaches. The LDs that we found in the S condition during pro- but not anti-reaches seem to be at odds with this remapping hypothesis. In the following, we will demonstrate that the seemingly counterintuitive results of the S condition are consistent with the idea that spatial remapping is the relevant factor for inducing motor-goal LDs between PRR and PMd. For this, we analyzed the neural encoding and putative cognitive strategy of the monkeys in the memory periods of the R and S conditions, first with respect to the context encoding, and second—and more importantly—with respect to the spatial encoding.
Figure 4 shows the comparative dynamics of context tuning in PMd and PRR. The context was represented earlier and more prevalently in PMd than PRR. Toward the end of the R condition memory period, the fraction of rule-tuned cells was only slightly higher in PMd than PRR, consistent with earlier reports (Gail et al., 2009). This finding does not imply any specific effect on the relative time courses of motor-goal encoding in PMd versus PRR after the spatial go-cue at the end of the R condition memory period.
Figure 4.

Dynamics of contextual tuning after precueing of the transformation rule. Recruitment curves show that the fraction of neurons with significantly different spike densities between pro- and anti-trials was higher in PMd (red) than PRR (yellow). This was the case especially early in the memory period after the R condition precue. Other conventions are the same as in Figure 2D.
The situation is different in the S condition. The S condition leaves some ambiguity as to what the animals memorize during the memory period of these trials: (1) a memory of the spatial precue; (2) the two potential motor goals (pro/anti), which are associated with each spatial cue as long as the context is not known; and (3) a preliminary default movement plan to either the pro- or anti-goal. If the monkeys memorized the spatial precue or by default planned a pro-reach during the memory period of the S condition, then a spatial remapping would have been required after the contextual go-cue during anti- but not pro-reaches, as was the case in the other cueing conditions. If, on the other hand, the monkeys by default planned an anti-reach during the memory period of the S condition, then a spatial remapping would have been required after the contextual go-cue during pro- but not anti-reaches. To test whether such a need for spatial remapping during S condition pro-reaches can explain the observed LDs in this condition, we analyzed the population tuning during the memory period of the S condition before the contextual go-cue was shown. Only the population of motor-goal neurons (see Materials and Methods) was used for this analysis, because for other neurons we could not expect a sustained response during the memory period. In PMd, two of the motor-goal neurons dropped out of the analysis because of a lack of activity at the end of the S condition memory period (spike density at MD, <1 Hz).
Importantly, and against intuition, in both monkeys neurons in PMd and PRR in this experiment almost exclusively encoded the anti-goal during the memory period of the S condition. Figure 5 shows the population tuning of motor-goal neurons for PMd and PRR in the last 200 ms of the memory period in the RS and the S conditions (the baseline period for the recruitment curves). The time window was chosen to analyze the activity in the S condition immediately before the contextual information was given to the monkey. The tuning curves of all motor-goal neurons were aligned and normalized with respect to their maximal response (plotted at 0°), which was calculated as the average spike density in the 200 ms across pro-trials in the RS condition. The motor-goal tuning in the RS condition was taken as a reference to be able to differentiate in the S condition between tuning to the pro- and to the anti-goal. Neurons in PMd and PRR in the RS condition (Fig. 5A,B, left column) on average show the typical opposing tuning curves between pro- and anti-trials, reflecting their motor-goal encoding (Fig. 1C). The right columns of Figure 5, A and B, show that the same neurons in the memory period of the S condition are spatially tuned toward the anti-reach direction. We interpret this tuning as a preliminary default movement plan of both monkeys to the anti-goal. It suggests that after the contextual go-cue in the S condition a remapping is indeed required in pro- but not in anti-reaches, consistent with the neural LD data above.
Figure 5.
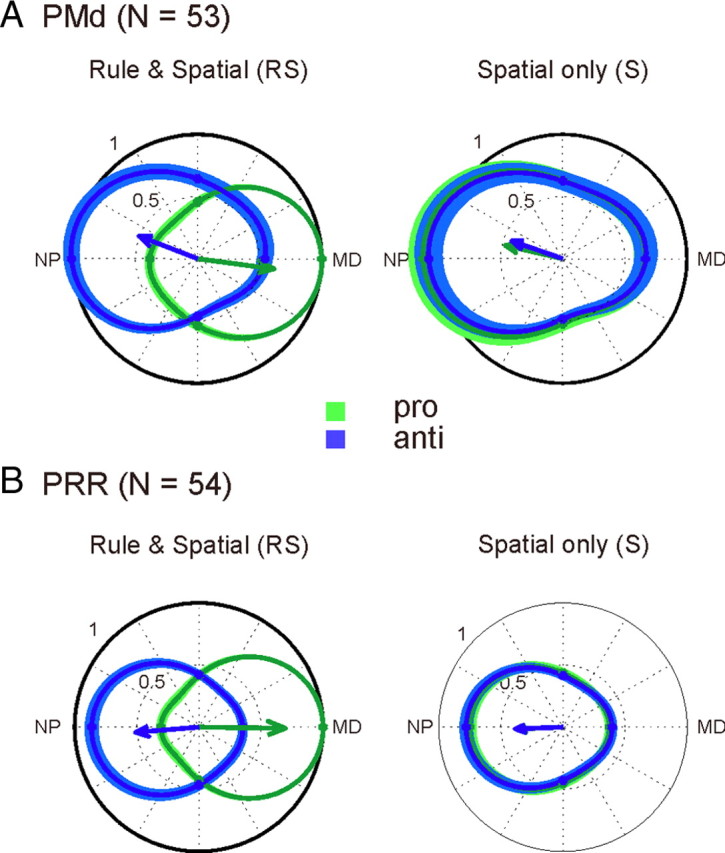
Predominant spatial tuning preference for the anti-goal in the memory period of the S condition. A, B, The normalized population tuning in pro-trials (green) and anti-trials (blue) is shown relative to the preferred spatial cue position in PMd (A) and PRR (B). Tuning curves of each neuron were aligned such that their MD in pro-reaches corresponded to 0° before averaging across neurons. The population tuning in the RS memory periods (left) confirms the typical expected motor-goal tuning in PMd and PRR. The population tuning in the S conditions (right) indicates preference for the anti-goal. Note that the memory period of the S condition precedes the go-cue. Since the transformation rule (pro or anti) could not be known by the monkeys, the tuning curves for pro- and anti-trials are practically identical. Only motor-goal neurons were used for this analysis (see Materials and Methods).
Figure 6, A and B, summarizes the latency results for PMd and PRR in all conditions. There was a significant difference between PMd and PRR motor-related latencies in only those conditions where a spatial remapping was required (RS-anti, N-anti, R-anti, S-pro). There was no LD in conditions without remapping (RS-pro, N-pro, R-pro, S-anti).
Figure 6.

Summary of frontoparietal latencies and split analysis for different neuron populations. A, B, Summary of average absolute latencies (A) and LDs (B) between PRR and PMd for motor-related tuning for pro-trials (left) and anti-trials (right) for all cueing conditions (RS, N, R, S). C, Comparison of remapping conditions with other conditions. LDs between PRR and PMd (PRR − PMd) averaged across all RT conditions with no required remapping (N-pro, R-pro, S-anti) and with required remapping (N-anti, R-anti, S-pro) for either all neurons or separately for motor-goal (MG) and perimovement (PeM) neurons. Asterisks indicate the level of significance (*p < 0.05; **p < 0.01, randomization test). See Results and supplemental material (available at www.jneurosci.org as supplemental material) for the significance of the S-pro condition. Only remapping conditions induce significant frontoparietal LDs. These differences are visible mainly in motor-goal neurons, less so in perimovement neurons. D, Average tuning latencies are smaller in motor-goal compared with perimovement neurons. The bar shows LDs (PeM − MG) across all RT conditions and both cortical areas.
Motor planning versus motor feedback in reaction-time trials
Sensorimotor areas, especially in the posterior parietal cortex, are activated by movement-induced somatosensory or visual feedback (Sakata et al., 1973; Mountcastle et al., 1975; Kalaska et al., 1983; Colby and Duhamel, 1991), not only by sensory cues or motor planning activity. The motor-goal LDs between PMd and PRR in the three RT conditions (N, R, and S) could be confounded by such motor feedback, including corollary discharge signals, if, for example, PRR was more strongly driven by movement-induced feedback signals, whereas PMd was more strongly driven by motor planning signals. To test whether during movement initiation in RT conditions the LDs between PMd and PRR were related to motor planning rather than motor feedback, we split our data set into motor-goal neurons (N_PMd/PRR = 65/75) and a complementary group of perimovement neurons (N_PMd/PRR = 127/183). Motor-goal neurons were characterized by motor-related tuning during the memory period of the RS condition and perimovement neurons by motor-related tuning in the movement period, but not during the memory period (see Materials and Methods). Figure 6C shows the LDs between PRR and PMd averaged across all RT conditions without spatial remapping (N-pro, R-pro, S-anti) and with spatial remapping (N-anti, R-anti, S-pro). The average LDs were computed separately for the population of all neurons, the population of motor-goal neurons, and the population of perimovement neurons. In the conditions without remapping, there were no significant LDs for either group. In the conditions with remapping, there were significant LDs between PMd and PRR for the population of all neurons (23 ms, p = 0.017) and the motor-goal neurons (21 ms, p = 0.03). For the perimovement neurons, there was only a nonsignificant trend (21 ms, p = 0.084), despite the fact that the number of eligible neurons in this category was higher than that for the motor-goal neurons. The absolute latencies for the motor-goal tuning were shorter in the group of motor-goal neurons than the perimovement neurons (average across all three RT conditions and both contexts: Δ = 30 ms; p = 0.00049) (Fig. 6D). This difference in absolute latency confirmed that the splitting of the two groups of neurons according to their tuning properties in the RS condition memory period was meaningful with respect to the differentiation between motor-goal and motor-feedback latencies.
Effects of remapping on motor-goal latencies within PMd and PRR
We also compared motor-goal latencies between pro- and anti-reaches within each cortical area, rather than latencies between cortical areas (Fig. 7). Note that these are the same data as in the above analyses, just rearranged for different statistical comparisons. Pro-goal tuning emerged earlier than anti-goal tuning in PRR whenever the motor-goal decision was immediately preceded by a spatial cue: pro–anti-LDs were significant after the precue in the RS condition (LDA—P = 40 ms, p = 0.0021), after the go-cue in the N condition (LDA—P = 54 ms, p = 0), and after the go-cue in the R condition (LDA—P = 71 ms, p = 0). There was no pro–anti-LD in response to the go-cue in the S condition (p = 0.32). In PMd, we found faster representation of pro-goals compared with anti-goals only in response to the go-cue in the R condition (LDP—A = 56 ms, p < 10−4). In PMd, none of the other conditions showed a significant difference between pro- and anti-goals (RS: p = 0.27; N: p = 0.054; S: p = 0.42). Note that for the S condition in either area the LD analysis between pro- and anti-trials is confounded by the default anti-tuning in the preceding memory period, which makes interpretation in this case difficult.
Figure 7.

Comparison of motor-tuning latencies between pro- and anti-trials. A–D, Recruitment curves for all four cueing conditions in pro-trials (green) and anti-trials (blue), separately for PMd (left) and PRR (right). Other conventions are as in Figures 2 and 3. Note that the data are the same as in Figures 2 and 3, but are grouped differently to emphasize and quantify the differences between pro- and anti-trials rather than PMd and PRR. E, Summary of LDs between pro- and anti-trials (anti − pro). Brackets for the S condition indicate that the conclusiveness of LDs is questionable because of the different baseline levels in this condition.
Motor-goal latencies and behavioral reaction times
If motor-goal latencies in PMd and PRR reflect decisions on arm movements, a correlation between motor-goal latencies and RTs should be expected. Figure 8A shows the median RTs in pro-reaches (light gray) and anti-reaches (dark gray) for the different cueing conditions averaged across all recording sessions (N = 176). The RTs for pro-reaches were 240 ± 2 ms (RS), 227 ± 2 ms (N), 221 ± 2 ms (R), and 240 ± 2 ms (S). The RTs in anti-reaches were 246 ± 2 (RS), 242 ± 2 ms (N), 245 ± 2 ms (R), and 244 ± 2 ms (S). The RT differences between pro- and anti-reaches were significant in each cueing condition (RS: 6 ± 1 ms, p < 10−6; N: 15 ± 1 ms, p < 10−6; R: 24 ± 1 ms, p < 10−6; S: 4 ± 1 ms; p = 4.6 10−5; data not shown). The RT differences between pro- and anti-reaches in the RS condition cannot be explained by motor-goal latencies, since motor-goal tuning in these conditions was already present during the memory period. To compensate for RT differences between pro- and anti-trials for the nonspecific effects of SR congruency observed in the RS condition, we also computed RT differences that were corrected for this nonspecific effect by subtracting the RT difference in the RS condition from the original RT differences (Fig. 8B). The corrected RT differences were 9 ± 1 ms (N condition, p < 10−6), 18 ± 1 ms (R, p < 10−6), and −2 ± 1 ms (S, p = 0.015).
Figure 8.

Correlation between neuronal latencies and behavioral reaction times. A, Average RTs in pro- (light) and anti-trials (dark) in the four different cueing conditions. B, RT differences between anti- and pro-reaches corrected for the nonspecific difference in the RS condition (see Results). C, Regression analysis. Regression lines between neuronal latencies and RTs for each motor-goal neuron in PRR when aligned to the go-cue onset (top left). The equivalent regression data are shown (top right) between the “lead time” of neural tuning (= time of tuning onset before movement onset) and negative RTs (= time of cue onset before movement onset). Shaded areas indicate neuronal tuning latencies larger than RT (upper shaded areas in upper left and upper right) or neuronal tuning before cue onset (lower right shaded area in upper right). The slopes close to the unity line (upper left) and close to zero (upper right) indicate correlations of the neural latency with the movement onset, rather than with the cue onset. The boxplots in the lower panel shows the statistical analysis of the slope distributions for cue-onset alignment (CUE) and movement alignment (MOV) in both areas separately for motor-goal and perimovement neurons. In both groups of neurons, neural latencies in PRR but not PMd were correlated with behavioral response latencies.
We tested whether the neuronal motor-goal latencies better correlated with the time of the cue presentation or with the behavioral response onset (reaction time). The top left panel of Figure 8C shows as an example the slopes of the linear regression between single-trial RTs and neuronal onset latencies (relative to cue presentation; see Materials and Methods) for the motor-goal neurons in PRR. In a complementary manner, the slopes of the regression between (negative) single-trial RTs and neuronal lead times (onset of neuronal response relative to movement onset) were also analyzed (Fig. 8C, top right). Note that these two ways of quantifying the relationship between neural latencies and behavioral responses are not mutually independent, but help to illustrate the results. For the regression analysis, we only included trials of the RT conditions (N, R, and S) from neurons that did not show cue responses (see Materials and Methods). A slope close to 1 in the comparison between RTs and neuronal onset latencies (top left) indicates that the onset of activity in PRR motor-goal neurons was correlated to the movement onset. A slope close to 1 in the comparison between RTs and neuronal lead times (top right) would have indicated that the onset of activity was related to the cue onset. Overlap of the regression lines with the upper gray-shaded area indicates neural latencies larger than the RT, which only occurred in a small fraction of the motor-goal neurons. The pattern of slopes showed better correlation of the neural latencies with the movement onset compared with the cue onset for PRR motor-goal neurons, and also for perimovement neurons (Fig. 8C, bottom right). For motor-goal neurons in PRR, the median slope for relatedness to RT was 0.76, and for relatedness to cue onset 0.14 (p = 0.00026, rank sum test). For perimovement neurons in PRR, the median slope for RT was 0.62, and for cue onset 0.20 (p < 10−5, rank sum test). In PMd, we could not find a significant bias in either neural population. For motor-goal neurons in PMd, the median slope for RT was 0.60, and for cue onset 0.25 (p > 0.05). For perimovement neurons, the median slope for RT was 0.47 and for cue onset 0.39 (p > 0.05). The distribution of slopes for both neural populations was unimodal and did not suggest that the moderate correlation with either cue onset or RT is the result of an averaging effect across an inhomogeneous distribution of neurons (data not shown). In summary, in PRR neural motor-goal latencies were best correlated with the time of the behavioral response; in PMd, there was no bias, which would indicate stronger correlation of the neuronal latencies with either the cue onset or the reaction time.
Statistical controls
Latency measures depend on methodological procedures. For example, any statistical significance level (here, α = 5%) for motor-related tuning (significant spatial tuning in pro- and anti-reaches with opposite tuning vectors) marks an arbitrary threshold criterion. To avoid confounds caused by potential differences of the effect size in PMd and PRR, we performed our analysis using different threshold criteria for spatial tuning (supplemental Fig. S1, available at www.jneurosci.org as supplemental material). Also, we balanced the number of neurons between PMd and PRR by random subsampling (supplemental Fig. S2, available at www.jneurosci.org as supplemental material). Finally, we used alternative latency measures based on cumulative sums, as were used in previous studies from other groups (supplemental Fig. S3, available at www.jneurosci.org as supplemental material). None of the control measurements or alternative methods led to conclusions different from those presented in the main text.
Discussion
We compared motor-goal latencies in PMd and PRR during a nonstandard visuomotor association task. Neurons in PMd were tuned earlier for the pending motor goal than neurons in PRR, whenever the task required spatial visuomotor remapping. Frontoparietal LDs existed for motor goals during movement planning, independent of movement execution. We interpret our findings in support of the hypothesis that spatial reorganization of network activity in PRR causes frontoparietal LDs. We suggest that the initiation of the remapping process in PRR is contingent on frontoparietal projections from PMd.
Shorter motor-goal latencies in PMd than PRR in remapping conditions
We expected the relative timing of motor-goal decision processes between reach planning areas to change with precueing, as speculated previously (Kalaska and Crammond, 1992; Cisek, 2006; 2007). Against our expectation, PMd–PRR latency differences depended on the required visuospatial mapping instead. Variation of the precue did not change this basic dependency. Our results showed earlier motor-goal tuning in PMd than PRR whenever the reach goal had to be spatially remapped from the position of the preceding incongruent spatial cue (anti-trials in RS, N, and R conditions) or the incongruent preliminary movement plan (pro-trials in S condition).
Different reasons could account for the dependency of frontoparietal LDs on spatial remapping. It was previously suggested that frontoparietal interactions and corresponding LDs are the consequences of a decision-making process (Pesaran et al., 2008). In line with this view, one could emphasize the inherent difference in cognitive strategy required to perform either a pro-reach or an anti-reach task. To be consistent with our data, we would have to assume that all conditions that include a remapping require an active decision, whereas conditions without remapping do not. The function of such a decision could be the active updating of the preliminary motor goal, which was induced by the spatial cue or preliminary movement planning.
Alternatively, PRR motor-goal representations could depend on frontoparietal projections from PMd in any case, while becoming visible as interareal LDs only under specific circumstances. LDs of several tens of milliseconds, as seen here and also in previous studies (Riehle, 1991; Kalaska and Crammond, 1992; Johnson et al., 1996; Pesaran et al., 2008), seem rather long to be attributable to transmission delays between the monosynaptically connected areas PMd and PRR (Pandya and Kuypers, 1969; Jones and Powell, 1970; Kurata, 1991; Johnson et al., 1996; Caminiti et al., 1999; Marconi et al., 2001; Tanné-Gariépy et al., 2002; Battaglia-Mayer et al., 2003). Instead, we prefer to attribute the observed large frontoparietal LDs to the dynamic reorganization of network activity, which is required in visuospatially organized areas like PRR in the case of spatial remapping. According to this view, the dynamic reorganization is only started in PRR, once the motor goal has been selected in PMd. The dependency of PRR on PMd output would only become detectable as a frontoparietal LD in cases of spatially incongruent mapping, when an isolated spatial motor-goal representation is not directly induced by the spatial cue, but has to build up first. We predict that tasks with nonspatial symbolic cueing could also induce frontoparietal LDs, similar to tasks with a spatially balanced distribution of cues (visual search task, Pesaran et al., 2008). What is common to all three tasks is the need for the buildup of a spatial goal representation in PRR that is not induced directly by a spatial cue. Spatially congruent mapping conditions, on the other hand, do not require dynamic remapping or buildup. The seamless and immediate transition from cue- to motor-goal-related tuning, even if its “initiation” in PRR might depend on PMd output, would render frontoparietal LDs invisible in this case.
The latter interpretation fits our and previous data, and explains long frontoparietal motor-goal LDs independently of interareal transmission delays. It is parsimonious since it requires neither an assumption that PMd-to-PRR projections become active only during decision tasks nor that remapping trials involve a decision process, whereas other trials do not. Note that we cannot exclude the alternative, but similar, possibility that both areas, PMd and PRR, receive a motor-goal decision signal from an independent third area, and that PRR in the case of remapping needs longer than PMd to converge onto a new dynamic state to represent the spatial motor goal.
Latency differences between PMd and PRR for motor planning activity
Previous physiological studies suggested that frontoparietal LDs between reach-related areas in premotor and parietal cortices exist for perimovement activity immediately preceding or accompanying motor execution (Bioulac and Lamarre, 1979; Georgopoulos et al., 1982; Kalaska et al., 1983; Riehle and Requin, 1989; Riehle, 1991; Johnson et al., 1996), in line with a previously stated corollary discharge hypothesis (Mountcastle et al., 1975; Bioulac and Lamarre, 1979; Kalaska et al., 1983; Seal and Commenges, 1985; Johnson et al., 1996). A previous study (Pesaran et al., 2008) showed that latency differences between PMd and PRR also exist for motor-goal representations during movement planning, i.e., independent of movement execution, whereas another study did not show such differences (Johnson et al., 1996). The fact that frontoparietal LDs depend on the type of task rather than the movement execution can explain these different results. We found shorter latencies in PMd than PRR for motor-goal activity in response to a preparatory stimulus (RS condition) and in response to a go-instruction (N, R, and S conditions). Even in the RT conditions, we could attribute the frontoparietal LDs to differences in the latencies of motor-goal signals, rather than motor feedback signals. Our findings contradict a corollary discharge hypothesis in its strict sense (see alternative suggestion below), in which PMd–PRR latency differences would be the consequence of a frontoparietal efference copy signal, i.e., would be dependent on explicit motor commands (Kalaska et al., 1983; Johnson et al., 1996).
Motor-goal latencies in relation to behavioral reaction times
To discuss the neural dynamics of sensorimotor integration in the context of behavioral performance, it is important to distinguish between general neural response onset latencies (Kalaska et al., 1983; Riehle, 1991; Kalaska and Crammond, 1992; Johnson et al., 1996; Pesaran et al., 2008) and latencies of neural activities that are more specifically related to the cue, the motor-goal decision, or motor execution.
First, with the anti-reach task design we separated cue- from motor-related tuning (Crammond and Kalaska, 1994; Zhang et al., 1997; Gail and Andersen, 2006). Neurons in PMd (Crammond and Kalaska, 1994) and PRR (Gail and Andersen, 2006) can dynamically switch from cue- to motor-related encoding, whereas others are motor related as soon as they become active. Population analysis of neural onset latencies including all neurons would lead to confounded motor latencies. Especially, frontoparietal LDs could be obscured because of the simultaneity of the fastest responding neurons (Johnson et al., 1996), which respond to the cue. We avoided this confound by analyzing neurons without cue-related responses.
Second, using different partial precueing conditions (Lecas et al., 1986; Riehle and Requin, 1989; Riehle, 1991; Hoshi and Tanji, 2000; Nakayama et al., 2008), we additionally separated motor-goal latencies related to motor planning (Riehle, 1991; Johnson et al., 1996) from latencies of perimovement activity related to motor-execution (Riehle and Requin, 1989; Crammond and Kalaska, 2000). Perimovement activities could comprise movement-induced corollary discharge, somatosensory, or visual signals, especially in parietal areas (Sakata et al., 1973; Mountcastle et al., 1975; Kalaska et al., 1983; Colby and Duhamel, 1991; Nakayama et al., 2008). Average response latencies from mixed motor-goal and perimovement activity (Kalaska et al., 1983; Riehle and Requin, 1989; Johnson et al., 1996; Pesaran et al., 2008) would overestimate motor-goal latencies in areas with strong motor-feedback signals. We avoided this confound by differentiating motor-goal from perimovement neurons.
The trial-by-trial motor-goal latencies in PRR were better correlated with manual RTs than those of PMd. This could mean that manual responses are triggered only once the motor-goal decision (which becomes visible in PMd before PRR) leads to the required (and slower) evolution of the proper motor-goal representations in PRR.
Frontoparietal projections for prospective forward model estimates?
Parietal cortex function is important for proper online correction of movements (Desmurget et al., 1999) and is suspected to use forward model predictions for this purpose (Wolpert et al., 1998; Desmurget et al., 1999; Mulliken et al., 2008; Shadmehr and Krakauer, 2008). We suggest that such a forward estimate is generated not only during movements, but prospectively, before a motor command is issued, as an integral part of the planning process. In visuomotor tasks, movement planning then would equal the process of analyzing the difference between the current sensory state and the prospective sensory state, which is predicted to result from the currently imagined movement in the future, once it is executed (Salinas, 2004; Shadmehr and Wise, 2005). This view is consistent with our data and previous studies, which showed activation of PPC during motor imagery (Decety et al., 1994; Stephan et al., 1995; Sirigu et al., 1996; Gerardin et al., 2000; Naito et al., 2002), and the fact that parietal electrical stimulation can trigger subjective movement intentions without actual movements being performed (Desmurget et al., 2009).
Footnotes
This work was supported by German Federal Ministry for Education and Research (Bundesministerium für Bildung und Forschung) Grants 01GQ0433 and 01GQ0814. We thank Sina Plümer and Ludwig Ehrenreich for their help in data collection.
References
- Battaglia-Mayer A, Caminiti R, Lacquaniti F, Zago M. Multiple levels of representation of reaching in the parieto-frontal network. Cereb Cortex. 2003;13:1009–1022. doi: 10.1093/cercor/13.10.1009. [DOI] [PubMed] [Google Scholar]
- Bioulac B, Lamarre Y. Activity of postcentral cortical neurons of the monkey during conditioned movements of a deafferented limb. Brain Res. 1979;172:427–437. doi: 10.1016/0006-8993(79)90576-6. [DOI] [PubMed] [Google Scholar]
- Boussaoud D, Wise SP. Primate frontal-cortex—effects of stimulus and movement. Exp Brain Res. 1993;95:28–40. doi: 10.1007/BF00229651. [DOI] [PubMed] [Google Scholar]
- Brozović M, Gail A, Andersen RA. Gain mechanisms for contextually guided visuomotor transformations. J Neurosci. 2007;27:10588–10596. doi: 10.1523/JNEUROSCI.2685-07.2007. [DOI] [PMC free article] [PubMed] [Google Scholar]
- Buneo CA, Andersen RA. The posterior parietal cortex: sensorimotor interface for the planning and online control of visually guided movements. Neuropsychologia. 2006;44:2594–2606. doi: 10.1016/j.neuropsychologia.2005.10.011. [DOI] [PubMed] [Google Scholar]
- Caminiti R, Genovesio A, Marconi B, Mayer AB, Onorati P, Ferraina S, Mitsuda T, Giannetti S, Squatrito S, Maioli MG, Molinari M. Early coding of reaching: frontal and parietal association connections of parieto-occipital cortex. Eur J Neurosci. 1999;11:3339–3345. doi: 10.1046/j.1460-9568.1999.00801.x. [DOI] [PubMed] [Google Scholar]
- Cisek P. Integrated neural processes for defining potential actions and deciding between them: a computational model. J Neurosci. 2006;26:9761–9770. doi: 10.1523/JNEUROSCI.5605-05.2006. [DOI] [PMC free article] [PubMed] [Google Scholar]
- Cisek P. Cortical mechanisms of action selection: the affordance competition hypothesis. Philos Trans R Soc Lond B Biol Sci. 2007;362:1585–1599. doi: 10.1098/rstb.2007.2054. [DOI] [PMC free article] [PubMed] [Google Scholar]
- Colby CL, Duhamel JR. Heterogeneity of extrastriate visual areas and multiple parietal areas in the macaque monkey. Neuropsychologia. 1991;29:517–537. doi: 10.1016/0028-3932(91)90008-v. [DOI] [PubMed] [Google Scholar]
- Crammond DJ, Kalaska JF. Modulation of preparatory neuronal activity in dorsal premotor cortex due to stimulus-response compatibility. J Neurophysiol. 1994;71:1281–1284. doi: 10.1152/jn.1994.71.3.1281. [DOI] [PubMed] [Google Scholar]
- Crammond DJ, Kalaska JF. Prior information in motor and premotor cortex: activity during the delay period and effect on pre-movement activity. J Neurophysiol. 2000;84:986–1005. doi: 10.1152/jn.2000.84.2.986. [DOI] [PubMed] [Google Scholar]
- Decety J, Perani D, Jeannerod M, Bettinardi V, Tadary B, Woods R, Mazziotta JC, Fazio F. Mapping motor representations with positron emission tomography. Nature. 1994;371:600–602. doi: 10.1038/371600a0. [DOI] [PubMed] [Google Scholar]
- Desmurget M, Epstein CM, Turner RS, Prablanc C, Alexander GE, Grafton ST. Role of the posterior parietal cortex in updating reaching movements to a visual target. Nat Neurosci. 1999;2:563–567. doi: 10.1038/9219. [DOI] [PubMed] [Google Scholar]
- Desmurget M, Reilly KT, Richard N, Szathmari A, Mottolese C, Sirigu A. Movement intention after parietal cortex stimulation in humans. Science. 2009;324:811–813. doi: 10.1126/science.1169896. [DOI] [PubMed] [Google Scholar]
- di Pellegrino G, Wise SP. Visuospatial versus visuomotor activity in the premotor and prefrontal cortex of a primate. J Neurosci. 1993;13:1227–1243. doi: 10.1523/JNEUROSCI.13-03-01227.1993. [DOI] [PMC free article] [PubMed] [Google Scholar]
- Eliassen JC, Souza T, Sanes JN. Experience-dependent activation patterns in human brain during visual-motor associative learning. J Neurosci. 2003;23:10540–10547. doi: 10.1523/JNEUROSCI.23-33-10540.2003. [DOI] [PMC free article] [PubMed] [Google Scholar]
- Gail A, Andersen RA. Neural dynamics in monkey parietal reach region reflect context-specific sensorimotor transformations. J Neurosci. 2006;26:9376–9384. doi: 10.1523/JNEUROSCI.1570-06.2006. [DOI] [PMC free article] [PubMed] [Google Scholar]
- Gail A, Klaes C, Westendorff S. Implementation of spatial transformation rules for goal-directed reaching via gain modulation in monkey parietal and premotor cortex. J Neurosci. 2009;29:9490–9499. doi: 10.1523/JNEUROSCI.1095-09.2009. [DOI] [PMC free article] [PubMed] [Google Scholar]
- Georgopoulos AP, Kalaska JF, Caminiti R, Massey JT. On the relations between the direction of two-dimensional arm movements and cell discharge in primate motor cortex. J Neurosci. 1982;2:1527–1537. doi: 10.1523/JNEUROSCI.02-11-01527.1982. [DOI] [PMC free article] [PubMed] [Google Scholar]
- Gerardin E, Sirigu A, Lehéricy S, Poline JB, Gaymard B, Marsault C, Agid Y, Le Bihan D. Partially overlapping neural networks for real and imagined hand movements. Cereb Cortex. 2000;10:1093–1104. doi: 10.1093/cercor/10.11.1093. [DOI] [PubMed] [Google Scholar]
- Hoshi E, Tanji J. Integration of target and body-part information in the premotor cortex when planning action. Nature. 2000;408:466–470. doi: 10.1038/35044075. [DOI] [PubMed] [Google Scholar]
- Johnson PB, Ferraina S, Bianchi L, Caminiti R. Cortical networks for visual reaching: physiological and anatomical organization of frontal and parietal lobe arm regions. Cereb Cortex. 1996;6:102–119. doi: 10.1093/cercor/6.2.102. [DOI] [PubMed] [Google Scholar]
- Jones EG, Powell TP. An anatomical study of converging sensory pathways within the cerebral cortex of the monkey. Brain. 1970;93:793–820. doi: 10.1093/brain/93.4.793. [DOI] [PubMed] [Google Scholar]
- Kalaska JF. Parietal cortex area 5 and visuomotor behavior. Can J Physiol Pharmacol. 1996;74:483–498. [PubMed] [Google Scholar]
- Kalaska JF, Crammond DJ. Cerebral cortical mechanisms of reaching movements. Science. 1992;255:1517–1523. doi: 10.1126/science.1549781. [DOI] [PubMed] [Google Scholar]
- Kalaska JF, Caminiti R, Georgopoulos AP. Cortical mechanisms related to the direction of two-dimensional arm movements—relations in parietal area 5 and comparison with motor cortex. Exp Brain Res. 1983;51:247–260. doi: 10.1007/BF00237200. [DOI] [PubMed] [Google Scholar]
- Kalaska JF, Scott SH, Cisek P, Sergio LE. Cortical control of reaching movements. Curr Opin Neurobiol. 1997;7:849–859. doi: 10.1016/s0959-4388(97)80146-8. [DOI] [PubMed] [Google Scholar]
- Kurata K. Corticocortical inputs to the dorsal and ventral aspects of the premotor cortex of macaque monkeys. Neurosci Res. 1991;12:263–280. doi: 10.1016/0168-0102(91)90116-g. [DOI] [PubMed] [Google Scholar]
- Lecas JC, Requin J, Anger C, Vitton N. Changes in neuronal activity of the monkey precentral cortex during preparation for movement. J Neurophysiol. 1986;56:1680–1702. doi: 10.1152/jn.1986.56.6.1680. [DOI] [PubMed] [Google Scholar]
- Marconi B, Genovesio A, Battaglia-Mayer A, Ferraina S, Squatrito S, Molinari M, Lacquaniti F, Caminiti R. Eye-hand coordination during reaching. I. Anatomical relationships between parietal and frontal cortex. Cereb Cortex. 2001;11:513–527. doi: 10.1093/cercor/11.6.513. [DOI] [PubMed] [Google Scholar]
- Mitz AR, Godschalk M, Wise SP. Learning-dependent neuronal activity in the premotor cortex: activity during the acquisition of conditional motor associations. J Neurosci. 1991;11:1855–1872. doi: 10.1523/JNEUROSCI.11-06-01855.1991. [DOI] [PMC free article] [PubMed] [Google Scholar]
- Monosov IE, Trageser JC, Thompson KG. Measurements of simultaneously recorded spiking activity and local field potentials suggest that spatial selection emerges in the frontal eye field. Neuron. 2008;57:614–625. doi: 10.1016/j.neuron.2007.12.030. [DOI] [PMC free article] [PubMed] [Google Scholar]
- Mountcastle VB, Lynch JC, Georgopoulos A, Sakata H, Acuna C. Posterior parietal association cortex of the monkey: command functions for operations within extrapersonal space. J Neurophysiol. 1975;38:871–908. doi: 10.1152/jn.1975.38.4.871. [DOI] [PubMed] [Google Scholar]
- Mulliken GH, Musallam S, Andersen RA. Decoding trajectories from posterior parietal cortex ensembles. J Neurosci. 2008;28:12913–12926. doi: 10.1523/JNEUROSCI.1463-08.2008. [DOI] [PMC free article] [PubMed] [Google Scholar]
- Naito E, Kochiyama T, Kitada R, Nakamura S, Matsumura M, Yonekura Y, Sadato N. Internally simulated movement sensations during motor imagery activate cortical motor areas and the cerebellum. J Neurosci. 2002;22:3683–3691. doi: 10.1523/JNEUROSCI.22-09-03683.2002. [DOI] [PMC free article] [PubMed] [Google Scholar]
- Nakayama Y, Yamagata T, Tanji J, Hoshi E. Transformation of a virtual action plan into a motor plan in the premotor cortex. J Neurosci. 2008;28:10287–10297. doi: 10.1523/JNEUROSCI.2372-08.2008. [DOI] [PMC free article] [PubMed] [Google Scholar]
- Pandya DN, Kuypers HG. Cortico-cortical connections in the rhesus monkey. Brain Res. 1969;13:13–36. doi: 10.1016/0006-8993(69)90141-3. [DOI] [PubMed] [Google Scholar]
- Passingham RE, Toni I, Rushworth MF. Specialisation within the prefrontal cortex: the ventral prefrontal cortex and associative learning. Exp Brain Res. 2000;133:103–113. doi: 10.1007/s002210000405. [DOI] [PubMed] [Google Scholar]
- Pesaran B, Nelson MJ, Andersen RA. Free choice activates a decision circuit between frontal and parietal cortex. Nature. 2008;453:406–409. doi: 10.1038/nature06849. [DOI] [PMC free article] [PubMed] [Google Scholar]
- Riehle A. Visually induced signal-locked neuronal activity changes in precentral motor areas of the monkey: hierarchical progression of signal processing. Brain Res. 1991;540:131–137. doi: 10.1016/0006-8993(91)90499-l. [DOI] [PubMed] [Google Scholar]
- Riehle A, Requin J. Monkey primary motor and premotor cortex: single-cell activity related to prior information about direction and extent of an intended movement. J Neurophysiol. 1989;61:534–549. doi: 10.1152/jn.1989.61.3.534. [DOI] [PubMed] [Google Scholar]
- Sakata H, Takaoka Y, Kawarasaki A, Shibutani H. Somatosensory properties of neurons in the superior parietal cortex (area 5) of the rhesus monkey. Brain Res. 1973;64:85–102. doi: 10.1016/0006-8993(73)90172-8. [DOI] [PubMed] [Google Scholar]
- Salinas E. Fast remapping of sensory stimuli onto motor actions on the basis of contextual modulation. J Neurosci. 2004;24:1113–1118. doi: 10.1523/JNEUROSCI.4569-03.2004. [DOI] [PMC free article] [PubMed] [Google Scholar]
- Seal J, Commenges D. A quantitative analysis of stimulus- and movement-related responses in the posterior parietal cortex of the monkey. Exp Brain Res. 1985;58:144–153. doi: 10.1007/BF00238962. [DOI] [PubMed] [Google Scholar]
- Shadmehr R, Krakauer JW. A computational neuroanatomy for motor control. Exp Brain Res. 2008;185:359–381. doi: 10.1007/s00221-008-1280-5. [DOI] [PMC free article] [PubMed] [Google Scholar]
- Shadmehr R, Wise SP. Cambridge, MA: MIT; 2005. The computational neurobiology of reaching and pointing: a foundation for motor learning. [Google Scholar]
- Sirigu A, Duhamel JR, Cohen L, Pillon B, Dubois B, Agid Y. The mental representation of hand movements after parietal cortex damage. Science. 1996;273:1564–1568. doi: 10.1126/science.273.5281.1564. [DOI] [PubMed] [Google Scholar]
- Stephan KM, Fink GR, Passingham RE, Silbersweig D, Ceballos-Baumann AO, Frith CD, Frackowiak RS. Functional anatomy of the mental representation of upper extremity movements in healthy subjects. J Neurophysiol. 1995;73:373–386. doi: 10.1152/jn.1995.73.1.373. [DOI] [PubMed] [Google Scholar]
- Stoet G, Snyder LH. Single neurons in posterior parietal cortex of monkeys encode cognitive set. Neuron. 2004;42:1003–1012. doi: 10.1016/j.neuron.2004.06.003. [DOI] [PubMed] [Google Scholar]
- Tanné-Gariépy J, Rouiller EM, Boussaoud D. Parietal inputs to dorsal versus ventral premotor areas in the macaque monkey: evidence for largely segregated visuomotor pathways. Exp Brain Res. 2002;145:91–103. doi: 10.1007/s00221-002-1078-9. [DOI] [PubMed] [Google Scholar]
- Thompson KG, Hanes DP, Bichot NP, Schall JD. Perceptual and motor processing stages identified in the activity of macaque frontal eye field neurons during visual search. J Neurophysiol. 1996;76:4040–4055. doi: 10.1152/jn.1996.76.6.4040. [DOI] [PubMed] [Google Scholar]
- Wallis JD, Miller EK. from rule to response: neuronal processes in the premotor and prefrontal cortex. J Neurophysiol. 2003;90:1790–1806. doi: 10.1152/jn.00086.2003. [DOI] [PubMed] [Google Scholar]
- Wise SP, di Pellegrino G, Boussaoud D. The premotor cortex and nonstandard sensorimotor mapping. Can J Physiol Pharmacol. 1996;74:469–482. doi: 10.1139/cjpp-74-4-469. [DOI] [PubMed] [Google Scholar]
- Wise SP, Boussaoud D, Johnson PB, Caminiti R. Premotor and parietal cortex: corticocortical connectivity and combinatorial computations. Annu Rev Neurosci. 1997;20:25–42. doi: 10.1146/annurev.neuro.20.1.25. [DOI] [PubMed] [Google Scholar]
- Wolpert DM, Goodbody SJ, Husain M. Maintaining internal representations: the role of the human superior parietal lobe. Nat Neurosci. 1998;1:529–533. doi: 10.1038/2245. [DOI] [PubMed] [Google Scholar]
- Zhang J, Riehle A, Requin J, Kornblum S. Dynamics of single neuron activity in monkey primary motor cortex related to sensorimotor transformation. J Neurosci. 1997;17:2227–2246. doi: 10.1523/JNEUROSCI.17-06-02227.1997. [DOI] [PMC free article] [PubMed] [Google Scholar]