

Abstract
In the developing nervous system, constitutive activation of the AKT/mTOR (mammalian target of rapamycin) pathway in myelinating glial cells is associated with hypermyelination of the brain, but is reportedly insufficient to drive myelination by Schwann cells. We have hypothesized that it requires additional mechanisms downstream of NRG1/ErbB signaling to trigger myelination in the peripheral nervous system. Here, we demonstrate that elevated levels of phosphatidylinositol 3,4,5-trisphosphate (PIP3) have developmental effects on both oligodendrocytes and Schwann cells. By generating conditional mouse mutants, we found that Pten-deficient Schwann cells are enhanced in number and can sort and myelinate axons with calibers well below 1 μm. Unexpectedly, mutant glial cells also spirally enwrap C-fiber axons within Remak bundles and even collagen fibrils, which lack any membrane surface. Importantly, PIP3-dependent hypermyelination of central axons, which is observed when targeting Pten in oligodendrocytes, can also be induced after tamoxifen-mediated Cre recombination in adult mice. We conclude that it requires distinct PIP3 effector mechanisms to trigger axonal wrapping. That myelin synthesis is not restricted to early development but can occur later in life is relevant to developmental disorders and myelin disease.
Introduction
In the vertebrate nervous system, the term “myelin” denotes the spiral membrane ensheathment of axons by oligodendrocytes or Schwann cells. The failure to achieve normal myelination causes severe neurological diseases, including leukodystrophies and peripheral neuropathies (Suter and Scherer, 2003; Boespflug-Tanguy et al., 2008). Understanding the signals that regulate the behavior of glial cells is therefore important to develop therapies aimed at improving myelination or stimulating myelin repair in acquired myelin diseases, such as multiple sclerosis.
In the PNS, neuregulin-1 type III (NRG1/III) is an axonal growth factor that activates ErbB receptor tyrosine kinases on glial cells, and is required for Schwann cell survival, differentiation, and myelination (Michailov et al., 2004; Jessen and Mirsky, 2005; Taveggia et al., 2005; Nave and Salzer, 2006). Unexpectedly, in the CNS, the corresponding signals that induce myelin formation appear to be very different. Specifically, axonal NRG1 and oligodendroglial ErbB receptors are not required for CNS myelination (Brinkmann et al., 2008).
Despite the striking differences of axon–glia signaling at the ligand/receptor level, essential downstream mechanisms appear preserved in the evolution of myelinating glia in PNS and CNS. Experiments in vitro had suggested an important regulatory function for phosphoinositide 3-kinase (PI3K), the enzyme converting phosphatidylinositol 4,5-bisphosphate (PIP2) into the signaling lipid phosphatidylinositol 3,4,5-trisphosphate (PIP3) in myelination by Schwann cells (Maurel and Salzer, 2000; Ogata et al., 2004). Here, as a nodal point of axon–glia signaling, PI3K was suggested to promote myelination by coupling to multiple receptor systems, including ErbB2/ErbB3 heterodimers or the IGFR [insulin-like growth factor 1 (IGF-1) receptor] (Taveggia et al., 2005; Liang et al., 2007).
In line with the hypothesized preservation of second messenger systems, downstream effectors of PI3K signaling such as AKT and mammalian target of rapamycin (mTOR) promote oligodendrocyte survival, differentiation, and myelin growth (Flores et al., 2000; Barros et al., 2009; Tyler et al., 2009). However, transgenic overexpression of a constitutively active isoform of AKT in both oligodendrocytes and Schwann cells caused mTOR-dependent hypermyelination only in CNS, but not in PNS (Flores et al., 2008; Narayanan et al., 2009). Considering the importance of PI3K activity in various polarization events (i.e., neuronal polarization) (Ménager et al., 2004) and the highly polarized structure of a myelin sheath (Salzer, 2003; Maier et al., 2008), PIP3 might therefore, in addition to recruiting AKT, have additional downstream effects equally important for glial process outgrowth and myelination.
PIP3 is antagonized by the lipid phosphatase phosphatase and tensin homolog (PTEN), which dephosphorylates PIP3 to PIP2 and has important regulatory functions in growth, proliferation, migration, differentiation, and survival of cells, also in the nervous system (van Diepen and Eickholt, 2008). Here, we demonstrate that myelinating glial cells lacking PTEN are hyperstimulated by elevated PIP3 levels, which is sufficient to trigger membrane wrapping and hypermyelination in CNS and PNS. Hypermyelination is also observed when recombination of the Pten gene is pharmacologically induced in mature oligodendrocytes. We conclude that it requires multiple signaling pathways converging downstream of PIP3 to trigger axon wrapping by Schwann cells and that the potential of mature glial cells to assemble myelin is not developmentally restricted.
Materials and Methods
Mouse mutants.
All animal experiments were performed in compliance with approved animal policies of the Max Planck Institute of Experimental Medicine. Pten flox mice, Plp1-CreERT2 mice, and R26R-YFP reporter mice were genotyped as described previously (Soriano, 1999; Lesche et al., 2002; Leone et al., 2003), and Cnp1-Cre mice were genotyped with the following primers: Cnp-E3s, 5′-GCC TTC AAA CTG TCC ATC TC-3′; Cnp-E3as, 5′-CCC AGC CCT TTT ATT ACC AC-3′; and puro3, 5′-CAT AGC CTG AAG AAC GAG A-3′. Pten wt, Pten flox, and Pten del alleles were identified as described previously (Lesche et al., 2002). Genomic DNA for PCR analysis was isolated from tail biopsies and sciatic nerves using Invisorb Spin Tissue Mini Kit (Invitek) according to the manufacturer's directions.
Rapamycin and tamoxifen treatments.
Rapamycin (LC Laboratories) was dissolved in vehicle solution containing 5% polyethylene glycol 400, 5% Tween 80, and 4% ethyl alcohol. Rapamycin or vehicle was administered by intraperitoneal injections at 5 mg/kg for 5 d a week from postnatal day 48 (P48) to P98. Tamoxifen (TM) (Sigma-Aldrich) was dissolved in sunflower oil/ethanol (10:1) to a final concentration of 10 mg/ml. Two-month-old mice received intraperitoneal injections at 100 μg of TM per gram of mouse weight once a day for 10 consecutive days. As carrier control, sunflower oil/ethanol (10:1) was injected.
Magnetic resonance imaging.
For magnetic resonance imaging (MRI), the mice were initially anesthetized in a chamber with 5% isoflurane, and subsequently intubated and kept under anesthesia with 1–1.5% isoflurane in O2 and ambient air (1:1.5). T1-weighted images [three-dimensional fast low-angle shot, repetition time (TR)/echo time (TE), 17/7.6 ms; flip angle, 25°] and T2-weighted images (three-dimensional fast spin echo, TR/TE, 3000/61 ms; 8 echoes; inter-echo spacing, 14.4 ms) were obtained with an isotropic spatial resolution of 117 μm. All magnetic resonance measurements were performed at a field strength of 2.35 T using an MRBR 4.7/400 mm magnet (Magnex Scientific) equipped with a DBX system (Bruker Biospin). Thickness of cortex and corpus callosum was measured at 12 different locations each on coronal T2-weighted sections. The mean values of each animal were used for additional calculation. We compared five Pten-null mutant mice and five controls.
Lipid extraction and determination of PtdIns(4,5)P2 and PtdIns(3,4,5)P3.
Isolated frozen nerves were thawed on ice in 1 ml of an acidic extraction solvent (Cho and Boss, 1995) containing 36% (v/v) CH3OH, 36% (v/v) CHCl3, 18% (v/v) 2.4 m HCl, and 9% (v/v) 0.4 m EDTA in a glass reaction vial. The material was ground to homogeneity using a rotating Douncer under constant cooling. Samples were mixed and incubated shaking for at least 2 h at 4°C. Phases were separated by brief centrifugation (2 min, 600 × g), and the organic phase was collected into a fresh glass tube. Samples were reextracted twice with 500 μl of CHCl3. The combined organic phases were backwashed twice using 1.5 ml of 0.5 m HCl in 50% (v/v) CH3OH. The first aqueous phase was discarded and in the second step the organic phase was collected into a fresh glass tube. The lipid extracts were analyzed in a double-blind experiment for PtdIns(4,5)P2 (PIP2) and PtdIns(3,4,5)P3 (PIP3) as previously described (König et al., 2008).
Histology and immunostaining.
Mice were anesthetized with Avertin and perfused through the left ventricle with 15 ml of HBSS (Lonza), followed by 50 ml of 4% paraformaldehyde in PBS. Brains, spinal cords, and sciatic nerves were postfixed in 4% paraformaldehyde for 1 h to overnight at 4°C and embedded in paraplast. Five micrometer microtome sections (Microm HM400) were stained by hematoxylin–eosin or Nissl to study cytoarchitecture. Myelinated fibers were visualized by Gallyas silver impregnation and Luxol Fast Blue staining. Axonal architecture was studied by Bielschowsky silver impregnation. For DAB-based immunostaining of paraffin sections, Dako-LSAB2 system or Vectastain Elite ABC kit (Vector Laboratories) were used according to the manufacturer's instructions. For immunofluorescent staining, paraffin sections were incubated overnight at 4°C with primary antibodies and further for 1 h at room temperature with the corresponding fluorescently labeled secondary antibodies conjugated to Cy2 (1:100; Jackson ImmunoResearch) or Cy3 (1:1000; Jackson ImmunoResearch). Immunostaining of free-floating vibratome brain sections (Leica VT 1000S; Leica Instruments) was performed as described previously (Hirrlinger et al., 2006). Enhanced yellow fluorescent protein (EYFP) expression in the R26R-YFP reporter line (Srinivas et al., 2001) was below detection level and had to be shown with antibodies directed against GFP (green fluorescent protein) (1:1000; Rockland). Other primary antibodies we used were directed against APC (adenomatous polyposis coli) (clone CC-1; 1:50; Calbiochem), amyloid precursor protein (APP) (1:750; Millipore Bioscience Research Reagents), CNPase (1:150; Sigma-Aldrich), GFAP (1:200; Novocastra), Olig2 (1:20,000; a gift from C. D. Stiles, Dana-Farber Cancer Institute, Boston, MA), Mac-3 (1:400; BD Biosciences Pharmingen), neuronal nuclei (NeuN) (1:100; Millipore Bioscience Research Reagents), myelin protein zero (MPZ) (1:1000; provided by J. Archelos, Medical University of Graz, Graz, Austria), peripherin (1:200; Millipore Bioscience Research Reagents), and P-Ser-473 AKT (1:50; Cell Signaling). Digital images of stained sections were obtained by using an Axiophot (Zeiss) and DM RXA microscope (Leica).
Electron microscopy.
After anesthetizing with Avertin, mice were perfused with 4% paraformaldehyde, 2.5% glutaraldehyde in 0.1 m phosphate buffer containing 0.5% NaCl. Sciatic nerves were dissected, and cross sections were used at the level at which the nerve exits the greater sciatic foramen. Corpus callosum was prepared from 1 mm parasagittal forebrain sections. Tissues were contrasted with 2% osmium tetroxide (OsO4) in 0.1 m phosphate buffer, and embedded in epoxy resin (Serva). Semithin sections (0.5 μm) were cut, using an ultramicrotome (Leica; RM 2155) with diamond knife (Histo HI 4317; Diatome). Sections were stained with azur II/methylenblue for 1 min at 60°C. Light-microscopic observation was performed by using a 100× lens (Leica DM RXA microscope) and images were digitalized with Openlab 3.1.1 software. For electron microscopy, ultrathin sections (50–70 nm) were stained with an aqueous solution of 4% uranyl acetate followed by lead citrate and analyzed by using a LEO EM912 transmission electron microscope and an on axis-mounted 2048 × 2048 pixel CCD camera (Proscan). Images were processed with Photoshop CS and Illustrator 10 software (Adobe). To determine periodicity of the myelin sheaths, ultrathin cryosections were performed as described previously (Werner et al., 2007).
Immunoelectron microscopy.
Mice were anesthetized with Avertin and transcardially perfused with HBSS followed by fixative (4% formaldehyde and 0.2% glutaraldehyde in 0.1 m phosphate buffer containing 0.5% NaCl). Sciatic nerves were dissected, and infiltrated with 2.3 m sucrose in 0.1 m phosphate buffer overnight, mounted onto aluminum pins for cryo-ultramicrotomy, and frozen in liquid nitrogen. Ultrathin cryosections were cut with a diamond knife using a Leica UC6 cryo-ultramicrotome (Leica). The sections were picked up in a 1:1 mixture of 2% methylcellulose (Sigma-Aldrich) and 2.3 m sucrose. After five washes in PBS with 0.1% glycine (Serva), sections were blocked (3 min with 1% BSA in PBS). For immunolabeling, sections of sciatic nerves were incubated with a monoclonal antibody (1:2000) specific for MPZ, which was detected with a rabbit anti-mouse IgG (Rockland) followed by incubation with protein A-gold (10 nm). Sections were analyzed with a LEO EM912 transmission electron microscope. Colloidal gold conjugates to protein A were obtained from the Cell Microscopy Center, Department of Cell Biology, University Medical Center Utrecht (Utrecht, The Netherlands).
Protein analysis.
Protein lysates were prepared using an Ultraturrax (T8). Tissues were homogenized in 1 ml of modified RIPA buffer and protease inhibitors (Complete tablets; Roche). For Western blotting, 40 μg of total sciatic nerve lysate was size-separated on 12% SDS-polyacrylamide gels and blotted onto polyvinylidene difluoride membranes (Hybond-P) following instructions from Invitrogen. Membranes were incubated with primary antibodies against p-AKT (pRb; 1:1000; Cell Signaling), p-S6 (pRb; 1:1000; Cell Signaling), actin (mM; 1:1000; Millipore Bioscience Research Reagents), and PTEN (pRb; 1:500; BioSource). The densitometeric analysis of scanned ECL films was performed using QuantityOne from Bio-Rad. Relative intensities of proteins of interest were normalized to intensities of β-actin. All protein analyses were performed on four age-matched animals per genotype.
Laser capture microdissection.
Mice were killed at 2.5 months of age by cervical dislocation. Freshly dissected brains were immediately placed on dry ice and stored at −80°C until sectioning. Serial coronal 20 μm cryosections were prepared (bregma, +0.8 to +1 mm) using a Leica CM3000 cryostat, mounted on PEN-membrane frame slides (Arcturus), stained with thionin staining solution, and rapidly dried under a nitrogen beam. For laser capture microdissection (LCM), we used a Veritas Microdissection System (Arcturus). The corpus callosum of mutants and controls was dissected by UV laser (laser power set to 3.2–4.2) and attached to CapSure LCM caps with help of infrared laser (power set to 80%). Caps were collected in 0.5 ml Eppendorf tubes containing 100 μl of RLT buffer (QIAGEN) and stored upside-down at −80°C until RNA isolation.
RNA isolation, cDNA synthesis, and quantitative reverse transcription-PCR.
Five millimeter pieces of mouse cervical spinal cord were collected in precooled Eppendorf tubes and homogenized for 15–30 s in 2 ml of RLT buffer (QIAGEN) using a Polytron rotor-stator tissue homogenizer. RNA isolation was performed with a QIAGEN RNeasy Mini Kit according to the manufacturer's instructions. Laser captured tissues in RLT buffer were thawed and vortexed, and total RNA was isolated using a QIAGEN RNeasy Micro Kit according to the manufacturer's instructions. RNA was eluted in 100 μl of water, precipitated in ethanol at 4°C, resuspended in 4 μl of RNase-free water, and immediately used for cDNA synthesis. cDNA was synthesized from total RNA using a mixture of random nonamer primers and anchored poly-dT primers, and SuperScript III RNase H reverse transcriptase (Invitrogen) according to the manufacturer's manual. Quantitative reverse transcription-PCR (qRT-PCR) was performed using SYBR Green master mix (Applied Biosystems) and 7500 Fast Real-Time PCR System (Applied Biosystems) using specific qRT-PCR primers that were designed with help of Roche Universal ProbeLibrary Assay Design Center: ACTB, forward, 5′-TGA CAG GAT GCA GAA GGA GA-3′; reverse, 5′-CGC TCA GGA GGA GCA ATG-3′; GFAP, forward, 5′-TCA AGA GGA ACA TCG TGG TAA AGA-3′; reverse, 5′-TGC TCC TGC TTC GAG TCC TT-3′; HMGCR, forward, 5′-TGA TTG GAG TTG GCA CCA T-3′; reverse, 5′-TGG CCA ACA CTG ACA TGC-3′; FASN, forward, 5′-GTC GTC TGC CTC CAG AGC-3′; reverse, 5′-GCA ACT TCC CCG ACA TAC C-3′; Fdft1, forward, 5′-TCA ATC AGA CCA GTC GCA GC-3′; reverse, 5′-GTG CCG TAT GTC CCC ATC C-3′; MAG, forward, 5′-TCT ACC CGG GAT TGT CAC TG-3′; reverse, 5′-GCA GCC TCC TCT CAG ATC C-3′; MBP, forward, 5′-GCC TGT CCC TCA GCA GAT T-3′; reverse, 5′-GCC TCC GTA GCC AAA TCC-3′; MOG, forward, 5′-ATT TCC CAT TGG CCT CTT TGC TGT GGA C-3′; reverse, 5′-CTC AAG GTC CTC CCA CCAG GCT-3′; Nrg1, forward, 5′-TGA GAA CAC CCA AGT CAG GA-3′; reverse, 5′-CCC AGT CGT GGA TGT AGA TGT-3′; PLP1, forward, 5′-GGC TAG GAC ATC CCG ACA AGT-3′; reverse, 5′-GGC AAA CAC CAG GAG CCA TA-3′; Pten forward, 5′-GGC ACA AGA GGC CCT AGA TT-3′; reverse, 5′-GCC TCT GAC TGG GAA TTG TG-3′; SIRT2, forward, 5′-CAC TAC TTC ATC CGC CTG CT-3′; reverse, 5′-CCA GCG TGT CTA TGT TCT GC-3′; Top1mt, forward, 5′-AAT GAG AGG GGA CAG CAA AC-3′; reverse, 5′-CCT TGT CTG TGG CCT TCG-3′. Relative concentrations of mRNAs of interest in different cDNA samples were normalized to levels of murine mitochondrial Topoisomerase 1 (Top1mt) and β-actin (ACTB). Obtained data were finally analyzed with qBase software, version 1.3.5 (Center for Medical Genetics, Ghent University, Ghent, Belgium) and Microsoft Excel 2003.
Cell culture and immunocytochemistry.
Oligodendrocyte precursors from single brains of newborn (P2) mutant and control mice were prepared, differentiated, fixed, and immunostained as described previously (Lappe-Siefke et al., 2003) except for allowing oligodendrocytes to differentiate for 10 d in modified SATO medium supplemented with 1% horse serum before performing immunocytochemical analysis. We used a rabbit monoclonal antibody directed against PTEN (1:100; Cell Signaling Technology) and a mouse monoclonal anti-oligodendrocyte marker O4 antibody (1:50; a gift from M. Schachner, Center for Molecular Neurobiology, Hamburg, Germany).
Morphometry.
Digitized, nonoverlapping electron micrographs of dorsal and ventral corpus callosum and sciatic nerves were analyzed for axon diameter and g-ratio. We measured a minimum of 100 (200 for g-ratio analysis) randomly selected fibers per animal and region in the CNS and 15–70 small-caliber axons per animal in the PNS. For CNS analysis, g-ratio analysis was modified such that the inner diameter of compact myelin (instead the axon diameter) was divided by the outer diameter of the myelin sheath (because the inner tongue was frequently enlarged in mutants but not in controls). Diameters were calculated from enclosed areas. Fibers with prominent outfoldings in the plane of section were excluded. We implemented a plug-in for the ImageJ software (http://rsbweb.nih.gov/ij), which allowed for semiautomated analysis of randomly selected sets of fibers. Plug-in and source code are available online (http://gratio.efil.de). Total numbers of Schwann cells and myelinated axons were determined on 100× semithin pictures that were fused to a continuous image of a complete sciatic nerve cross section by using Photoshop CS and ImageJ software. To determine the size distribution of myelinated axons in sciatic nerve cross sections, diameters of all fibers in 10 randomly chosen representative pictures of semithin sections (representing 13–26% of each complete nerve cross section) were measured. Subsequently, for each nerve, absolute numbers of myelinated axons of a certain diameter were calculated on the basis of previously counted numbers of all myelinated axons. To determine the density of myelinated fibers in the ventral corpus callosum, total numbers of myelinated fibers were counted on seven micrographs per animal (image size, 160 μm2). Mean oligodendrocyte sizes were determined from soma areas in CNP-stained coronal paraffin sections of the parietal cortex (70 cells per animal). Numbers of oligodendrocytes and oligodendrocyte progenitor cells (OPCs) were determined on paraffin sections by counting Olig2+ cells in anterior commissures and corpus callosum (coronal sections) and hippocampal fimbria (sagittal sections).
Statistical analysis.
All values are expressed as mean ± SEM. If not stated otherwise, p values were determined by unpaired, two-tailed Student's t test. All statistical analyses were performed using GraphPad Prism, version 4.03, and Microsoft Excel 2003.
Results
Conditional inactivation of PTEN in oligodendrocytes and Schwann cells
To explore elevated PIP3 as a possibly nodal signal in initiating myelination, we conditionally inactivated the Pten gene by crossing mice with a floxed exon 5 (encoding the phosphatase domain) (Lesche et al., 2002) to a Cre driver line that expresses the recombinase in oligodendrocytes and Schwann cells under control of the Cnp1 gene (Lappe-Siefke et al., 2003). In subsequent generations, we generated conditional Pten-null mutant mice with the genotype Ptenflox/flox*Cnp1-Cre/+, referred to as “mutants” and Ptenflox/flox mice, referred to as “controls.”
Expression of PTEN is too low in normal white matter to allow its immunodetection in sections (data not shown). However, cell type-specific loss of PTEN was demonstrated in O4+ oligodendrocytes that formed a thin sheath of myelin-like membrane in culture (Fig. 1 A). In vivo, we determined a corresponding loss of Pten mRNA by quantitative RT-PCR (using exon 5 specific primers). With increasing content of white matter, this reduction was −50% mRNA in adult spinal cord and −91% mRNA in corpus callosum, when harvested by laser-capture microdissection (Fig. 1 B). As demonstrated by PCR amplification of sciatic nerve genomic DNA, Cre-mediated recombination resulted also in efficient deletion of Pten exon 5 in mutant sciatic nerves (Fig. 1 C). Western blot analysis confirmed significant downregulation of PTEN protein (Fig. 1 D) to 57% in the mutants (p = 0.0071; n = 4 for each genotype) and enhanced phosphorylation of two known PI3-kinase effector proteins, AKT and S6, in mutant sciatic nerve lysates (Fig. 1 E). When the respective levels of PIP2 and PIP3 were analyzed in acidic lipid extracts of sciatic nerves and optic nerves by gas-chromatographic quantification of their associated fatty acids (König et al., 2008), we confirmed an increase in PIP3 and a decrease in PIP2 in the mutants (Fig. 1 F; supplemental Fig. S1, available at www.jneurosci.org as supplemental material).
Figure 1.
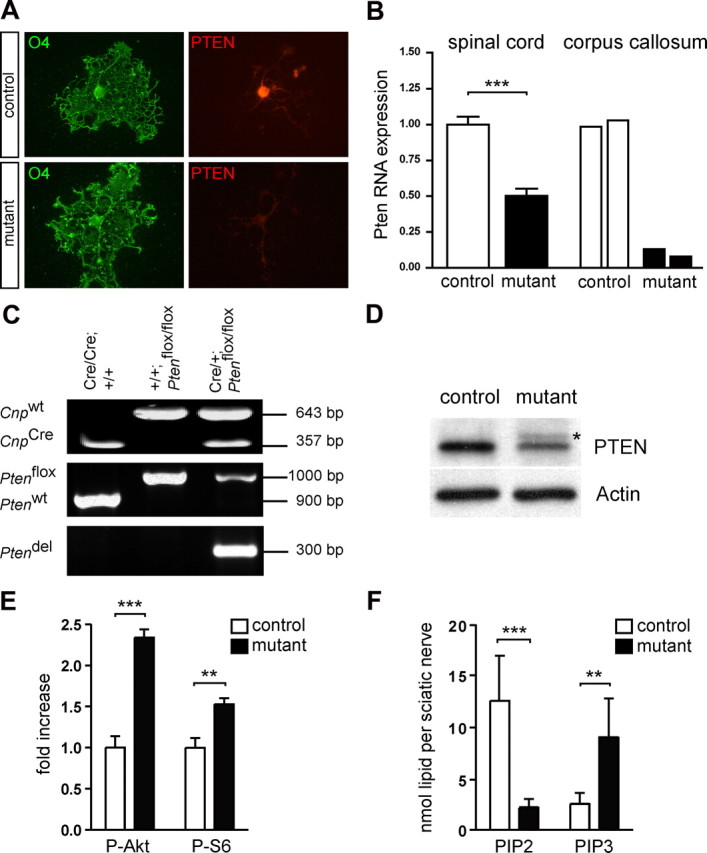
Conditional inactivation of Pten in oligodendrocytes and Schwann cells. A, Immunofluorescence of O4-stained oligodendrocytes in primary culture, obtained from control mice (top panel) and mutants (bottom panel). Compared with controls, PTEN immunoreactivity was reduced in mutant differentiated oligodendrocytes forming sheath-like extensions. B, By qRT-PCR analysis, levels of Pten transcripts containing the floxed exon 5 were analyzed. In spinal cord, steady-state Pten mRNA levels were reduced to 50% in mutants compared with controls, which were given an arbitrary value of 1.0 (P40, n = 5 per genotype; ***p < 0.0001). In corpus callosum that had been harvested by laser-capture microdissection, steady-state Pten mRNA levels were reduced to 9% in mutants compared with controls (each bar represents one animal). C, PCR analysis on sciatic nerve genomic DNA showing PCR products amplified from Cnp1 wild-type (Cnp wt) and Cnp1 Cre (Cnp Cre) alleles (top), from Pten wild-type (Pten wt) and floxed Pten (Pten flox) alleles (middle) and from the recombined Pten flox allele (Pten del) (bottom). Genotypes of the animals and sizes of PCR products are indicated. Amplification of a PCR product from the non-recombined floxed Pten allele in the mutants can probably be attributed to the presence of perineurial fibroblasts and some Schwann cells that escaped the recombination event. D, Western blot analysis of sciatic nerve lysates obtained from 40-d-old mice demonstrated a decrease of PTEN protein in mutants when compared with controls. The asterisk indicates a residual band from previous antigen detection. E, Quantification of Western blot analyses of sciatic nerve lysates obtained from 40-d-old mice demonstrates increased P-AKT and P-S6 levels in mutants when compared with controls, which were given an arbitrary value of 1.0 (P-AKT, ***p = 0.0002; P-S6, **p = 0.0082; n = 4 for each genotype). F, Quantification of PIP2 and PIP3 in isolated sciatic nerves. The analysis of lipid-associated fatty acids by gas chromatography indicates decreased levels of PIP2 and increased levels of PIP3 in mutants when compared with controls (PIP2, ***p = 0.0003; PIP3, **p = 0.0079; n = 6 for each genotype). Error bars indicate SEM.
Mutant mice were born at the expected Mendelian frequency and initially without clinical phenotype, developmental delay, or motor symptoms. Later, many conditional Pten mutants developed hyperplasia of the salivary gland, megacolon, and cataracts, resulting in premature death and poor breeding. Thus, we concentrated on mice up to 4 months of age.
Hypermyelination
CNS myelination in conditional Pten mutant mice should mimic the hypermyelination associated with overexpression of constitutively active AKT (Flores et al., 2008). Indeed, transcripts for several myelin proteins were significantly increased in mutant spinal cord when compared with controls (supplemental Fig. S2, available at www.jneurosci.org as supplemental material). When analyzed by MRI, brains in mutants were enlarged, and we noticed a contrast enhancement between gray and white matter on T2-weighted images (Fig. 2 A; supplemental Fig. S3A, available at www.jneurosci.org as supplemental material). The T1 contrast enhancement was less pronounced, whereas the increase in white matter volume was observable in both T1- and T2-weighted images and progressed with age (Fig. 2 A; supplemental Fig. S3A, available at www.jneurosci.org as supplemental material). Importantly, volume increases were preferentially observed in white matter as quantified for the corpus callosum, whereas the size of the overlying gray matter was slightly reduced, possibly because of compression (Fig. 2 B).
Figure 2.

White matter structures are enlarged in Pten mutant mice. A, Representative T2-weighted images (T2w) at 3 months of age showed enhanced gray-white matter contrast and enlarged white-matter tracts in mutants when compared with controls (sagittal and axial sections). Note the affected structures in the mutant (right) labeled as follows: aco, anterior commissure; cc, corpus callosum; fi, hippocampal fimbria; ic, internal capsule; wm, cerebellar white matter. B, Volumetry of the corpus callosum and neocortex at the age of 3 months (n = 5 per genotype). Compared with controls, Pten mutants showed a significant increase in size of the corpus callosum (***p = 0.0002), whereas the thickness of the overlying neocortex was reduced (**p = 0.0031). C, Luxol Fast Blue (LFB) staining and Gallyas silver impregnation of brain and spinal cord sections at the indicated ages. Images reveal enlargement of white matter structures in Pten mutants when compared with littermate controls. aco, Anterior commissure; cc, corpus callosum; cp, caudate–putamen; ctx, cerebral cortex; dg, dentate gyrus; fi, hippocampal fimbria; lot, lateral olfactory tract; on, optic nerve. Scale bars, 1 mm. D, Higher magnification of motor and cingulate cortex with more myelinated fibers stained in mutants compared with controls at 4 months of age (myelin is visualized by Gallyas silver impregnation). Scale bar, 100 μm. Error bars indicate SEM.
Histological analysis revealed profound and progressive enlargement of virtually all white matter tracts in the mutants (Fig. 2 C; supplemental Fig. S3B,C, available at www.jneurosci.org as supplemental material). Also, in the outer cortical layers, the density of myelinated fibers was higher in mutants, demonstrating that myelination was similarly enhanced in white and gray matter (Fig. 2 D). Administration of rapamycin, an inhibitor of mTOR, to mice between the ages P43 and P95 strongly impeded volume increase of the white matter (supplemental Fig. S4, available at www.jneurosci.org as supplemental material). This confirmed that the AKT/mTOR pathway is one critical downstream effector of elevated PIP3 in the differentiation of oligodendrocytes (Narayanan et al., 2009; Tyler et al., 2009).
Loss of PTEN often causes cellular proliferation and increased cell size (van Diepen et al., 2008). Indeed, myelinated axons of the corpus callosum that were intermingled with mutant glial cells were histologically in disarray (Fig. 3 A). By electron microscopy, the density of myelinated axons was significantly decreased by 36.6% in the ventral corpus callosum of mutants (132 ± 12 axons/160 μm2) compared with controls (208 ± 12 axons/160 μm2) at 3 months of age (n = 3 per genotype; p = 0.0113). Immunohistochemistry for CNP and subsequent quantitation of oligodendroglial cross-sectional areas in the cortex of mutants (52.5 ± 0.4 μm2) compared with controls (34.6 ± 1.6 μm2) at 4 months of age (n = 3 per genotype; p = 0.0004) indicated that oligodendroglial hypertrophy was a feature and a likely underlying cause (Fig. 3 B). In contrast, we found no evidence for a higher number of Olig2-positive cells (OPCs and mature oligodendrocytes) when quantified in anterior commissures or corpus callosum (Fig. 3 C). For the latter experiment, absolute glial cell numbers (rather than densities) were quantified in anatomically defined areas (the anterior commissure and the corpus callosum; bregma, +0.5 to +0.8 mm), because oligodendrocyte density was reduced as white matter tracts became enlarged. In marked contrast, also with respect to the consequences of AKT overexpression (Flores et al., 2008), loss of PTEN from Schwann cell lineage cells in the PNS increased both the overall size of the sciatic nerves (Fig. 3 D) and the number of myelinating (mSC) and nonmyelinating Schwann cells (nmSC) (Fig. 3 E). In analogy to the CNS and likely because of Schwann cell hypertrophy, myelinated axons were more loosely spaced in sciatic nerves of mutants (2.5 ± 0.2 axons/100 μm2; n = 6) compared with controls (4.0 ± 0.2 axons/100 μm2; n = 8; p < 0.0001) when quantified at 6 weeks of age.
Figure 3.

In Pten mutants, oligodendrocytes are hypertrophic, but absolute glial cell numbers are only increased in PNS, not in CNS. A, Gallyas silver impregnation visualizing myelin and Bielschowsky silver impregnation indicating axons depict an irregular staining pattern in mutants compared with controls at 4 months of age. Scale bar, 50 μm. B, Immunohistochemistry for CNP in the cortex of control and mutant mice indicated significant enlargement of mutant oligodendroglial soma sizes at 4 months of age. Scale bar, 25 μm. C, Total number of Olig2-positive cells was not significantly altered in the anterior commissure (aco) of mutants (99 ± 14) compared with controls (111 ± 14; p = 0.6) and in the corpus callosum (cc) of mutants (1536 ± 64) compared with controls (1968 ± 170; p = 0.08) at 4 months of age when quantified on 5 μm paraffin sections (n = 3 per genotype). For better comparability, cell numbers in mutants are expressed in relation to controls, which were set to 100% in aco and cc, respectively. Scale bar, 250 μm. D, At 4 months of age, mutant sciatic nerves are bigger in size than control nerves. The white bars indicate the level of the cross section used for additional quantification. Scale bar, 5 mm. E, Quantitation of nuclei of myelinating Schwann cells (mSC) and nonmyelinating Schwann cells (nmSC) on 0.5 μm semithin cross sections of sciatic nerves from mutants and controls at 3 months of age (n = 3 per genotype; mSC: controls, 168 ± 9; mutants, 278 ± 25; *p = 0.015; nmSC: controls, 56 ± 8; mutants, 128 ± 16; *p = 0.017). Error bars indicate SEM.
In the CNS, the volume increase of white matter tracts was clearly associated with increased myelin sheath thickness, as demonstrated by electron microscopy (Fig. 4 A). Such hypermyelination was primarily a consequence of additional membrane wraps and not caused by altered ultrastructure or periodicity of myelin (Fig. 4 B). When we quantified the degree of hypermyelination, g-ratios for myelin in 3-month-old mutants were 0.541 ± 0.012, compared with 0.677 ± 0.012 in controls for the dorsal corpus callosum (p = 0.0012; n = 3 per genotype), and 0.581 ± 0.019 compared with 0.688 ± 0.006 in controls for the ventral corpus callosum (p = 0.0061; n = 3 per genotype) (Fig. 4 C). Increased myelin thickness was evident for axons of all calibers (Fig. 4 C). However, not all fibers were visibly hypermyelinated, as indicated by the larger scatter of g-ratios, suggesting that CNS axons differ in their ability to trigger PIP3-dependent myelin growth. Although the overall size distribution of callosal axons was similar in mutant and control mice, there was a tendency toward increased axonal diameters in mutants (Fig. 4 C). This is in agreement with findings that myelinating glial cells themselves positively influence axonal caliber, axon stability, and neurofilament phosphorylation (de Waegh et al., 1992; Sánchez et al., 1996). However, we cannot formally exclude that single, unusually large-caliber axons can be explained by ectopic Cre activity in single projection neurons or their precursors. When small-caliber axons (<2 μm in diameter) of sciatic nerves were quantified by g-ratio analysis on ultrathin cross sections, loss of PTEN resulted likewise in a significant increase of myelin sheath thickness, as shown for two age groups (Fig. 4 D; supplemental Fig. S5, available at www.jneurosci.org as supplemental material).
Figure 4.
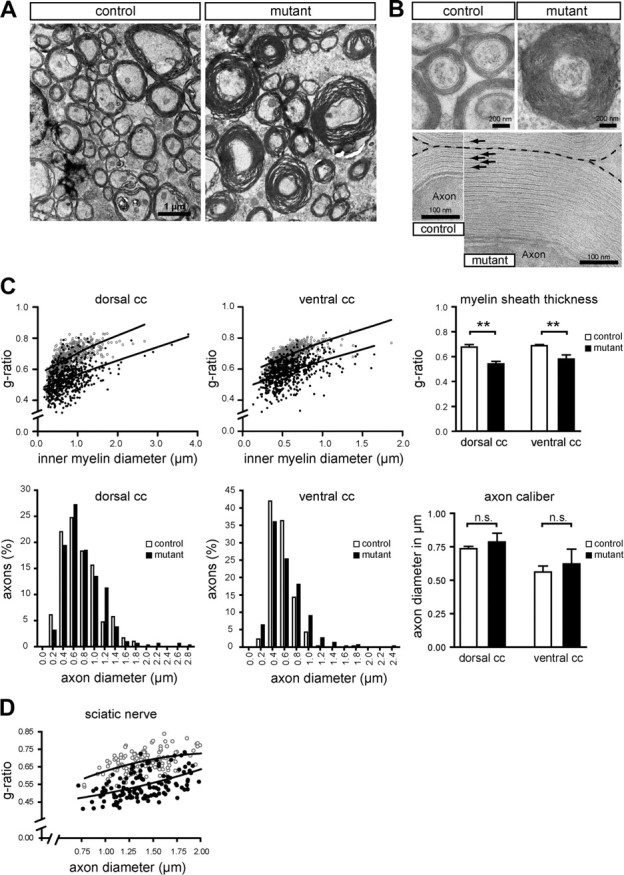
Myelin sheath thickness is increased in Pten mutants. A, Electron micrographs of dorsal corpus callosum (sagittal sections) in 3-month-old mice. Compared with controls, mutant animals show many axons with thickened myelin sheaths. B, Hypermyelination in mutants (top right) is caused by additional membrane wraps, as visualized by ultrastructure and periodicity of myelin sheaths that are preserved (bottom). C, Quantitation of myelin thickness by modified g-ratio analysis (top) and axon size distribution (bottom) for two independent regions of the corpus callosum (cc) (age, 3 months; n = 3 per genotype). Top, Left, Scatter plots comparing g-ratios (ordinate) from Pten mutants (black circles) and age-matched controls (gray circles) in relation to the inner diameter of the myelin sheath (abscissa). Top, Right, Myelin sheath thickness is significantly increased in Pten mutant mice (**p = 0.0012 for dorsal corpus callosum; **p = 0.0061 for ventral corpus callosum). Despite single unusually large axons in both regions (bottom, left), overall axonal calibers are not significantly different between mutants and controls (bottom, right; p = 0.3128 for dorsal corpus callosum; p = 0.4245 for ventral corpus callosum). D, Scatter plot depicting g-ratios (ordinate) of 6-week-old mutants (black circles) and controls (gray circles) in relation to the axon diameter (abscissa) based on electron micrographs taken from ultrathin cross sections of sciatic nerves at comparable levels. For small-caliber axons <2 μm in diameter, we observe a significant decrease in g-ratios indicating hypermyelination in mutants when compared with controls. Mean g-ratios were 0.684 ± 0.005 in controls and 0.554 ± 0.012 in mutants (p = 0.0003; n = 3 for controls and n = 4 for mutants). Error bars indicate SEM.
Thicker myelin sheaths in the corpus callosum were more likely to show secondary delamination, which we consider fixation artifacts associated with hypermyelination (Fig. 4 A). We also observed myelin outfoldings of variable length and aberrant myelin depositions (supplemental Fig. S6A, available at www.jneurosci.org as supplemental material), a phenotype that is more pronounced in the PNS (S. Goebbels, J. H. Oltrogge, and K.-A. Nave, unpublished observations). By electron microscopy and immunostaining for APP, we noted some axonal swellings suggestive of transport defects (supplemental Fig. S6A,B, available at www.jneurosci.org as supplemental material). These swellings may be caused directly by axon compression attributable to hypermyelination or, as shown for other mouse models (Nave and Trapp, 2008), may indirectly result from a reduced support of axons by the mutant glia cells. Signs of pathology were accompanied by occasional findings of activated microglia/macrophages (supplemental Fig. S6B, available at www.jneurosci.org as supplemental material).
De novo myelination
In the mutant CNS, we did not observe ectopic myelination of those axons that normally remain unmyelinated, such as parallel fibers in the cerebellar molecular layer or mossy fiber axons in the dentate gyrus (data not shown), although it is impossible to exclude that some normally unmyelinated axons in the corpus callosum were recruited by mutant oligodendrocytes. In contrast, the absolute number of myelinated axons in the sciatic nerve, when counted at the same level at 3 months of age, was significantly higher in Pten mutants (5234 ± 98; n = 3) than in controls (4152 ± 278; n = 3) (p = 0.0214). Here, the axon size distribution indicated that the increase was primarily caused by a recruitment of small-caliber axons with diameters between 1 and 3 μm (supplemental Fig. S7A, available at www.jneurosci.org as supplemental material). Indeed, when sciatic nerve cross sections were immunostained for both MPZ and peripherin, a marker of the nonmyelinated C-fibers (Goldstein et al., 1991), we frequently observed peripherin-positive axons that were surrounded by myelin in the mutants (supplemental Fig. S7B, available at www.jneurosci.org as supplemental material). Also, electron microscopic analysis revealed the presence of myelinated axons of unusually small caliber in the mutants (often in close proximity to Remak bundles) (supplemental Fig. S7C, available at www.jneurosci.org as supplemental material). This strongly suggests that enhanced PIP3 levels are able to stimulate Schwann cells to sort and wrap axons below the normal size threshold.
“Remak myelin”
The Cnp1 promoter is also active in nonmyelinating Schwann cells (Toma et al., 2007) that engulf multiple small C-fiber axons to form a Remak bundle. Here, Cre recombination was demonstrated indirectly by strong immunostaining of phosphorylated AKT kinase (Fig. 5 A). When visualized in adult mice at 3 months of age by electron microscopy, many mutant Remak cells showed outgrowth of lamellipodia that had no axonal contact (Figs. 5 B, 6 A). Surprisingly, many C-fiber axons were spirally enwrapped by the Remak cell in mutant mice. Up to 10 membrane layers per axon resulted in myelin that was not compacted. Membranes were regularly spaced at 20–30 nm distance, reminiscent of cytoplasm-filled wraps in immature nerves, but developmentally stable (Fig. 5 B). Occasionally, Remak myelin appeared compacted and had incorporated the adhesive myelin protein MPZ (Fig. 5 C). Moreover, we confirmed all our observations following Pten deletion in adult Schwann cells (using a tamoxifen-inducible Plp1-CreERT2 driver line) (Fig. 5 D) (see below). There were no obvious nodal specializations in longitudinal sections (data not shown).
Figure 5.
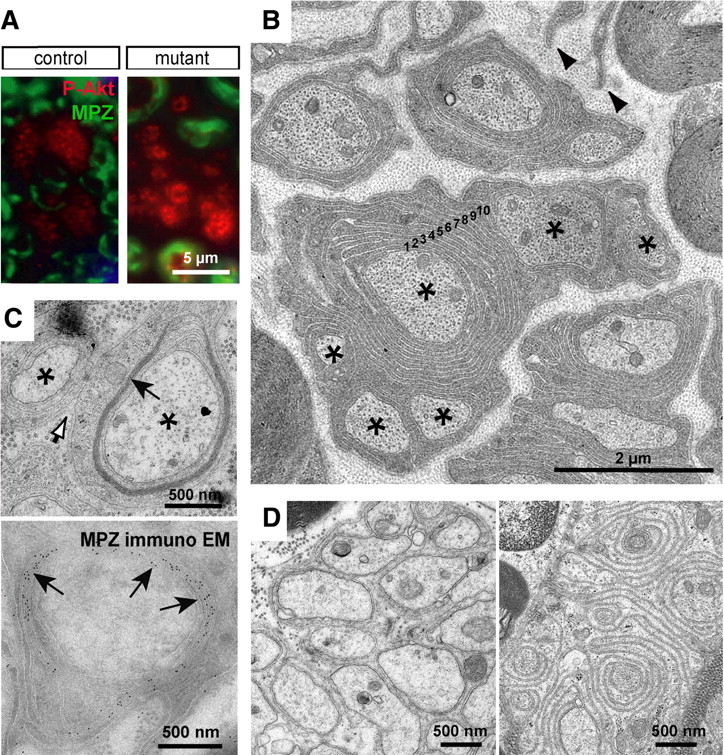
Normally nonmyelinated C-fiber axons are spirally enwrapped by Remak Schwann cells in Pten mutants. A, Phosphorylation of AKT is increased in sciatic nerve Remak bundles of conditional Pten mutant mice when compared with controls as visualized by immunostaining for P-AKT (in red). Myelin sheaths are labeled by staining for MPZ (in green). B, Electron microscopic analysis at 3 months of age demonstrated that C-fiber axons in mutants are frequently enwrapped by multiple layers of membrane (Remak myelin with layers labeled 1–10). The arrowheads indicate tips of Schwann cell lamellipodia that do not have axonal contact. The asterisks mark axons that are part of one Remak bundle. C, Top, Membrane stacks around C-fiber axons sometimes get compacted (black arrow). The white arrow points to a basal lamina that covers two axons (asterisks) of a Remak bundle. Bottom, Immunogold labeling (arrows) demonstrated that myelin compaction is associated with incorporation of MPZ. D, Remak myelin generated by adult Schwann cells after Cre recombination in Ptenflox/flox*Plp1-CreERT2 mice. Analysis of sciatic nerves of vehicle-treated (left) or tamoxifen-treated (right) Pten mutants at 5.5 months of age (3.5 months after treatment) indicates that a spiral wrapping process around C-fibers can also be induced in adult nonmyelinating Schwann cells.
Figure 6.

Spiral wrapping of collagen fibrils. A–C, By electron microscopy at 4 months of age, subsequent stages of membrane wrapping (pseudocolored in red in B) by mutant Remak Schwann cells around collagen fibrils (white arrowheads) can be identified. Scale bars, 500 nm.
In peripheral nerves, the endoneurium is filled with 20 nm collagen fibrils that appear closely aligned when viewed on EM cross sections. Unexpectedly, mutant Remak Schwann cells also ensheathed bundles of collagen fibrils (Fig. 6). These wraps were also regularly spaced, like Remak myelin, and appeared immature but stable. We never observed membranes or basal laminae between the collagen bundle and the inner lip of the wrapping process (Fig. 6 B,C). By size, these “myelinated” fibrils are very distinct from typical collagen pockets in degenerating nerves. In older mutants, collagen myelin was even more frequent and showed more membrane layers per bundle. This and findings of successive stages (Fig. 6 A–C) strongly suggest an active wrapping process rather than secondary collagen ingrowth. Axon-independent myelination, as reported here, is also different from “double myelination” that can occasionally result from the displacement of one internode by the interposition of another myelinating Schwann cell (Kidd and Heath, 1991).
Inducing myelination in adult mice
To determine whether CNS myelination can also be stimulated after myelination is normally complete, we targeted the Pten gene by TM-inducible Cre recombination. When Plp1-CreERT2 mice (Leone et al., 2003) were crossed to a R26R-YFP reporter line (Srinivas et al., 2001), after daily administration of TM (for 10 d), we achieved widespread but oligodendrocyte-specific Cre recombination in the CNS of adult double transgenic offspring (Fig. 7 A; supplemental Fig. S8, available at www.jneurosci.org as supplemental material). When the same TM administration protocol was applied to 2-month-old Pten mutants (Ptenflox/flox*Plp1-CreERT2; termed mutant+TM), we observed a significant volume increase of the white matter, when histologically analyzed 3.5 months later (Fig. 7 B,C). By staining for activated AKT, the phosphorylated enzyme was strongly induced in myelinated fiber tracts (Fig. 7 D). The number of Olig2+ cells (OPCs and mature oligodendrocytes), quantified in hippocampal fimbria, remained unchanged in mutants (625 ± 26) when compared with controls (671 ± 82; p = 0.179; n = 3 per genotype). By electron microscopy, many axons in the corpus callosum were visibly hypermyelinated (Fig. 7 E). As Plp1-CreERT2 mice target ∼75% of adult OPCs (Leone et al., 2003), it is difficult to determine to which extent newly recruited OPCs or mature oligodendrocytes were responsible for hypermyelination of the corpus callosum. We therefore turned to the optic nerve, where virtually all axons are myelinated in adult wild-type mice. Also, here, hypermyelination was a frequent feature (Fig. 7 E), suggesting that even mature oligodendrocytes maintain the ability to grow myelin membranes. Loss of PTEN in these mutants resulted likewise in an increased myelin sheath thickness by Schwann cells, when quantified for small-caliber axons <2 μm in diameter (Fig. 7 F), demonstrating that elevation of PIP3 levels can induce myelin assembly in the adult PNS, too. In addition to regular hypermyelination, we also observed outfoldings of the myelin sheaths in CNS and PNS (Fig. 7 E) (data not shown). We note that, in all these experiments, neither TM-treated control mice (not expressing Cre, termed control+TM) nor untreated mutant mice (termed mutant−TM) were affected, demonstrating that the reported phenotype is not caused by TM toxicity or by Cre activity in the absence of TM.
Figure 7.
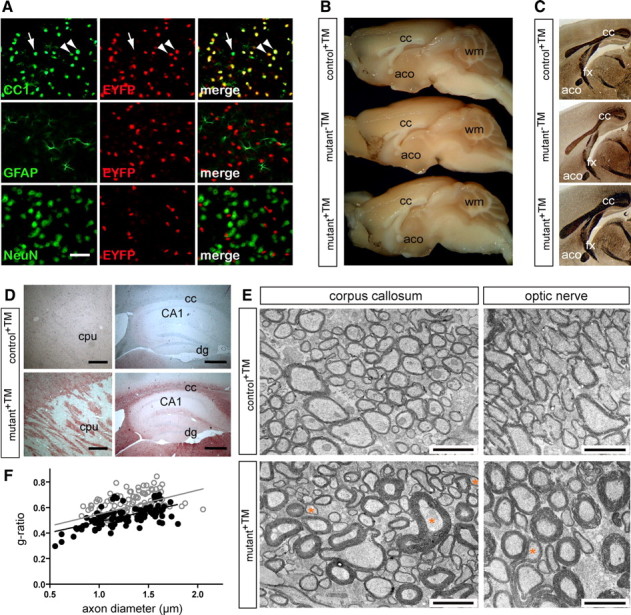
Hypermyelination can be triggered by ablation of Pten in the adult CNS and PNS. A, Vibratome brain sections of a double transgenic mouse at 2.5 months of age harboring a Plp1-CreERT2 transgene and the R26R-YFP reporter, analyzed 20 d after TM treatment (for 10 consecutive days). As shown by immunostaining for EYFP (in red) and CC-1 (in green) in the neocortex, the administration of TM resulted in an oligodendrocyte-specific activation of the conditional EYFP reporter gene. The arrowheads point to EYFP-expressing CC1-positive oligodendrocytes. CC1-positive oligodendrocytes that do not express EYFP are rare (arrow). Colabeling for GFAP and NeuN indicated that EYFP expression was absent from astrocytes and neurons. Scale bar, 50 μm. B, Macroscopic overviews of brains (midsagittal plane) from control+TM, mutant−TM, and mutant+TM mice 3.5 months after treatment. Compared with both controls, corpus callosum (cc), anterior commissures (aco), and cerebellar white matter (wm) are enlarged in mutant+TM mice (age, 5.5 months). C, Gallyas silver impregnation of forebrain sections showing a volume increase of white matter structures in mutant+TM when compared with controls (mutant−TM; control+TM). aco, Anterior commissure; cc, corpus callosum; fx, fornix. D, Immunostaining with an antibody specific to P-AKT showed that AKT activity in caudate–putamen (cpu) and corpus callosum (cc) was enhanced in mutant+TM compared with control+TM mice. dg, Dentate gyrus; CA1, cornu ammonis area 1. Scale bars, 200 μm. E, Electron micrographs of corpus callosum (left) and optic nerve (right) from TM-treated mutant and control mice. Frequently, mutant fiber tracts exhibit axons with abnormally thick myelin sheaths. Evaginations of myelin were occasionally observed (corresponding axons are marked by asterisks). Scale bars, 2 μm. F, Scatter plot depicting g-ratios (ordinate) in relation to the axon diameter (abscissa) based on electron micrographs taken from ultrathin cross sections of sciatic nerves at comparable levels. For small-caliber axons <2 μm in diameter, we observe a decrease in g-ratios indicating hypermyelination in mutants+TM (black circles) when compared with controls+TM (gray circles). Mean g-ratios were 0.529 ± 0.032 in mutants+TM and 0.630 ± 0.019 in controls+TM (p = 0.027 in unpaired, one-tailed t test; n = 3 per genotype).
Discussion
The present study has revealed that elevated levels of PIP3, generated by the cell-specific loss of Pten in oligodendrocytes and Schwann cells, are sufficient to trigger the formation of myelin, which emerges as a highly specialized form of glial cell growth. In the PNS, Schwann cells not only hypermyelinate small-caliber axons. They can also be triggered to sort and myelinate numerous axons <1 μm in diameter, and wrap C-fiber axons in Remak bundles, and even collagen fibrils that lack any membrane surface. In the CNS, there is hypermyelination but no “ectopic” myelination. However, PIP3 signaling is sufficient to stimulate myelination by oligodendrocyte lineage cells in the adult brain. The latter is of obvious clinical relevance, as it might help in the development of therapies aimed at boosting CNS remyelination.
Myelination is physiologically controlled by axon caliber, which likely stands for growth factor signals on the axonal surface (Raval-Fernandes and Rome, 1998; Michailov et al., 2004), and by factors secreted from astrocytes (Ishibashi et al., 2006). Thus, the previously described inactivation of Pten in multiple brain cell lineages (Fraser et al., 2008) is not sufficient to define the function of PI3K signaling in myelination. Our study reveals that the sole loss of Pten in oligodendrocytes triggers myelin growth. However, there is an intriguing heterogeneity as to the degree of axonal hypermyelination. This suggests that, in oligodendrocytes, elevated PI3K signaling amplifies a yet-unknown axonal myelination signal that may differ in strength between individual fibers.
Whereas many genetic conditions cause loss of myelin, there are few known examples of inherited hypermyelination. In the CNS, enhanced myelin sheath thickness has been seen in transgenic mice overexpressing IGF-1 (Carson et al., 1993). Given that IGF-1 receptors are expressed by oligodendrocytes and signal via PI3K and MAPK (mitogen-activated protein kinase) pathways at least in vitro (Palacios et al., 2005; Bibollet-Bahena and Almazan, 2009), IGF-1 would be a candidate to stimulate myelin formation via PI3K downstream signaling. However, we note that oligodendrocytes also respond with hypermyelination to elevated NRG1 expression, although NRG1 is dispensable for normal CNS myelin formation (Brinkmann et al., 2008). It thus appears that also unspecific stimulation of oligodendrocytes can trigger the adequate cell type-specific response (i.e., hypermyelination), provided that the receptors are coupled to the PI3-kinase pathway.
In the PNS, axonal NRG1 and glial ErbB2 are essential for Schwann cell proliferation and differentiation, axonal sorting, and the regulation of myelin sheath thickness (Jessen et al., 2005; Nave and Salzer, 2006). Thus, the peripheral phenotype of Pten mutant mice matches many aspects of enhanced NRG1/ErbB signaling and is compatible with the model that PI3K signaling is a critical second messenger pathway of myelination. Only the lack of hypermyelinated large-caliber axons, but findings of focal hypermyelination, points to a PIP3-induced cellular pathology that will be presented elsewhere (S. Goebbels, J. H. Oltrogge, and K.-A. Nave, unpublished observations).
Transgenic overexpression of a constitutively active AKT kinase is sufficient to enhance myelin membrane growth in the CNS via mTOR signaling (Narayanan et al., 2009; Tyler et al., 2009), but reportedly has no effect on peripheral myelination (Flores et al., 2008). Theoretically, the expression level of the transgene may have been too low in Schwann cells. However, in light of the data reported here, which include hypermyelination by Schwann cells, de novo myelination of small-caliber axons, and C-fiber wrapping, we note that the role of PIP3 and PTEN exceeds the regulation of AKT signaling in cells (Blanco-Aparicio et al., 2007; Kölsch et al., 2008). For example, the ability of PIP3 (and PTEN) to control the actin cytoskeleton has previously been implicated in cell polarity, motility, and membrane dynamics in a number of cellular systems (Charest and Firtel, 2007; Wu et al., 2007; Kölsch et al., 2008) and could also be involved in the early steps of myelination. The activity of GEFs (guanine nucleotide exchange factors), Rho GTPases (Rac1 and CDC42), and Rac effector proteins [such as WAVE (Wiskott–Aldrich syndrome protein family verprolin-homologous protein) and WASP (Wiskott–Aldrich syndrome protein) proteins] is regulated by PIP3 and leads to the localized polymerization of F-actin (Charest and Firtel, 2007). These proteins have been independently implicated in oligodendrocyte and Schwann cell development, process extension, axonal sorting, and myelination (Kim et al., 2006; Thurnherr et al., 2006; Bacon et al., 2007; Benninger et al., 2007; Nodari et al., 2007; Stendel et al., 2007). PTEN itself harbors a C-terminal PDZ (postsynaptic density-95/Discs large/zona occludens-1) binding motif and interacts with Par3 and Dlg1 (Adey et al., 2000; Feng et al., 2008). These polarity proteins are localized in noncompact myelin (Poliak et al., 2002; Bolino et al., 2004), where the addition of myelin membranes is thought to occur. It is intriguing that Par3 is required for the polarization of Schwann cells before myelination (Chan et al., 2006).
The ensheathment of axons by myelin, a spiral extension of the glial cell membrane, is generally considered one of the most complex cellular interactions in the nervous system. Also, in mixed brain cultures, glial cells only wrap axons but never dendrites (Lubetzki et al., 1993), suggesting a continued role of axon-specific myelination signals. Our finding that Schwann cells can ectopically “myelinate” collagen fibrils, a noncellular target lacking a membrane or complex signaling platform, reveals that wrapping does not require continued bidirectional exchange of signals with the Schwann cell, or axon-specific attractants. Rather, spiral wrapping emerges as a stereotyped response of membrane growth, as soon as elevated PIP3 levels stimulate Schwann cells above threshold. Collagen fibrils may not be completely inert, however, as their interaction with integrins may suffice to establish the polarity required for membrane outgrowth. Although Pten inactivation emerges as a powerful means to stimulate the early steps of myelination, MPZ-mediated compaction of Remak myelin was rare. We suggest that MPZ expression requires additional signals that may not be PIP3 dependent.
Conditional Pten mutants are relevant to several human diseases. Mutations in Pten have been linked to macrocephaly, mental retardation, and autism spectrum disorders (ASDs), although the causality remains unclear (Butler et al., 2005; Herman et al., 2007). Although the neuronal inactivation of murine Pten is accompanied by relevant behavioral abnormalities (Kwon et al., 2006), we suggest that PTEN-dependent functions in oligodendrocytes should also be considered. Given the observation that an initial overgrowth of cortical white matter has been documented in some ASD patients (Herbert et al., 2004), our mutants may help to model novel aspects of this disorder.
That mature oligodendrocytes maintain the response to developmental signals is encouraging. In multiple sclerosis lesions, OPCs respond to injury by local expansion in the demyelinated area, terminal differentiation, and myelin repair. However, insufficient remyelination is a frequent cause of axonal loss (Franklin and Ffrench-Constant, 2008). Although mutations of Pten are tumorigenic (Sansal and Sellers, 2004), the transient pharmacologic decrease of PTEN activity may be tolerated, and small molecule inhibitors (Rosivatz et al., 2006; Lai et al., 2007) could qualify as drug candidates to trigger remyelination.
Footnotes
This work was supported by Deutsche Forschungsgemeinschaft (Center for Molecular Physiology of the Brain) (K.-A.N., J.F.); the National Multiple Sclerosis Society, the Hertie Institute of Multiple Sclerosis Research, the Myelin Project, and Bundesministerium für Bildung und Forschung (Leukonet) (K.-A.N., M.J.R.); the European Community's Seventh Framework Programme (FP7/2007-1013) under Grant Agreement HEALTH-F2-2008-201535 (K.-A.N., S.G.); Deutsche Forschungsgemeinschaft Grant SFB 665 (I.B.); and the Swiss National Science Foundation and the National Center of Competence in Research “Neural Plasticity and Repair” (U.S.). We thank U. Bode for mouse genotyping, A. Fahrenholz for help with histology, G. Fricke-Bode for cell culture work, and T. Ruhwedel for help with electron microscopy. We gratefully acknowledge J. Archelos, C. Stiles, and M. Schachner for providing antibodies. We also thank P. Soriano for R26R-YFP indicator mice and members of the Nave Laboratory for helpful discussions.
References
- Adey NB, Huang L, Ormonde PA, Baumgard ML, Pero R, Byreddy DV, Tavtigian SV, Bartel PL. Threonine phosphorylation of the MMAC1/PTEN PDZ binding domain both inhibits and stimulates PDZ binding. Cancer Res. 2000;60:35–37. [PubMed] [Google Scholar]
- Bacon C, Lakics V, Machesky L, Rumsby M. N-WASP regulates extension of filopodia and processes by oligodendrocyte progenitors, oligodendrocytes, and Schwann cells—implications for axon ensheathment at myelination. Glia. 2007;55:844–858. doi: 10.1002/glia.20505. [DOI] [PubMed] [Google Scholar]
- Barros CS, Nguyen T, Spencer KS, Nishiyama A, Colognato H, Müller U. Beta1 integrins are required for normal CNS myelination and promote AKT-dependent myelin outgrowth. Development. 2009;136:2717–2724. doi: 10.1242/dev.038679. [DOI] [PMC free article] [PubMed] [Google Scholar]
- Benninger Y, Thurnherr T, Pereira JA, Krause S, Wu X, Chrostek-Grashoff A, Herzog D, Nave KA, Franklin RJ, Meijer D, Brakebusch C, Suter U, Relvas JB. Essential and distinct roles for cdc42 and rac1 in the regulation of Schwann cell biology during peripheral nervous system development. J Cell Biol. 2007;177:1051–1061. doi: 10.1083/jcb.200610108. [DOI] [PMC free article] [PubMed] [Google Scholar]
- Bibollet-Bahena O, Almazan G. IGF-1-stimulated protein synthesis in oligodendrocyte progenitors requires PI3K/mTOR/Akt and MEK/ERK pathways. J Neurochem. 2009;109:1440–1451. doi: 10.1111/j.1471-4159.2009.06071.x. [DOI] [PubMed] [Google Scholar]
- Blanco-Aparicio C, Renner O, Leal JF, Carnero A. PTEN, more than the AKT pathway. Carcinogenesis. 2007;28:1379–1386. doi: 10.1093/carcin/bgm052. [DOI] [PubMed] [Google Scholar]
- Boespflug-Tanguy O, Labauge P, Fogli A, Vaurs-Barriere C. Genes involved in leukodystrophies: a glance at glial functions. Curr Neurol Neurosci Rep. 2008;8:217–229. doi: 10.1007/s11910-008-0034-x. [DOI] [PubMed] [Google Scholar]
- Bolino A, Bolis A, Previtali SC, Dina G, Bussini S, Dati G, Amadio S, Del Carro U, Mruk DD, Feltri ML, Cheng CY, Quattrini A, Wrabetz L. Disruption of Mtmr2 produces CMT4B1-like neuropathy with myelin outfolding and impaired spermatogenesis. J Cell Biol. 2004;167:711–721. doi: 10.1083/jcb.200407010. [DOI] [PMC free article] [PubMed] [Google Scholar]
- Brinkmann BG, Agarwal A, Sereda MW, Garratt AN, Müller T, Wende H, Stassart RM, Nawaz S, Humml C, Velanac V, Radyushkin K, Goebbels S, Fischer TM, Franklin RJ, Lai C, Ehrenreich H, Birchmeier C, Schwab MH, Nave KA. Neuregulin-1/ErbB signaling serves distinct functions in myelination of the peripheral and central nervous system. Neuron. 2008;59:581–595. doi: 10.1016/j.neuron.2008.06.028. [DOI] [PMC free article] [PubMed] [Google Scholar]
- Butler MG, Dasouki MJ, Zhou XP, Talebizadeh Z, Brown M, Takahashi TN, Miles JH, Wang CH, Stratton R, Pilarski R, Eng C. Subset of individuals with autism spectrum disorders and extreme macrocephaly associated with germline PTEN tumour suppressor gene mutations. J Med Genet. 2005;42:318–321. doi: 10.1136/jmg.2004.024646. [DOI] [PMC free article] [PubMed] [Google Scholar]
- Carson MJ, Behringer RR, Brinster RL, McMorris FA. Insulin-like growth factor I increases brain growth and central nervous system myelination in transgenic mice. Neuron. 1993;10:729–740. doi: 10.1016/0896-6273(93)90173-o. [DOI] [PubMed] [Google Scholar]
- Chan JR, Jolicoeur C, Yamauchi J, Elliott J, Fawcett JP, Ng BK, Cayouette M. The polarity protein Par-3 directly interacts with p75NTR to regulate myelination. Science. 2006;314:832–836. doi: 10.1126/science.1134069. [DOI] [PubMed] [Google Scholar]
- Charest PG, Firtel RA. Big roles for small GTPases in the control of directed cell movement. Biochem J. 2007;401:377–390. doi: 10.1042/BJ20061432. [DOI] [PMC free article] [PubMed] [Google Scholar]
- Cho MH, Boss WF. Transmembrane signaling and phosphoinositides. Methods Cell Biol. 1995;49:543–554. doi: 10.1016/s0091-679x(08)61479-x. [DOI] [PubMed] [Google Scholar]
- de Waegh SM, Lee VM, Brady ST. Local modulation of neurofilament phosphorylation, axonal caliber, and slow axonal transport by myelinating Schwann cells. Cell. 1992;68:451–463. doi: 10.1016/0092-8674(92)90183-d. [DOI] [PubMed] [Google Scholar]
- Feng W, Wu H, Chan LN, Zhang M. Par-3-mediated junctional localization of the lipid phosphatase PTEN is required for cell polarity establishment. J Biol Chem. 2008;283:23440–23449. doi: 10.1074/jbc.M802482200. [DOI] [PubMed] [Google Scholar]
- Flores AI, Mallon BS, Matsui T, Ogawa W, Rosenzweig A, Okamoto T, Macklin WB. Akt-mediated survival of oligodendrocytes induced by neuregulins. J Neurosci. 2000;20:7622–7630. doi: 10.1523/JNEUROSCI.20-20-07622.2000. [DOI] [PMC free article] [PubMed] [Google Scholar]
- Flores AI, Narayanan SP, Morse EN, Shick HE, Yin X, Kidd G, Avila RL, Kirschner DA, Macklin WB. Constitutively active Akt induces enhanced myelination in the CNS. J Neurosci. 2008;28:7174–7183. doi: 10.1523/JNEUROSCI.0150-08.2008. [DOI] [PMC free article] [PubMed] [Google Scholar]
- Franklin RJ, Ffrench-Constant C. Remyelination in the CNS: from biology to therapy. Nat Rev Neurosci. 2008;9:839–855. doi: 10.1038/nrn2480. [DOI] [PubMed] [Google Scholar]
- Fraser MM, Bayazitov IT, Zakharenko SS, Baker SJ. Phosphatase and tensin homolog, deleted on chromosome 10 deficiency in brain causes defects in synaptic structure, transmission and plasticity, and myelination abnormalities. Neuroscience. 2008;151:476–488. doi: 10.1016/j.neuroscience.2007.10.048. [DOI] [PMC free article] [PubMed] [Google Scholar]
- Goldstein ME, House SB, Gainer H. NF-L and peripherin immunoreactivities define distinct classes of rat sensory ganglion cells. J Neurosci Res. 1991;30:92–104. doi: 10.1002/jnr.490300111. [DOI] [PubMed] [Google Scholar]
- Herbert MR, Ziegler DA, Makris N, Filipek PA, Kemper TL, Normandin JJ, Sanders HA, Kennedy DN, Caviness VS., Jr Localization of white matter volume increase in autism and developmental language disorder. Ann Neurol. 2004;55:530–540. doi: 10.1002/ana.20032. [DOI] [PubMed] [Google Scholar]
- Herman GE, Butter E, Enrile B, Pastore M, Prior TW, Sommer A. Increasing knowledge of PTEN germline mutations: two additional patients with autism and macrocephaly. Am J Med Genet A. 2007;143:589–593. doi: 10.1002/ajmg.a.31619. [DOI] [PubMed] [Google Scholar]
- Hirrlinger PG, Scheller A, Braun C, Hirrlinger J, Kirchhoff F. Temporal control of gene recombination in astrocytes by transgenic expression of the tamoxifen-inducible DNA recombinase variant CreERT2. Glia. 2006;54:11–20. doi: 10.1002/glia.20342. [DOI] [PubMed] [Google Scholar]
- Ishibashi T, Dakin KA, Stevens B, Lee PR, Kozlov SV, Stewart CL, Fields RD. Astrocytes promote myelination in response to electrical impulses. Neuron. 2006;49:823–832. doi: 10.1016/j.neuron.2006.02.006. [DOI] [PMC free article] [PubMed] [Google Scholar]
- Jessen KR, Mirsky R. The origin and development of glial cells in peripheral nerves. Nat Rev Neurosci. 2005;6:671–682. doi: 10.1038/nrn1746. [DOI] [PubMed] [Google Scholar]
- Kidd GJ, Heath JW. Myelin sheath survival following axonal degeneration in doubly myelinated nerve fibers. J Neurosci. 1991;11:4003–4014. doi: 10.1523/JNEUROSCI.11-12-04003.1991. [DOI] [PMC free article] [PubMed] [Google Scholar]
- Kim HJ, DiBernardo AB, Sloane JA, Rasband MN, Solomon D, Kosaras B, Kwak SP, Vartanian TK. WAVE1 is required for oligodendrocyte morphogenesis and normal CNS myelination. J Neurosci. 2006;26:5849–5859. doi: 10.1523/JNEUROSCI.4921-05.2006. [DOI] [PMC free article] [PubMed] [Google Scholar]
- Kölsch V, Charest PG, Firtel RA. The regulation of cell motility and chemotaxis by phospholipid signaling. J Cell Sci. 2008;121:551–559. doi: 10.1242/jcs.023333. [DOI] [PMC free article] [PubMed] [Google Scholar]
- König S, Hoffmann M, Mosblech A, Heilmann I. Determination of content and fatty acid composition of unlabeled phosphoinositide species by thin-layer chromatography and gas chromatography. Anal Biochem. 2008;378:197–201. doi: 10.1016/j.ab.2008.03.052. [DOI] [PubMed] [Google Scholar]
- Kwon CH, Luikart BW, Powell CM, Zhou J, Matheny SA, Zhang W, Li Y, Baker SJ, Parada LF. Pten regulates neuronal arborization and social interaction in mice. Neuron. 2006;50:377–388. doi: 10.1016/j.neuron.2006.03.023. [DOI] [PMC free article] [PubMed] [Google Scholar]
- Lai JP, Dalton JT, Knoell DL. Phosphatase and tensin homologue deleted on chromosome ten (PTEN) as a molecular target in lung epithelial wound repair. Br J Pharmacol. 2007;152:1172–1184. doi: 10.1038/sj.bjp.0707501. [DOI] [PMC free article] [PubMed] [Google Scholar]
- Lappe-Siefke C, Goebbels S, Gravel M, Nicksch E, Lee J, Braun PE, Griffiths IR, Nave KA. Disruption of Cnp1 uncouples oligodendroglial functions in axonal support and myelination. Nat Genet. 2003;33:366–374. doi: 10.1038/ng1095. [DOI] [PubMed] [Google Scholar]
- Leone DP, Genoud S, Atanasoski S, Grausenburger R, Berger P, Metzger D, Macklin WB, Chambon P, Suter U. Tamoxifen-inducible glia-specific Cre mice for somatic mutagenesis in oligodendrocytes and Schwann cells. Mol Cell Neurosci. 2003;22:430–440. doi: 10.1016/s1044-7431(03)00029-0. [DOI] [PubMed] [Google Scholar]
- Lesche R, Groszer M, Gao J, Wang Y, Messing A, Sun H, Liu X, Wu H. Cre/loxP-mediated inactivation of the murine Pten tumor suppressor gene. Genesis. 2002;32:148–149. doi: 10.1002/gene.10036. [DOI] [PubMed] [Google Scholar]
- Liang G, Cline GW, Macica CM. IGF-1 stimulates de novo fatty acid biosynthesis by Schwann cells during myelination. Glia. 2007;55:632–641. doi: 10.1002/glia.20496. [DOI] [PubMed] [Google Scholar]
- Lubetzki C, Demerens C, Anglade P, Villarroya H, Frankfurter A, Lee VM, Zalc B. Even in culture, oligodendrocytes myelinate solely axons. Proc Natl Acad Sci U S A. 1993;90:6820–6824. doi: 10.1073/pnas.90.14.6820. [DOI] [PMC free article] [PubMed] [Google Scholar]
- Maier O, Hoekstra D, Baron W. Polarity development in oligodendrocytes: sorting and trafficking of myelin components. J Mol Neurosci. 2008;35:35–53. doi: 10.1007/s12031-007-9024-8. [DOI] [PubMed] [Google Scholar]
- Maurel P, Salzer JL. Axonal regulation of Schwann cell proliferation and survival and the initial events of myelination requires PI 3-kinase activity. J Neurosci. 2000;20:4635–4645. doi: 10.1523/JNEUROSCI.20-12-04635.2000. [DOI] [PMC free article] [PubMed] [Google Scholar]
- Ménager C, Arimura N, Fukata Y, Kaibuchi K. PIP3 is involved in neuronal polarization and axon formation. J Neurochem. 2004;89:109–118. doi: 10.1046/j.1471-4159.2004.02302.x. [DOI] [PubMed] [Google Scholar]
- Michailov GV, Sereda MW, Brinkmann BG, Fischer TM, Haug B, Birchmeier C, Role L, Lai C, Schwab MH, Nave KA. Axonal neuregulin-1 regulates myelin sheath thickness. Science. 2004;304:700–703. doi: 10.1126/science.1095862. [DOI] [PubMed] [Google Scholar]
- Narayanan SP, Flores AI, Wang F, Macklin WB. Akt signals through the mammalian target of rapamycin pathway to regulate CNS myelination. J Neurosci. 2009;29:6860–6870. doi: 10.1523/JNEUROSCI.0232-09.2009. [DOI] [PMC free article] [PubMed] [Google Scholar]
- Nave KA, Salzer JL. Axonal regulation of myelination by neuregulin 1. Curr Opin Neurobiol. 2006;16:492–500. doi: 10.1016/j.conb.2006.08.008. [DOI] [PubMed] [Google Scholar]
- Nave KA, Trapp BD. Axon-glial signaling and the glial support of axon function. Annu Rev Neurosci. 2008;31:535–561. doi: 10.1146/annurev.neuro.30.051606.094309. [DOI] [PubMed] [Google Scholar]
- Nodari A, Zambroni D, Quattrini A, Court FA, D'Urso A, Recchia A, Tybulewicz VL, Wrabetz L, Feltri ML. Beta1 integrin activates Rac1 in Schwann cells to generate radial lamellae during axonal sorting and myelination. J Cell Biol. 2007;177:1063–1075. doi: 10.1083/jcb.200610014. [DOI] [PMC free article] [PubMed] [Google Scholar]
- Ogata T, Iijima S, Hoshikawa S, Miura T, Yamamoto S, Oda H, Nakamura K, Tanaka S. Opposing extracellular signal-regulated kinase and Akt pathways control Schwann cell myelination. J Neurosci. 2004;24:6724–6732. doi: 10.1523/JNEUROSCI.5520-03.2004. [DOI] [PMC free article] [PubMed] [Google Scholar]
- Palacios N, Sánchez-Franco F, Fernández M, Sánchez I, Cacicedo L. Intracellular events mediating insulin-like growth factor I-induced oligodendrocyte development: modulation by cyclic AMP. J Neurochem. 2005;95:1091–1107. doi: 10.1111/j.1471-4159.2005.03419.x. [DOI] [PubMed] [Google Scholar]
- Poliak S, Matlis S, Ullmer C, Scherer SS, Peles E. Distinct claudins and associated PDZ proteins form different autotypic tight junctions in myelinating Schwann cells. J Cell Biol. 2002;159:361–372. doi: 10.1083/jcb.200207050. [DOI] [PMC free article] [PubMed] [Google Scholar]
- Raval-Fernandes S, Rome LH. Role of axonal components during myelination. Microsc Res Tech. 1998;41:379–392. doi: 10.1002/(SICI)1097-0029(19980601)41:5<379::AID-JEMT5>3.0.CO;2-L. [DOI] [PubMed] [Google Scholar]
- Rosivatz E, Matthews JG, McDonald NQ, Mulet X, Ho KK, Lossi N, Schmid AC, Mirabelli M, Pomeranz KM, Erneux C, Lam EW, Vilar R, Woscholski R. A small molecule inhibitor for phosphatase and tensin homologue deleted on chromosome 10 (PTEN) ACS Chem Biol. 2006;1:780–790. doi: 10.1021/cb600352f. [DOI] [PubMed] [Google Scholar]
- Salzer JL. Polarized domains of myelinated axons. Neuron. 2003;40:297–318. doi: 10.1016/s0896-6273(03)00628-7. [DOI] [PubMed] [Google Scholar]
- Sánchez I, Hassinger L, Paskevich PA, Shine HD, Nixon RA. Oligodendroglia regulate the regional expansion of axon caliber and local accumulation of neurofilaments during development independently of myelin formation. J Neurosci. 1996;16:5095–5105. doi: 10.1523/JNEUROSCI.16-16-05095.1996. [DOI] [PMC free article] [PubMed] [Google Scholar]
- Sansal I, Sellers WR. The biology and clinical relevance of the PTEN tumor suppressor pathway. J Clin Oncol. 2004;22:2954–2963. doi: 10.1200/JCO.2004.02.141. [DOI] [PubMed] [Google Scholar]
- Soriano P. Generalized lacZ expression with the ROSA26 Cre reporter strain. Nat Genet. 1999;21:70–71. doi: 10.1038/5007. [DOI] [PubMed] [Google Scholar]
- Srinivas S, Watanabe T, Lin CS, William CM, Tanabe Y, Jessell TM, Costantini F. Cre reporter strains produced by targeted insertion of EYFP and ECFP into the ROSA26 locus. BMC Dev Biol. 2001;1:4. doi: 10.1186/1471-213X-1-4. [DOI] [PMC free article] [PubMed] [Google Scholar]
- Stendel C, Roos A, Deconinck T, Pereira J, Castagner F, Niemann A, Kirschner J, Korinthenberg R, Ketelsen UP, Battaloglu E, Parman Y, Nicholson G, Ouvrier R, Seeger J, De Jonghe P, Weis J, Krüttgen A, Rudnik-Schöneborn S, Bergmann C, Suter U, et al. Peripheral nerve demyelination caused by a mutant Rho GTPase guanine nucleotide exchange factor, Frabin/FGD4. Am J Hum Genet. 2007;81:158–164. doi: 10.1086/518770. [DOI] [PMC free article] [PubMed] [Google Scholar]
- Suter U, Scherer SS. Disease mechanisms in inherited neuropathies. Nat Rev Neurosci. 2003;4:714–726. doi: 10.1038/nrn1196. [DOI] [PubMed] [Google Scholar]
- Taveggia C, Zanazzi G, Petrylak A, Yano H, Rosenbluth J, Einheber S, Xu X, Esper RM, Loeb JA, Shrager P, Chao MV, Falls DL, Role L, Salzer JL. Neuregulin-1 type III determines the ensheathment fate of axons. Neuron. 2005;47:681–694. doi: 10.1016/j.neuron.2005.08.017. [DOI] [PMC free article] [PubMed] [Google Scholar]
- Thurnherr T, Benninger Y, Wu X, Chrostek A, Krause SM, Nave KA, Franklin RJ, Brakebusch C, Suter U, Relvas JB. Cdc42 and Rac1 signaling are both required for and act synergistically in the correct formation of myelin sheaths in the CNS. J Neurosci. 2006;26:10110–10119. doi: 10.1523/JNEUROSCI.2158-06.2006. [DOI] [PMC free article] [PubMed] [Google Scholar]
- Toma JS, McPhail LT, Ramer MS. Differential RIP antigen (CNPase) expression in peripheral ensheathing glia. Brain Res. 2007;1137:1–10. doi: 10.1016/j.brainres.2006.12.053. [DOI] [PubMed] [Google Scholar]
- Tyler WA, Gangoli N, Gokina P, Kim HA, Covey M, Levison SW, Wood TL. Activation of the mammalian target of rapamycin (mTOR) is essential for oligodendrocyte differentiation. J Neurosci. 2009;29:6367–6378. doi: 10.1523/JNEUROSCI.0234-09.2009. [DOI] [PMC free article] [PubMed] [Google Scholar]
- van Diepen MT, Eickholt BJ. Function of PTEN during the formation and maintenance of neuronal circuits in the brain. Dev Neurosci. 2008;30:59–64. doi: 10.1159/000109852. [DOI] [PubMed] [Google Scholar]
- Werner HB, Kuhlmann K, Shen S, Uecker M, Schardt A, Dimova K, Orfaniotou F, Dhaunchak A, Brinkmann BG, Möbius W, Guarente L, Casaccia-Bonnefil P, Jahn O, Nave KA. Proteolipid protein is required for transport of sirtuin 2 into CNS myelin. J Neurosci. 2007;27:7717–7730. doi: 10.1523/JNEUROSCI.1254-07.2007. [DOI] [PMC free article] [PubMed] [Google Scholar]
- Wu H, Feng W, Chen J, Chan LN, Huang S, Zhang M. PDZ domains of Par-3 as potential phosphoinositide signaling integrators. Mol Cell. 2007;28:886–898. doi: 10.1016/j.molcel.2007.10.028. [DOI] [PubMed] [Google Scholar]