

Abstract
The classically conditioned eyeblink response in the rabbit is one of the best-characterized behavioral models of associative learning. It is cerebellum dependent, with many studies indicating that the hemispheral part of Larsell's cerebellar cortical lobule VI (HVI) is critical for the acquisition and performance of learned responses. However, there remain uncertainties about the distribution of the critical regions within and around HVI. In this learning, the unconditional stimulus is thought to be carried by periocular-activated climbing fibers. Here, we have used a microelectrode array to perform systematic, high-resolution, electrophysiological mapping of lobule HVI and surrounding folia in rabbits, to identify regions with periocular-evoked climbing fiber activity. Climbing fiber local field potentials and single-unit action potentials were recorded, and electrode locations were reconstructed from histological examination of brain sections. Much of the sampled cerebellar cortex, including large parts of lobule HVI, was unresponsive to periocular input. However, short-latency ipsilateral periocular-evoked climbing fiber responses were reliably found within a region in the ventral part of the medial wall of lobule HVI, extending to the base of the primary fissure. Small infusions of the AMPA/kainate receptor antagonist CNQX into this electrophysiologically defined region in awake rabbits diminished or abolished conditioned responses. The known parasagittal zonation of the cerebellum, supported by zebrin immunohistochemistry, indicates that these areas have connections consistent with an essential role in eyeblink conditioning. These small eyeblink-related areas provide cerebellar cortical targets for analysis of eyeblink conditioning at a neuronal level but need to be localized with electrophysiological identification in individual animals.
Introduction
Fundamental to understanding memory mechanisms is “to produce a comprehensive model of memory storage that flows from molecules to behavior with all of the intermediate steps defined” (Linden, 2003). In this quest, the classically conditioned eyeblink/nictitating membrane response (NMR) is a major model system.
After training with repeated pairings of a neutral conditional stimulus (CS) (typically auditory or visual) with a reflex eyeblink-evoking unconditional stimulus (US) (typically a corneal air puff or electrical periocular stimulation), the CS itself comes to elicit a learned eyeblink, or conditioned response (CR). This learning has been extensively studied in rabbits, using displacement of the nictitating membrane as a convenient response parameter free from voluntary movements (Gormezano et al., 1962; Yeo and Hesslow, 1998).
Eyeblink conditioning is known to be cerebellum dependent (McCormick et al., 1981; Lincoln et al., 1982; Yeo et al., 1984). Lesion and pharmacological inactivation studies in rabbits have identified the hemispheral part of Larsell's cerebellar cortical lobule VI (HVI), in the posterior lobe, as critical for acquisition and performance of CRs (Yeo et al., 1985b; Yeo and Hardiman, 1992; Attwell et al., 2001, 2002), although others have suggested that areas in the anterior lobe are important (Perrett et al., 1993; Garcia et al., 1999). Convergent evidence indicates that US information is relayed to the cerebellum by climbing fibers (Mauk et al., 1986; Yeo et al., 1986; Kim et al., 1998; Medina et al., 2002), whereas mossy fibers convey CS information (Hesslow et al., 1999).
The intrinsic circuitry of the cerebellar cortex is well characterized, and its fundamental organization into parasagittal divisions has been revealed in great detail (Andersson and Oscarsson, 1978; Voogd and Glickstein, 1998; Sugihara and Shinoda, 2004, 2007; Voogd and Ruigrok, 2004). Specific olivo-cortico-nuclear connections form sets of functionally distinct compartments that, at the cortical level, are seen as “zones” with specific electrophysiological and cytochemical identities. Cerebellar cortical neurons involved in eyeblink conditioning should be localized to discrete zones (or their subdivisions, “microzones”) containing Purkinje cells that project to the anterior interposed nucleus and that receive US-related, periocular-activated climbing fibers from the dorsal accessory olive (DAO), because both these structures are essential in eyeblink conditioning (McCormick and Thompson, 1984b; McCormick et al., 1985; Yeo et al., 1985a, 1986). Electrophysiological studies in decerebrate cats and ferrets have identified discrete microzones of this type that are considered to be eyeblink controlling, including in lobule HVI (Ivarsson and Hesslow, 1993; Hesslow, 1994a,b).
Neurophysiological analysis of eyeblink conditioning in the cerebellum requires recordings during behavior from neurons that play an essential role. Our objective is to identify eyeblink/NMR-related microzones and to test their function in awake rabbits, the species in which this behavior is best studied. We used high-resolution electrophysiological techniques to map periocular-evoked climbing fiber activity in and around lobule HVI. We demonstrate, using local pharmacological inactivation in awake animals, that electrophysiologically defined eyeblink-related microzones in lobule HVI are important for CR expression. Thus, we identify, with precision, cerebellar cortical targets for functional studies of learning at the neuronal level.
Materials and Methods
Animals and anesthesia
Experiments were performed in adult female rabbits (2.6–4.4 kg). Fourteen animals (10 pigmented Murex, four New Zealand white) were subjects of acute mapping experiments; five (pigmented Murex) were chronically implanted with recording chambers for awake electrophysiological recording and targeted pharmacological inactivations during behavior. All procedures were approved by the local ethical review panel of the University of Cambridge and were in accordance with the United Kingdom Home Office Animals (Scientific Procedures) Act.
Acute experiments.
Animals in acute experiments were anesthetized with 1.5 g/kg intravenous urethane and an initial dose of 0.03/1 mg fentanyl/fluanisone intramuscularly (Hypnorm; Vetapharma). Heart rate, ventilation rate, and arterial blood oxygen saturation were monitored continuously, and the depth of anesthesia was maintained to eliminate nociceptive limb-withdrawal reflexes with supplementary doses of 0.015/0.5 mg fentanyl/fluanisone as required. Immediately before surgery, animals received 30–40 ml of 20% mannitol solution intravenously (infused at 2 ml/min) to reduce CSF volume and hence the risk of herniation through the craniotomy.
Chronic experiments.
Anesthesia was induced by a bolus of 0.13/4 mg/kg fentanyl/fluanisone intramuscularly (Hypnorm). Tracheal intubation was performed after an intravenous injection of 0.2 mg/kg diazepam (CP Pharmaceuticals), and anesthesia was maintained on 1–2% isoflurane delivered in 2:1 O2 and N2O at a total flow rate of 1.2–2 L/min across an Ayre's T-piece. After transfer to isoflurane, an intravenous injection of the opioid antagonist naloxone (20–40 μg; CP Pharmaceuticals) was given to reverse the respiratory depression induced by fentanyl. Physiological parameters were continuously monitored as described above, and depth of anesthesia was maintained by regulating isoflurane delivery as required. Postoperative analgesia was maintained for 3 d with daily buprenorphine (0.05 mg, i.m.; Vetergesic; Reckitt-Benckiser Healthcare) and 0.5 mg/kg oral meloxicam (Meloxidyl; Ceva Sante Animale). Perioperative antibiotic prophylaxis was provided by 20 mg intramuscular bolus doses of enrofloxacin (Baytril; Bayer) administered 12–24 h before and immediately after surgery.
Surgery
In surgery for both acute and chronic experiments, the head was placed on a custom-designed stereotaxic head holder. A midline incision was made to expose the skull suture landmarks, lambda and bregma. The head was oriented to set lambda 4.2 mm above bregma in the vertical plane, our desired stereotaxic position (after Yeo et al., 1985a). A craniotomy was made over the anterior part of the right hemi-cerebellum, aiming for lobule HVI.
In chronic animals, a cylindrical chamber made from a biologically inert polymer (acetal) was implanted over the craniotomy and embedded in dental acrylic (Simplex Rapid; Kemdent). Anteriorly, a dental acrylic headpiece with three embedded sets of stainless steel M2 threaded nuts was built up over the cranium. The top of the headpiece was made horizontal when the head was in the correct stereotaxic position. During recording, animals were awake in a custom-built restraining stock with the head stabilized in the stereotaxic plane by attaching the headpiece to a horizontal beam. After surgery, the chamber was cleaned with saline and an antibiotic solution (enrofloxacin, ∼2 mg/ml; Baytril; Bayer) every 2 d. This procedure required placing the animals into the restraining stock, and thus they were habituated to the recording setup before the recordings commenced. A reference mark on the rim of the chamber gave coordinates relative to lambda.
Electrophysiological recording
Recordings were made with an Eckhorn 7 system (Thomas Recording) (Eckhorn and Thomas, 1993) mounted on a stereotaxic manipulator, with up to seven independently movable quartz-insulated, platinum-tungsten fiber microelectrodes (impedance of 0.5–4 MΩ) in a linear array with 300 μm spacing between adjacent electrodes. These electrodes are very fine (80 μm shaft outside diameter) and pass through 70-mm-long guide tubes (100 μm inside diameter) before entering the brain, which ensures that the array is linear and parallel at this point. The electrodes pass into the brain with very little tissue compression or damage yet are strong enough to penetrate the dura (Eckhorn and Thomas, 1993). In these experiments, we removed the dura (acute experiments) or used sharpened guide tubes to penetrate the dura (chronic experiments). Signals were filtered (30–300 Hz bandpass for field potentials, 1–10 kHz for single units; Neurolog; Digitimer) and digitized (sampling rate of 5 kHz for field potentials and 25 kHz for single units; Micro1401; Cambridge Electronic Design). Penetrations were made vertically, with the linear array in the coronal plane. Multiple penetrations were made at known stereotaxic coordinates in the dorsoventral, mediolateral, and rostrocaudal planes. Local field potential (LFP) recordings were made by systematically advancing the array through the tissue at regular step intervals (200–400 μm) and recording the activity evoked by electrical stimulation. In chronic animals, the position of penetrations over successive days was noted relative to the reference mark on the chamber. In acute experiments, the dura mater was removed, whereas in chronic animals, sharpened guide cannulae were used to enable electrodes to be advanced through it.
Electrical stimulation
In mapping experiments, electrical stimuli were delivered to the periocular skin (both acute and chronic animals) and forelimbs (acute animals only) at a rate of 0.8 Hz. These periocular stimuli were set to intensities that did not evoke reflex whole eyelid or nictitating membrane responses and were used for climbing fiber receptive field determination. For this “low-intensity” stimulation, two stimuli—each consisting of single or double (3 ms interval) 0.2 ms duration biphasic pulses—were delivered 40 ms apart. Intensities were adjusted to be just above threshold for eliciting a local muscle twitch (typically 1–3 mA). In acute, anesthetized animals, stimulus delivery was through a pair of percutaneous 25 gauge needles in the distal forelimb, vibrissal, and periocular skin. In chronic, awake animals, periocular stimuli were delivered through a pair of 12 × 2.5 mm stainless steel Michel surgical clips crimped to the skin temporal and inferior to the eye, within a few millimeters of the eyelid margin. For a description of stimuli used in the eyeblink conditioning paradigm in awake animals, see below (Behavioral conditioning).
Histology and electrode location reconstructions
Before the termination of both acute and chronic experiments, two electrolytic lesions at a specified distance apart (2.5–4 mm) were made by passing ∼50 μA cathodal current for 3 s through a dedicated lesion-making electrode within the array (typical impedance of 100–300 kΩ). Animals were deeply anesthetized and transcardially perfused with heparinized 0.01 m 0.9% PBS solution, pH 7.4, and then 0.1 m 4% phosphate-buffered paraformaldehyde (PFA). Blocks of brain tissue including the whole cerebellum were cut in the stereotaxic coronal plane and postfixed in 4% PFA, embedded in 10% gelatin. Three guide holes were made in the blocks (within the vermis and lateral hemispheres) using a 20 gauge needle; these were perpendicular to the face of the block cut in the stereotaxic plane to allow alignment of different sections in the mediolateral and dorsoventral planes. The blocks were coronally sectioned on a freezing microtome at a known thickness (50–100 μm). Sections were Nissl stained (cresyl violet), and, in most experiments, a series of sections was stained for zebrin II (aldolase C) immunoreactivity.
For zebrin immunostaining, the sections were incubated in 0.1% hydrogen peroxide for 30 min and then placed in 10% normal goat serum (NGS) for 1 h. They were incubated overnight in mouse anti-zebrin primary antibody (1:4000 in 5% NGS; Prof. R. Hawkes, University of Calgary, Calgary, Alberta, Canada). The sections were then washed and incubated with biotinylated goat anti-mouse antibody (1:200 in 1.5% NGS) for 2 h. Sections were washed again and immersed in ExtrAvidin-peroxidase (1:1000; Sigma) overnight. They were washed, buffered with Tris, pH 7.4 (1:15; Sigma), and incubated with diaminobenzidine (0.05% w/v in 0.01% peroxide) until zebrin-positive stripes developed.
In 11 acute experiments for which this was possible, estimated reconstructions of electrode tracks based on the location of the electrolytic lesions were made on high-resolution digital scans of the sections using the CorelDraw graphics package (Corel). The presence of two lesions on the lesion-making electrode track allowed the direction of travel of the electrode array to be determined. It was assumed that all electrodes in the array moved parallel to the lesion maker in the coronal plane with a separation of 300 μm between adjacent tracks. The measured distance between the lesions in histological sections provided an estimate of fixation-related tissue shrinkage (typically ∼10%), which was accounted for in the reconstructions. An example of a section containing two lesions is shown in supplemental Figure 2 (available at www.jneurosci.org as supplemental material).
Areas with the relevant climbing fiber activity were determined and mapped onto a standard series of coronal sections (after Yeo and Hardiman, 1992) labeled according to rostrocaudal position relative to lambda. Sections rostral to lambda are given positive (and caudal sections, negative) values. These sections were originally based on the cerebella of ∼2.5 kg Dutch-belted rabbits, but they fit very well with the histology from the experiments presented here.
Behavioral conditioning
Classical conditioning of the eyeblink response was performed using a 1 kHz (three animals) or 8 kHz (two animals) sine-wave tone CS at 85 dB sound pressure level (SPL). Background noise intensity was ∼47 dB SPL. The US was delivered electrically to the right periocular area through a pair of Michel clips (see above, Electrical stimulation) as a 60 ms biphasic square wave of period 20 ms (two animals) or three 1 ms duration biphasic pulses with onsets 30 ms apart (three animals). A CS–US interval of 350 ms (four animals) or 500 ms (one animal) was used in a delay conditioning protocol with coterminating CS and US. Intertrial intervals were pseudorandomized at 20 ± 3 s. US intensity was adjusted to elicit an unconditioned nictitating membrane response of >2 mm (typically 1.5–2 mA). Every 10th CS presentation was not paired with a US. NMRs were recorded by means of an implanted suture loop attached via a universal jointed lever to a low-torque potentiometer (Gruart and Yeo, 1995). The output of this isotonic transducer was low-pass filtered (100 Hz) and digitized at a sampling rate of 1 kHz (Micro1401; Cambridge Electronic Design).
Pharmacological inactivations
In five chronically implanted animals, the AMPA/kainate-receptor antagonist 6-cyano-7-nitroquinoxaline-2,3-dione (CNQX) was infused into identified periocular microzones [CNQX disodium salt (Tocris Bioscience), 3 mm in 0.01 m PBS, pH 7.3]. The Eckhorn multielectrode system allows the incorporation of fine capillaries into the linear array. These are quartz glass micropipettes, with shaft outside diameter of 100 μm, tip diameter of 30 μm, and inside diameter of 10 μm (Thomas Recording). We used three or four recording electrodes and one capillary for drug delivery in a coronal, linear array with a mediolateral spacing of 300 or 600 μm. The electrodes were advanced through the cerebellum, and LFPs evoked by low-intensity ipsilateral and contralateral periocular stimulation were recorded systematically through the tissue as described above. Infusions were made either “on target,” i.e., delivered with the cannula tip at a depth at which adjacent electrodes recorded the largest-amplitude periocular microzone field potential, or were control infusions delivered at least 3 mm dorsal to an identified periocular microzone. The drug was infused at a rate of 0.2 μl/min. Periocular-evoked LFPs were recorded at frequent intervals, usually between blocks of 10 behavioral trials. At least 20 preinfusion control behavioral trials were performed. Presentation of trials continued until recovery of the behavior in cases in which the infusion had an effect or for at least 20 min after infusion in which there was no observed effect. To minimize tissue damage, a limited number (two or three) cannula penetrations were made in each animal.
Data analysis
Neural data were recorded online using Spike2 software (Cambridge Electronic Design). Single-unit activity was discriminated from the raw data using the LabSpike program (Dr. G. S. Bhumbra, University of Cambridge, Cambridge, UK; available at http://www.pdn.cam.ac.uk/staff/dyball/labspike.html). Analysis of neural and behavioral data was performed offline using custom-written scripts in MATLAB (MathWorks).
Evoked LFP activity is presented as averages of 20 trials. Onset latencies were determined from inflections in the averaged trace, and groups were compared using two-tailed, unmatched Wilcoxon's rank-sum tests. When the amplitude of periocular-evoked LFPs were quantified, this was done by integrating the rectified averaged trace in a 5–40 ms window after stimulus onset and subtracting from it an equivalently generated integral for the 35 ms period immediately before the stimulus. NMR amplitude was taken to be the maximum displacement during the CS–US interval; a threshold criterion of 0.25 mm was used to determine CR success (Hardiman and Yeo, 1992). Behavioral data are presented as the mean and SEM of the NMR amplitude for blocks of 10 consecutive trials. One-tailed Wilcoxon's rank-sum tests were applied to compare NMR amplitudes in each block of postinfusion trials with two blocks of preinfusion control trials. For grouped data in the drug infusion experiments, NMR and LFP amplitudes are expressed as integrated areas of the responses normalized relative to the preinfusion baseline amplitude.
Results
Characteristics of peripherally evoked climbing fiber field potentials in anesthetized and awake animals
Identification of eyeblink-related microzones is contingent on the ability to detect periocular-evoked climbing fiber activity. Our principal approach has been to record LFPs, which are thought to represent predominantly postsynaptic responses and are useful for recording the mass activity evoked by the two cerebellar input systems, the mossy fibers and olivocerebellar climbing fibers (Eccles et al., 1967; Ekerot et al., 1979; Offenhauser et al., 2005). As has been established previously, a number of criteria allow climbing fiber-evoked potentials to be distinguished from those generated by mossy fiber activity, in particular, the following: (1) the onset latency of climbing fiber field potentials (CFPs) are always >9 ms and therefore longer than those dependent on most direct pathways terminating as mossy fibers (Ekerot and Larson, 1973); and (2) CFPs are depressed after a second stimulus delivered 40 ms after the first, whereas mossy fiber field potentials (MFPs) are usually unchanged or facilitated (Fig. 1A,B) (Armstrong and Harvey, 1968; Apps and Lee, 1999; Pardoe et al., 2004). As verification, we recorded single-unit Purkinje cells (in both awake and anesthetized animals) in which the evoked complex spike activity mirrored components of the field potential ascribed to climbing fiber activity at the same location (Fig. 2).
Figure 1.

A, Periocular-evoked LFP recordings made in an awake rabbit (average of 20 trials). Two pairs of periocular stimuli (3 ms interval) are presented 40 ms apart (arrows). Mossy fiber potentials (MF) follow the second pair of stimuli, whereas a longer-latency climbing fiber component (CF) is markedly depressed. B, For the same trace as in A, evoked field potentials from the first pair and second pair of stimuli (solid and dotted lines, respectively) are overlaid on an expanded time base. The mossy fiber potentials (MF) show two peaks 3 ms apart, representing activity evoked by each pulse in the paired stimulus: the later peak dominates after the first stimulus pair (solid line), whereas the earlier peak is more prominent after the second pair (dotted line), indicating a facilitated response to the first pulse. In contrast, the climbing fiber potential (CF) is depressed after the second pair. C, An example of covarying, congruent MFPs and CFPs, shown for the same electrode track in which the activity in A and B was recorded. The traces show the average periocular-evoked LFPs (20 trials) to the first stimulus pair only, at seven consecutive depths in the electrode track (dorsal to ventral, top to bottom; 200 μm steps; calibration: 10 ms, 100 μV). The trace marked with a star is the same as that illustrated in A and B.
Figure 2.
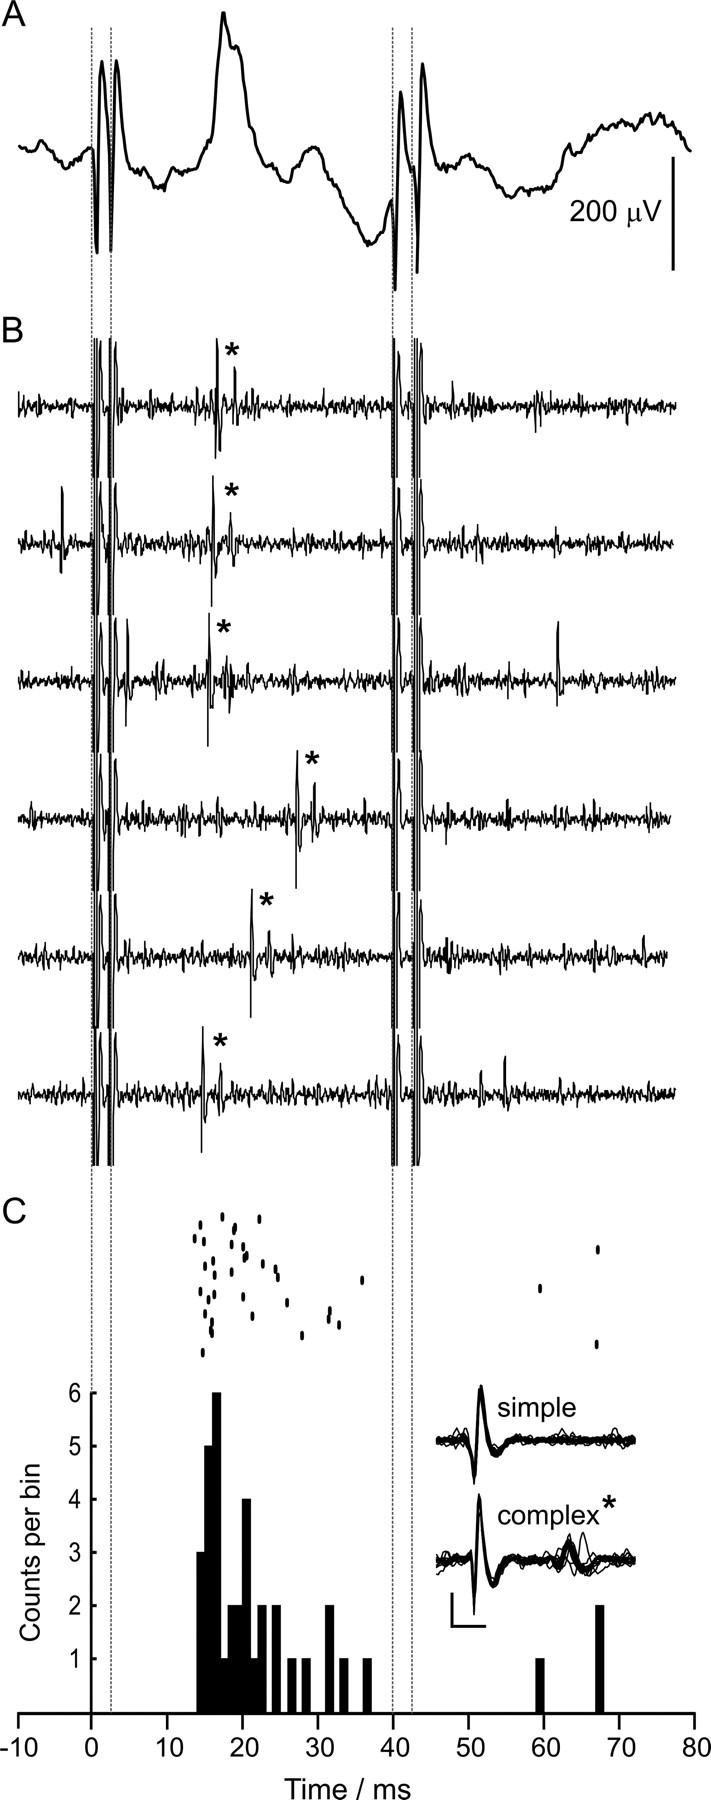
Periocular-evoked climbing fiber activity in a periocular microzone. Two pairs of stimuli are presented 40 ms apart (dotted lines, stimulus artifacts in A and B), an example of low-intensity periocular stimulation (see Materials and Methods, Electrical stimulation). A, An example of a periocular-evoked CFP from a periocular microzone (average of 20 trials, onset latency 14 ms). B, Single trials from a Purkinje cell recording made at the same location; complex spikes are evoked by the first pair of stimuli and are indicated by an asterisk. C, Raster and peristimulus time histogram for complex spikes of the same Purkinje cell showing strongly evoked activity that mirrors the time course of the LFP (50 trials, bin width of 1 ms). Overlays from 20 simple and complex spikes from the recording are shown (calibration: 1 ms, 0.5 mV). Note that the evoked climbing fiber activity is characteristically diminished after second pair of stimuli. In this example, stimulation of the forelimbs did not evoke a climbing fiber LFP or complex spikes in the Purkinje cell (data not shown).
To sample this activity systematically across lobules, we used a high-resolution mapping approach, recording LFP activity using a microelectrode array advanced at regular depth intervals (typically 200 μm) through the cerebellar cortex, in both anesthetized and awake rabbits. Each preparation has particular advantages: anesthesia allows the flexibility to deliver a range of stimuli over a long experimental period, whereas recordings in awake animals are free from potential interference from anesthetic agents (for a discussion, see Bengtsson and Jörntell, 2007). In practice, evoked potentials were qualitatively similar in both preparations (compare LFPs in Figs. 1C, 5E).
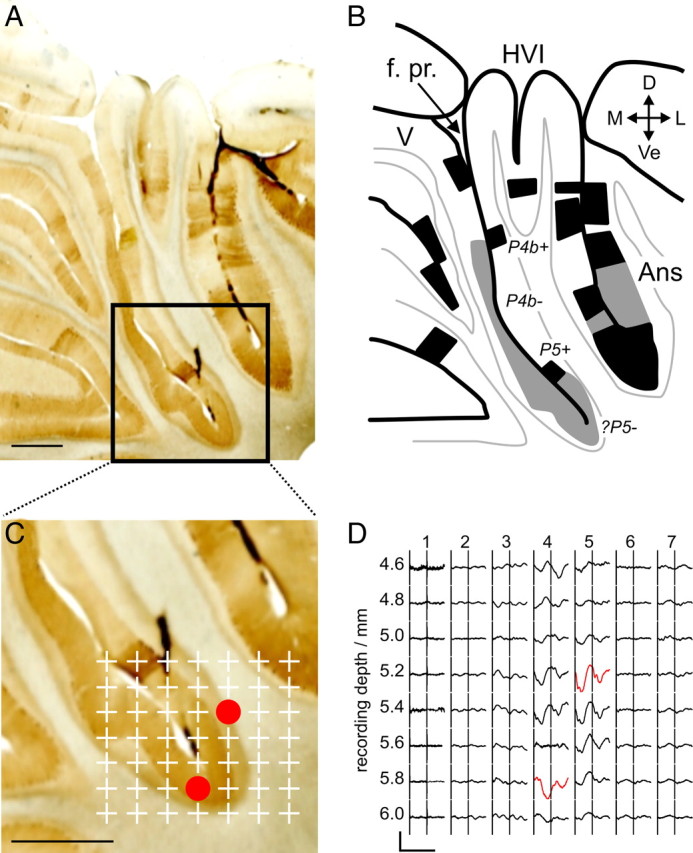
Figure 5.
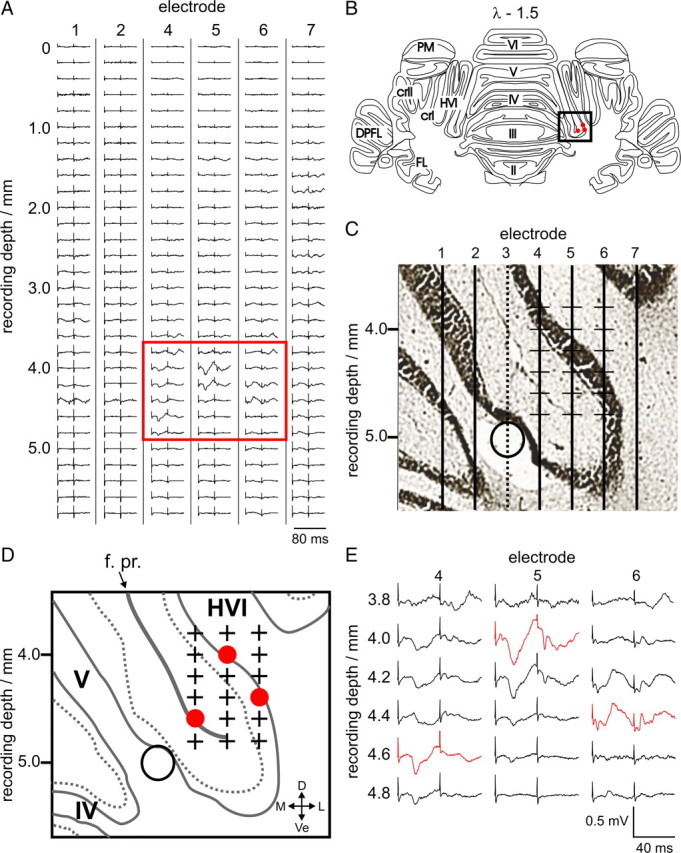
Example single penetration of a microelectrode array in an anesthetized rabbit. A, Evoked LFP activity from ipsilateral periocular stimulation shown for every recording site, for each of the six recording microelectrodes in the array (#1, #2, #4–7; averages of 20 trials). At each step, the array was advanced 200 μm. Two low-intensity electrical stimuli (see Materials and Methods, Electrical stimulation) were delivered 40 ms apart, the timing of which can be seen from the positions of the stimulus artifacts. A box highlights the region with periocular-evoked climbing fiber activity consistent with a periocular microzone; these traces are expanded in E. These tracks are 4.3, 4.6, and 4.9 mm lateral to the estimated midline. Bilateral forelimb and vibrissal stimulation did not evoke climbing fiber activity in this region (data not shown). C shows an expanded histological reconstruction of the estimated path of the electrodes (vertical lines) based on the presence of electrolytic lesions (open circle) made using the lesion-making electrode (#3); the location of this portion of the reconstruction represented on an annotated standard coronal section (at 1.5 mm caudal to lambda; λ − 1.5) is illustrated by the box in B. Red circles in B indicate the estimated location of the largest-amplitude periocular CFP in each electrode track. An annotated diagram of the region shown in C, labeling the lobules, primary fissure, and anatomical directions is drawn in D. The estimated recording locations of the evoked LFPs shown in the box in A and expanded in E are highlighted with plus signs. Red circles in D represent the locations of the largest-amplitude periocular-evoked CFPs on each of the electrode tracks (red traces in E). These points are also projected on to the standard coronal section in B. PM, Paramedian lobule; cr I, crus I; cr II, crus II; DPFL, dorsal paraflocculus; FL, flocculus; f. pr., primary fissure; D, dorsal; Ve, ventral; M, medial; L, lateral.
In lobule HVI and surrounding cortex, we were able to record CFPs that could be categorized into two groups based principally on receptive field and onset latency. In the first group, CFPs had receptive fields restricted to the ipsilateral periocular area with shorter average onset latency. These are likely to originate from periocular microzones of parasagittal climbing fiber zones that have focal, ipsilateral peripheral receptive fields, namely C1, C3, or D in the intermediate hemisphere (spino-olivary: Ekerot and Larson, 1979; trigemino-olivary: Hesslow, 1994a). These will be referred to simply as “periocular microzones” for convenience. In the second group, CFPs had broad, bilaterally convergent receptive fields covering the forelimb, vibrissal, and periocular areas and are characteristic of the parasagittal C2 zone as described in cat anterior lobe and that projects to the posterior interposed nucleus. Consistent with a long central pathway with several delays, responses in the C2 zone are labile and heavily influenced by anesthesia (Ekerot and Larson, 1979; Trott et al., 1998). No other zone has been described in the paravermal or hemispheral cortex with the same broad convergence of input as the C2 zone. So here we use the term C2 to define cortical territories with these response properties.
An example of an ipsilateral periocular-evoked CFP signature (averaged across 20 trials) from a periocular microzone in an anesthetized rabbit is shown in Figure 2A. The climbing fiber-driven complex spike activity (Thach, 1967; Armstrong and Edgley, 1984) of a single Purkinje cell recorded at the same location is also illustrated (Fig. 2B, raw traces; C, raster and peristimulus time histogram). Periocular-driven complex spike activity in the single neuron mirrors the evoked LFP, indicating that the major deflections in the field potential are climbing fiber mediated. In contrast, Figure 3 shows an example CFP signature and Purkinje cell complex spike activity consistent with the C2 zone with receptive fields that include the forelimb, periocular, and vibrissal areas, bilaterally.
Figure 3.
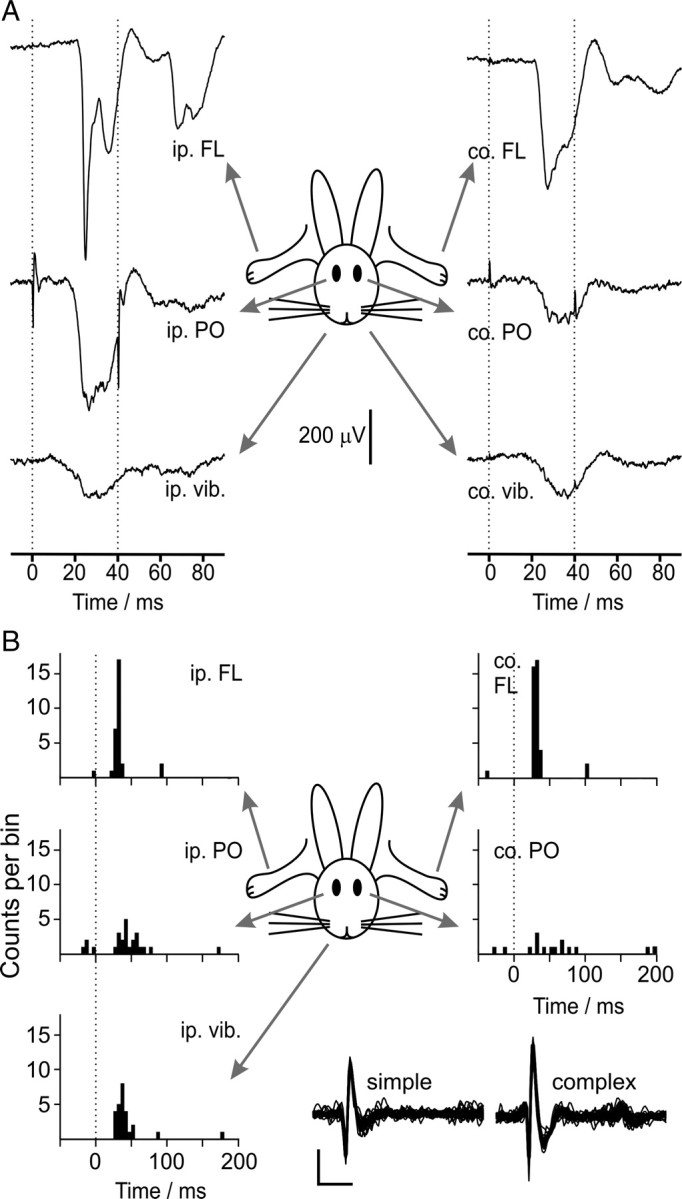
Evoked C2 zone climbing fiber activity in lobule HVI. A, Climbing fiber field potentials evoked by bilaterally convergent inputs from the ipsilateral (ip.) and contralateral (co.) forelimbs (FL), periocular regions (PO), and vibrissae (vib.), averaged for 20 trials. Two stimuli are presented 40 ms apart (dotted lines); note that the evoked potentials are characteristically diminished after the second stimulus. B, Peristimulus time histograms for complex spikes from a single-unit C2 zone Purkinje cell recording from another animal, showing the same pattern of evoked climbing fiber activity (50 trials per stimulus, bin width of 5 ms; ordinate scale, five counts/bin per division). Responses were evoked from all stimuli. Stimuli were single biphasic pulses presented at time 0 ms (dotted lines). Overlays of simple and complex spikes from the recording are presented (calibration: 1 ms, 0.25 mV).
A comparison of the onset latencies of these two types of evoked CFPs is presented in Figure 4; although there is overlap in the ranges, periocular-evoked field CFPs in C2 (median of 20 ms) have, on average, significantly longer onset latencies than those in periocular microzones (median of 15 ms); this is consistent with additional trigemino-olivary brainstem relays similar to those for the C2 spino-olivary pathway in the region of the mesodiencephalic junction (Jeneskog, 1987). A similar pattern is seen in both anesthetized and awake animals, although periocular CFPs in the C2 zone had, on average, slightly shorter onset latencies under anesthesia.
Figure 4.
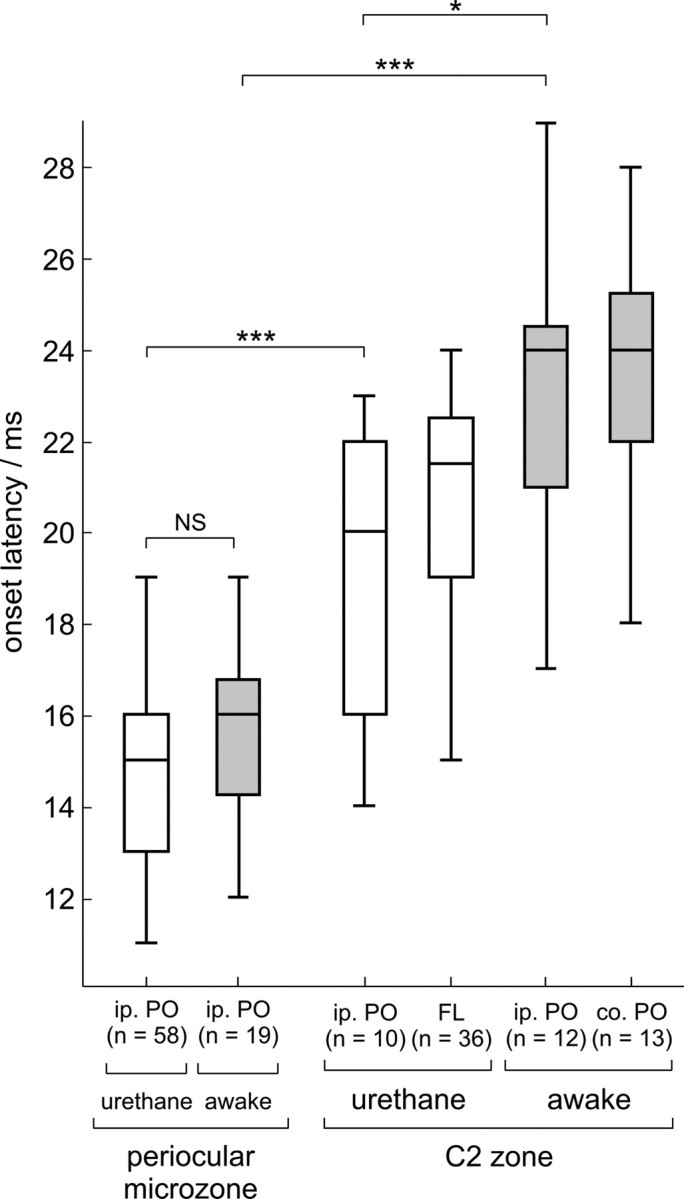
Comparison of onset latencies of evoked CFPs in both urethane-anesthetized and awake rabbits. One or more of the samples was not normally distributed (Lilliefors test, p < 0.05), and the data are therefore presented as box-and-whisker plots of absolute range (whiskers) and interquartile range (box). Onset latencies are grouped based on whether CFPs were characteristic of periocular microzones or C2 zone. For the former, data for ipsilateral periocular-evoked CFPs are presented, whereas for the latter, data for CFPs evoked by ipsilateral periocular (i.p. PO), forelimb (FL; anesthetized animals only), and contralateral periocular (co. PO; awake animals only) stimulation are compared. Each electrode track from which a CFP was recorded contributes only one data point. There was no significant difference in onset latency of ipsilateral periocular-only evoked CFPs between anesthetized and awake animals (NS). Periocular C2 potentials were evoked at significantly longer latency than periocular microzone potentials, in both awake and anesthetized animals; this periocular C2 latency was longer on average in awake animals (unmatched, two-tailed Wilcoxon's rank-sum test, *p < 0.05, ***p < 0.001).
In initial experiments under anesthesia, we examined whether stimuli to different peripheral sites evoked CFPs in and around lobule HVI, including the forelimbs, vibrissae, and periocular areas, both ipsilaterally and contralaterally. In these experiments, we consistently found that forelimb stimulation evoked the largest CFPs in the C2 zone (Fig. 3A), whereas in periocular microzones, forelimb responses were absent. In subsequent experiments, we exploited bilaterality and forelimb inputs as diagnostics for distinguishing the C2 zone from the periocular microzones; thus, the C2 zone was identified by the presence of forelimb-evoked CFPs, with or without convergent ipsilateral periocular inputs.
Distribution of periocular microzones
The microzones that make up the functional modules of the cerebellar cortex are regions a few hundred micrometers wide and elongated in the parasagittal dimension, in which Purkinje cells have similar climbing fiber input (Andersson and Oscarsson, 1978; Sugihara and Shinoda, 2004, 2007; Apps and Garwicz, 2005; Apps and Hawkes, 2009; Dean et al., 2010). Our objective in this study was to localize these regions. In each penetration, the microelectrode array was advanced vertically in the coronal plane from the dorsal surface of the cerebellum to a depth of 6–8 mm in steps typically of 200 μm, with the subject's head held in the stereotaxic position described previously (see Materials and Methods, Surgery). At each step, stimulus-evoked LFP activity was recorded across the array. This was performed for a total of 8296 individual sampling locations on 251 electrode tracks in 41 array penetrations across 14 anesthetized animals. Of these, accurate histological reconstruction was possible for 6459 individual sampling locations on 206 electrode tracks in 33 array penetrations across 11 animals.
Data from an example penetration are presented in Figure 5. In this case, within the array of seven electrodes, six were used for recording (#1, #2, #4–7), whereas one (#3) was used exclusively to make electrolytic marker lesions to aid subsequent reconstruction of the estimated path of the electrodes (Fig. 5C,D). There is an area deep (∼4–5 mm) in the penetration, <1 mm in extent mediolaterally and dorsoventrally, from which a periocular-evoked CFP can be recorded on three adjacent electrodes (#4–6, highlighted in the box in Fig. 5A and expanded in Fig. 5E). In this example, stimulation of the forelimbs or vibrissae did not evoke potentials at this location (data not shown) and so this region was identified as a periocular microzone. Histological reconstruction of the electrode tracks places the periocular microzone in the medial wall of lobule HVI, near the base of the primary fissure that separates lobules V and VI (Fig. 5C,D). Note that the polarity of the evoked CFP varies according to the geometry of the cortical layer relative to the electrode location. Importantly, the illustrated example is typical of our cases in that the majority of the sampled tissue, which includes a large fraction of lobule HVI and medial parts of crus I dorsally, exhibited no periocular-evoked activity, whereas evoked CFPs were encountered focally in a relatively small area. These were common findings in all experiments.
The resolution of this mapping approach is potentially limited by the use of LFPs, which represent the average postsynaptic activity of many neurons. However, our use of relatively high-impedance, small-diameter electrodes leads us to believe that these signals are derived from relatively localized regions of tissue: LFPs recorded 200 μm apart on the same electrode were often very different, as were signals across adjacent electrodes ∼300 μm apart (Fig. 5E). In this regard, a recent study estimates that LFPs in cerebral cortex, recorded with similar microelectrodes, originate from within a radius of 250 μm (Katzner et al., 2009). A second potential limit on resolution relates to the reliability in the path of travel of the electrodes in brain tissue: path deviations would be a source of error in track reconstruction. Evidence that such deviation is insignificant comes from the recordings in awake animals in which penetrations were made at the same stereotaxic locus on different days. Although we changed individual recording electrodes on different days, qualitatively similar potentials were encountered with maximum amplitudes at the same stereotaxic locations on separate recording sessions (an example is shown in supplemental Fig. 1, available at www.jneurosci.org as supplemental material). This repeatability of independent electrode trajectories indicates that deviation of the electrodes is not a significant source of mapping error.
We noted the stereotaxic coordinates of electrode penetrations relative to the skull landmark lambda to assess whether a stereotaxic approach could provide a useful method for localizing periocular microzones. We plotted scatter diagrams in which each point represents the coordinates of the locus with the largest absolute amplitude-evoked CFP on a single electrode track (assumed to be closest to the source of the signal), from both periocular microzones (circles) and C2 zones (triangles) (Fig. 6B–D). The extent of our sampling coverage is presented in Figure 6A, which shows the mediolateral and rostrocaudal locations of the electrode tracks, and in Figure 6D, in which each vertical line represents the area covered by one electrode track. Although some clustering is evident, it is clear that periocular microzone CFPs can be recorded over a relatively large area in coordinate space across many animals, spanning at least 2.5 mm rostrocaudally and mediolaterally, and up to 5 mm dorsoventrally, in contrast to the much more focal activity (typically ∼1 mm dorsoventrally and mediolaterally) seen in individual subjects (Fig. 5A) (see Fig. 8D). From histological reconstruction of the electrode tracks, it becomes clear that interanimal variability in both lobular anatomy and the precise intralobular location of periocular microzones limits the utility of a stereotaxic coordinate-based approach.
Figure 6.

Recording tracks plotted in stereotaxic coordinates. Stereotaxic coordinates based on the following zero references: rostrocaudal, lambda; mediolateral, midline; dorsoventral, dorsal surface of the midline vermis at 1.5 mm caudal to lambda (λ − 1.5). A, Dorsal view of the location of all electrode tracks across all animals showing the coverage of penetrations; each plus sign represents one electrode track. B–D, Stereotaxic coordinates of electrode recording locations in which a periocular microzone field potential was recorded across all animals. Each point represents the coordinates at which the largest-amplitude CFP for periocular microzones (circles) and C2 zones (triangles) was recorded for a single electrode track. B and C show these for coronal and sagittal projections, respectively. D, The same points shown in coronal sections at different rostrocaudal (RC) levels between λ and λ − 2.5 mm. Vertical lines in D represent single electrode tracks across all experiments. Colored symbols (periocular microzones, red; C2 zones, blue) and solid lines indicate CFP loci and tracks for which accurate histological reconstruction was possible. Anatomical directions are marked with arrows for reference. R, Rostral; C, caudal; M, medial; L, lateral; D, dorsal; Ve, ventral.
Figure 8.
A, Histological section from a mapping experiment (animal #27, λ − 1.0 mm), stained for zebrin immunoreactivity (scale bar, 1 mm). B, Annotated illustration of lobular organization and zebrin staining in A. Black regions are those that are clearly zebrin positive, and regions with weak staining are colored in gray. Zebrin bands are labeled based on the nomenclature of Sanchez et al. (2002). C, Expansion of the region in A indicated by the black box (scale bar, 1 mm). Plus signs mark the location of LFP sampling points from a microelectrode array penetration. Red circles show the location of the largest-amplitude periocular-evoked CFPs. These are illustrated in D; the timing of two periocular stimuli 40 ms apart is indicated by the vertical stimulus artifacts (calibration: 80 ms, 100 μV). Traces in red indicate the largest-amplitude periocular-evoked CFPs in the two electrode tracks in which they were recorded: these were 4.8 and 5.1 mm lateral to the midline. f. pr, Primary fissure; D, dorsal; Ve, ventral; M, medial; L, lateral; Ans, ansiform lobule.
To reveal the anatomical location of periocular microzones, electrophysiological activity was mapped onto histological reconstructions of recording locations for each experiment (Fig. 5C,D). Figure 7 summarizes the anatomical locations of periocular microzones mapped on to standard coronal sections of rabbit cerebellum (see Materials and Methods, Histological reconstruction). Each panel represents data gathered from between one and three array penetrations at a single rostrocaudal level in one animal. Note that data from penetrations at different rostrocaudal levels in a single animal may be represented in multiple panels; each animal is identified by a unique number in the bottom right corner of each panel. Each point represents the estimated location of the largest-amplitude-evoked CFP on a single electrode track (Fig. 6B–D) for both periocular microzones (red circles) and the C2 zone (blue triangles). These colored points are the same as those presented in stereotaxic coordinate form in Figure 6B–D. The regions shaded in gray estimate the extent of the sampled tissue in each case.
Figure 7.
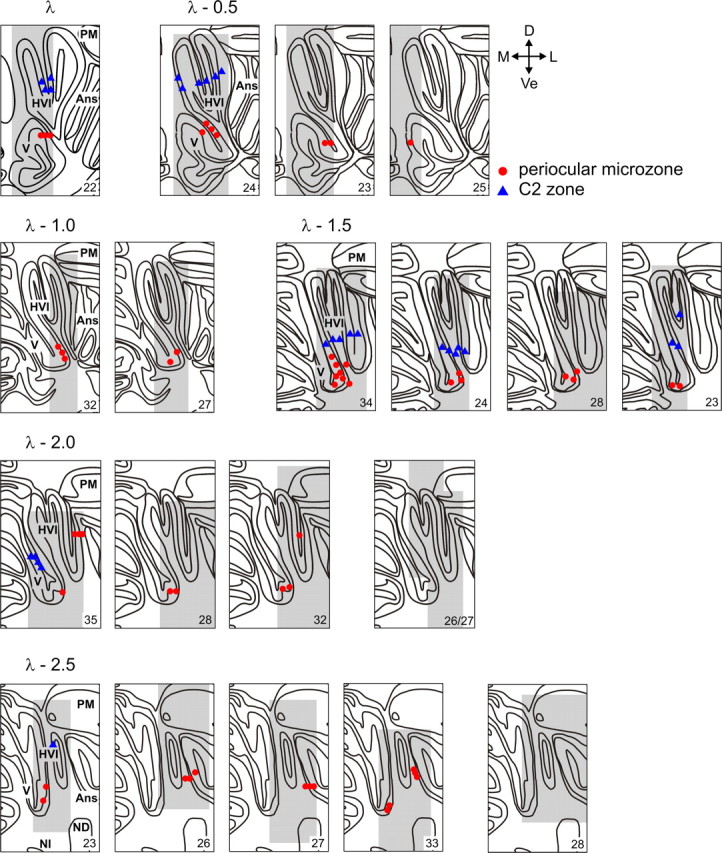
Summary of the locations of identified climbing fiber zones in rabbit cerebellar cortex across all 11 animals, plotted on a standard series of coronal sections from 0.5 to 2.5 mm caudal to lambda (λ − 0.5 to λ − 2.5). Each panel represents one or more penetrations of the microelectrode array at a single rostrocaudal level in a single animal (sampled area shaded gray). A reference number for the animal is given in the bottom right corner. Each point represents the location on a single electrode track in which the largest-amplitude CFP was recorded (periocular microzones, red; C2 zone, blue). Note the preponderance of periocular microzones located ventrally on the medial wall of lobule HVI down to the base of the primary fissure that separates lobules V and HVI. Identified C2 zones are located dorsal to periocular microzones. Also note a number of illustrated cases at λ − 2.0 mm and λ − 2.5 mm in which the sampled area is shaded but no relevant climbing fiber activity was recorded. Ans, Ansiform lobule; PM, paramedian lobule; ND, dentate nucleus; NI, interposed nucleus; D, dorsal; Ve, ventral; M, medial; L, lateral.
The most consistent location at which we found CFP signatures consistent with a periocular microzone was in a ventral area in medial lobule HVI, which, in some cases, included the base of the primary fissure. Responses in this area were found in all seven animals in which it was sampled between λ − 1.0 mm and λ − 2.0 mm. However, within this region, the precise location across animals was subject to a degree of variation. For example, at λ − 1.5 mm, the periocular microzone is restricted to the base of the primary fissure in one animal (#23); in another, it extends some way up the medial wall of the lobule HVI (#34: in this case, three array penetrations spaced 100–200 μm rostrocaudally have been condensed onto a single section), whereas in the other two sampled at this level, it occupies an intermediate position in ventral medial HVI.
Similar CFP signatures were found in small regions of the ansiform lobule in five animals. These appear in more caudal sections although are not always found (found in three of four animals at λ − 2.5 mm, two of four animals at λ − 2.0 mm) and are not mutually exclusive with the microzones in medial lobule HVI.
Farther rostrally (λ and λ − 0.5 mm), there is evidence of periocular CFP activity in small areas of lobule V in four animals. In three of these, this was in an area immediately adjacent to lobule HVI. Of these, one (#24) also exhibited this periocular-evoked climbing fiber activity in adjacent parts of medial lobule HVI, consistent with the periocular microzones seen in the same lobule more caudally (between λ − 1.0 mm and λ − 2.0 mm). In an additional two of these animals (#22 and #23) an absence of more lateral sampling means that a source in HVI, as in animal #24, cannot be ruled out at this rostrocaudal level. Indeed, sampling 1 and 2 mm more caudally in animal #23 shows that a periocular microzone CFP locus does exist in ventral medial HVI caudally. In no electrode tracks at or caudal to λ − 1.0 mm were periocular-evoked CFPs recorded in the sampled regions of ventral and lateral lobule V. Similar periocular CFPs have been identified in lobule HVI, with small extensions into lobule V, on the surface of the cat cerebellum (Hesslow, 1994a).
A distinct C2 zone was evident in lobule HVI in only five animals and was, in all cases, located dorsal to an identified periocular microzone. The zebrin banding pattern described by Sanchez et al. (2002) suggests that more lateral parasagittal zones are located more ventrally in lobule HVI as viewed in coronal sections; this arises because the hemispheral part of lobule VI in the rabbit is large and is folded anteriorly. The periocular CFPs were therefore in zones located lateral to C2, e.g., C3 or D. Across animals, C2 did not appear to be restricted to either the medial or lateral side of lobule HVI.
Relation of periocular microzones to zebrin immunoreactivity
Purkinje cells of the cerebellar cortex express the enzyme aldolase C, otherwise known as zebrin II (Hawkes and Leclerc, 1987; Brochu et al., 1990), in a banding pattern that has been suggested to correspond to a fundamental map of functional and zonal compartmentation within the cortex (Sugihara and Shinoda, 2004). Because the gross anatomy of the cerebellar folia varies across rabbits, we investigated the possibility that periocular microzones may be more tightly linked to the zebrin banding pattern rather than to folial landmarks, focusing on the consistent periocular microzones found in ventral medial lobule HVI.
In 10 of the acute experiments, cerebellar sections were immunostained for zebrin; eight animals yielded good labeling. Previous studies have described cerebellar cortical banding patterns in the rabbit (Sanchez et al., 2002) and the rat (Sugihara and Shinoda, 2004) with identifiable boundaries between positively and negatively staining stripes. As described previously (Sanchez et al., 2002), we found that the contrast is particularly high in vermis. However, in ventral parts of lobule HVI, in which the majority of our periocular microzones were located, in addition to clearly positive and negative regions, there were areas of weak staining intensity. Figure 8 shows an example of a zebrin-stained cerebellum in which a periocular microzone was located near the base of the primary fissure. Zebrin immunoreactivity in adjacent sections is illustrated in supplemental Figure 3 (available at www.jneurosci.org as supplemental material). In this case, as is the case in all periocular microzones located in this area, the reconstructed electrode tracks localized the microzone to a large band staining weakly for zebrin (shaded gray in B). The small strongly positive region dorsal to the recording site corresponds to the zebrin-positive P5+ band identified by Sanchez et al. (2002). Moving dorsally in the medial wall of lobule HVI, we find areas negative and positive for zebrin corresponding to P4b− and P4b+, respectively. The weakly staining band ventral to P5+ extends around the primary fissure into lobule V. Importantly, in this example, CFPs indicative of periocular microzones were seen in only a small fraction of this band in ventral medial lobule HVI. A similar pattern was observed across all animals: in 11 array penetrations from seven animals, a periocular microzone was localized to this weakly staining region ventral to P5+. In two animals, there were deviations from this pattern: in one, periocular microzone CFPs extended into P5+ and ventralmost P4b− (animal #34); in another, the relevant CFPs were localized to P4b− and P5+ in a rostral array penetration (animal #24 at λ − 0.5 mm) but to the weakly staining region ventral to P5+ in a more caudal penetration (animal #24 at λ − 1.5 mm). This region is likely to represent P5−, in which case it represents an area with connections to the lateral anterior interposed nucleus and the dorsomedial nucleus (DM) of the inferior olive, which is immediately adjacent to the DAO (Sugihara and Shinoda, 2004, 2007) (see Discussion).
Congruence of mossy fiber and climbing fiber projections to periocular microzones in awake rabbits
Inspired by the theoretical considerations of Marr (1969) and Albus (1971), many models of eyeblink conditioning emphasize that mossy fiber inputs from diverse sensory systems could convey conditional stimuli (e.g., visual, auditory, and somatosensory) (Yeo and Hesslow, 1998). However, many studies of basic cerebellar connectivity have shown a degree of receptive field congruence between somatosensory climbing fiber and mossy fiber inputs (Kitai et al., 1969; Hesslow, 1994a; Garwicz et al., 1998; Brown and Bower, 2001; Ekerot and Jörntell, 2001).
Here, electrophysiological mapping in five awake animals, using ipsilateral and contralateral periocular stimulation, revealed a pattern of periocular-evoked MFPs and CFPs (Fig. 1C) that was qualitatively similar to that in anesthetized animals (Fig. 5E). Ipsilateral periocular stimulation evoked colocalized MFPs and CFPs in the periocular microzone, the former occurring with shorter onset latency (<6 ms). Figure 1C shows data from an electrode track in which ipsilateral periocular MFPs and CFPs covary with electrode depth. This congruence was also seen in the anesthetized rabbits (Fig. 5E, electrode 6, depth of 4.0–4.4 mm). However, periocular MFPs were also prominent in other areas of cortex in the absence of detectable CFPs, e.g., ansiform lobule and other parts of lobule HVI (data not illustrated).
Blocking local excitatory neurotransmission in the region of periocular microzones in lobule HVI can abolish expression of conditioned responses in awake, behaving rabbits
Next, we wanted to test the hypothesis that periocular microzones are the specific loci in lobule HVI that are critical for the expression of CRs. Previous studies using relatively large infusions of the AMPA/kainate receptor antagonist CNQX (2 μl, 1.5–5 mm), designed to occupy most of the depths and intermediate regions of lobule HVI, show diminution or abolition of CR performance in trained animals (Attwell et al., 1999, 2001, 2002). Our prediction was that much smaller infusions of CNQX, which would have more localized effects than the volumes used previously, delivered to areas of lobule HVI identified electrophysiologically as periocular microzones, would diminish CR performance; in contrast, those delivered within HVI, but some distance away from periocular microzone loci, would not affect CRs. To test this, we infused small volumes (0.2–0.8 μl) of 3 mm CNQX at electrophysiologically determined locations.
These experiments were performed in five awake rabbits trained in an NMR conditioning paradigm using an auditory tone CS and electrical US to the right periocular region until the frequency of CR expression exceeded 75% (see Materials and Methods, Behavioral conditioning). In each experiment, an initial recording electrode array penetration was made within lobule HVI to localize periocular microzones electrophysiologically (as described previously). An infusion cannula incorporated within the array (see Materials and Methods, Pharmacological inactivations) and containing 3 mm CNQX was then advanced from the cerebellar surface into the lobule, with the recording electrodes positioned where the largest-amplitude periocular microzone CFPs were recorded. Infusions were either on-target, i.e., centered as close as possible to an identified periocular microzone with the cannula tip positioned at the depth at which the largest-amplitude periocular-evoked CFP was recorded on an adjacent electrode track, or control, i.e., with the cannula tip positioned at least 3 mm dorsal to this depth.
In each of the five animals, an on-target infusion of 0.6–0.8 μl was sufficient to reduce the amplitude of NMRs in the CS–US interval substantially and significantly (reduction in amplitude of 89 ± 9%, mean ± SEM) (see grouped data in Fig. 10C). In three of these cases, CR expression was completely abolished, an example of which is illustrated in Figures 9 (raw data) and 10A (summary data). Volume-matched control infusions were delivered in two of these animals, neither of which had a significant effect on CR expression (grouped data illustrated in Fig. 10C).
Figure 10.

Effects of CNQX infusions on CR performance parallels depression of field potentials in periocular microzones. A and D summarize behavioral data from two different experiments. Each point represents the mean NMR amplitude and SE for a block of 10 consecutive CS presentations. A shows the effect of two 0.8 μl infusions, the first centered as close as possible to the target periocular microzone area and the second infusion centered in a control non-periocular microzone area 4.8 mm dorsally (dotted lines). The on-target infusion transiently and completely abolishes the behavior, whereas the control infusion has no significant effect on NMR amplitude. The raw NMRs for these infusions are illustrated in Figure 9. D shows the effect of smaller infusions of 0.2 μl in a different animal; the on-target infusion transiently reduces NMR amplitude significantly, whereas the control infusion made 3 mm dorsally has no effect (unmatched, one-tailed Wilcoxon's rank-sum test, *p < 0.05, **p < 0.01, ***p < 0.001.) B and E illustrate the averaged periocular-evoked LFPs within periocular microzones on which the on-target injections in A and D, respectively, were centered (calibration: 20 ms, 100 μV). Two pairs of low-intensity periocular stimuli were delivered 40 ms apart (arrowheads). Times at which the recordings were made are expressed relative to the time axes in A (for B) and D (for E). The preinfusion field potentials have discernible early mossy fiber (MF) and later climbing fiber (CF) components. Grouped data showing mean CR and evoked LFP amplitudes for all infusions, both on-target and control, are illustrated in C (larger infusions) and F (smaller infusions); all amplitudes are normalized relative to preinfusion values, and error bars represent SEM. Amplitudes before the infusion, at maximum behavioral effect within at most 20 min of the infusion (<20 min), and at 40–45 min after infusion (on-target infusions only) are presented. There is a statistically significant reduction in both CR and evoked LFP amplitudes within 20 min of on-target infusions relative to the preinfusion baseline, but no effect is seen after control infusions (one-sample t test, *p < 0.05; NS, not significant).
Figure 9.
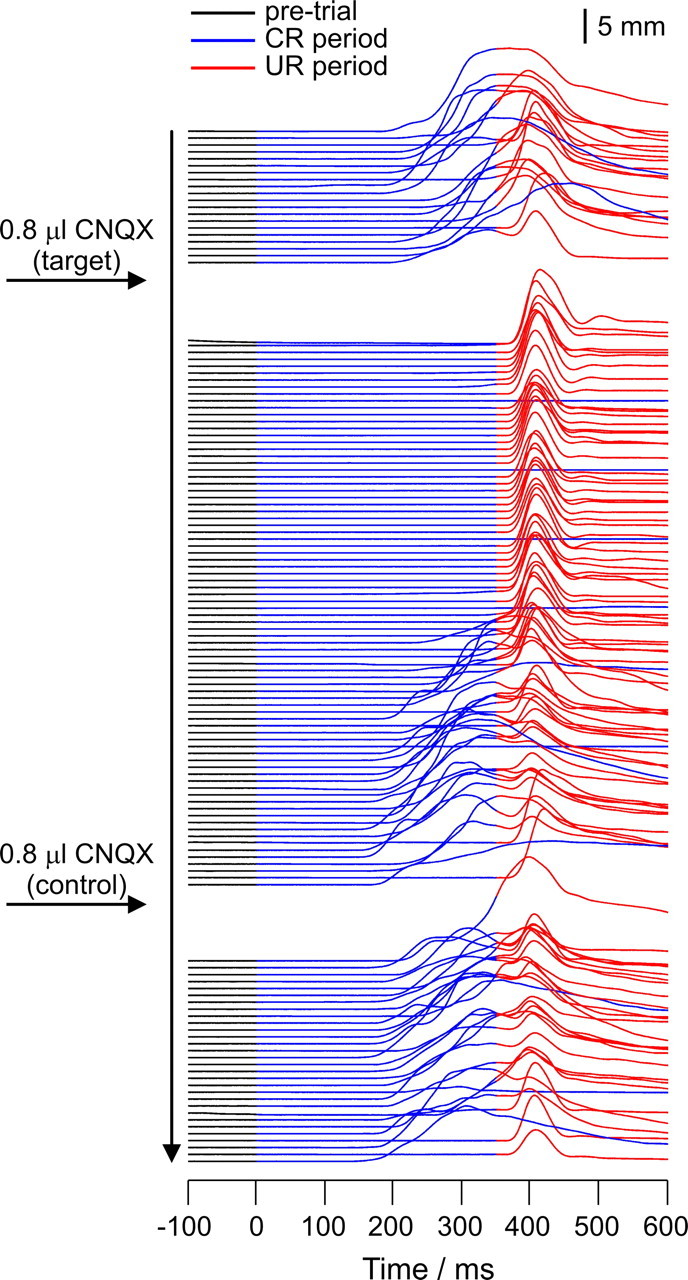
NMRs in a well trained rabbit after infusions of 0.8 μl of 3 mm CNQX into an electrophysiologically identified periocular microzone (target) and into a control region in lobule HVI 4.8 mm dorsally in the same animal (control). CS and US onsets are at times 0 and 350 ms, respectively. Successive trials are drawn in serial order starting from the top. Nictitating membrane positions are drawn as follows: pre-CS, black; CS–US interval, blue; post-US, red. Note that 1 in 10 trials is a CS-alone presentation (entirely blue post-CS). The target infusion transiently abolishes CRs: on CS alone trials, no NMRs are seen at any latency; on paired trials, NMRs within the CS–US interval are abolished but the unconditioned responses remain. The control infusion has no effect. Summary behavioral data for these infusions are presented in Figure 10A.
A second series of infusions of even smaller volume were delivered in separate experimental sessions in four of the five animals (three of 0.2 μl, one of 0.4 μl); these volumes represent the limit of what is quantifiable using our in vivo infusion setup. The reduction in amplitude of NMRs in the CS–US interval from the four on-target infusions was 68 ± 19% (mean ± SEM) (grouped data in Fig. 10F). Volume-matched control infusions performed in each of the four cases had no significant effect on CRs (grouped data in Fig. 10F). Data from one animal for which 0.2 μl on-target and control infusions were made in the same session are illustrated in Figure 10D.
The periocular-evoked LFP within the periocular microzone was recorded at frequent intervals during all but one of these experiments. The effects of infusions on the evoked LFPs mirrored those on the behavior for both the larger and smaller infusion volumes: on-target infusions diminished behavioral responses (see above) and also reduced the amplitude of periocular-evoked LFPs, whereas control infusions had no effect on either CR performance (see above) or evoked LFP amplitude (grouped data in Fig. 10C,F). For the specific cases illustrated in Figure 10, A and D, examples of the periocular-evoked LFPs recorded at different time points during the experiment are illustrated in B and E, respectively.
After the final infusion in each animal, two electrolytic lesions were made as described for the acute experiments (an example is shown in supplemental Fig. 2 for the animal from which the data in Fig. 10D,E were obtained; available at www.jneurosci.org as supplemental material). In two subjects, large numbers of electrode penetrations made it difficult to assign, with certainty, the histologically revealed tracks to their appropriate recording session; in the other three, reconstruction of the infusion locations was possible, revealing successful on-target infusion sites ventrally in lobule HVI, in keeping with the known location of periocular microzones.
In summary, (1) the relatively rapid onset of the effects of drug infusions on behavioral expression and local excitatory synaptic transmission, (2) the dependence of the behavioral effects on proximity to electrophysiologically localized periocular microzones in lobule HVI, and (3) the effectiveness of small infusion volumes are all in keeping with the view that the periocular microzones we identified are critical for the expression of conditioned eyeblink/NMR behavior.
Discussion
Periocular-evoked climbing fiber activity in rabbit cerebellar cortex
Implicit in current models of eyeblink conditioning is that US information is conveyed via climbing fibers (McCormick et al., 1985; Yeo et al., 1985c, 1986; Mauk et al., 1986; Kim et al., 1998; Yeo and Hesslow, 1998; Medina et al., 2002); thus, there should exist areas of cerebellar cortex, essential for the learned behavior, that receive US-activated climbing fibers. We identify two groups of cerebellar cortical areas that receive periocular-driven climbing fibers: those with widely convergent receptive fields (C2 zone) and those with ipsilateral periocular-only receptive fields (periocular microzones). In the anterior lobe, several generic climbing fiber zones with defined ipsilateral limb receptive fields have been identified, namely C1, C3, and D zones (cat: Ekerot and Larson, 1979; rat: Jörntell et al., 2000), and it is likely that our periocular microzones represent extensions of this pattern into lobule HVI. Although C2 climbing fibers are driven nonexclusively by periocular stimuli, this zone is unlikely to be critical for eyeblink conditioning because of its connections with medial accessory olive and posterior interposed nucleus, lesions of which do not affect CRs in rabbits (Yeo et al., 1985a, 1986). Additionally, stimulation in C2 cortex does not evoke periorbital muscle activity (Hesslow and Yeo, 2002).
Localizing periocular microzones
High-resolution electrophysiological mapping in anesthetized and awake rabbits has allowed, for the first time, systematic sampling of climbing fiber activity in and around lobule HVI. It has revealed climbing fiber activity consistent with periocular microzones in a number of locations, most consistently within a part of ventromedial lobule HVI near the base of the primary fissure. Additional areas may be found in lobule V rostrally and ansiform lobe caudally. Importantly, all of these microzones constitute a small fraction of the total cortical area.
The periocular microzone in ventromedial lobule HVI is of particular interest in eyeblink conditioning because its location corresponds with sites of cortical lesions and pharmacological interventions effective in abolishing CRs. Physical lesions of lobule HVI may abolish CR performance, although those that spare the ventral base of the lobule often fail to do so (Yeo and Hardiman, 1992, their Fig. 8). Similarly, pharmacological inactivations achieve greatest effects when located ventromedially in lobule HVI (Attwell et al., 1999).
A periocular microzone in ansiform lobule is also present in cats (Hesslow, 1994a). However, although extensive lesions of this lobule that exclude ventral lobule HVI may produce minor impairments in amplitude and frequency of CRs in rabbits, they do not abolish the behavior (Yeo and Hardiman, 1992).
It has been suggested that the lobules IV/V of anterior lobe, rather than HVI, are important in eyeblink conditioning (Perrett et al., 1993; Garcia et al., 1999). We have shown that the most consistent location of periocular microzones is in ventromedial HVI, abutting lobule V around the primary fissure. Interestingly, the smallest effective anterior lobe lesion by Garcia et al. (1999, their Fig. 4) includes parts of lobule V immediately adjacent to HVI, whereas their illustrated control lesion includes most of HVI but spares the ventralmost part in which we find periocular microzones. Although some areas identified in our study as periocular microzone CFP sources are located in lobule V, these were small, found only at rostral locations, and, when sampled in two animals, coexisted with a more extensive lobule HVI microzone.
As a result of interanimal variation in the precise location and extent of periocular microzones, as well as in the gross anatomy of lobule HVI, our stereotaxic coordinates (Fig. 6) only approximate their location. Thus, identification of periocular microzones requires electrophysiological verification in each subject.
Zebrin immunostaining was used to address this interanimal variability and to tie periocular microzones to the zonal organization of the cerebellum. In ventral medial lobule HVI, a consistent zebrin landmark (Fig. 8) was the narrow, strongly positive P5+ band (Sanchez et al., 2002). Although zebrin immunoreactivity has often been described in binary terms, in the majority of cases in which a periocular microzone was found in medial lobule HVI, it was localized to a weakly staining area ventral to P5+. Because there is often a discrete boundary between this area and P5+, we suggest that this region is a separate compartment likely to be the “zebrin negative” band P5−. This would place these periocular microzones in a region with appropriate connectivity for a critical role in eyeblink conditioning. The relationship between zebrin immunohistochemistry, olivocerebellar, and corticonuclear projections has been carefully documented in the rat (Sugihara and Shinoda, 2004, 2007; Voogd and Ruigrok, 2004). Assuming that these relationships also hold for the rabbit, P5− corresponds to the parasagittal cortical zone labeled D0. The climbing fiber inputs to D0 arise from a small olivary region named the caudal DM subnucleus in rats (Sugihara and Shinoda, 2004). In rabbits, the equivalent area has been termed the medial dorsal olive and has been shown to receive inputs from the trigeminal nucleus (Van Ham and Yeo, 1992). Although initially considered to be part of the principal olive, it has been suggested that this area comprises the face representation of the somatotopical map in the DAO (Gellman et al., 1983) with which it is continuous (Van Ham and Yeo, 1992). This olivary region would project short-latency periocular-activated climbing fibers to cortical zone D0, and would have been disrupted in interventions aimed at the DAO (McCormick et al., 1985; Mauk et al., 1986; Yeo et al., 1986). In rats, Purkinje cells in D0 project to lateral parts of the anterior interposed nucleus, including the dorsolateral hump (Sugihara and Shinoda, 2007), consistent with nuclear areas known to be critical for eyeblink conditioning in the rabbit (McCormick and Thompson, 1984a; Yeo et al., 1985a).
Periocular microzones in lobule HVI are critical for expression of eyeblink conditioning
Previous studies delivered relatively large-volume infusions of the AMPA/kainate receptor antagonist CNQX (2 μl, 1.5–5 mm) to achieve widespread inactivation of lobule HVI, which impaired or abolished CR performance (Attwell et al., 2001, 2002). Guided by electrophysiological mapping in awake animals, smaller volumes of CNQX (0.2–0.8 μl, 3 mm) centered on identified periocular microzones in HVI achieved substantial behavioral impairments. Such small volumes are unlikely to have spread to the cerebellar nuclei. Moreover, nuclear blockade of glutamatergic transmission has little or no effect on CRs (Attwell et al., 2002; Aksenov et al., 2005). Cortical lesions and pharmacological corticonuclear disconnections have been reported to “unmask” short-latency CRs (Perrett et al., 1993; Bao et al., 2002; Ohyama et al., 2006; Vogel et al., 2009). Discrete inactivations of periocular microzone regions in our study were able to abolish CRs, but no short-latency responses were observed, in agreement with Attwell et al. (2002) and Aksenov et al. (2005).
Periocular microzones received both mossy and climbing fiber input from the same periocular receptive field. Therefore, in eyeblink conditioning, the US will activate both pathways. US-related mossy fiber–parallel fiber activity may thus contribute to mechanisms of cerebellar cortical plasticity (Jörntell and Ekerot, 2002; Ekerot and Jörntell, 2003). CNQX application suppressed both periocular-evoked mossy and climbing fiber responses in periocular microzones. This suggests that blockade of transmission in both pathways, which would include CS-related mossy fibers, could underlie the observed behavioral effects. We conclude that information processing in periocular microzones in lobule HVI is essential for the expression of CRs and therefore that these areas are “eyeblink related.”
Implications for future studies of eyeblink conditioning
We reveal discrete areas of cerebellar cortex with periocular-evoked climbing fiber activity in the rabbit. The most consistent are in ventromedial lobule HVI, in an area shown previously to be essential for eyeblink conditioning. Such eyeblink-related microzones can be identified using an electrophysiological signature indicative of their periocular climbing fiber receptive fields, allowing more precise localization than has hitherto been possible.
Crucially, because eyeblink-related microzones form only a small fraction of the cortex in lobule HVI, electrophysiological recording studies that have not explicitly identified these regions are likely to have included neurons from areas of HVI with other (micro)zonal identity not critical to the behavior (McCormick and Thompson, 1984b; Berthier and Moore, 1986; Gould and Steinmetz, 1996; Katz and Steinmetz, 1997; Kim et al., 1998; Kotani et al., 2006). An additional complication is that periocular-activated climbing fibers in lobule HVI may be encountered in C2 zone in which they are also driven by other, widely convergent afferents and are connected to structures that are nonessential for the behavior. Our findings confirm the view that functional studies of eyeblink conditioning in the cerebellar cortex need to be directed to identified eyeblink-related microzones (Hesslow and Yeo, 2002; Jirenhed et al., 2007).
It has been argued that unraveling the complexities of learning at the neuronal level requires understanding of the interactions between the learning stimuli, synaptic and network plasticity, and behavior, within identified loci engaged in learning (Medina and Lisberger, 2008). Here, for the first time, we provide identifiable cerebellar cortical targets in rabbits, in which these properties can be investigated in one of the best-characterized models of learning.
Footnotes
This work was supported by Biotechnology and Biological Sciences Research Council (United Kingdom) Grant BBS/B/16984. A.M. was funded by the University of Cambridge School of Clinical Medicine MB/PhD Programme. We thank Adrian Newman and John Bashford for assistance with photography, Prof. Richard Hawkes for providing antibodies for immunohistochemistry, and Joy Staniforth for comments on this manuscript.
References
- Aksenov DP, Serdyukova NA, Bloedel JR, Bracha V. Glutamate neurotransmission in the cerebellar interposed nuclei: involvement in classically conditioned eyeblinks and neuronal activity. J Neurophysiol. 2005;93:44–52. doi: 10.1152/jn.00586.2004. [DOI] [PubMed] [Google Scholar]
- Albus JS. A theory of cerebellar function. Math Biosci. 1971;10:25–61. [Google Scholar]
- Andersson G, Oscarsson O. Climbing fiber microzones in cerebellar vermis and their projection to different groups of cells in the lateral vestibular nucleus. Exp Brain Res. 1978;32:565–579. doi: 10.1007/BF00239553. [DOI] [PubMed] [Google Scholar]
- Apps R, Garwicz M. Anatomical and physiological foundations of cerebellar information processing. Nat Rev Neurosci. 2005;6:297–311. doi: 10.1038/nrn1646. [DOI] [PubMed] [Google Scholar]
- Apps R, Hawkes R. Cerebellar cortical organization: a one-map hypothesis. Nat Rev Neurosci. 2009;10:670–681. doi: 10.1038/nrn2698. [DOI] [PubMed] [Google Scholar]
- Apps R, Lee S. Gating of transmission in climbing fibre paths to cerebellar cortical C1 and C3 zones in the rostral paramedian lobule during locomotion in the cat. J Physiol. 1999;516:875–883. doi: 10.1111/j.1469-7793.1999.0875u.x. [DOI] [PMC free article] [PubMed] [Google Scholar]
- Armstrong DM, Edgley SA. Discharges of Purkinje cells in the paravermal part of the cerebellar anterior lobe during locomotion in the cat. J Physiol. 1984;352:403–424. doi: 10.1113/jphysiol.1984.sp015300. [DOI] [PMC free article] [PubMed] [Google Scholar]
- Armstrong DM, Harvey RJ. Responses to a spino-olivo-cerebellar pathway in the cat. J Physiol. 1968;194:147–168. doi: 10.1113/jphysiol.1968.sp008399. [DOI] [PMC free article] [PubMed] [Google Scholar]
- Attwell PJ, Rahman S, Ivarsson M, Yeo CH. Cerebellar cortical AMPA-kainate receptor blockade prevents performance of classically conditioned nictitating membrane responses. J Neurosci. 1999;19(RC45):1–6. doi: 10.1523/JNEUROSCI.19-24-j0003.1999. [DOI] [PMC free article] [PubMed] [Google Scholar]
- Attwell PJ, Rahman S, Yeo CH. Acquisition of eyeblink conditioning is critically dependent on normal function in cerebellar cortical lobule HVI. J Neurosci. 2001;21:5715–5722. doi: 10.1523/JNEUROSCI.21-15-05715.2001. [DOI] [PMC free article] [PubMed] [Google Scholar]
- Attwell PJ, Ivarsson M, Millar L, Yeo CH. Cerebellar mechanisms in eyeblink conditioning. Ann N Y Acad Sci. 2002;978:79–92. doi: 10.1111/j.1749-6632.2002.tb07557.x. [DOI] [PubMed] [Google Scholar]
- Bao S, Chen L, Kim JJ, Thompson RF. Cerebellar cortical inhibition and classical eyeblink conditioning. Proc Natl Acad Sci U S A. 2002;99:1592–1597. doi: 10.1073/pnas.032655399. [DOI] [PMC free article] [PubMed] [Google Scholar]
- Bengtsson F, Jörntell H. Ketamine and xylazine depress sensory-evoked parallel fiber and climbing fiber responses. J Neurophysiol. 2007;98:1697–1705. doi: 10.1152/jn.00057.2007. [DOI] [PubMed] [Google Scholar]
- Berthier NE, Moore JW. Cerebellar Purkinje cell activity related to the classically conditioned nictitating membrane response. Exp Brain Res. 1986;63:341–350. doi: 10.1007/BF00236851. [DOI] [PubMed] [Google Scholar]
- Brochu G, Maler L, Hawkes R. Zebrin II: a polypeptide antigen expressed selectively by Purkinje cells reveals compartments in rat and fish cerebellum. J Comp Neurol. 1990;291:538–552. doi: 10.1002/cne.902910405. [DOI] [PubMed] [Google Scholar]
- Brown IE, Bower JM. Congruence of mossy fiber and climbing fiber tactile projections in the lateral hemispheres of the rat cerebellum. J Comp Neurol. 2001;429:59–70. doi: 10.1002/1096-9861(20000101)429:1<59::aid-cne5>3.0.co;2-3. [DOI] [PubMed] [Google Scholar]
- Dean P, Porrill J, Ekerot CF, Jörntell H. The cerebellar microcircuit as an adaptive filter: experimental and computational evidence. Nat Rev Neurosci. 2010;11:30–43. doi: 10.1038/nrn2756. [DOI] [PubMed] [Google Scholar]
- Eccles JC, Ito M, Szenthágothai J. The cerebellum as a neuronal machine. Berlin: Springer; 1967. [Google Scholar]
- Eckhorn R, Thomas U. A new method for the insertion of multiple microprobes into neural and muscular tissue, including fiber electrodes, fine wires, needles and microsensors. J Neurosci Methods. 1993;49:175–179. doi: 10.1016/0165-0270(93)90121-7. [DOI] [PubMed] [Google Scholar]
- Ekerot CF, Jörntell H. Parallel fibre receptive fields of Purkinje cells and interneurons are climbing fibre-specific. Eur J Neurosci. 2001;13:1303–1310. doi: 10.1046/j.0953-816x.2001.01499.x. [DOI] [PubMed] [Google Scholar]
- Ekerot CF, Jörntell H. Parallel fiber receptive fields: a key to understanding cerebellar operation and learning. Cerebellum. 2003;2:101–109. doi: 10.1080/14734220309411. [DOI] [PubMed] [Google Scholar]
- Ekerot CF, Larson B. Correlation between sagittal projection zones of climbing and mossy fibre paths in cat cerebellar anterior lobe. Brain Res. 1973;64:446–450. doi: 10.1016/0006-8993(73)90203-5. [DOI] [PubMed] [Google Scholar]
- Ekerot CF, Larson B. The dorsal spino-olivocerebellar system in the cat. I. Functional organization and termination in the anterior lobe. Exp Brain Res. 1979;36:201–217. doi: 10.1007/BF00238905. [DOI] [PubMed] [Google Scholar]
- Ekerot CF, Larson B, Oscarsson O. Information carried by the spinocerebellar paths. Prog Brain Res. 1979;50:79–90. doi: 10.1016/S0079-6123(08)60809-2. [DOI] [PubMed] [Google Scholar]
- Garcia KS, Steele PM, Mauk MD. Cerebellar cortex lesions prevent acquisition of conditioned eyelid responses. J Neurosci. 1999;19:10940–10947. doi: 10.1523/JNEUROSCI.19-24-10940.1999. [DOI] [PMC free article] [PubMed] [Google Scholar]
- Garwicz M, Jorntell H, Ekerot CF. Cutaneous receptive fields and topography of mossy fibres and climbing fibres projecting to cat cerebellar C3 zone. J Physiol. 1998;512:277–293. doi: 10.1111/j.1469-7793.1998.277bf.x. [DOI] [PMC free article] [PubMed] [Google Scholar]
- Gellman R, Houk JC, Gibson AR. Somatosensory properties of the inferior olive of the cat. J Comp Neurol. 1983;215:228–243. doi: 10.1002/cne.902150210. [DOI] [PubMed] [Google Scholar]
- Gormezano I, Schneiderman N, Deaux E, Fuentes I. Nictitating membrane: classical conditioning and extinction in the albino rabbit. Science. 1962;138:33–34. doi: 10.1126/science.138.3536.33. [DOI] [PubMed] [Google Scholar]
- Gould TJ, Steinmetz JE. Changes in rabbit cerebellar cortical and interpositus nucleus activity during acquisition, extinction, and backward classical eyelid conditioning. Neurobiol Learn Mem. 1996;65:17–34. doi: 10.1006/nlme.1996.0003. [DOI] [PubMed] [Google Scholar]
- Gruart A, Yeo CH. Cerebellar cortex and eyeblink conditioning: bilateral regulation of conditioned responses. Exp Brain Res. 1995;104:431–448. doi: 10.1007/BF00231978. [DOI] [PubMed] [Google Scholar]
- Hardiman MJ, Yeo CH. The effect of kainic acid lesions of the cerebellar cortex on the conditioned nictitating membrane response in the rabbit. Eur J Neurosci. 1992;4:966–980. doi: 10.1111/j.1460-9568.1992.tb00123.x. [DOI] [PubMed] [Google Scholar]
- Hawkes R, Leclerc N. Antigenic map of the rat cerebellar cortex: the distribution of parasagittal bands as revealed by monoclonal anti-Purkinje cell antibody mabQ113. J Comp Neurol. 1987;256:29–41. doi: 10.1002/cne.902560104. [DOI] [PubMed] [Google Scholar]
- Hesslow G. Correspondence between climbing fibre input and motor output in eyeblink-related areas in cat cerebellar cortex. J Physiol. 1994a;476:229–244. doi: 10.1113/jphysiol.1994.sp020126. [DOI] [PMC free article] [PubMed] [Google Scholar]
- Hesslow G. Inhibition of classically conditioned eyeblink responses by stimulation of the cerebellar cortex in the decerebrate cat. J Physiol. 1994b;476:245–256. doi: 10.1113/jphysiol.1994.sp020127. [DOI] [PMC free article] [PubMed] [Google Scholar]
- Hesslow G, Yeo CH. The functional anatomy of skeletal conditioning. In: Moore JW, editor. The neuroscientist's guide to classical conditioning. New York: Springer; 2002. pp. 86–137. [Google Scholar]
- Hesslow G, Svensson P, Ivarsson M. Learned movements elicited by direct stimulation of cerebellar mossy fiber afferents. Neuron. 1999;24:179–185. doi: 10.1016/s0896-6273(00)80831-4. [DOI] [PubMed] [Google Scholar]
- Ivarsson M, Hesslow G. Bilateral control of the orbicularis oculi muscle by one cerebellar hemisphere in the ferret. Neuroreport. 1993;4:1127–1130. [PubMed] [Google Scholar]
- Jeneskog T. Termination in posterior and anterior cerebellum of a climbing fibre pathway activated from the nucleus of Darkschewitsch in the cat. Brain Res. 1987;412:185–189. doi: 10.1016/0006-8993(87)91459-4. [DOI] [PubMed] [Google Scholar]
- Jirenhed DA, Bengtsson F, Hesslow G. Acquisition, extinction, and reacquisition of a cerebellar cortical memory trace. J Neurosci. 2007;27:2493–2502. doi: 10.1523/JNEUROSCI.4202-06.2007. [DOI] [PMC free article] [PubMed] [Google Scholar]
- Jörntell H, Ekerot CF. Reciprocal bidirectional plasticity of parallel fiber receptive fields in cerebellar Purkinje cells and their afferent interneurons. Neuron. 2002;34:797–806. doi: 10.1016/s0896-6273(02)00713-4. [DOI] [PubMed] [Google Scholar]
- Jörntell H, Ekerot C, Garwicz M, Luo XL. Functional organization of climbing fibre projection to the cerebellar anterior lobe of the rat. J Physiol. 2000;522:297–309. doi: 10.1111/j.1469-7793.2000.00297.x. [DOI] [PMC free article] [PubMed] [Google Scholar]
- Katz DB, Steinmetz JE. Single-unit evidence for eye-blink conditioning in cerebellar cortex is altered, but not eliminated, by interpositus nucleus lesions. Learn Mem. 1997;4:88–104. doi: 10.1101/lm.4.1.88. [DOI] [PubMed] [Google Scholar]
- Katzner S, Nauhaus I, Benucci A, Bonin V, Ringach DL, Carandini M. Local origin of field potentials in visual cortex. Neuron. 2009;61:35–41. doi: 10.1016/j.neuron.2008.11.016. [DOI] [PMC free article] [PubMed] [Google Scholar]
- Kim JJ, Krupa DJ, Thompson RF. Inhibitory cerebello-olivary projections and blocking effect in classical conditioning. Science. 1998;279:570–573. doi: 10.1126/science.279.5350.570. [DOI] [PubMed] [Google Scholar]
- Kitai ST, Táboríková H, Tsukahara N, Eccles JC. The distribution to the cerebellar anterior lobe of the climbing and mossy fiber inputs from the plantar and palamar cutaneous afferents. Exp Brain Res. 1969;7:1–10. doi: 10.1007/BF00236104. [DOI] [PubMed] [Google Scholar]
- Kotani S, Kawahara S, Kirino Y. Purkinje cell activity during classical eyeblink conditioning in decerebrate guinea pigs. Brain Res. 2006;1068:70–81. doi: 10.1016/j.brainres.2005.10.090. [DOI] [PubMed] [Google Scholar]
- Lincoln JS, McCormick DA, Thompson RF. Ipsilateral cerebellar lesions prevent learning of the classically conditioned nictitating membrane/eyelid response. Brain Res. 1982;242:190–193. doi: 10.1016/0006-8993(82)90510-8. [DOI] [PubMed] [Google Scholar]
- Linden DJ. Neuroscience. From molecules to memory in the cerebellum. Science. 2003;301:1682–1685. doi: 10.1126/science.1090462. [DOI] [PubMed] [Google Scholar]
- Marr D. A theory of cerebellar cortex. J Physiol. 1969;202:437–470. doi: 10.1113/jphysiol.1969.sp008820. [DOI] [PMC free article] [PubMed] [Google Scholar]
- Mauk MD, Steinmetz JE, Thompson RF. Classical conditioning using stimulation of the inferior olive as the unconditioned stimulus. Proc Natl Acad Sci U S A. 1986;83:5349–5353. doi: 10.1073/pnas.83.14.5349. [DOI] [PMC free article] [PubMed] [Google Scholar]
- McCormick DA, Thompson RF. Cerebellum: essential involvement in the classically conditioned eyelid response. Science. 1984a;223:296–299. doi: 10.1126/science.6701513. [DOI] [PubMed] [Google Scholar]
- McCormick DA, Thompson RF. Neuronal responses of the rabbit cerebellum during acquisition and performance of a classically conditioned nictitating membrane-eyelid response. J Neurosci. 1984b;4:2811–2822. doi: 10.1523/JNEUROSCI.04-11-02811.1984. [DOI] [PMC free article] [PubMed] [Google Scholar]
- McCormick DA, Lavond DG, Clark GA, Kettner RE, Rising CE, Thompson RF. The engram found? Role of the cerebellum in classical conditioning of nictitating membrane and eyelid responses. Bull Psychon Soc. 1981;18:103–105. [Google Scholar]
- McCormick DA, Steinmetz JE, Thompson RF. Lesions of the inferior olivary complex cause extinction of the classically conditioned eyeblink response. Brain Res. 1985;359:120–130. doi: 10.1016/0006-8993(85)91419-2. [DOI] [PubMed] [Google Scholar]
- Medina JF, Lisberger SG. Links from complex spikes to local plasticity and motor learning in the cerebellum of awake-behaving monkeys. Nat Neurosci. 2008;11:1185–1192. doi: 10.1038/nn.2197. [DOI] [PMC free article] [PubMed] [Google Scholar]
- Medina JF, Nores WL, Mauk MD. Inhibition of climbing fibres is a signal for the extinction of conditioned eyelid responses. Nature. 2002;416:330–333. doi: 10.1038/416330a. [DOI] [PubMed] [Google Scholar]
- Offenhauser N, Thomsen K, Caesar K, Lauritzen M. Activity-induced tissue oxygenation changes in rat cerebellar cortex: interplay of postsynaptic activation and blood flow. J Physiol. 2005;565:279–294. doi: 10.1113/jphysiol.2005.082776. [DOI] [PMC free article] [PubMed] [Google Scholar]
- Ohyama T, Nores WL, Medina JF, Riusech FA, Mauk MD. Learning-induced plasticity in deep cerebellar nucleus. J Neurosci. 2006;26:12656–12663. doi: 10.1523/JNEUROSCI.4023-06.2006. [DOI] [PMC free article] [PubMed] [Google Scholar]
- Pardoe J, Edgley SA, Drew T, Apps R. Changes in excitability of ascending and descending inputs to cerebellar climbing fibers during locomotion. J Neurosci. 2004;24:2656–2666. doi: 10.1523/JNEUROSCI.1659-03.2004. [DOI] [PMC free article] [PubMed] [Google Scholar]
- Perrett SP, Ruiz BP, Mauk MD. Cerebellar cortex lesions disrupt learning-dependent timing of conditioned eyelid responses. J Neurosci. 1993;13:1708–1718. doi: 10.1523/JNEUROSCI.13-04-01708.1993. [DOI] [PMC free article] [PubMed] [Google Scholar]
- Sanchez M, Sillitoe RV, Attwell PJ, Ivarsson M, Rahman S, Yeo CH, Hawkes R. Compartmentation of the rabbit cerebellar cortex. J Comp Neurol. 2002;444:159–173. doi: 10.1002/cne.10144. [DOI] [PubMed] [Google Scholar]
- Sugihara I, Shinoda Y. Molecular, topographic, and functional organization of the cerebellar cortex: a study with combined aldolase C and olivocerebellar labeling. J Neurosci. 2004;24:8771–8785. doi: 10.1523/JNEUROSCI.1961-04.2004. [DOI] [PMC free article] [PubMed] [Google Scholar]
- Sugihara I, Shinoda Y. Molecular, topographic, and functional organization of the cerebellar nuclei: analysis by three-dimensional mapping of the olivonuclear projection and aldolase C labeling. J Neurosci. 2007;27:9696–9710. doi: 10.1523/JNEUROSCI.1579-07.2007. [DOI] [PMC free article] [PubMed] [Google Scholar]
- Thach WT., Jr Somatosensory receptive fields of single units in cat cerebellar cortex. J Neurophysiol. 1967;30:675–696. doi: 10.1152/jn.1967.30.4.675. [DOI] [PubMed] [Google Scholar]
- Trott JR, Apps R, Armstrong DM. Zonal organization of cortico-nuclear and nucleo-cortical projections of the paramedian lobule of the cat cerebellum. 2. the C2 zone. Exp Brain Res. 1998;118:316–330. doi: 10.1007/s002210050286. [DOI] [PubMed] [Google Scholar]
- Van Ham JJ, Yeo CH. Somatosensory trigeminal projections to the inferior olive, cerebellum and other precerebellar nuclei in rabbits. Eur J Neurosci. 1992;4:302–317. doi: 10.1111/j.1460-9568.1992.tb00878.x. [DOI] [PubMed] [Google Scholar]
- Vogel RW, Amundson JC, Lindquist DH, Steinmetz JE. Eyeblink conditioning during an interstimulus interval switch in rabbits (Oryctolagus cuniculus) using picrotoxin to disrupt cerebellar cortical input to the interpositus nucleus. Behav Neurosci. 2009;123:62–74. doi: 10.1037/a0014082. [DOI] [PMC free article] [PubMed] [Google Scholar]
- Voogd J, Glickstein M. The anatomy of the cerebellum. Trends Neurosci. 1998;21:370–375. doi: 10.1016/s0166-2236(98)01318-6. [DOI] [PubMed] [Google Scholar]
- Voogd J, Ruigrok TJ. The organization of the corticonuclear and olivocerebellar climbing fiber projections to the rat cerebellar vermis: the congruence of projection zones and the zebrin pattern. J Neurocytol. 2004;33:5–21. doi: 10.1023/B:NEUR.0000029645.72074.2b. [DOI] [PubMed] [Google Scholar]
- Yeo CH, Hardiman MJ. Cerebellar cortex and eyeblink conditioning: a reexamination. Exp Brain Res. 1992;88:623–638. doi: 10.1007/BF00228191. [DOI] [PubMed] [Google Scholar]
- Yeo CH, Hesslow G. Cerebellum and conditioned reflexes. Trends Cogn Sci. 1998;2:322–330. doi: 10.1016/s1364-6613(98)01219-4. [DOI] [PubMed] [Google Scholar]
- Yeo CH, Hardiman MJ, Glickstein M. Discrete lesions of the cerebellar cortex abolish the classically conditioned nictitating membrane response of the rabbit. Behav Brain Res. 1984;13:261–266. doi: 10.1016/0166-4328(84)90168-2. [DOI] [PubMed] [Google Scholar]
- Yeo CH, Hardiman MJ, Glickstein M. Classical conditioning of the nictitating membrane response of the rabbit. I. Lesions of the cerebellar nuclei. Exp Brain Res. 1985a;60:87–98. doi: 10.1007/BF00237022. [DOI] [PubMed] [Google Scholar]
- Yeo CH, Hardiman MJ, Glickstein M. Classical conditioning of the nictitating membrane response of the rabbit. II. Lesions of the cerebellar cortex. Exp Brain Res. 1985b;60:99–113. doi: 10.1007/BF00237023. [DOI] [PubMed] [Google Scholar]
- Yeo CH, Hardiman MJ, Glickstein M. Classical conditioning of the nictitating membrane response of the rabbit. III. Connections of cerebellar lobule HVI. Exp Brain Res. 1985c;60:114–126. doi: 10.1007/BF00237024. [DOI] [PubMed] [Google Scholar]
- Yeo CH, Hardiman MJ, Glickstein M. Classical conditioning of the nictitating membrane response of the rabbit. IV. Lesions of the inferior olive. Exp Brain Res. 1986;63:81–92. doi: 10.1007/BF00235649. [DOI] [PubMed] [Google Scholar]