

Abstract
Recent work reported the observation of alpha frequency oscillations (8–12 Hz) in several regions of macaque visual cortex, including V2, V4, and inferotemporal cortex (IT). While alpha-related physiology in V2 and V4 appears consistent with a role in attention-related suppression, in IT, alpha reactivity appears conflicted with such a role. We addressed this issue directly by analyzing laminar profiles of local field potentials and multiunit activities from the IT of macaque monkeys during performance of an intermodal selective attention task (visual versus auditory). We found that (1) before visual stimulus onset (−200 to 0 ms), attention to visual input increased ongoing alpha power in IT relative to attention to auditory input, and (2) in contrast to the prevailing view of alpha inhibition, the increased ongoing alpha activity is accompanied by increased concurrent multiunit firing and facilitates visual stimulus processing. These results suggest that ongoing alpha oscillations in IT play a different functional role than that in the occipital cortex and may be part of the neuronal mechanism representing task-relevant information.
Introduction
Stimulus-evoked neural responses and their attentional modulation have been extensively studied (Gazzaniga et al., 2009). Whether and how attention modulates ongoing brain activity when it is deployed in advance of sensory stimulation has also attracted increased research interest (Kastner et al., 1999; Driver and Frith, 2000; Pasternak and Greenlee, 2005; Procyk and Goldman-Rakic, 2006; Fuster, 2008). This internally generated expectancy state improves behavioral performance by shortening reaction time and reducing the number of errors and is thought to be implemented by top-down control mechanisms (Knight et al., 1999; Hopfinger et al., 2000; Miller, 2000; Engel et al., 2001; LaBerge, 2005; Buschman and Miller, 2007; Rossi et al., 2007; Fuster, 2008; Gregoriou et al., 2009).
In humans the relationship between field oscillations in the 8–12 Hz range, known as alpha oscillations, and attention has been the subject of extensive investigation (Pfurtscheller et al., 1996; Shaw, 2003). An emerging consensus (Ray and Cole, 1985; Cooper et al., 2003, 2006) is that when a subject attends to external events, alpha power in scalp EEG decreases with attention (Worden et al., 2000; Sauseng et al., 2005; Rangarajan and Ding, 2010). In contrast, when attention is directed internally, such as during visual imagery and retention of working memory, alpha power increases with attention (Bastiaansen et al., 2002; Jensen et al., 2002; Raghavachari et al., 2006). Physiologically, whereas the decreased alpha power with external attention is thought to reflect increased excitability over sensory cortices to enhance stimulus processing (Jones et al., 2000; Thut et al., 2006; Klimesch et al., 2007; Romei et al., 2008; Rangarajan and Ding, 2010), the significance of increased alpha power with internal attention remains debated. According to the alpha inhibition hypothesis (Jensen et al., 2002; Klimesch et al., 2007), the increased alpha power reflects decreased excitability over sensory cortices, which in turn serves as a mechanism to protect the information maintained in working memory from external interference. On the other hand, the alpha representation hypothesis (Palva and Palva, 2007) posits a direct role of alpha oscillations in representing the information maintained in working memory. Although recent studies lend support to the alpha inhibition hypothesis (van Dijk et al., 2010), the possibility that certain higher-order brain areas may use increased alpha oscillations to represent task-relevant information cannot be ruled out. The main reason is that noninvasive measures such as EEG/MEG have limited spatial resolution and lack access to neuronal firing properties.
We have recently investigated spontaneous ongoing cortical alpha oscillations in behaving macaque monkeys. Our results showed that the laminar profile of the alpha-generating mechanism in the inferotemporal cortex (IT) is different from that in V4 and V2 (Bollimunta et al., 2008). A natural question is whether this “structural” difference in alpha organization between higher-order and lower-order visual areas can give rise to the difference in function supported by alpha oscillations. This study examined this issue at the level of IT by analyzing laminar profiles of local field potentials (LFPs) and multiunit activity (MUA) from two macaque monkeys performing an intermodal selective attention task, in which they received bimodal stimulation, but directed attention to either visual or auditory stimuli in alternating trial blocks.
Materials and Methods
Experiment
Paradigm.
Two male macaque monkeys, B and V, were trained to perform an intermodal selective attention task (Mehta et al., 2000a,b; Lakatos et al., 2008). In this task (Fig. 1A), interdigitated auditory and visual stimuli (beeps and flashes) were delivered with random stimulus onset asynchronies varying between 500 and 800 ms (Gaussian distribution), with a mean of 650 ms within each stream. Flashes were presented on a diffusing screen subtending 20 retinal degrees, at 1 m in front of the monkey. To begin a trial block, the monkey had to depress a hand switch and fixate within a central 10 degree window centered on the visual stimulator. In alternating trial blocks, the monkey had to attend to either the visual or the auditory stimulus stream and make a manual response to an infrequently presented “oddball” stimulus (14% of trials) in the attended modality. Task difficulty, defined in terms of percentage correct rate, was kept approximately the same between modalities to control the effects of arousal.
Figure 1.
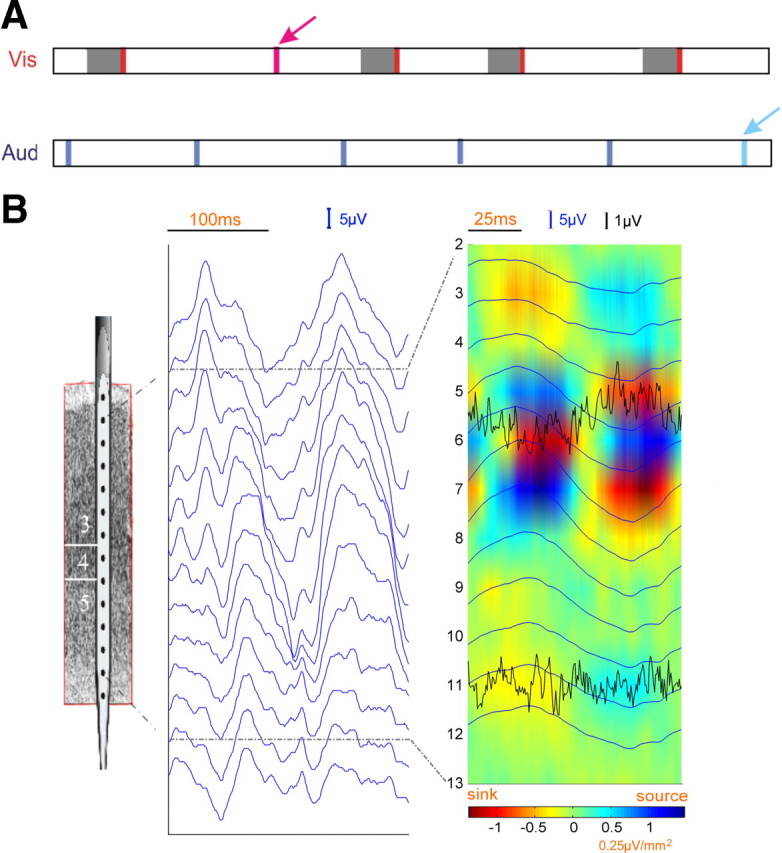
A, Time course of stimulus presentation in both the visual and auditory domains. The shaded interval before each standard visual stimulus defines the prestimulus time period (−200 to 0 ms). Vertical bars represent stimuli and the deviant stimuli are indicated by arrows. B, Schematic of electrode (left), 200 ms of LFP data showing the presence of alpha oscillations (middle), and the current source density profile of alpha oscillations with MUA superimposed (right). Here the LFP data were bandpass filtered between 3 and 100 Hz.
Data acquisition.
Monkeys were surgically prepared for chronic awake recording as described before (Mehta et al., 2000a,b). Laminar profiles of LFP and MUA were sampled at 2 kHz using a linear array multielectrode with 14 equally spaced recording contacts (channels) schematically illustrated in Figure 1B (left). In each subject, multiple penetrations were made in different visual cortical areas. Here, the data from a total of nine penetrations from the inferotemporal cortex with percentage correct rates all >97% were analyzed, six in monkey B and three in monkey V.
Data analysis
Preprocessing.
Continuous LFP data were bandpass filtered between 3 and 100 Hz and downsampled to 200 Hz. Both LFP and MUA data were epoched from −200 to 400 ms with 0 ms denoting the onset of visual standard stimulus. For each penetration, following the rejection of trials with incorrect responses and trials with excessively large LFP and MUA magnitude, the number of trials available for analysis was roughly the same for the attend-visual and the ignore-visual (attend-auditory) conditions. Specifically, combining all nine penetrations, there are a total of 9762 attend-visual trials and 9846 ignore-visual trials.
Analysis of prestimulus ongoing activity.
The prestimulus time period is defined to be −200 to 0 ms, during which the monkey sustained attention to a given modality (Fig. 1A). For a given channel and a given experimental condition, the trials of LFP data during the prestimulus time period were treated as realizations of an underlying stationary stochastic process and subjected to parametric autoregressive data modeling, where the model order was chosen to be 12 according to the Akaike information criterion (Ding et al., 2000). From the model coefficients, the power spectrum was derived, and the alpha band power was obtained by integrating the power spectrum from 8 to 12 Hz. Because the magnitude of alpha power varied significantly from channel to channel, to minimize the effect of this variability on population averaging, a normalization procedure was implemented in which the alpha power for a given attention condition is divided by the sum of the alpha power from both attention conditions. From the normalized alpha power of each recording channel, two types of averages were carried out: (1) across all penetrations to produce overall alpha power and (2) across channels in given layers to produce layer-specific alpha power. The MUA data from each trial were first averaged between −200 and 0 ms and then over all the trials in a given condition. The resulting quantity was subjected to the same analysis as that of alpha power. The statistical significance between conditions was assessed by a paired t test.
From ongoing activity to evoked response.
To investigate the impact of prestimulus alpha power on stimulus processing, a single-trial sorting and grouping procedure was used for the attend-visual condition. Step 1: For a given recording channel, LFP power in the alpha band during the prestimulus time period was estimated on a trial-by-trial basis by the multitaper method (Mitra and Pesaran, 1999). Step 2: The alpha power was log-transformed to yield an approximately normally distributed variable and converted into a z-score. Step 3: The trials were rank-ordered according to the z-score of prestimulus alpha power and sorted in an ascending fashion into 50 nonoverlapping groups of equal size. Step 4: For each group, the efficacy of stimulus processing was assessed by two quantities: (a) power of stimulus-evoked LFP gamma oscillation (25 Hz to 50 Hz) and (b) magnitude of stimulus-evoked MUA, both during the time period of 50 to 150 ms. Each quantity, after log-transformation and z-scoring, was plotted as a function of the group mean alpha power z-score, from which a correlation coefficient was computed. Step 5: The above steps 1–4 were repeated for all recording channels across all nine penetrations. The correlation coefficients were Fisher-transformed and tested for statistical significance. Step 6: The correlation coefficient between stimulus-evoked MUA magnitude and stimulus-evoked gamma power was also computed, Fisher-transformed, and tested for statistical significance.
Results
The average percentage correct rates for the attend-visual and ignore-visual conditions are 99.0 ± 0.31% and 98.3 ± 0.28%, respectively. LFP oscillations in the alpha band (8–12 Hz) were observed in all nine penetrations during the prestimulus time period (−200 to 0 ms). An example is shown in Figure 1B (middle). Figure 2A is the power spectra from a representative channel where alpha peaks are readily identifiable and alpha power is higher for attend-visual than for ignore-visual conditions. Across nine penetrations, the average alpha peak frequency is 8.69 ± 0.88 Hz, and the average alpha power is significantly higher with visual attention (p < 0.001), as seen in Figure 2B.
Figure 2.
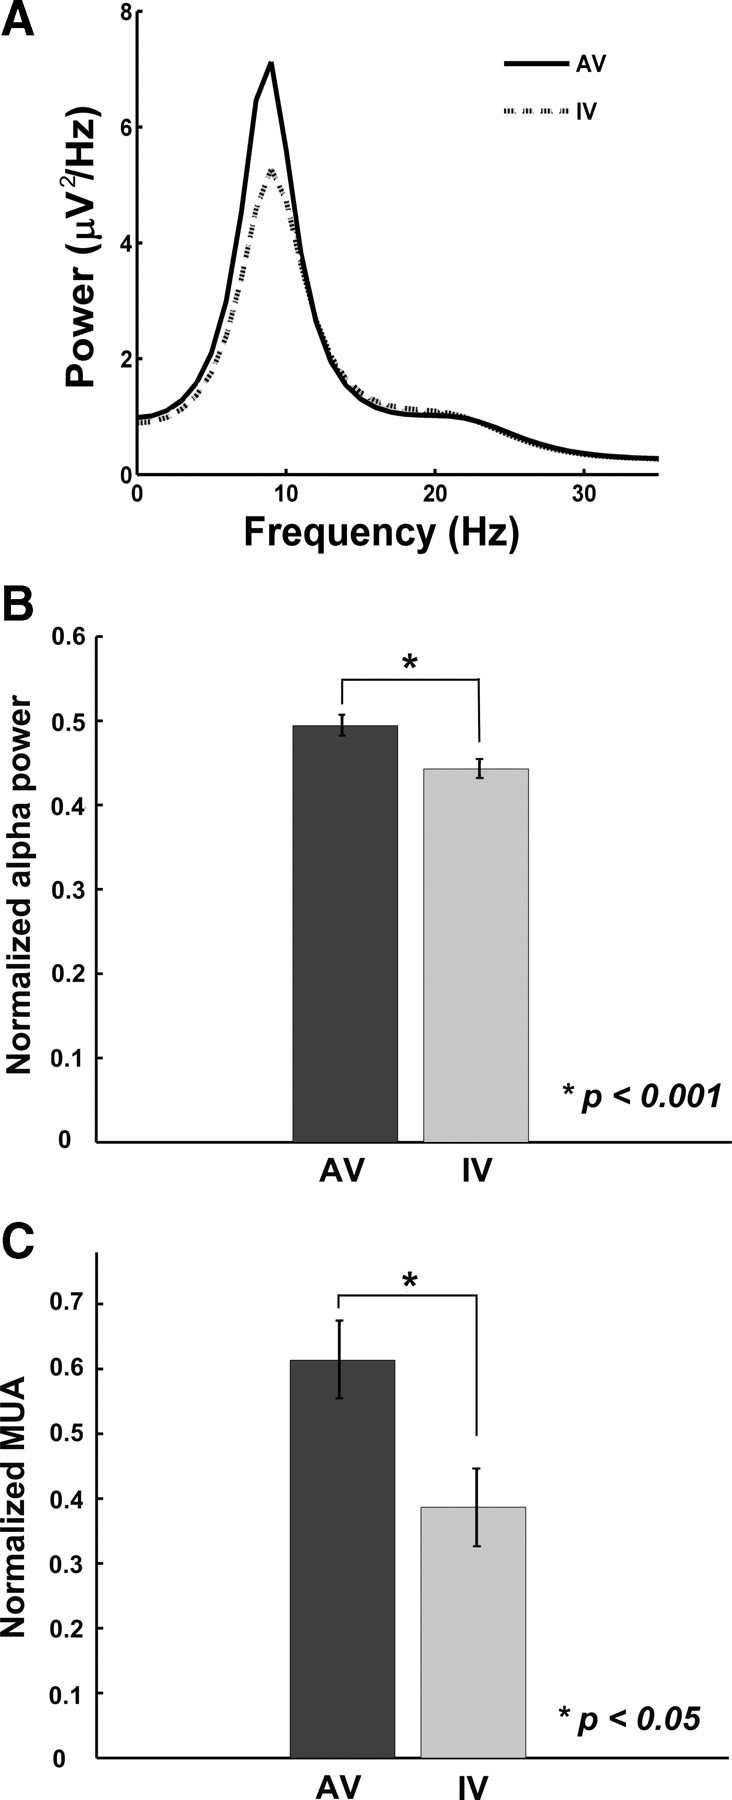
Attentional modulation of prestimulus neuronal activity. A, LFP power spectra from a representative channel. B, Comparison of averaged LFP alpha power. C, Comparison of averaged MUA. For both LFP alpha power and MUA, a normalization procedure was performed for each recording channel before averaging across channels, according to the following formula: condition/(attend-visual + ignore-visual). Error bar denotes the SEM. AV, Attend-visual; IV, ignore-visual (attend-auditory).
Bollimunta et al. (2008), analyzing data from a different condition of the same overall experiment in which the monkey discriminated auditory stimuli in the absence of visual input, found that the main alpha current generator of a source-sink-source configuration is located in the superficial layers of IT, and a weaker alpha current generator is located in the deep layers. This is illustrated in Figure 1B (right) for the attend-visual condition where the current source density profile was obtained using the phase realigned averaging technique (Bollimunta et al., 2008). Granger causality analysis further revealed that the superficial layer generator exerts unidirectional causal driving on the deep layer generator. Consistent with this overall picture, alpha power in the superficial layers is on average 19% higher for the attend-visual than for the ignore-visual condition, and this contrasts with a 13% attentional increase of alpha power in the deep layers. Concomitant with increased alpha power in the LFP profile, MUA in the same prestimulus time period was also significantly elevated by visual attention (Fig. 2C) (p < 0.05), suggesting that there is an attention-induced increase in excitability that is sufficient to cross the threshold for generating an increase in action potentials.
To investigate how prestimulus alpha activity impacted stimulus processing, prestimulus alpha power for each trial under the attend-visual condition from a given channel was log-transformed, z-scored, and sorted in an ascending fashion into 50 nonoverlapping groups. For each group, the average stimulus-evoked gamma power and stimulus-evoked MUA activity in the period of 50 to 150 ms was estimated, z-scored, and plotted as a function of the average prestimulus alpha power z-score for that group. The results for a representative channel are shown in Figure 3, A and B. For both evoked gamma and evoked MUA, a positive correlation is clearly seen, suggesting that the stronger the prestimulus alpha oscillation, the stronger the stimulus-evoked activity. Across all recording channels, the average correlation coefficient is r = 0.4 for evoked gamma and r = 0.1 for evoked MUA, both significantly greater than zero at p < 0.0001. Figure 3C plots evoked MUA against evoked gamma for the same channel. Again a positive correlation is seen. Across all recording channels, the average correlation coefficient is r = 0.2, which is significantly greater than zero at p < 0.0001.
Figure 3.

From prestimulus ongoing activity (−200 to 0 ms) to stimulus-evoked response (50 to 150 ms). A, B, Stimulus-evoked gamma power (25 Hz to 50 Hz) (A) and stimulus-evoked MUA magnitude (B) as a function of prestimulus alpha power for a representative recording channel. Here all quantities were converted to z-scores to facilitate comparison across different recording channels (see Materials and Methods). C, Stimulus-evoked gamma power in A versus stimulus-evoked MUA magnitude in B.
Discussion
Despite decades of investigation, the physiological genesis and functional significance of alpha oscillations (8–12 Hz) are still debated (Andersen and Andersson, 1968; Shaw, 2003; Palva and Palva, 2007). While data from animal models including rats, cats, and dogs have contributed much to our understanding of the cellular basis of alpha (Lopes da Silva et al., 1973; Steriade et al., 1990; Hughes and Crunelli, 2005), relatively little has been done in the behaving monkey, perhaps the most widely used animal model in cognitive neuroscience. Analyzing data from visual cortex of macaques performing auditory discrimination, we recently reported that in V2 and V4, primary alpha activity generators are located in the deep layers, whereas in IT, such generators are located in the superficial layers (Bollimunta et al., 2008). This difference in laminar organization is hypothesized to be linked to the difference in function alpha might support. In particular, in V2 and V4, faster reaction time (RT) to auditory stimulus detection, considered an index of increased auditory attentiveness at the expense of visual attention, is associated with increased visual alpha power, consistent with the classical alpha reactivity in that visual attention reduces alpha power in sensory cortices. In IT, however, faster auditory RT is associated with decreased alpha power, suggesting that visual attention increases alpha power in IT.
In Bollimunta et al. (2008), the level of visual attention is indirectly inferred from the magnitude of auditory reaction time. In this study, attention to visual and to auditory stimuli are each explicitly manipulated. Three results are reported. First, prestimulus LFP alpha power is higher for the attend-visual condition relative to the ignore-visual (attend-auditory) condition. Second, prestimulus MUA, reflecting the temporal envelope of local neuronal firing, is larger for the attend-visual than the ignore-visual condition. Third, on a trial-by-trial basis, stronger prestimulus alpha activity predicts stronger stimulus-evoked response, measured by evoked LFP gamma power and MUA magnitude. Together, these results suggest that alpha oscillations in the inferotemporal cortex are not only organized differently than lower-level sensory cortices, they may also play a direct role in amplifying the representation of task-relevant information and facilitating sensory processing, which is in marked contrast to occipital alpha, where its increase in power is often linked to functional inhibition.
In humans, when attention is directed externally to the environment (intake tasks), increased attention is associated with decreased alpha power (Worden et al., 2000; Sauseng et al., 2005; Rajagovindan and Ding, 2010). In contrast, when attention is directed internally (rejection tasks), alpha oscillation increases with an increase in attentional demand (Bastiaansen et al., 2002; Jensen et al., 2002; Raghavachari et al., 2006). A common physiological interpretation is that decreased alpha power reflects increased cortical excitability for enhanced stimulus processing, whereas increased alpha power reflects reduced cortical excitability, providing an active inhibition mechanism for protecting the task-relevant information maintained in working memory from interference (Jones et al., 2000; Worden et al., 2000; Sauseng et al., 2005; Thut et al., 2006; Klimesch et al., 2007; Romei et al., 2008; Rangarajan and Ding, 2010). Recently, in an alternative explanation for the increase in alpha during internal attention tasks, alpha oscillations are given a direct role in representing task-relevant information (Palva and Palva, 2007).
Many attention paradigms involve both sensory intake and internal representation. In the present experiment, monkeys discriminated either visual or auditory stimuli, while ignoring all stimuli in the unattended domain. To perform the task effectively, the monkey must maintain a template of the stimulus attributes (representation) between successive stimulations in the working memory buffer (Knight and Nakada, 1998), and at the same time direct attention externally to the environment for accurate detection and encoding of sensory input (intake). The inferotemporal cortex, as part of the working memory network, has been hypothesized as a higher-order area where task-relevant information is being maintained (Miller and Desimone, 1994). The observed increase in IT alpha with visual attention suggests that it may be part of the mechanism involved in representing such information. The concurrent increase of multiunit firing is consistent with this view. In addition, the positive correlation between prestimulus alpha power and stimulus-evoked response, particularly the gamma response, can be seen as providing further evidence of the alpha representation idea. Past work has suggested that stimulus-evoked gamma is a reflection of pattern matching between sensory input and working memory content (Herrmann et al., 2004); better representation (higher alpha) leads to more effective pattern matching (high gamma). These results, in conjunction with the previously reported decrease of alpha power in occipital areas of V2 and V4 with visual attention (Bollimunta et al., 2008), demonstrate that both increased and decreased alpha oscillations may be realized in the same experiment across diverse brain systems. We note that the experimental task used here is not a traditional internal attention task, which in humans often involves visual imagery or manipulation of working memory load.
Attentional modulation of neuronal activity in the absence of sensory stimulation is thought to be implemented by top-down control mechanisms. Numerous studies using a variety of techniques (Miller and Desimone, 1994; Chao and Knight, 1998; Knight et al., 1999; Naya et al., 2001; Moore and Armstrong, 2003; Fuster, 2008; Zhang and Ding, 2010) have implicated the prefrontal cortex as a source of the top-down control signal. Because the projections from the prefrontal cortex terminate mostly in the superficially layers of IT (Rempel-Clower and Barbas, 2000), the stronger attentional effect we observe in the superficial layers is consistent with this view. Functionally, given the interference of auditory stimuli on visual discrimination, the prefrontal cortex is especially important in resisting distraction and in maintaining stimulus representation necessary for task performance (Knight et al., 1999).
In addition to alpha power, the phase of prestimulus alpha oscillations can also significantly affect stimulus processing (Brandt and Jansen, 1991; Makeig et al., 2002; Mathewson et al., 2009). Lakatos et al. (2008) demonstrated that in V1, the phase of delta band oscillations (1–3 Hz) was realigned by attention so that the attended events occurred during the high-excitability phase of the oscillation. However, given the degree of interstimulus jitter (hundreds of milliseconds) in the present experiment, this mechanism is unlikely to apply to the phase of the much faster alpha oscillations, which leaves alpha power as the main variable modulated by the attention system.
Footnotes
This research was supported by National Institutes of Health Grants MH79388, MH70498, and MH87275. We thank Yonghong Chen for discussions and help with data analysis.
References
- Andersen P, Andersson SA. Physiological basis of the alpha rhythm. New York: Appleton-Century-Crofts; 1968. [Google Scholar]
- Bastiaansen MCM, Posthuma D, Groot PFC, de Geus EJC. Event-related alpha and theta responses in a visuo-spatial working memory task. Clin Neurophysiol. 2002;113:1882–1893. doi: 10.1016/s1388-2457(02)00303-6. [DOI] [PubMed] [Google Scholar]
- Bollimunta A, Chen Y, Schroeder CE, Ding M. Neuronal mechanisms of cortical alpha oscillations in awake-behaving macaques. J Neurosci. 2008;28:9976–9988. doi: 10.1523/JNEUROSCI.2699-08.2008. [DOI] [PMC free article] [PubMed] [Google Scholar]
- Brandt ME, Jansen BH. The relationship between prestimulus-alpha amplitude and visual evoked potential amplitude. Int J Neurosci. 1991;61:261–268. doi: 10.3109/00207459108990744. [DOI] [PubMed] [Google Scholar]
- Buschman TJ, Miller EK. Top-down versus bottom-up control of attention in the prefrontal and posterior parietal cortices. Science. 2007;315:1860–1862. doi: 10.1126/science.1138071. [DOI] [PubMed] [Google Scholar]
- Chao LL, Knight RT. Contribution of human prefrontal cortex to delay performance. J Cogn Neurosci. 1998;10:167–177. doi: 10.1162/089892998562636. [DOI] [PubMed] [Google Scholar]
- Cooper NR, Croft RJ, Dominey SJJ, Burgess AP, Gruzelier JH. Paradox lost? Exploring the role of alpha oscillations during externally vs. internally directed attention and the implications for idling and inhibition hypotheses. Int J Psychophysiol. 2003;47:65–74. doi: 10.1016/s0167-8760(02)00107-1. [DOI] [PubMed] [Google Scholar]
- Cooper NR, Burgess AP, Croft RJ, Gruzelier JH. Investigating evoked and induced electroencephalogram activity in task-related alpha power increases during an internally directed attention task. Neuroreport. 2006;17:205–208. doi: 10.1097/01.wnr.0000198433.29389.54. [DOI] [PubMed] [Google Scholar]
- Ding M, Bressler SL, Yang W, Liang H. Short-window spectral analysis of cortical event-related potentials by adaptive multivariate autoregressive modeling: data preprocessing, model validation, and variability assessment. Biol Cybern. 2000;83:35–45. doi: 10.1007/s004229900137. [DOI] [PubMed] [Google Scholar]
- Driver J, Frith C. Shifting baselines in attention research. Nat Rev Neurosci. 2000;1:147–148. doi: 10.1038/35039083. [DOI] [PubMed] [Google Scholar]
- Engel AK, Fries P, Singer W. Dynamic predictions: oscillations and synchrony in top-down processing. Nat Rev Neurosci. 2001;2:704–716. doi: 10.1038/35094565. [DOI] [PubMed] [Google Scholar]
- Fuster JM. The prefrontal cortex. Ed 4. New York: Academic; 2008. [Google Scholar]
- Gazzaniga MS, Ivry RB, Mangun GR. The cognitive neurosciences. Ed 4. Cambridge, MA: MIT Press; 2009. [Google Scholar]
- Gregoriou GG, Gotts SJ, Zhou H, Desimone R. High-frequency, long-range coupling between prefrontal and visual cortex during attention. Science. 2009;324:1207–1210. doi: 10.1126/science.1171402. [DOI] [PMC free article] [PubMed] [Google Scholar]
- Herrmann CS, Munk MHJ, Engel AK. Cognitive functions of gamma-band activity: memory match and utilization. Trends Cogn Sci. 2004;8:347–355. doi: 10.1016/j.tics.2004.06.006. [DOI] [PubMed] [Google Scholar]
- Hopfinger JB, Buonocore MH, Mangun GR. The neural mechanisms of top-down attentional control. Nat Neurosci. 2000;3:284–291. doi: 10.1038/72999. [DOI] [PubMed] [Google Scholar]
- Hughes SW, Crunelli V. Thalamic mechanisms of EEG alpha rhythms and their pathological implications. Neuroscientist. 2005;11:357–372. doi: 10.1177/1073858405277450. [DOI] [PubMed] [Google Scholar]
- Jensen O, Gelfand J, Kounios J, Lisman JE. Oscillations in the alpha band (9–12 Hz) increase with memory load during retention in a short-term memory task. Cereb Cortex. 2002;12:877–882. doi: 10.1093/cercor/12.8.877. [DOI] [PubMed] [Google Scholar]
- Jones SR, Pinto DJ, Kaper TJ, Kopell N. Alpha-frequency rhythms desynchronize over long cortical distances: a modeling study. J Comput Neurosci. 2000;9:271–291. doi: 10.1023/a:1026539805445. [DOI] [PubMed] [Google Scholar]
- Kastner S, Pinsk MA, De Weerd P, Desimone R, Ungerleider LG. Increased activity in human visual cortex during directed attention in the absence of visual stimulation. Neuron. 1999;22:751–761. doi: 10.1016/s0896-6273(00)80734-5. [DOI] [PubMed] [Google Scholar]
- Klimesch W, Sauseng P, Hanslmayr S. EEG alpha oscillations: the inhibition-timing hypothesis. Brain Res Rev. 2007;53:63–88. doi: 10.1016/j.brainresrev.2006.06.003. [DOI] [PubMed] [Google Scholar]
- Knight RT, Nakada T. Cortico-limbic circuits and novelty. Rev Neurosci. 1998;9:57–70. doi: 10.1515/revneuro.1998.9.1.57. [DOI] [PubMed] [Google Scholar]
- Knight RT, Staines WR, Swick D, Chao LL. Prefrontal cortex regulates inhibition and excitation in distributed neural networks. Acta Psychol (Amst) 1999;101:159–178. doi: 10.1016/s0001-6918(99)00004-9. [DOI] [PubMed] [Google Scholar]
- LaBerge D. Sustained attention and apical dendrite activity in recurrent circuits. Brain Res Rev. 2005;50:86–99. doi: 10.1016/j.brainresrev.2005.04.004. [DOI] [PubMed] [Google Scholar]
- Lakatos P, Karmos G, Mehta AD, Ulbert I, Schroeder CE. Entrainment of neuronal oscillations as a mechanism of attentional selection. Science. 2008;320:110–113. doi: 10.1126/science.1154735. [DOI] [PubMed] [Google Scholar]
- Lopes da Silva FH, van Lierop TH, Schrijer CF, van Leeuwen WS. Organization of thalamic and cortical alpha rhythms: spectra and coherences. Electroencephalogr Clin Neurophysiol. 1973;35:627–639. doi: 10.1016/0013-4694(73)90216-2. [DOI] [PubMed] [Google Scholar]
- Makeig S, Westerfield M, Jung TP, Enghoff S, Townsend J, Courchesne E, Sejnowski TJ. Dynamic brain sources of visual evoked responses. Science. 2002;295:690–694. doi: 10.1126/science.1066168. [DOI] [PubMed] [Google Scholar]
- Mathewson KE, Gratton G, Fabiani M, Beck DM, Ro T. To see or not to see: prestimulus phase predicts visual awareness. J Neurosci. 2009;29:2725–2732. doi: 10.1523/JNEUROSCI.3963-08.2009. [DOI] [PMC free article] [PubMed] [Google Scholar]
- Mehta AD, Ulbert I, Schroeder CE. Intermodal selective attention in monkeys. I: Distribution and timing of effects across visual areas. Cereb Cortex. 2000a;10:343–358. doi: 10.1093/cercor/10.4.343. [DOI] [PubMed] [Google Scholar]
- Mehta AD, Ulbert I, Schroeder CE. Intermodal selective attention in monkeys. II: Physiological mechanisms of modulation. Cereb Cortex. 2000b;10:359–370. doi: 10.1093/cercor/10.4.359. [DOI] [PubMed] [Google Scholar]
- Miller EK. The prefrontal cortex and cognitive control. Nat Rev Neurosci. 2000;1:59–65. doi: 10.1038/35036228. [DOI] [PubMed] [Google Scholar]
- Miller EK, Desimone R. Parallel neuronal mechanisms for short term memory. Science. 1994;263:520–522. doi: 10.1126/science.8290960. [DOI] [PubMed] [Google Scholar]
- Mitra PP, Pesaran B. Analysis of dynamic brain imaging data. Biophys J. 1999;76:691–708. doi: 10.1016/S0006-3495(99)77236-X. [DOI] [PMC free article] [PubMed] [Google Scholar]
- Moore T, Armstrong KM. Selective gating of visual signals by microstimulation of frontal cortex. Nature. 2003;421:370–373. doi: 10.1038/nature01341. [DOI] [PubMed] [Google Scholar]
- Naya Y, Yoshida M, Miyashita Y. Backward spreading of memory-retrieval signal in the primate temporal cortex. Science. 2001;291:661–664. doi: 10.1126/science.291.5504.661. [DOI] [PubMed] [Google Scholar]
- Palva S, Palva JM. New vistas for alpha-frequency band oscillations. Trends Neurosci. 2007;30:150–158. doi: 10.1016/j.tins.2007.02.001. [DOI] [PubMed] [Google Scholar]
- Pasternak T, Greenlee MW. Working memory in primate sensory systems. Nat Rev Neurosci. 2005;6:97–107. doi: 10.1038/nrn1603. [DOI] [PubMed] [Google Scholar]
- Pfurtscheller G, Stancák A, Jr, Neuper C. Event-related synchronization (ERS) in the alpha band—an electrophysiological correlate of cortical idling: a review. Int J Psychophysiol. 1996;24:39–46. doi: 10.1016/s0167-8760(96)00066-9. [DOI] [PubMed] [Google Scholar]
- Procyk E, Goldman-Rakic PS. Modulation of dorsolateral prefrontal delay activity during self-organized behavior. J Neurosci. 2006;26:11313–11323. doi: 10.1523/JNEUROSCI.2157-06.2006. [DOI] [PMC free article] [PubMed] [Google Scholar]
- Raghavachari S, Lisman JE, Tully M, Madsen JR, Bromfield EB, Kahana MJ. Theta oscillations in human cortex during a working-memory task: evidence for local generators. J Neurophysiol. 2006;95:1630–1638. doi: 10.1152/jn.00409.2005. [DOI] [PubMed] [Google Scholar]
- Rajagovindan R, Ding M. From prestimulus alpha oscillation to visual evoked response: an inverted U function and its attentional modulation. J Cogn Neurosci. 2010. [DOI] [PubMed]
- Ray WJ, Cole HW. EEG alpha-activity reflects attentional demands, and beta-activity reflects emotional and cognitive-processes. Science. 1985;228:750–752. doi: 10.1126/science.3992243. [DOI] [PubMed] [Google Scholar]
- Rempel-Clower NL, Barbas H. The laminar pattern of connections between prefrontal and anterior temporal cortices in the rhesus monkey is related to cortical structure and function. Cereb Cortex. 2000;10:851–865. doi: 10.1093/cercor/10.9.851. [DOI] [PubMed] [Google Scholar]
- Romei V, Rihs T, Brodbeck V, Thut G. Resting electroencephalogram alpha-power over posterior sites indexes baseline visual cortex excitability. Neuroreport. 2008;19:203–208. doi: 10.1097/WNR.0b013e3282f454c4. [DOI] [PubMed] [Google Scholar]
- Rossi AF, Bichot NP, Desimone R, Ungerleider LG. Top-down attentional deficits in macaques with lesions of lateral prefrontal cortex. J Neurosci. 2007;27:11306–11314. doi: 10.1523/JNEUROSCI.2939-07.2007. [DOI] [PMC free article] [PubMed] [Google Scholar]
- Sauseng P, Klimesch W, Stadler W, Schabus M, Doppelmayr M, Hanslmayr S, Gruber WR, Birbaumer N. A shift of visual spatial attention is selectively associated with human EEG alpha activity. Eur J Neurosci. 2005;22:2917–2926. doi: 10.1111/j.1460-9568.2005.04482.x. [DOI] [PubMed] [Google Scholar]
- Shaw JC. Brain's alpha rhythm and the mind. Amsterdam: Elsevier; 2003. [Google Scholar]
- Steriade M, Gloor P, Llinás RR, Lopes da Silva FH, Mesulam MM. Basic mechanisms of cerebral rhythmic activities. Electroencephalogr Clin Neurophysiol. 1990;76:481–508. doi: 10.1016/0013-4694(90)90001-z. [DOI] [PubMed] [Google Scholar]
- Thut G, Nietzel A, Brandt SA, Pascual-Leone A. Alpha-band electroencephalographic activity over occipital cortex indexes visuospatial attention bias and predicts visual target detection. J Neurosci. 2006;26:9494–9502. doi: 10.1523/JNEUROSCI.0875-06.2006. [DOI] [PMC free article] [PubMed] [Google Scholar]
- van Dijk H, Nieuwenhuis IL, Jensen O. Left temporal alpha band activity increases during working memory retention of pitches. Eur J Neurosci. 2010;31:1701–1707. doi: 10.1111/j.1460-9568.2010.07227.x. [DOI] [PubMed] [Google Scholar]
- Worden MS, Foxe JJ, Wang N, Simpson GV. Anticipatory biasing of visuospatial attention indexed by retinotopically specific alpha-band electroencephalography increases over occipital cortex. J Neurosci. 2000;20:RC63. doi: 10.1523/JNEUROSCI.20-06-j0002.2000. [DOI] [PMC free article] [PubMed] [Google Scholar]
- Zhang Y, Ding M. Detection of a weak somatosensory stimulus: role of the prestimulus mu rhythm and its top–down modulation. J Cogn Neurosci. 2010;22:307–322. doi: 10.1162/jocn.2009.21247. [DOI] [PubMed] [Google Scholar]