

Abstract
We apply functional magnetic resonance imaging and multivariate analysis methods to study the coordinate frame in which saccades are represented in the human cortex. Subjects performed a memory-guided saccade task in which equal-amplitude eye movements were executed from several starting points to various directions. Response patterns during the memory period for same-vector saccades were correlated in the frontal eye fields and the intraparietal sulcus (IPS), indicating a retinotopic representation. Interestingly, response patterns in the middle aspect of the IPS were also correlated for saccades made to the same destination point, even when their movement vector was different. Thus, this region also contains information about saccade destination in (at least) a head-centered coordinate frame. This finding may explain behavioral and neuropsychological studies demonstrating that eye movements are also anchored to an egocentric or an allocentric representation of space rather than strictly to the retinal visual input and that parietal cortex is involved in maintaining these representations of space.
Introduction
Understanding the intricacies of a complex visual scene often requires scanning it with multiple eye movements, called saccades, that direct the high-resolution fovea to behaviorally relevant targets. A central question pertinent to understanding natural vision is what are the reference frames in which saccades are encoded?
Generally, a visual target casts an image on the retina in a location that is directly related to the saccade required to fixate it. Thus, a retina-centered representation (i.e., mapping according to the location of the image of the target on the retina; see Fig. 1A, left) seems to be all that is needed to direct the eyes. Consistent with this account, it has been shown, in the monkey, that the superior colliculus as well as the frontal eye field (FEF) and lateral intraparietal sulcus (LIP) predominately use a retinotopic representation (Colby et al., 1995; Tehovnik et al., 2000; Sparks, 2002). However, ample evidence supports the view that multiple spatial representations take part in saccadic targeting. For example, electrical stimulation of neuronal populations in the dorsomedial frontal cortex (Tehovnik et al., 1998) and specific regions within the intraparietal sulcus (IPS) (Thier and Andersen, 1996) reported that the elicited saccades were directed to a particular location in head-centered space, independent of the starting position of the eyes. Behavioral studies also support this claim (Dassonville et al., 1995; Karn et al., 1997; Hayhoe et al., 2003; Scherberger et al., 2003; Tatler and Land, 2011). For example, during tea making, major gaze changes (up to 180°) were often made toward objects outside of the visual field, indicating that gaze direction is anchored not only to the instantaneous visual scene but is also likely to be encoded in head-centered, body-centered, and possibly even world-centered coordinates (for review, see Tatler and Land, 2011). However, the issue has not been adequately addressed in human imaging studies. Previous studies used phase encoding techniques, in which the polar angle of a peripheral target for a delayed saccade was gradually changed over time. These studies indicated that regions in the parietal (Sereno et al., 2001; Schluppeck et al., 2005) and prefrontal (Kastner et al., 2007) cortex display a consistent topographic mapping of the remembered target position. However, because these imaging studies used a single fixation origin point and a “center-out” saccade paradigm, they could not differentiate between pure retinotopic versus spatiotopic representations.
Figure 1.

Experimental design of the memory saccade task, aimed at studying the coordinate frame of saccadic encoding. A, Two possible models of saccadic encoding. Retinotopic, Coding the distance and direction from the current eye position. Spatiotopic, Coding target position in a head-based (or possibly even body/world) reference frame, regardless of the current eye position. B, Schematic depiction of the memory saccade task. Each trial began with fixation in one of four possible locations. Then, the fixation point turned red to signal an upcoming cue. Next, the future target point was flashed, together with an orienting central cue (oriented ellipse), indicating the location of the future saccade target. This was followed by variable delay period in which the subjects had to maintain fixation and remember where to move their eyes. The disappearance of the fixation point served as a go signal, indicating the subjects to move their eyes to the remembered target position. Next, the fixation point reappeared in its new position and then the subjects were requested to maintain fixation until the next trial began with another cue presentation. On each trial, there was an equal chance of performing a saccade to each of the two neighboring points. C, during the experiment, equal-amplitude memory-guided saccades occurred in the eight possible configurations depicted by the arrows. This design generated pairs of saccades with the same vector (but different starting points), pairs with the same end point, etc., allowing assessment of the relevant coding scheme of saccades in the cortical eye fields.
We therefore use here a delayed saccade task that involves eye movements in various directions from multiple distinct origin points. This allowed us to estimate the relative contribution of saccade direction (retinotopic vector) and endpoint (spatiotopic position) in each of the studied areas. To evaluate the strength of the retinotopic and spatiotopic representations, we assess the degree of similarity between spatial patterns of functional magnetic resonance imaging (fMRI) response, elicited by delayed saccades with various spatial properties. We first find that the response patterns in the FEF and IPS are correlated when saccades with the same vector are made, even when their origin and destination point are different. This fits well with a retinotopic mode of representation. Interestingly, the response patterns in the middle IPS are more similar when saccades are made to the same destination point, even when the vector is different. This suggests that this region contains also a spatiotopic representation of saccadic targets, multiplexed with the retinal representation.
Materials and Methods
Behavioral task.
Twelve right-handed healthy subjects (four female; ages of 29 ± 3 years) with normal vision gave informed consent to participate in the fMRI study. The experiments were approved by the Helsinki committee of the Sourasky Medical Center (Tel-Aviv, Israel). We used a slow event-related design, with 15.15 s between consecutive trials, to allow full recovery of the blood oxygenation level-dependent (BOLD) signal. The scan was divided to four separate runs, each beginning with 21 s of fixation that appeared in one of the four possible starting positions and composed of 24 trials in which the saccade (length of 8.7°) direction was changed in pseudorandom order with equal probability for clockwise or counterclockwise movement (Fig. 1C). Each run was comprised of a different sequence of trials, but all runs contained an equal number of trials from each of the eight eye-movement conditions (three per run).
MRI parameters.
Experiments were performed on a 3 T GE Healthcare scanner located in the Sourasky Medical Center. During each fMRI scan, a time series of volumes was acquired using a T2*-weighted echo planar imaging pulse. The functional data were obtained with the following parameters: field of view, 192 × 192 mm; matrix, 64 × 64; 29 3 mm axial slices with 0.5 mm gap; repetition time, 1.5 s; echo time, 30 ms; flip angle, 75°. The functional voxels were 3 × 3 × 3 mm. High-resolution anatomical volumes were acquired with a T1-weighted three-dimensional (3D) pulse sequence (1 × 1 × 1 mm) to enable coregistration of functional data.
Stimuli.
Visual stimuli were white (luminance contrast 0.68; calculated as max − min/max + min) round (0.15° diameter) fixation or elongated (cue) dots on a black background (contrast between the black screen to the scanner bore was 0.05). The stimuli were rear-projected to a screen (24.8 × 16.7° of visual angle) located at the back of the scanner. The subjects viewed the stimuli through a tilted mirror that was placed on the upper part of the head coil in front of the subjects' eyes (total distance from eyes to center of screen was 66 cm).
Eye tracking.
All subjects were trained on the task before the scanning session and reported that they had no trouble performing the task during the scan. To verify that our results did not stem from atypical eye movements inside the scanner, the eye position of eight subjects (of 12) was monitored during the fMRI scan using an infrared video camera equipped with a telephoto lens. The eye-tracking data of two of the eight participants was discarded from analysis as a result of technical difficulties. The eye-tracking device (iView X MRI-LR; Senso Motoric Instruments) was located at the bottom of the subject's bed and sampled the eye position at 50 Hz with gaze position accuracy of 0.5–1° (according to the specifications of the manufacturer). A built-in calibration routine of nine points covering the screen was used in the beginning of each scan. The data were analyzed using in-house software developed in Matlab (MathWorks). One subject (beyond the 12 that participated in the study) was discarded from the study as a result of problematic eye tracking during the scan that clearly indicated that she did not follow the behavioral task requirements. Trial-by-trial inspection of the eye-position plots verified that all the saccades (other than several temporary signal losses) were executed before the end of the 1.35 s period (after the go signal) and to the correct target point (for an example of the eye position signals in one run, see supplemental Fig. S4, available at www.jneurosci.org as supplemental material).
Data analysis.
Data analysis was conducted using the Brain Voyager QX 1.10 software package (Brain Innovation) and in-house analysis tools developed in Matlab (MathWorks). The first four images of each functional scan were discarded. Preprocessing of functional scans included 3D motion correction, slice scan time correction, and removal of low frequencies up to three cycles per scan (linear trend removal and high-pass filtering). The anatomical and functional images were transformed to the Talairach coordinate system using trilinear interpolation. The cortical surface was reconstructed from the high-resolution anatomical images using standard procedures implemented by the BrainVoyager software.
To select task-relevant voxels, defining our individual based regions of interest (ROIs), we used the conventional general linear model (GLM) implemented in the BrainVoyager software. This model estimates the neural response as a boxcar function for each phase of the task (cue, delay, and move), convolved with a standard hemodynamic response function (sum of two gamma functions). A t test conducted independently on each voxel revealed voxels exhibiting significantly enhanced responses in any of the task phases compared with the rest period. Note that, in this stage, all eight saccade conditions were treated as one, to avoid any bias in voxel selection for specific saccade properties. To avoid biasing our results by selecting voxels that by mere chance show the same tendencies across both halves of the data (Kriegeskorte et al., 2009), the ROIs were defined using only one-half of the datasets (first and third runs; see below, Analysis of the spatial patterns of fMRI response). Using a conventional GLM analysis described above, we identified voxel clusters that exhibited significant enhanced activity during the task period. We chose discrete voxel clusters (∼1000 mm3) within clear anatomical landmarks, identifying the ROIs separately for each subject and each hemisphere. Voxels in the FEF were defined as those located around the junction of the precentral and superior frontal sulci (Luna et al., 1998).Voxels of the dorsomedial frontal cortex (DMFC), which is often referred to as the human supplementary eye field, were localized as residing within part of the interhemispheric fissure adjacent to the paracentral sulcal branch of the cingulate sulcus (Luna et al., 1998; Pierrot-Deseilligny et al., 2004). The IPS was divided to anterior (aIPS), middle (mIPS), and posterior (pIPS) parts, because in most participants, these were clearly distinguishable clusters. We also found consistent activation in the dorsolateral prefrontal cortex (DLPFC), which is implicated in working memory tasks. In addition, we selected the anterior insula, which was bilaterally active during the present task (compared with rest), as a control region. Importantly, such activation in the insula has also been reported in other working memory experiments (Hagler and Sereno, 2006) and studies involving orienting of spatial attention (Corbetta and Shulman, 2002), but critically, this area was never reported to represent the spatial properties of attention or saccades. Another control region was within low-level visual areas, defined as most significant voxel clusters adjacent to the calcarine sulcus. ROIs were isolated clusters of voxels in known anatomical locations and are specified in Table 1.
Table 1.
Talairach coordinates (mean and SD across subjects) of the center of mass of each selected ROIs
| ROI | Hemisphere | X (mm) | Y (mm) | Z (mm) | Volume (mm3) |
|---|---|---|---|---|---|
| pIPS | L | −26 ± 6 | −76 ± 5 | 23 ± 6 | 1070 ± 52 |
| R | 28 ± 4 | −74 ± 6 | 25 ± 4 | 1048 ± 36 | |
| mIPS | L | −23 ± 6 | −67 ± 6 | 44 ± 6 | 1073 ± 59 |
| R | 24 ± 5 | −66 ± 6 | 45 ± 5 | 1067 ± 43 | |
| aIPS | L | −34 ± 5 | −50 ± 5 | 42 ± 5 | 1053 ± 48 |
| R | 31 ± 4 | −49 ± 5 | 41 ± 3 | 1051 ± 30 | |
| FEF | L | −26 ± 4 | −12 ± 5 | 53 ± 4 | 1088 ± 47 |
| R | 30 ± 6 | −10 ± 4 | 52 ± 5 | 1146 ± 113 | |
| DMFC | 0 ± 2 | −3 ± 7 | 54 ± 4 | 1120 ± 72 | |
| anterior | L | −33 ± 3 | 16 ± 5 | 12 ± 3 | 1127 ± 182 |
| Insula | R | 35 ± 4 | 18 ± 6 | 12 ± 3 | 1075 ± 59 |
| DLPFC | L | −32 ± 5 | 33 ± 7 | 37 ± 5 | 1074 ± 62 |
| R | 35 ± 5 | 32 ± 4 | 36 ± 8 | 1082 ± 69 | |
| anterior | L | −9 ± 3 | −74 ± 5 | 2 ± 7 | 1145 ± 103 |
| Calcarine | R | 9 ± 3 | −74 ± 5 | 5 ± 7 | 1099 ± 94 |
L, Left; R, right.
The Talairach coordinates of the pIPS and mIPS as defined in the present study are in the vicinity (within 1 SD) of visual cortical area V7 and IPS2, respectively, as reported by previous studies of memory-guided saccades (Schluppeck et al., 2006; Levy et al., 2007). The Talairach coordinates of the FEF fits well the previously reported coordinates of the FEF located on the junction of the precentral sulcus and superior frontal sulcus (Luna et al., 1998; Kastner et al., 2007).
To validate that our results are not affected by the different number of voxels in each ROI, we adjusted the statistical threshold on a region-by-region basis, to ensure that the overall size of each ROI (for each subject) was as close as possible to 1000 mm3 (but not smaller than that). Note, however, that the thresholds were always corrected using a false discovery rate (FDR) that was not greater than q (FDR) <0.05. This selection criteria (choosing predefined and equal size of regions) seems appropriate for inter-regional comparisons using the analysis of spatial patterns of the fMRI response, because the correlation values are likely to be affected by the number of underlying voxels (for example, correlations become noisier when the ROIs are smaller). Note that, although the ROI voxel inclusion selection was conducted at the anatomical spatial scale (1 mm), all additional analysis was conducted on the corresponding 3 mm functional voxels.
The averaged activity of the ROI (across all voxels) was used to define the best-fitting hemodynamic response function (HRF) separately for each region and subject. We first applied a deconvolution method to the averaged signal time course of the ROI (across the whole experiment) to generate the time course kernels for the three different delay durations. Then, we used a standard GLM approach with a set of only three predictors for the cue, delay, and movement periods to best estimate those three kernels (for the three different delay durations). This was done separately using three different possible standard HRFs (differing in their time constants to response peak and undershoot peak), each with three different onset times (immediate onset, 1.5 and 3 s onset delay). The HRF that produced the best estimation (minimal root mean square error, averaged across the three time courses) was selected as the HRF of the region. Note that using a single HRF (for all regions of interest) does not lead to qualitative changes in the results (supplemental Fig. S6, available at www.jneurosci.org as supplemental material).
Analysis of the spatial patterns of fMRI response.
To study the spatial patterns of fMRI response, we used the split-halves correlation analysis (Haxby et al., 2001). Another approach often used in studies examining spatial patterns of fMRI response is the use of classifiers to predict the saccade direction or destination from the population response of voxels. However, our unique experimental design required a slow event-related paradigm because the different conditions could not be counterbalanced (this is an essential feature in rapid event-related designs). Moreover, to best estimate the hemodynamic response function during the various time intervals (cue, delay, movement), trials with different delays were combined. These two reasons lead to an exceedingly low number of samples that could be used to train the classifier (one sample for each run and condition). Thus, a classifier approach could not be implemented here. We therefore use the classic, split-halves correlation analysis. The data of each subject were split into two separate sets, taken from even and odd runs. All additional analysis was done separately for each of the two datasets. Note that the ROIs were defined only according to the first dataset, avoiding the selection of voxels with consistent noise (across datasets). This selection process is in accordance with the guidelines previously suggested that “ensures correct inference and undistorted descriptive statistics” (Kriegeskorte et al., 2009).
The activation profile from each run in each voxel was modeled with 24 parameters: three predictors (cue, delay, and movement) for each of the eight eye-movement conditions. Each predictor was created by convolving the best-fitting hemodynamic response function of the region with an impulse function at the time of the cue or movement and a sustained response during the delay period, resulting in three different predictors, one for each phase of the task. This best-fitting model of the activity time course of each voxel yielded an estimate response value (β) for each phase and every condition.
Next, we normalized the response amplitude (β) of a given voxel, by subtracting its mean response across all eight conditions:
 |
 |
This normalization was conducted, as in similar studies (Haxby et al., 2001; Kriegeskorte et al., 2008), to eliminate correlations attributable to mere differences in the mean response level between voxels (within each dataset). The response pattern of each ROI is therefore represented as a one-dimensional vector of size N, where N is the number of active voxels in that ROI. The similarity between different patterns of response (obtained for the different experimental conditions) is then assessed by a simple voxelwise correlation between the two vectors. To assess the statistical significance of the correlation results, we first applied the Fisher's z′ transformation to the correlation coefficients (thereby converting the correlation coefficient values into a normally distributed variable, amenable for parametric statistical testing) and then performed t tests and ANOVAs on the subjects' mean correlation values (per comparison). We used the STATISTICA data analysis software (StatSoft). The effect size was quantified by the “partial η2,” defined as the proportion of total variation attributable to the effect, divided by the remaining unexplained variance (after discarding the other factors contributing to the total variation).
Results
Subjects made a series of memory-guided saccades in different directions with a variable delay period between the cue and go signal (Fig. 1B), while being scanned. There were eight possible saccades with distinct spatial properties (Fig. 1C). Each saccade was performed 12 times during the course of a 52 min fMRI scan divided into four slow event-related runs.
To characterize the nature of mapping of eye movements in various human cortical areas, we first defined the major cortical regions involved in saccade planning and execution (Luna et al., 1998), by a combination of anatomical and functional criteria separately for each subject and each hemisphere (see Materials and Methods). All subjects exhibited significant bilateral activation in the FEFs, anterior, middle, and posterior sections of the IPS, DMFC, DLPFC, anterior insula, and along the calcarine sulcus. The Talairach coordinates of these different ROIs and their relation to previous studies are described in Materials and Methods and Table 1.
To unambiguously separate sensory, motor, and delay period activity, we used a jittered delay period between cue and movement. We calculated the amplitude of the fMRI response during the three phases of the behavioral task by adopting a model (Curtis and D'Esposito, 2003) of the underlying neural activity and of the HRF (Fig. 2) (see Materials and Methods).
Figure 2.

Modeling the activation pattern of single voxels in saccade-related regions of interest. A, Saccade-related activation patterns (vs rest) overlaid on a partially inflated brain of one representative subject. Robust activation can be seen in the FEFs, aIPS, mIPS, and pIPS. B, Activation profiles (averaged across directions) of one specific voxel in the right mIPS during three types of trials that differ in the duration of the delay (short, medium, long). Note the significant activity obtained during the delay period. C, The model used to dissociate the three different phases of the task. Three response amplitudes (Cue, Delay and Move, indicated by the height of the orange, green, and purple bars, respectively) are used to estimate the response profile of all three trials after convolution with the best-fitting hemodynamic response function (see Materials and Methods). The resulting model estimation is the superposition of the activation contributed by the different predictors (orange, green, and purple curves), resulting in the cyan, blue, and red curves, for the short, medium, and long delay trials, respectively. The results of the model (example shown in D) closely resemble the actual activation pattern in the different delay periods, explaining on average (across ROIs and subjects) 87% of the temporal variation in the averaged BOLD signal.
Contralateral bias
In monkeys, neurons in FEF and LIP in each hemisphere are typically more active when saccades are made to the contralateral direction (compared with the ipsilateral) (Barash et al., 1991; Schall, 1991). Previous neuroimaging studies of the putative human homologs of these regions showed a similar contralateral bias (Sereno et al., 2001; Schluppeck et al., 2005, 2006; Curtis and D'Esposito, 2006; Medendorp et al., 2006; Kastner et al., 2007). To verify that the acquired data of the present study are reliable enough, we first replicated this known contralateral preference typical of the cortical eye fields. Importantly, exactly the same dataset was used in the analysis of spatial patterns of the fMRI response we further used below.
We calculated the response amplitude of each voxel for the different conditions and phases of the task, resulting in 24 (8 conditions × 3 phases) values per voxel. Then, we compared the response amplitude (average β weights across voxels) evoked by contralateral saccades with those evoked by ipsilateral ones, by computing a contralateral bias index for each ROI and subject. This analysis revealed significant contralateral bias in the FEF and IPS regions (Fig. 3). Importantly, this was true only for the activation during the cue and delay periods but not in the movement period. These results replicate the findings by Schluppeck et al. (2006) and extend them also to the FEF. The lack of contralateral bias in the movement period (reported also in the previous study) could be a result of other processes taking place during this stage (such as the onset of the new fixation and the subsequent corrective saccade).
Figure 3.

Hemispheric bias to contralateral saccades is evident only in the cue and delay phases of the task. A, Contralateral bias index: the difference between the response amplitude (β weight) for contralateral saccades and ipsilateral saccades, averaged across the voxels of both hemispheres, is shown for the three separate phases of the task in various cortical regions. The FEF and IPS reveal a significant positive contralateral bias during the cue and delay, but this bias disappears at the last phase of the trial (movement). No significant bias was found in a control region (anterior insula). B, The average response profile in mIPS (n = 12) for ipsilateral (red) and contralateral (blue) saccades. On the left, the response is aligned to the cue presentation, whereas on the right, it is aligned to the go signal. Error bars represent SEM across subjects. *p < 0.05 and **p < 0.005, respectively, for paired two-tailed t tests between the contralateral and ipsilateral responses.
The above replication (and extension) of the hemispheric contralateral bias demonstrates that the acquired data are informative enough to reveal even subtle effects, and hence these responses are reliable and suitable for the spatial pattern analysis we describe below. Moreover, the clear differences in bias between contiguous phases (“delay” and “movement”) strongly indicate that we were able to achieve effective dissociation between the different temporal events (by introducing a jitter in the delay period that decorrelated the predictors of the three temporal phases).
We continue by assessing the spatial patterns of activity elicited during the delay period. We chose to focus the analysis on the delay period for several reasons: The cue period contains several elements, such as an attention elevation induced by the ready signal, a visual response to the cue appearance and its encoding into memory, etc. The movement period, as mentioned above, is also “contaminated”: besides the saccadic eye movement, it includes the appearance of the new fixation point and a later corrective saccade. In contrast, the delay period contains only a fixed visual stimulus (fixation point) that is common to all conditions. Therefore, activation in this period is presumably attributable mainly to sustained activity that is typically associated with either the planning of the prospective saccade (Gnadt and Andersen, 1988) and/or memory-guided attention toward the spatial location of the target (see further elaboration on this point in Discussion).
Analysis of spatial patterns of response within regions
To assess the information available in the patterns of voxel responses within a specific region, we split the data into two separate sets, containing either even or odd runs. For each subject and each ROI, we calculated the response map of the ROI (across the voxels of each ROI, resulting in a β map of the delay period response) for each of the eye movement conditions and datasets. This resulted in 16 response maps [8 conditions × 2 datasets (odd/even)].
We used a voxelwise correlation measure to obtain a similarity index between each pair of maps of the same ROI, in which one map is from the odd dataset and the other is from the even dataset (resulting in an 8 × 8 correlation matrix; see Materials and Methods). Our benchmark correlation value was that obtained when comparing the response profile during repetition of the same saccadic eye movement (same vector and destination), taken from the two separate (odd/even) datasets. To obtain this measure (per ROI, per subject), we averaged the eight correlation coefficients, computed for the eight saccade conditions. We then averaged the correlation coefficient values across subjects to obtain the mean correlation coefficient for repetitions of the identical condition in each ROI. Note that a Fisher's z′ transformation was applied to the correlation coefficients, thereby converting these values to normally distributed variables suitable for parametric statistical testing. The transformed values can be seen as a similarity indexes representing the amount of resemblance between the two patterns of responses. One should note, however, that, as in previous studies (Haxby et al., 2001), we normalized the response of each voxel (i.e., subtracting the mean response across all conditions; see Materials and Methods) before conducting the correlation analysis. Otherwise, the similarity index would have been inflated (above 0.8) as a result of mere differences in the mean response level between voxels. Our emphasis is therefore on the differences in the similarity index between various groups of comparisons rather than the absolute similarity index (or correlation coefficient values).
The similarity index in the identical condition comparisons (e.g., the pattern of responses to condition X on even and odd runs) was significantly greater than zero for the FEF (p = 0.0004, two-tailed t test, n = 12 subjects) and in the middle and posterior parts of the IPS (two-tailed t test, p = 0.001, p = 0.005, respectively) (Fig. 4, “Same vec, Same dest”), suggesting that specific saccades yield repeatable patterns of response within the FEF and middle and posterior IPS. The same comparison in the anterior IPS showed a similar trend (p = 0.065). Importantly, the similarity index in other control ROIs was not statistically different from zero [DMFC (p > 0.16); anterior insula (p > 0.13)], suggesting that these areas are less likely to contain information about the spatial properties of saccades. Therefore, these regions are not discussed further (for additional information, see supplemental Fig. S1, available at www.jneurosci.org as supplemental material). A representation based on a retinotopic reference frame predicts that saccades with the same vector (i.e., saccades with the same direction and amplitude, regardless of initial eye position) should elicit spatial patterns that are more similar than the ones elicited by saccades with different vector of movement. A spatiotopic representation predicts that saccades directed to the same destination with respect to the screen (or head) should elicit more comparable patterns than saccades to different destinations.
Figure 4.
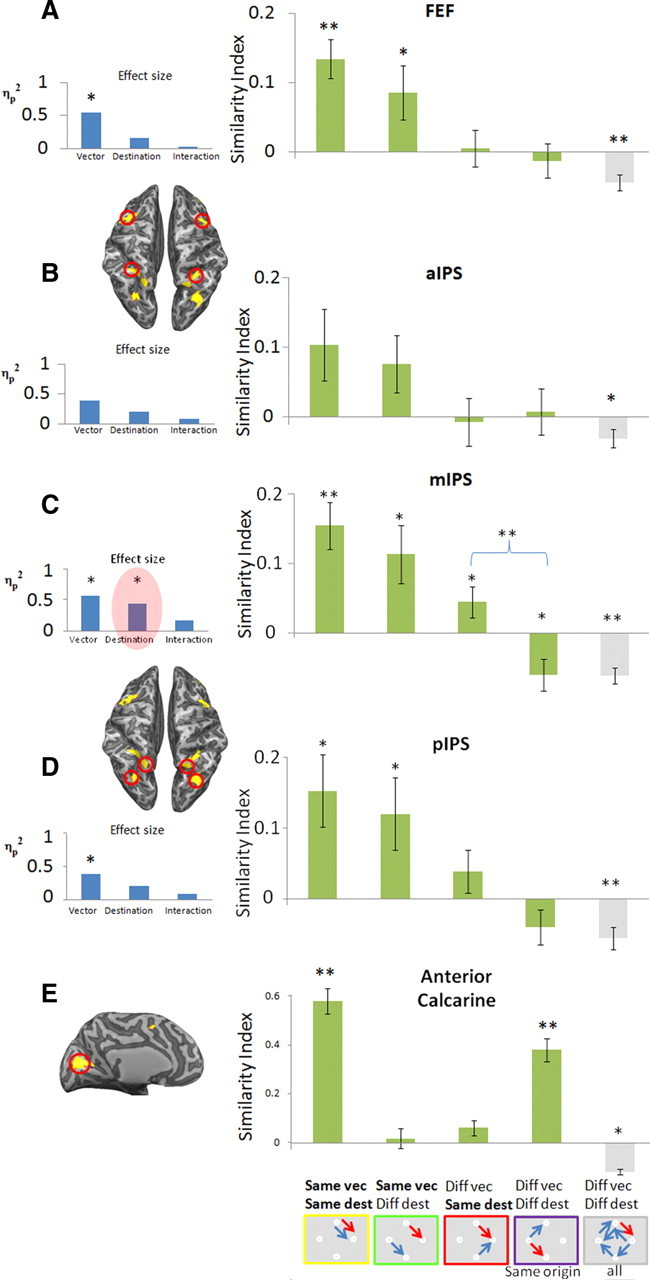
Similarities of spatial patterns of responses in FEF (A), three different subregions of the IPS (B–D), and the anterior calcarine (E). The figure shows mean similarity indexes for different comparisons of delay-period response patterns in the studied ROIs (depicted by the red circles in the partially inflated brain; dorsal view, A–D; medial view, E). The icons in the bottom, below each bar, represent the paired conditions whose average index is depicted above. These include the following (from left to right): identical conditions; same vector; same destination, same origin; and completely different conditions. Blue and red arrows are specific examples of such cases from the separate (odd and even) datasets. The graphs in the insets (light blue bars) show the magnitude of the specific effects (saccade vector, saccade destination, and interaction), assessed by ANOVA (partial η2) on the similarity indexes indicated by the green bars in each graph. Error bars denote SEM across subjects (n = 12). *p < 0.05; **p < 0.005. Note the significant effect of saccade destination in the middle IPS marked in red.
A 2 × 2 × 2 repeated-measures ANOVA with hemisphere of ROI (left/right) × direction (same/different) × destination (same/different) was conducted on the subjects' average similarity indexes in each region. Additional analysis was pooled across hemispheres because there was no significant effect of hemisphere in all ROIs. ANOVA of the effect of vector and destination of movement allowed assessment of the parameters affecting the pattern similarity of responses in the different ROIs. As expected from the retinotopic coding scheme (Fig. 1A, left), a significant effect of saccade vector was found in the FEF (F(1,11) = 12.9, ηp2 = 0.54, p = 0.004), pIPS (F(1,11) = 6.8, ηp2 = 0.38, p = 0.025), and mIPS (F(1,11) = 14.4, ηp2 = 0.57, p = 0.003). The retinotopic coding hypothesis is strengthened by the fact that these regions elicit significantly positive similarity indexes for “same vector” saccades (p < 0.05, two-tailed paired t test) (Fig. 4, “Same vec, Diff dest”). Critically, the mIPS also showed a significant effect of saccade destination (F(1,11) = 8.4, ηp2 = 0.43, p = 0.014), as well as significantly positive similarity index for “different vector, same destination” comparisons (p = 0.032), suggesting that the spatiotopic position of the target was also encoded in this region (Fig. 1A, right).
We also studied the responses in low-level visual areas (e.g., anterior part of the calcarine sulcus) (Fig. 4E). This region exhibits highly positive similarity indexes in “identical” comparisons (p = 2 × 10⁻⁸). This is likely to be attributable to visual surround effects (outside the display area), because trials that shared the same origin point (and therefore had identical surrounds during the delay) also generated similar patterns of response (p < 5 × 10⁻⁶), although their saccade direction and destination differed (see more in supplemental Fig. S7, available at www.jneurosci.org as supplemental material). The fact that the calcarine sulcus does not exhibit any effect related to the saccade vector or destination (although other comparisons are highly comparable) demonstrates that these effects emerge in the frontoparietal regions and do not exist in purely visual areas.
We now focus on ruling out possible confounds that might have led to our results: same destination comparisons necessarily include saccades with different vectors, but in our case, they still shared either the same horizontal or vertical component of movement (Fig. 5A). For example, a saccade to the rightmost target could only be made from the uppermost or lowermost fixation so, although these two different saccades differed in their vertical component (downward or upward, respectively), they both had the same horizontal component (e.g., rightward). Thus, a brain area characterized by neurons having broad tuning for saccade direction may show similar patterns of activity for these two different directions (attributable to the shared rightward component), although its tuning is strictly in retinotopic coordinates. To refute this, one can focus on the “same origin” comparisons: these compared saccades necessarily involve exactly the same shared vector as above (either the horizontal or vertical component of movement) but obviously diverge in their endpoint. Importantly, in the mIPS, “same origin” comparisons generated significantly less similarity in the patterns of responses than “same destination” comparisons (p = 0.008, two-tailed paired t test) (Fig. 4C). Thus, a shared component of saccade movement does not explain the similarities of the patterns. We suggest therefore that the mIPS is indeed sensitive to the destination of saccade rather than merely having a broad selectivity for saccade direction.
Figure 5.

Ruling out possible confounding factors. A shows a sketch of “same destination” comparisons (red frames), demonstrating that such trials share the same component of movement (upward in the top panel and rightward in the bottom one). Higher similarity between such comparisons, as shown in the mIPS, may therefore be simply attributable to a broad tuning to the direction of movement rather that to the spatiotopic location of the target. Importantly, “same origin” comparisons (purple frames) also have the same components of movement. The fact that, in the mIPS, “same destination” comparisons yield significantly higher similarity values than “same origin” comparisons (see Fig. 4C) rules out this possible confound. B describes the matrix of all possible comparisons. Comparisons of saccades with opposite laterality (one to the left of fixation and the other to the right) are discarded (marked in X). C and D show the similarity indices in the FEF and mIPS using the new (stricter) inclusion criteria (conventions as in Fig. 4). The FEF shows a retinotopic coding pattern (i.e., vector encoding), whereas the mIPS shows sensitivity to both the vector of movement and its destination with respect to the head.
We further verified that our results were not merely attributable to a response magnitude difference between contralateral versus ipsilateral saccades. Note that the different groups differ in the number of comparisons between two contraversive saccades. In particular, the “same vector, same destination” as well as the “same vector, different destination” groups exclusively contain comparisons of saccades with the same laterality (both saccades are either to the left or right of fixation). In contrast, the “different vector, same destination” and “different vector, different destination” groups contain a mix of underlying comparisons with either the same or different saccade laterality. Importantly, even under a stricter analysis, in which laterality of saccade is controlled (e.g., when excluding from the analysis any comparisons between saccades with different laterality) (Fig. 5B), the obtained results remain the same. Hence, the ANOVA reveals a significant effect of vector and destination in the mIPS (F(1,11) = 11.0, ηp2 = 0.50, p = 0.007; F(1,11) = 5.8, ηp2 = 0.34, p = 0.035, respectively) (Fig. 5D) and significant effect of vector in the FEF (F(1,11) = 4.6, ηp2 = 0.30, p = 0.05) (Fig. 5C). Note that excluding comparisons between saccades with different laterality generally elevated the similarity indices, which in turn lead to the absence of negative similarities and strengthening the claim that negative patterns of response are elicited by saccades with opposite laterality.
Finally, a more in-depth study of the distribution of correlation values (rather than just the average value) showed that the correlation coefficients are approximately normally distributed across comparisons. Higher average values are therefore generated by a systematic shift of the distribution toward positive correlation values rather than by a few outliers (supplemental Fig. S3, available at www.jneurosci.org as supplemental material).
Discussion
We investigated the mapping rules governing the pattern of fMRI responses in the human cortical oculomotor network while subjects performed a memory-guided saccade task to four different directions from various starting positions. Our key finding was that the multi-voxel response patterns in the middle part of the IPS were more similar when saccades were directed to the same target position with respect to the head. Because the subjects' head was held fixed during the scan, it is impossible to discriminate between head-, body-, and world-centered reference frames. Another possibility is that saccade–target representation is in object-based coordinates (e.g., with respect to the screen). For simplicity, we refer to all these possibilities as “spatiotopic” to distinguish these conditions from a purely retinotopic mapping. Future work will need to differentiate between these various possibilities. Interestingly, a recent study using fMRI repetition suppression found similar evidence for a clear retinotopic representation in all studied regions, but on top of that, weaker evidence for nonretinal coding were also found in the IPS (Van Pelt et al. 2010).
We now elaborate on the possible role of spatiotopic representations in more natural conditions. Then, we briefly discuss how such mapping, seen at the macroscopic (voxel) level, may be implemented at a finer scale.
The putative role of spatiotopic representation of saccadic targets in natural vision
A number of observations support the suggestion that memory of the spatial position of potential saccadic targets is likely to be represented in spatiotopic coordinates. In everyday tasks, such as preparing a sandwich (Hayhoe et al., 2003) or tea (Land et al., 1999), subjects frequently make sequences of saccades separated by very brief fixations of 100 ms or less. Because the time to program a saccade is usually 200 ms or more, these brief fixations are probably part of a preprogrammed sequence of saccades (Becker and Jürgens, 1979). This planning is likely to be done in a spatiotopic rather than a retinal coordinate frame. Furthermore, during natural tasks, subjects often make very large and accurate gaze shifts to locations outside of the field of view (Land et al., 1999). Such movements could not be programmed using a retinotopic representation of the target because the target was not projected on the retina at the time of saccade. Hence, such movements are more likely to be programmed using a spatiotopic, memory-based representation of the target. Moreover, studies that measured the precision of eye movements to target locations held in memory found better performance when a visual landmark, which allowed for exocentric encoding of the memory target, was present (Gnadt et al., 1991; Dassonville et al., 1995; Karn et al., 1997). The accuracy of these memory saccades was also affected by the initial eye and head position, suggesting the involvement of nonretinotopic representations (Gnadt et al., 1991).
Spatiotopic representations may be more tightly linked to action than to pure perception
A spatiotopic representation of a future saccade target (as found here in the middle IPS) could be attributed to either retrospective memory of the previously seen target or preparatory activity with respect to prospective movements (although by no means these alternatives are necessarily mutually exclusive). There is some evidence supporting the second alternative, relating it to the preparation of motor action. Neurons with spatiotopic receptive fields were found in the parietal lobe (Galletti et al., 1995; Duhamel et al., 1997; Mullette-Gillman et al., 2005, 2009), which is part of the dorsal stream known to be involved in visuomotor processing. Enhanced spatiotopic representation for action rather than for pure visual perception can explain why our delayed saccade task showed spatiotopic effects, whereas other imaging studies using perceptual recognition tasks and strict control on spatial attention did not (Gardner et al., 2008). Concurrent with this notion, behavioral studies that used perceptual tasks, such as visual discrimination (Golomb et al., 2008) or visual matching (McKyton et al., 2009), report retinotopic effects. In contrast, similar experiments requiring spatially specific motor response (i.e., saccade), do exhibit spatiotopic effects (Pertzov et al., 2010). Nevertheless, some perceptual tasks (typically involving judgment of motion) that did not require explicit action do exhibit evidence for the existence of a spatiotopic frame of reference (Melcher and Morrone, 2003; Burr et al., 2007). Recent evidence indicates that motion processing areas within the dorsal stream (middle temporal area MT/medial superior temporal area MST) may encode motion in spatiotopic coordinates (Ilg et al., 2004; d'Avossa et al., 2007; Ong et al., 2009). One aspect that is common to all these perceptual tasks is that they involve the deployment of spatial attention to the moving stimulus. Thus, the deployment of spatial attention (which is tightly linked to planning of an eye movement) may be sufficient for the construction of spatiotopic representation of space (Cavanagh et al., 2010).
Neural correlates of spatiotopic coding
The transformation of visual information from a purely retinotopic representation to a more complex one is often attributed to two distinct neural phenomena, namely visual remapping and gain fields. When an eye movement is about to occur, neurons in the monkey's parietal cortex transiently shift the location of their receptive field. Such neurons sometimes begin to respond to a visual stimulus even before the saccade that will bring the stimulus to the receptive field of the neuron is initiated (Duhamel et al., 1992; Colby et al., 1995). Functional imaging studies in humans show related phenomena in the parietal (Merriam et al., 2003) and occipital (Merriam et al., 2007) cortices. Recent behavioral studies in humans also showed evidence for predictive remapping using psychophysical methods (Melcher, 2007; Melcher and Colby, 2008). Neurons with remapping properties could potentially account for some of the behavioral evidence we describe here in support of a spatiotopic representation. For example, recently seen objects could still be represented in a retinotopic coordinate frame, although they are already out of the visual field because of a recent saccade. This could be achieved using the remapping mechanism and explain how subjects direct their gaze to an object located out of sight. However, because remapping neurons only have a short transient period in which they map the future receptive field, their predominant activity therefore still represents space in a retinotopic coordinate frame. Thus, remapping activity is less likely to be related to our present findings in the mIPS.
A more plausible account for our results is that it is related to the prominence of gain field neurons. Neurons in the posterior parietal lobe are typically sensitive to both the position of the stimulus on the retina and the position of the eye in the orbit. The eye-position sensitivity of visual- and memory-responsive neurons is often termed “gain field” to indicate that the neurons typically have a receptive field in retinotopic coordinates that is modulated by the position of the eye in the orbit (Andersen et al., 1985, 1990) [related effects were found in the human intraparietal sulcus (DeSouza et al., 2000; Brotchie et al., 2003)]. Andersen and colleagues (Andersen et al., 1985; Zipser and Andersen, 1988) showed that neurons with gain-field properties could be used as an intermediate stage in computing head-centered location of visual targets. Typically, eye movements are often accompanied by corresponding head movements. Animal studies that allow unrestricted head movements indicate that the superior colliculus is involved in the control of both head and eye movements (Snyder, 2000). Head-centered target location is therefore highly relevant in upstream cortical regions.
Several studies found neurons with explicit spatiotopic receptive fields [e.g., “real-position” neurons (Galletti et al., 1993; Duhamel et al., 1997)] or receptive fields with hybrid (head- and eye-centered) properties (Mullette-Gillman et al., 2005, 2009). The scarcity of real-position neurons (∼5% of the studied neurons) suggests that spatiotopic information is more likely to be maintained in the pattern of activity of population of the gain-field neurons that are more commonly found (>50% of the studied neurons) (Andersen et al., 1990).
An important point is that the spatiotopic response of a voxel does not necessarily imply that it consists of real-position neurons. A voxel may show spatiotopic selectivity even if it only contains a large population of gain-field neurons with specific properties. Consider the case that, within a voxel, there are gain-field neuronal populations with different optimal-gaze position (Fig. 6C, Neurons I–IV). These are organized such that they would be most responsive to a stimulus at the same location on the screen. If such neuronal populations are clustered within a voxel, this voxel would be activated by the stimulus, regardless of the initial eye position (exhibiting real-position sensitivity) because each eye position is the preferred gaze position of some clusters within the voxel. The voxels may differ in their preferred spatiotopic position. Such an organization can lead to a representation of spatiotopic location at the macroscopic map level that could be captured in the multivoxel pattern analysis. This may explain the spatiotopic effects seen in the mIPS despite the scarcity of real-position neurons in parietal cortex.
Figure 6.

Saccade coding schemes in the cortical eye fields (A), model of gain-field neuron (B), and suggested organization of gain-field neurons in the parietal cortex (C). A, Dorsal view of a partially inflated brain. Insets represent the coding patterns suggested by our fMRI correlation analysis. All cortical eye fields have information about the saccade vector in their spatial patterns of activation (retinotopic scheme). Area mIPS also has multiplexed information about the saccadic target destination, regardless of the initial position (spatiotopic representation). B, A typical behavior of a gain-field neuron. The receptive field (colored circle) moves with the fixation point (white cross), and the level of response is modulated by gaze position (most responsive receptive field represented in red circle). The inset on the right captures the receptive field properties in a single icon: it shows the neural response for the most responsive gaze location (colored in an orange fixation cross) and its matching receptive field, colored in red. C, Example of a voxel, consisting of gain-field neurons (I–IV) that share the same head-centered location of their most responsive receptive field (red circle) but differ in their optimal angle of gaze (orange cross). Such an organization may underlie the spatiotopic sensitivity found in the mIPS.
Note that similar ideas regarding the organization principles of gain-field neurons were raised in the past. Andersen et al. (1985) suggested that “eye position-independent response can be achieved by combining the activity of several neurons that have the same maximum head-centered location responses, but for different optimum angles of gaze … one attractive possibility is that the space-tuned peaks of activity are ordered to form a systematic map of head centered coordinate space across the tangential dimension of cortex.”
To summarize, we studied the patterns of fMRI responses for memory saccades from several starting points to various directions. Using a novel approach, our results replicated the finding that the FEF and IPS have a retinotopic representation of saccade direction. Interestingly, the response patterns in middle IPS exhibited an additional sensitivity to the saccadic destination point, regardless of its origin. This indicates that this region may also encode the spatial position of the saccade target in (at least) head-based coordinates. We suggest that the mIPS contains a nonretinal memory trace for behaviorally relevant locations, which is of particular relevance for planning eye movements.
Footnotes
This study was funded by Israel Science Foundation Grant 39/09 (E.Z.) and by National Institute for Psychobiology in Israel Grant 2-2008-09 (G.A.).
References
- Andersen RA, Essick GK, Siegel RM. Encoding of spatial location by posterior parietal neurons. Science. 1985;230:456–458. doi: 10.1126/science.4048942. [DOI] [PubMed] [Google Scholar]
- Andersen RA, Bracewell RM, Barash S, Gnadt JW, Fogassi L. Eye position effects on visual, memory, and saccade-related activity in areas LIP and 7a of macaque. J Neurosci. 1990;10:1176–1196. doi: 10.1523/JNEUROSCI.10-04-01176.1990. [DOI] [PMC free article] [PubMed] [Google Scholar]
- Barash S, Bracewell RM, Fogassi L, Gnadt JW, Andersen RA. Saccade-related activity in the lateral intraparietal area. II. Spatial properties. J Neurophysiol. 1991;66:1109–1124. doi: 10.1152/jn.1991.66.3.1109. [DOI] [PubMed] [Google Scholar]
- Becker W, Jürgens R. An analysis of the saccadic system by means of double step stimuli. Vision Res. 1979;19:967–983. doi: 10.1016/0042-6989(79)90222-0. [DOI] [PubMed] [Google Scholar]
- Brotchie PR, Lee MB, Chen DY, Lourensz M, Jackson G, Bradley WG., Jr Head position modulates activity in the human parietal eye fields. Neuroimage. 2003;18:178–184. doi: 10.1006/nimg.2002.1294. [DOI] [PubMed] [Google Scholar]
- Burr D, Tozzi A, Morrone MC. Neural mechanisms for timing visual events are spatially selective in real-world coordinates. Nat Neurosci. 2007;10:423–425. doi: 10.1038/nn1874. [DOI] [PubMed] [Google Scholar]
- Cavanagh P, Hunt AR, Afraz A, Rolfs M. Visual stability based on remapping of attention pointers. Trends Cogn Sci. 2010;14:147–153. doi: 10.1016/j.tics.2010.01.007. [DOI] [PMC free article] [PubMed] [Google Scholar]
- Colby CL, Duhamel JR, Goldberg ME. Oculocentric spatial representation in parietal cortex. Cereb Cortex. 1995;5:470–481. doi: 10.1093/cercor/5.5.470. [DOI] [PubMed] [Google Scholar]
- Corbetta M, Shulman GL. Control of goal-directed and stimulus-driven attention in the brain. Nat Rev Neurosci. 2002;3:201–215. doi: 10.1038/nrn755. [DOI] [PubMed] [Google Scholar]
- Curtis CE, D'Esposito M. Persistent activity in the prefrontal cortex during working memory. Trends Cogn Sci. 2003;7:415–423. doi: 10.1016/s1364-6613(03)00197-9. [DOI] [PubMed] [Google Scholar]
- Curtis CE, D'Esposito M. Selection and maintenance of saccade goals in the human frontal eye fields. J Neurophysiol. 2006;95:3923–3927. doi: 10.1152/jn.01120.2005. [DOI] [PubMed] [Google Scholar]
- Dassonville P, Schlag J, Schlag-Rey M. The use of egocentric and exocentric location cues in saccadic programming. Vision Res. 1995;35:2191–2199. doi: 10.1016/0042-6989(94)00317-3. [DOI] [PubMed] [Google Scholar]
- d'Avossa G, Tosetti M, Crespi S, Biagi L, Burr DC, Morrone MC. Spatiotopic selectivity of BOLD responses to visual motion in human area MT. Nat Neurosci. 2007;10:249–255. doi: 10.1038/nn1824. [DOI] [PubMed] [Google Scholar]
- DeSouza JF, Dukelow SP, Gati JS, Menon RS, Andersen RA, Vilis T. Eye position signal modulates a human parietal pointing region during memory-guided movements. J Neurosci. 2000;20:5835–5840. doi: 10.1523/JNEUROSCI.20-15-05835.2000. [DOI] [PMC free article] [PubMed] [Google Scholar]
- Duhamel JR, Colby CL, Goldberg ME. The updating of the representation of visual space in parietal cortex by intended eye movements. Science. 1992;255:90–92. doi: 10.1126/science.1553535. [DOI] [PubMed] [Google Scholar]
- Duhamel JR, Bremmer F, BenHamed S, Graf W. Spatial invariance of visual receptive fields in parietal cortex neurons. Nature. 1997;389:845–848. doi: 10.1038/39865. [DOI] [PubMed] [Google Scholar]
- Galletti C, Battaglini PP, Fattori P. Parietal neurons encoding spatial locations in craniotopic coordinates. Exp Brain Res. 1993;96:221–229. doi: 10.1007/BF00227102. [DOI] [PubMed] [Google Scholar]
- Galletti C, Battaglini PP, Fattori P. Eye position influence on the parieto-occipital area PO (V6) of the macaque monkey. Eur J Neurosci. 1995;7:2486–2501. doi: 10.1111/j.1460-9568.1995.tb01047.x. [DOI] [PubMed] [Google Scholar]
- Gardner JL, Merriam EP, Movshon JA, Heeger DJ. Maps of visual space in human occipital cortex are retinotopic, not spatiotopic. J Neurosci. 2008;28:3988–3999. doi: 10.1523/JNEUROSCI.5476-07.2008. [DOI] [PMC free article] [PubMed] [Google Scholar]
- Gnadt JW, Andersen RA. Memory related motor planning activity in posterior parietal cortex of macaque. Exp Brain Res. 1988;70:216–220. doi: 10.1007/BF00271862. [DOI] [PubMed] [Google Scholar]
- Gnadt JW, Bracewell RM, Andersen RA. Sensorimotor transformation during eye movements to remembered visual targets. Vision Res. 1991;31:693–715. doi: 10.1016/0042-6989(91)90010-3. [DOI] [PubMed] [Google Scholar]
- Golomb JD, Chun MM, Mazer JA. The native coordinate system of spatial attention is retinotopic. J Neurosci. 2008;28:10654–10662. doi: 10.1523/JNEUROSCI.2525-08.2008. [DOI] [PMC free article] [PubMed] [Google Scholar]
- Hagler DJ, Jr, Sereno MI. Spatial maps in frontal and prefrontal cortex. Neuroimage. 2006;29:567–577. doi: 10.1016/j.neuroimage.2005.08.058. [DOI] [PubMed] [Google Scholar]
- Haxby JV, Gobbini MI, Furey ML, Ishai A, Schouten JL, Pietrini P. Distributed and overlapping representations of faces and objects in ventral temporal cortex. Science. 2001;293:2425–2430. doi: 10.1126/science.1063736. [DOI] [PubMed] [Google Scholar]
- Hayhoe MM, Shrivastava A, Mruczek R, Pelz JB. Visual memory and motor planning in a natural task. J Vis. 2003;3:49–63. doi: 10.1167/3.1.6. [DOI] [PubMed] [Google Scholar]
- Ilg UJ, Schumann S, Thier P. Posterior parietal cortex neurons encode target motion in world-centered coordinates. Neuron. 2004;43:145–151. doi: 10.1016/j.neuron.2004.06.006. [DOI] [PubMed] [Google Scholar]
- Karn KS, Møller P, Hayhoe MM. Reference frames in saccadic targeting. Exp Brain Res. 1997;115:267–282. doi: 10.1007/pl00005696. [DOI] [PubMed] [Google Scholar]
- Kastner S, DeSimone K, Konen CS, Szczepanski SM, Weiner KS, Schneider KA. Topographic maps in human frontal cortex revealed in memory-guided saccade and spatial working-memory tasks. J Neurophysiol. 2007;97:3494–3507. doi: 10.1152/jn.00010.2007. [DOI] [PubMed] [Google Scholar]
- Kriegeskorte N, Mur M, Ruff DA, Kiani R, Bodurka J, Esteky H, Tanaka K, Bandettini PA. Matching categorical object representations in inferior temporal cortex of man and monkey. Neuron. 2008;60:1126–1141. doi: 10.1016/j.neuron.2008.10.043. [DOI] [PMC free article] [PubMed] [Google Scholar]
- Kriegeskorte N, Simmons WK, Bellgowan PS, Baker CI. Circular analysis in systems neuroscience: the dangers of double dipping. Nat Neurosci. 2009;12:535–540. doi: 10.1038/nn.2303. [DOI] [PMC free article] [PubMed] [Google Scholar]
- Land M, Mennie N, Rusted J. The roles of vision and eye movements in the control of activities of daily living. Perception. 1999;28:1311–1328. doi: 10.1068/p2935. [DOI] [PubMed] [Google Scholar]
- Levy I, Schluppeck D, Heeger DJ, Glimcher PW. Specificity of human cortical areas for reaches and saccades. J Neurosci. 2007;27:4687–4696. doi: 10.1523/JNEUROSCI.0459-07.2007. [DOI] [PMC free article] [PubMed] [Google Scholar]
- Luna B, Thulborn KR, Strojwas MH, McCurtain BJ, Berman RA, Genovese CR, Sweeney JA. Dorsal cortical regions subserving visually guided saccades in humans: an fMRI study. Cereb Cortex. 1998;8:40–47. doi: 10.1093/cercor/8.1.40. [DOI] [PubMed] [Google Scholar]
- McKyton A, Pertzov Y, Zohary E. Pattern matching is assessed in retinotopic coordinates. J Vis. 2009;9:19 11–10. doi: 10.1167/9.13.19. [DOI] [PubMed] [Google Scholar]
- Medendorp WP, Goltz HC, Vilis T. Directional selectivity of BOLD activity in human posterior parietal cortex for memory-guided double-step saccades. J Neurophysiol. 2006;95:1645–1655. doi: 10.1152/jn.00905.2005. [DOI] [PubMed] [Google Scholar]
- Melcher D. Predictive remapping of visual features precedes saccadic eye movements. Nat Neurosci. 2007;10:903–907. doi: 10.1038/nn1917. [DOI] [PubMed] [Google Scholar]
- Melcher D, Colby CL. Trans-saccadic perception. Trends Cogn Sci. 2008;12:466–473. doi: 10.1016/j.tics.2008.09.003. [DOI] [PubMed] [Google Scholar]
- Melcher D, Morrone MC. Spatiotopic temporal integration of visual motion across saccadic eye movements. Nat Neurosci. 2003;6:877–881. doi: 10.1038/nn1098. [DOI] [PubMed] [Google Scholar]
- Merriam EP, Genovese CR, Colby CL. Spatial updating in human parietal cortex. Neuron. 2003;39:361–373. doi: 10.1016/s0896-6273(03)00393-3. [DOI] [PubMed] [Google Scholar]
- Merriam EP, Genovese CR, Colby CL. Remapping in human visual cortex. J Neurophysiol. 2007;97:1738–1755. doi: 10.1152/jn.00189.2006. [DOI] [PMC free article] [PubMed] [Google Scholar]
- Mullette-Gillman OA, Cohen YE, Groh JM. Eye-centered, head-centered, and complex coding of visual and auditory targets in the intraparietal sulcus. J Neurophysiol. 2005;94:2331–2352. doi: 10.1152/jn.00021.2005. [DOI] [PubMed] [Google Scholar]
- Mullette-Gillman OA, Cohen YE, Groh JM. Motor-related signals in the intraparietal cortex encode locations in a hybrid, rather than eye-centered reference frame. Cereb Cortex. 2009;19:1761–1775. doi: 10.1093/cercor/bhn207. [DOI] [PMC free article] [PubMed] [Google Scholar]
- Ong WS, Hooshvar N, Zhang M, Bisley JW. Psychophysical evidence for spatiotopic processing in area MT in a short-term memory for motion task. J Neurophysiol. 2009;102:2435–2440. doi: 10.1152/jn.00684.2009. [DOI] [PubMed] [Google Scholar]
- Pertzov Y, Zohary E, Avidan G. Rapid formation of spatiotopic representations as revealed by inhibition of return. J Neurosci. 2010;30:8882–8887. doi: 10.1523/JNEUROSCI.3986-09.2010. [DOI] [PMC free article] [PubMed] [Google Scholar]
- Pierrot-Deseilligny C, Milea D, Müri RM. Eye movement control by the cerebral cortex. Curr Opin Neurol. 2004;17:17–25. doi: 10.1097/00019052-200402000-00005. [DOI] [PubMed] [Google Scholar]
- Schall JD. Neuronal activity related to visually guided saccades in the frontal eye fields of rhesus monkeys: comparison with supplementary eye fields. J Neurophysiol. 1991;66:559–579. doi: 10.1152/jn.1991.66.2.559. [DOI] [PubMed] [Google Scholar]
- Scherberger H, Goodale MA, Andersen RA. Target selection for reaching and saccades share a similar behavioral reference frame in the macaque. J Neurophysiol. 2003;89:1456–1466. doi: 10.1152/jn.00883.2002. [DOI] [PubMed] [Google Scholar]
- Schluppeck D, Glimcher P, Heeger DJ. Topographic organization for delayed saccades in human posterior parietal cortex. J Neurophysiol. 2005;94:1372–1384. doi: 10.1152/jn.01290.2004. [DOI] [PMC free article] [PubMed] [Google Scholar]
- Schluppeck D, Curtis CE, Glimcher PW, Heeger DJ. Sustained activity in topographic areas of human posterior parietal cortex during memory-guided saccades. J Neurosci. 2006;26:5098–5108. doi: 10.1523/JNEUROSCI.5330-05.2006. [DOI] [PMC free article] [PubMed] [Google Scholar]
- Sereno MI, Pitzalis S, Martinez A. Mapping of contralateral space in retinotopic coordinates by a parietal cortical area in humans. Science. 2001;294:1350–1354. doi: 10.1126/science.1063695. [DOI] [PubMed] [Google Scholar]
- Snyder LH. Coordinate transformations for eye and arm movements in the brain. Curr Opin Neurobiol. 2000;10:747–754. doi: 10.1016/s0959-4388(00)00152-5. [DOI] [PubMed] [Google Scholar]
- Sparks DL. The brainstem control of saccadic eye movements. Nat Rev Neurosci. 2002;3:952–964. doi: 10.1038/nrn986. [DOI] [PubMed] [Google Scholar]
- Tatler BW, Land MF. Vision and the representation of the surroundings in spatial memory. Philos Trans R Soc B. 2011 doi: 10.1098/rstb.2010.0188. [DOI] [PMC free article] [PubMed] [Google Scholar]
- Tehovnik EJ, Slocum WM, Tolias AS, Schiller PH. Saccades induced electrically from the dorsomedial frontal cortex: evidence for a head-centered representation. Brain Res. 1998;795:287–291. doi: 10.1016/s0006-8993(98)00302-3. [DOI] [PubMed] [Google Scholar]
- Tehovnik EJ, Sommer MA, Chou IH, Slocum WM, Schiller PH. Eye fields in the frontal lobes of primates. Brain Res Brain Res Rev. 2000;32:413–448. doi: 10.1016/s0165-0173(99)00092-2. [DOI] [PubMed] [Google Scholar]
- Thier P, Andersen RA. Electrical microstimulation suggests two different forms of representation of head-centered space in the intraparietal sulcus of rhesus monkeys. Proc Natl Acad Sci U S A. 1996;93:4962–4967. doi: 10.1073/pnas.93.10.4962. [DOI] [PMC free article] [PubMed] [Google Scholar]
- Van Pelt S, Toni I, Diedrichsen J, Medendorp WP. Repetition suppression dissociates spatial frames of reference in human saccade generation. J Neurophysiol. 2010;104:1239–1248. doi: 10.1152/jn.00393.2010. [DOI] [PubMed] [Google Scholar]
- Zipser D, Andersen RA. A back-propagation programmed network that simulates response properties of a subset of posterior parietal neurons. Nature. 1988;331:679–684. doi: 10.1038/331679a0. [DOI] [PubMed] [Google Scholar]