Abstract
The hippocampal formation is one of the brain regions most sensitive to ischemic damage. However, there are no studies about changes in hippocampal neuronal activity during and after a selective unilateral hippocampal ischemia. We developed a novel unilateral cerebrovascular ischemia model in mice that selectively shuts down blood supply to the ipsilateral hippocampal formation. Using a modified version of the photothrombotic method, we stereotaxically targeted the initial ascending part of the longitudinal hippocampal artery in urethane anesthetized and rose bengal-injected mice. To block blood flow in the targeted artery, we photoactivated the rose bengal by illuminating the longitudinal hippocampal artery through an optical fiber inserted into the brain. In vivo field potential recordings in the CA1 region of the hippocampus before, during and after the induction of ischemia demonstrated a high-frequency discharge (HFD) reaching frequencies of >300 Hz and lasting 7–24 s during the illumination consistent with a massive synchronous neuronal activity. The HFD was invariably followed by a DC voltage shift and a decreased activity at both low (30–57 Hz)- and high (63–119 Hz)-gamma frequencies. This decrease in gamma activity lasted for the entire duration of the recordings (∼160 min) following ischemia. The contralateral hippocampus displayed HFDs but with different frequency spectra and without DC voltage shifts or long-lasting decreases in gamma oscillations. Our findings reveal for the first time the acute effects of unilateral hippocampal ischemia on ensemble hippocampal neuronal activities.
Introduction
Precerebral or cerebral artery occlusions account for 70–80% of acute strokes (Williams et al., 1999). The hippocampus plays important roles in learning, memory and epilepsy and is known to have high susceptibility to ischemic damage compared with other brain structures in both animals (Schmidt-Kastner and Freund, 1991; Akai and Yanagihara, 1993; Ordy et al., 1993; Sugawara et al., 2002) and humans (Fujioka et al., 2000). In various neurological disorders, including Parkinson's disease and Alzheimer's disease, the neurodegeneration appears to be similar to that observed after cerebral ischemia. Therefore, investigating the mechanisms of ischemic injury in the hippocampus may provide insights into other pathogenetic mechanisms and may help develop new therapeutic strategies. However, currently much of stroke research uses high-throughput models of mechanically induced cerebral ischemia, which do not accurately mimic a stroke caused by embolic or thrombotic occlusion of a cerebral artery. Despite their widespread use, such stroke models have several drawbacks: the procedures are invasive and technically demanding; morbidity and mortality are high, and ischemic lesions are variable. These considerations make mechanical arterial occlusion models less than ideal for many experimental arrangements, especially when extended postischemia survival is required. Our present knowledge about the in vivo ischemia-induced changes in hippocampal electrical activity is based on models of mechanically evoked whole forebrain ischemia in rats (Buzsáki et al., 1989; Freund et al., 1989). Currently there are no data on how various hippocampal oscillatory activities might be affected by hippocampal ischemia in vivo.
An alternative to the arterial physical occlusion model is the technique of photothrombosis using the photosensitive dye rose bengal (Watson et al., 1985). Here, an intense light beam interacts with the photosensitizing dye to induce the formation of a clot in brain blood vessels. Although there are several advantages of the photothrombotic model (reproducible infarct area, depth, location; relatively noninvasive) it has certain theoretical limitations. In transcranial cortical photothrombosis the procedure preferentially occludes small pial vessels, resulting in an end-arterial form of ischemia considerably different from most cases of thrombotic stroke in humans.
This study describes a novel, relatively noninvasive in vivo mouse stroke model combining the advantages of photothrombosis and stereotaxic localization. Our modified photothrombotic model is the first to target a deep brain hippocampal artery. Thus, it is possible to more accurately mimic the thrombotic occlusion of a relatively large-diameter specific cerebral artery in mice, avoiding end-arterial mechanisms of photothrombosis. Our model allowed us to investigate consequences of a selective one-sided hippocampal ischemia. We describe changes in neuronal activity in both hippocampi during and after unilateral hippocampal ischemia. Most of the work in stroke models has been done in rats because of their larger size and the substantial experience in both stroke induction and behavioral testing in this species. However, mice, and in particular genetically modified mice, constitute a valuable animal model with a far wider spectrum of genetic manipulations than in any other mammalian species. Therefore, a mouse stroke model should be extremely valuable in future research addressing the pathomechanisms of ischemia and the development of novel therapies.
Materials and Methods
Anesthesia and surgery
Surgeries were performed under aseptic conditions on male C57BL/6 mice according to a protocol approved by the University of California, Los Angeles Chancellor's Animal Research Committee. General anesthesia was achieved using intraperitoneal administration of urethane (1.5 g/kg; U2500, Sigma) in a previously isoflurane anesthetized animal. To overcome breathing problems commonly observed in mice during urethane anesthesia (Moldestad et al., 2009), we first determined the optimal urethane dose in our experiments. Above a urethane dose of 1.7 g/kg wheezing and irregular breathing occurred on average at 96 ± 10.2 min after urethane injection (n = 10). In preliminary experiments we found that the lowest dose of urethane to induce proper anesthesia without breathing problems is 1.5 g/kg (n = 7). To avoid possible differences in the metabolism of urethane we used mice from a narrow age and weight range (weight, 24–28 g; age, 10–14 weeks). The level of anesthesia was assessed throughout the experiment by monitoring reflex withdrawal to a hindpaw pinch. Body temperature was maintained at 37°C using a rectal probe and a water circulated heating pad. The animal was mounted into a standard Stoelting instrument stereotaxic frame with blunt ear bars. The cranium was exposed through a small midline scalp incision and two, for the simultaneous bilateral recordings three small (∼ 0.5 mm diameter) holes were drilled in the cranium. Individual coordinates were determined by using the procedure described in the next section. With the aid of a micromanipulator, a sterilized recording electrode (Plastics One, or two Ag/AgCl glass electrodes in simultaneous bilateral AC/DC recordings) was lowered at a speed of ∼70–150 μm/s into the stratum pyramidale of the hippocampal CA1 region [from the rostral confluence of the nasal sinus, anteroposterior (AP), 5.19 ± 0.02 mm; mediolateral (ML), ±1.45 mm; dorsoventral (DV), 1.45 mm], while through the other hole a sterilized cannula guide (Plastics One) was lowered into the brain at coordinates determined to reach the longitudinal hippocampal artery (from the rostral confluence of the nasal sinus, AP, 7.14 ± 0.03 mm; ML, 2.25 mm; DV, 2.38 mm). We used glass pipettes with narrow elongated tips (tip outside diameter of <70 μm, diameter at the level of cortical surface ∼ 85 μm) to avoid the development of spreading depression-like phenomena during the electrode insertion (Verhaegen et al., 1992). A ground/reference electrode was placed under the scalp.
Localization of the longitudinal hippocampal artery
In mice, the major blood supply of the hippocampal formation is provided by branches of the basilar and internal carotid arteries (Dorr et al., 2007). The posterior cerebral artery, a branch of the superior cerebellar artery originating from the basilar artery, gives rise to the longitudinal hippocampal artery. The longitudinal hippocampal artery heads dorsally and then turns anterior to follow a path approximately parallel to the longitudinal axis of the hippocampus, in close proximity to the hippocampal fissure, to provide the blood supply to the ventral and dorsal parts of the hippocampus. The internal carotid artery gives rise to the anterior choroidal artery. The dorsally directed part of the anterior choroidal artery provides the blood supply of the anterior portion of the hippocampus (Dorr et al., 2007). To achieve a selective and extended hippocampal stroke we targeted the initial ascending part of the longitudinal hippocampal artery by using a modified version of the photothrombotic method (Watson et al., 1985).
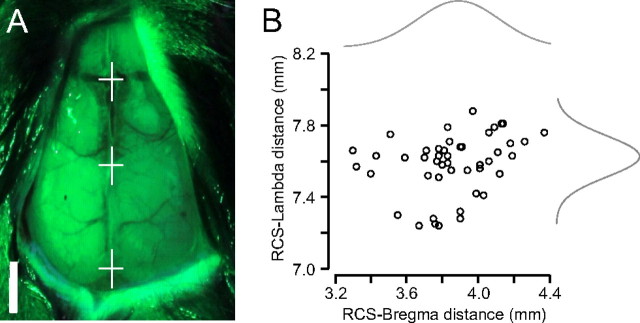
Successful localization of the longitudinal hippocampal artery was critical for the implementation of this new model. To assess the position of the artery we used two recently developed three-dimensional (3-D) digital mouse brain atlases (Chan et al., 2007; Dorr et al., 2007). We determined an optimal set of landmarks through the mouse skull, the lambda sinus (LS), and the rostral confluence of the nasal sinus (RCS), caudal to the olfactory bulb. We used green light penetrating through the intact skull moisturized by silicone oil to better visualize the vascular landmarks (Fig. 1A). In accordance with previously published findings (Chan et al., 2007), we found that the vascular landmarks are more consistent than the bony bregma landmark between individual animals since they act as landmarks of the brain vasculature itself (Fig. 1B) (RCS-bregma coefficient of variation, 6.3%; RCS-LS coefficient of variation, 2.2%; n = 46 mice). To further optimize the stereotaxic coordinates, we individualized the coordinates by counting a ratio between the measured RCS-LS distance and the RCS-LS distance found in the 3-D digital mouse atlas (Chan et al., 2007; Dorr et al., 2007). The resulting factor served to optimize the stereotaxic coordinates in each individual experiment.
Figure 1.
Localization of the longitudinal hippocampal artery. A, Determination of an optimal set of landmarks through the mouse skull: the lambda sinus (bottom white cross), the bregma (middle white cross) and the RCS (top white cross). The vascular landmarks can be better visualized with green light penetrating through the intact skull. Scale bar, 2 mm. B, The RCS-lambda distance is more consistent than the RCS-bregma distance (n = 46; RCS-bregma, 3.86 ± 0.24 mm; RCS-lambda, 7.58 ± 0.17 mm).
Photostimulation
Mice mounted into the stereotaxic frame were given an injection of 10 mg/ml solution of rose bengal (100 mg/kg, i.p., Sigma) in physiological saline. The distal end of a multimodal optical fiber with silica core (200 μm core diameter BFL37–200; Thorlabs) coupled to a 532 nm diode laser was inserted into the cannula guide and advanced until flush with the end of the cannula guide. To photoactivate the rose bengal and to induce targeted hippocampal ischemia the longitudinal hippocampal artery was illuminated (5–15 min, 14–50 mW) through the cannula guide. To test the effect of illumination alone, a separate group of animals were injected with the appropriate aliquot of saline solution not containing rose bengal and were then irradiated for 15 min.
2,3,5-Triphenyltetrazolium chloride staining
To determine the infarction area, in a separate group of experiments (n = 4) brains were removed 4 h after hippocampal ischemia induction. Brain sections containing the hippocampi were sliced (300 μm slice thickness). Slices were immediately immersed in 1% 2,3,5-triphenyltetrazolium chloride (TTC) in artificial CSF at 37°C for 15 min for vital staining, and transferred in 4% paraformaldehyde for immersion fixation for 24 h then photographed.
Electrophysiological recordings
During recordings, the stereotaxic apparatus was connected to ground. To increase the signal-to-noise ratio in our recordings the preamplifier headstage of a DC amplifier (model 2400, A-M Systems) was attached to the electrode holder of the stereotaxic frame. In a set of experiments contralateral and ipsilateral hippocampal activity were measured separately, in different mice, in another set of experiments simultaneous bilateral hippocampal recordings were carried out. Field potential recordings were further amplified to a final gain of 2000× and were bandpass filtered between 0.1 and 1000 Hz using a secondary amplifier (model 210A, Brownlee). In some unilateral and in all simultaneous measurements we used low-pass-filtered (1000 Hz) DC recordings at a lower gain (100×) on a second channel (on both sides in the simultaneous recordings) to observe the baseline changes during ischemia induction. All field signals were referenced to the implanted reference electrode. Recorded signals were digitized on-line (sampling frequency of 4096 s−1) with PCI-MIO16E-4 data acquisition board (National Instruments). Data acquisition was performed using a custom-written LabView-based software (EVAN).
Data processing and analysis
A custom-written procedure running under IGOR Pro v6.12A (Lake Oswego, OR) was used to perform the following analyses.
Frequency spectrogram.
The magnitude of the spectrum was calculated using a series of Gabor FFT windows of 64 points across the entire data segment. The magnitude was obtained as the square root of the sum of the squared real part and the squared imaginary part. Thus, the magnitude is a real quantity and represents the total signal amplitude in each frequency bin (1.25 Hz bins). We further refer to this total FFT magnitude as amplitude. Frequency bands were created by averaging the spectral values in the 1–2 Hz (delta), 4–12 Hz (theta), 30–57 Hz (low gamma) and 63–119 Hz (high gamma) ranges (Buzsáki, 2006). For the three-dimensional surface spectrogram, individual, normalized spectrograms of the high-frequency discharges (HFDs) were averaged and the spectrogram of control activity was subtracted from the average spectrogram. The control activity was defined as the average normalized spectrogram before the HFD. After the subtraction, the resulting spectrogram only shows the additional frequency components resulting from the HFD and it was plotted as a 3-D surface diagram.
Separation of baseline and burst components.
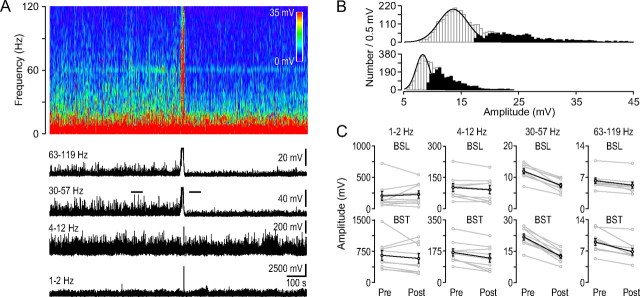
An all-point histogram was generated from the spectral values of each of the four frequency bands. For every 60 s epoch a Gaussian curve was fitted to the part of the distribution not skewed from the peak value to the leftmost (smallest) value of the histogram (see Fig. 5B). The mean of the fitted Gaussian curve was considered to be the baseline value. To obtain the burst component, the fitted Gaussian curve was subtracted from the histogram. The cumulative sum of the difference (during each 60 s epoch) was calculated and divided by the number of points in that segment of time to yield the burst component (Glykys and Mody, 2007). This process was repeated for each frequency band.
Figure 5.
Low and high gamma activity decreases after the HFD. A, Frequency spectrogram of the ipsilateral field potential recording from the dorsal hippocampal CA1 region during ischemia induction (top). Note the HFD on the spectrogram. Below, the black traces show the average amplitudes of the frequency spectrogram in the indicated frequency ranges. The HFD in the top two traces is followed by decreased activity. B, Measurement of the baseline-burst components. Gaussian fits to the all-points histogram of two 60-s-long segments of the low-gamma trace in A indicated by two horizontal lines before (top) and after (bottom) the HFD. The peak of the Gaussian denotes the mean baseline component while all the points outside of the Gaussian distribution (skewed to the right, darker bars indicate the difference between the Gaussian fit and the histogram) constitute the burst component. The cumulative sum of the data points indicated by the darker bars was calculated and divided by the number of points to yield the burst component. C, Baseline-burst component before and after the HFD in the four frequency ranges indicated at the top. In each group the gray point pairs show the baseline (BSL, top diagrams) and burst (BST, bottom diagrams) components before (Pre, 8-min-long interval) and after (Post, 8-min-long interval) the HFD in individual experiments. Black point pairs indicate the average values (±SEM). Note the large decrease in the low- and high-gamma range (n = 9).
Detection and measurement of the large theta cycle.
For event detection, a threshold-crossing method was used with a custom-made Igor procedure. The SD of a short 40-ms-long segment of the recording was determined; then, typically, a threshold setting of 50–100 times this SD was used. Segments (1.3 s long) of recordings containing the large theta cycles (from 500 ms before to 800 ms after the peak) were aligned by their peaks and were averaged; the corresponding low- and high-gamma components were also averaged. The delay of the gamma components were determined by calculating the differences between the peak of the average large theta cycle and the corresponding average low/high gamma components. Amplitudes were calculated by subtracting the baseline value from the peak value of the average events and components.
Statistical analysis.
Summary reports of data are presented as arithmetic means together with the SEM unless otherwise noted. Numerical comparisons across conditions for the same datasets were made using pairwise t tests (with a significance level of <0.05).
Results
TTC staining
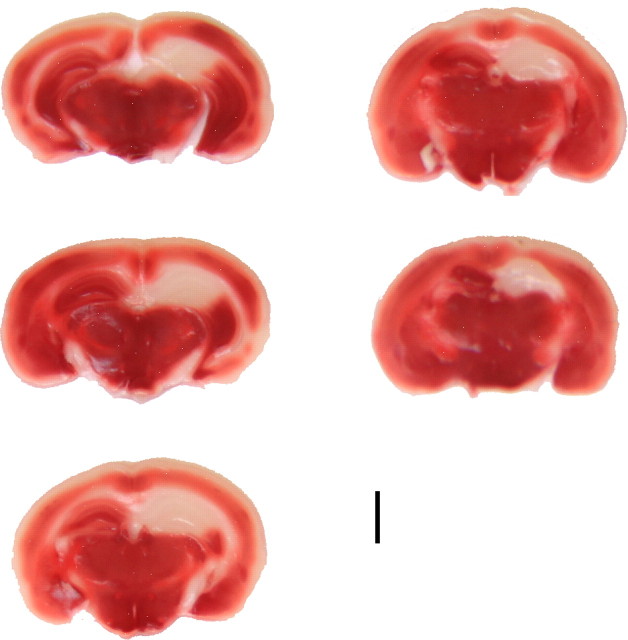
To demonstrate the extent of the hippocampal ischemia we histologically characterized the tissue damage caused by the unilateral hippocampal artery occlusion. We used urethane for anesthesia to preserve brain oscillatory activity. Since due to its long-term toxicity, urethane is suitable only for acute, terminal experiments, it was necessary to show the ischemic damage in an early phase. The TTC staining rests on the functioning of mitochondrial enzymes (Liszczak et al., 1984). Under ideal conditions this technique can detect irreversibly damaged brain areas as early as 2.5 h after arterial occlusion (Liszczak et al., 1984). In our TTC experiments (n = 4) 4 h after hippocampal ischemia induction TTC staining did reliably delineate the extensive hippocampal infarct area (pale areas versus noninjured deep red colored tissue, Fig. 2).
Figure 2.
TTC staining. Consecutive TTC-stained coronal brain sections at 4 h following unilateral (right side) hippocampal ischemia induction. The TTC staining delineates the extensive hippocampal infarction. Scale bar, 2 mm; slice thickness, 300 μm.
Hippocampal oscillatory activity in mice during urethane anesthesia
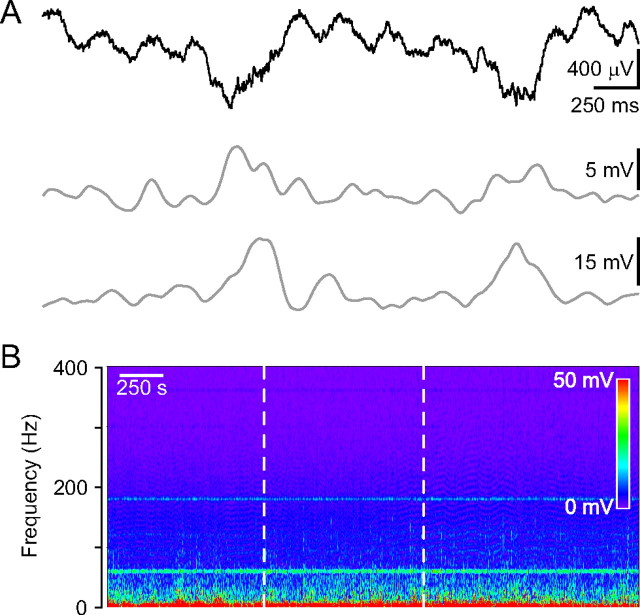
As a first step in characterizing hippocampal oscillatory activity in vivo, we performed field potential recordings from the stratum pyramidale of dorsal hippocampal CA1 region of urethane anesthetized mice, since most previous studies were performed in rats. As previously reported, rats anesthetized with urethane demonstrate spontaneous and cyclical alternations in brain state (activated-deactivated) that resemble sleep state alternations (Clement et al., 2008). The activated state consists of theta activity (Vanderwolf et al., 1978; Buzsáki et al., 1983; Bland, 1986; Buzsáki, 2002) coexpressed with a faster gamma rhythm. The deactivated EEG patterns are characterized by large-amplitude slow irregular oscillatory activity. Intermittent, large-amplitude transients (30–120 ms) called hippocampal “sharp waves” (Buzsáki, 1986; Suzuki and Smith, 1987) are characteristic of this state. In our experiments robust theta oscillations were observed in unperturbed urethane-anesthetized mice. Theta oscillations periodically showed an increased amplitude which appeared on the field potential recordings as large negative deflections (inter-event intervals, 2.0 ± 0.2 s, n = 6 mice) (Fig. 3A). Theta- and gamma-frequency EEG rhythms coexist in the hippocampus of the rat when awake or during ketamine-xylazine or urethane anesthesia (Buzsáki et al., 1983; Soltesz and Deschênes, 1993; Bragin et al., 1995). To examine this in mice, we performed detailed frequency spectra analyses showing that the large theta cycles are also accompanied by enhanced low- and high-gamma range oscillations. Both gamma components peaked after the maximum of the large-amplitude theta cycle (low gamma, 100.0 ± 24.4 ms; high gamma, 73.8 ± 25.6 ms; n = 7 mice) (Fig. 3A). This is in agreement with previous findings showing that the amplitude of theta-coupled gamma oscillation is highest shortly after the peak of the theta cycle (Wulff et al., 2009). In accordance with previous evidence showing that urethane anesthesia decelerates the oscillation frequency (Ylinen et al., 1995), we observed gamma activity only up to ∼120 Hz (Fig. 3B).
Figure 3.
In vivo field potential recording from the dorsal hippocampal CA1 region in urethane anesthetized mice. A, Field potential recording showing two large negative deflections emerging from the normal theta rhythm (top). High (63–119 Hz range; middle)- and low-gamma (30–57 Hz range; bottom) components riding on the large negative deflection. B, Frequency spectrogram of the hippocampal field potential recording. The laser illumination (20 mW) by itself did not induce changes in the spectrogram (dotted white lines mark the duration of the laser illumination). Six minutes before the laser illumination physiological saline injection was injected instead of rose bengal.
In control experiments, to test the effect of laser irradiation alone, the appropriate aliquot of vehicle (saline solution) not containing rose bengal was injected and was followed by a 15-min-long irradiation (20 mW laser power). The green activating light alone did not induce any changes in oscillations (Fig. 3B).
Electrical activity during acute hippocampal ischemia
We next sought to determine the acute impact of a unilateral specific hippocampal ischemia on hippocampal electrical activity. We have performed in vivo field potential recordings in the stratum pyramidale of the dorsal hippocampal CA1 region of urethane anesthetized and rose bengal-injected mice (n = 12) before and during the induction of cerebrovascular trauma. The 5- or 15-min-long laser illumination was started 6 min after intraperitoneal injection of rose bengal. On average, at 207.4 ± 66.0 s (n = 12) after the onset of laser illumination small sawtooth-shaped potentials appeared in the hippocampal field potential recording, which then gave way to a shower of spikes (Fig. 4A). The amplitude of the spikes first increased and then decreased giving the discharge a triangular-shape. The shower of population spike discharge (referred to henceforth as HFD) typically lasted 12.3 ± 1.6 s (range, 7–24 s; n = 12). Frequency spectrum analysis of the recorded hippocampal activity showed high-frequency components during the discharge reaching frequencies of >250 Hz and the maximal amplitude was in the low gamma range (Fig. 4A–C). The HFD was invariably followed by a characteristic baseline shift indicated by a deep sag in our DC recording. By the time the fast DC drop was initiated, the HFD started to decline (Fig. 4A).
Figure 4.
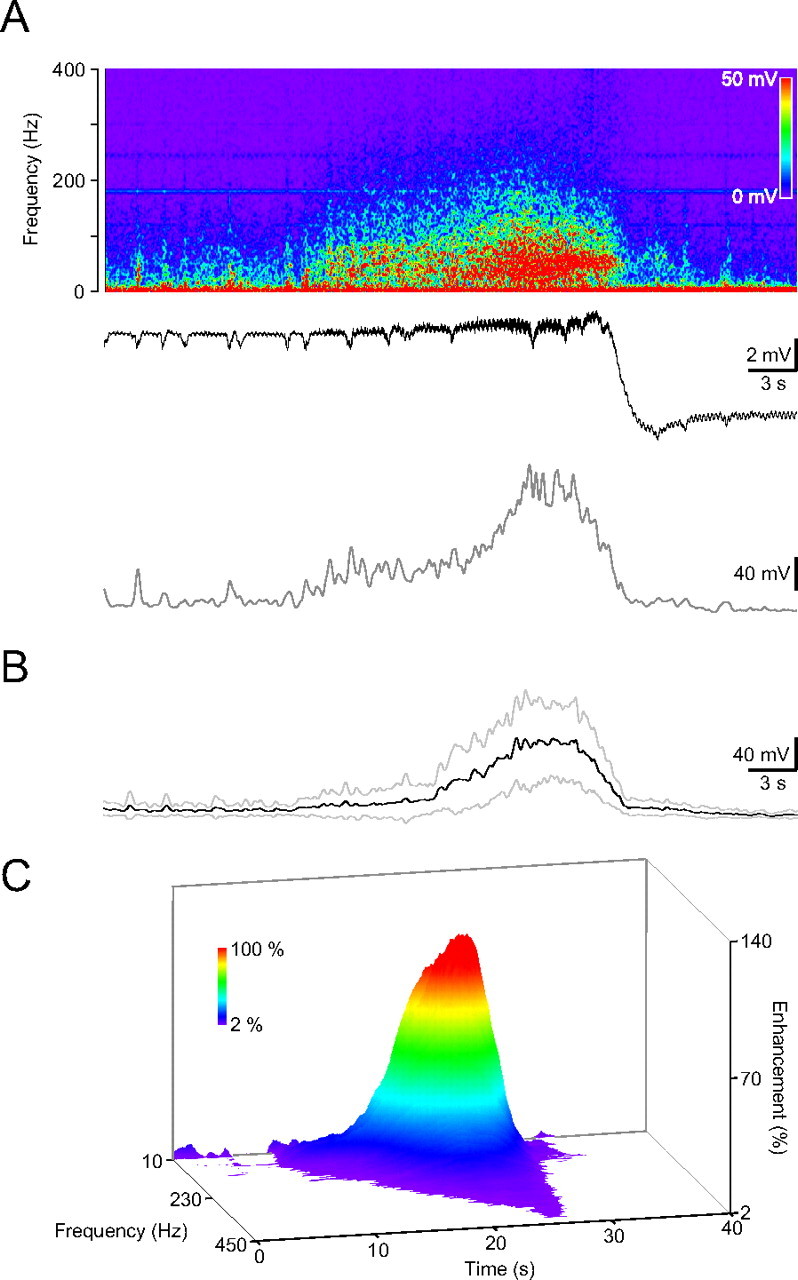
HFD during ischemia induction in the ipsilateral hippocampus. A, Frequency spectrogram of the in vivo recording from the dorsal hippocampal CA1 region (top), the recorded DC activity (middle trace) and the average amplitude in the low gamma, 30–57 Hz range. B, Averaged HFD in the low-gamma range (dark trace, gray traces, ±SD; n = 12). C, Color-coded 3-D surface spectrogram of the averaged HFD. Note the frequency components up to 450 Hz.
Oscillatory activity after the injury
To examine how the hippocampal ischemia affects the hippocampal oscillatory activity we divided the frequency spectrograms in four frequency bands: delta, 1–2 Hz; theta, 4–12 Hz; low gamma, 30–57 Hz; and high gamma, 63–119 Hz. The HFD was invariably followed by decreased amplitude at theta, low- and high-gamma frequencies, but not at the lower delta range (Fig. 5A). This amplitude decrease developed in a step-like manner after the HFD and lasted for the entire duration of the recordings (∼60 min after the laser illumination). To further refine our analysis, burst and baseline components (determined as described in the Materials and Methods) were separated for each frequency band. Using this method, we found that in the theta bands the burst component, in the gamma bands both the burst and the baseline components decreased. The amplitude reduction was more pronounced in the low-gamma than in the theta or high-gamma range [comparing averaged components of 8-min-long segments 9–1 min before and 1–9 min after the HFD; theta baseline (given as percentage of control): 86.2 ± 8.4%, p > 0.05; burst: 78.0 ± 6.2%, p < 0.05; low gamma baseline: 61.9 ± 3.3%, p < 0.05; burst: 57.6 ± 2.8%, p < 0.05; high gamma baseline: 83.5 ± 3.1%, p < 0.05; burst: 76.5 ± 4.0%, p < 0.05; n = 9] (Fig. 5C). With lower laser power (below 14 mW, 13.2 ± 0.2 mW, n = 3) the amplitudes tended to return (comparing averaged components of 4-min-long segments 9 min before and right after the HFD: theta baseline: 82.9 ± 5.4%, burst: 84.9 ± 3.1%, low gamma baseline: 49.6 ± 7.5%, burst: 56.1 ± 8.1%, high gamma baseline: 65.4 ± 10.5%, high gamma burst: 81.3 ± 2.6%; comparing averaged components of 4-min-long segments 9 min before and 14 min after the HFD: theta baseline: 91.4 ± 18.9%, burst: 84.6 ± 7.9%, low gamma baseline: 87.4 ± 2.6%, burst: 87.9 ± 9.0%, high gamma baseline: 87.3 ± 5.9%, burst: 94.2 ± 4.6%). Illumination with lower-power (below 10 mW at the tip of the optical fiber) did not evoke discharges even after 15 min of illumination. This is in agreement with previous findings showing that there is a distinct laser power threshold to induce photothrombosis (Silva et al., 2005).
Alterations in the pattern of large theta cycles
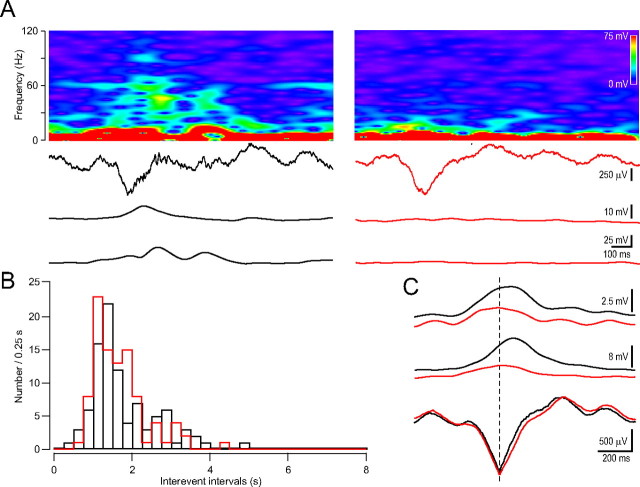
In the next step we investigated possible changes in the large theta cycle-gamma complex after the HFD caused by the ischemia. We have found that after the photothrombosis-induced HFD the gamma components accompanying the large theta cycles largely decreased (low gamma amplitude before: 9.4 ± 1.2 mV, after: 4.3 ± 1.1 mV, p < 0.05; high gamma amplitude before: 3.0 ± 0.5 mV, after: 1.6 ± 0.6 mV, p < 0.05, n = 4 mice) while the amplitudes and inter-event intervals of the large-amplitude theta cycles did not change (amplitude before: 478.6 ± 84.5 μV, after: 442.9 ± 100.6 μV, p > 0.05; inter-event intervals before: 1.91 ± 0.1 s, after: 1.91 ± 0.3 s, p > 0.05) (Fig. 6A–C).
Figure 6.
Gamma components disappeared from the large theta cycle after ischemia induction. A, Sample large theta cycle (second row from top) before (left, black) and after (right, red) the HFD with the corresponding frequency spectrogram (top), low (bottom)-, and high (second from bottom)-gamma components. B, Distribution of the inter-event intervals of the large theta cycle before (black) and after (red) the HFD. C, Averaged large theta cycle and the corresponding low- and high-gamma components before (black) and after (red) the HFD. Note the reduced gamma components while the averaged large theta cycles remain the same.
Electrical activity during and after the injury in the contralateral hippocampus
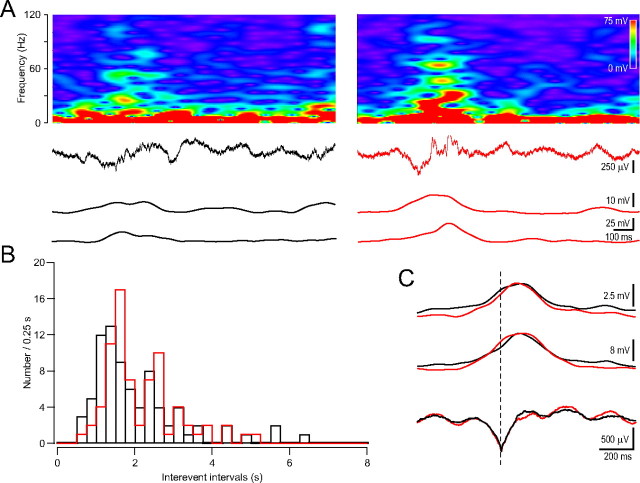
Seizures induced in one hippocampus propagate to the contralateral hippocampus and then to other brain areas (Goto et al., 1994). We wanted to find out whether the HFD induced by unilateral ischemia could propagate to the contralateral side. In 4 mice we performed unilateral hippocampal ischemia but recorded from the contralateral dorsal hippocampal CA1 stratum pyramidale. During the induction phase of the ischemia the contralateral hippocampal recording also displayed HFD with a similar duration (15.7 ± 0.5 s). However it was not followed by the characteristic DC potential shift (Fig. 7A–C). Separating the baseline and burst components in the four frequency ranges did not reveal any alteration in the baseline or burst components (comparing averaged components of 8-min-long segments 9–1 min before and 1–9 min after the HFD; delta baseline: 106.6 ± 22.7%, p > 0.05; burst: 95.5 ± 13.5%, p > 0.05; theta baseline: 96.1 ± 7.5%, p > 0.05; burst: 87.7 ± 5.6%, p > 0.05; low gamma baseline: 104.0 ± 9.3%, p > 0.05; burst: 98.8 ± 4.0%, p > 0.05; high gamma baseline: 99.9 ± 5.9%, p > 0.05; burst: 94.5 ± 2.1%, p > 0.05) (Fig. 8A,B). The contralateral cerebrovascular trauma induction did not affect the inter-event intervals (before: 2.17 ± 0.3 s, after: 2.15 ± 0.2 s, p > 0.05) of the large theta cycles or the amplitudes of their gamma components (low gamma amplitude before: 10.5 ± 0.2 mV, after: 12.3 ± 1.0 mV, p > 0.05; high gamma amplitude before: 3.8 ± 0.5 mV, after: 4.1 ± 0.8 mV, p > 0.05) (Fig. 9A–C).
Figure 7.
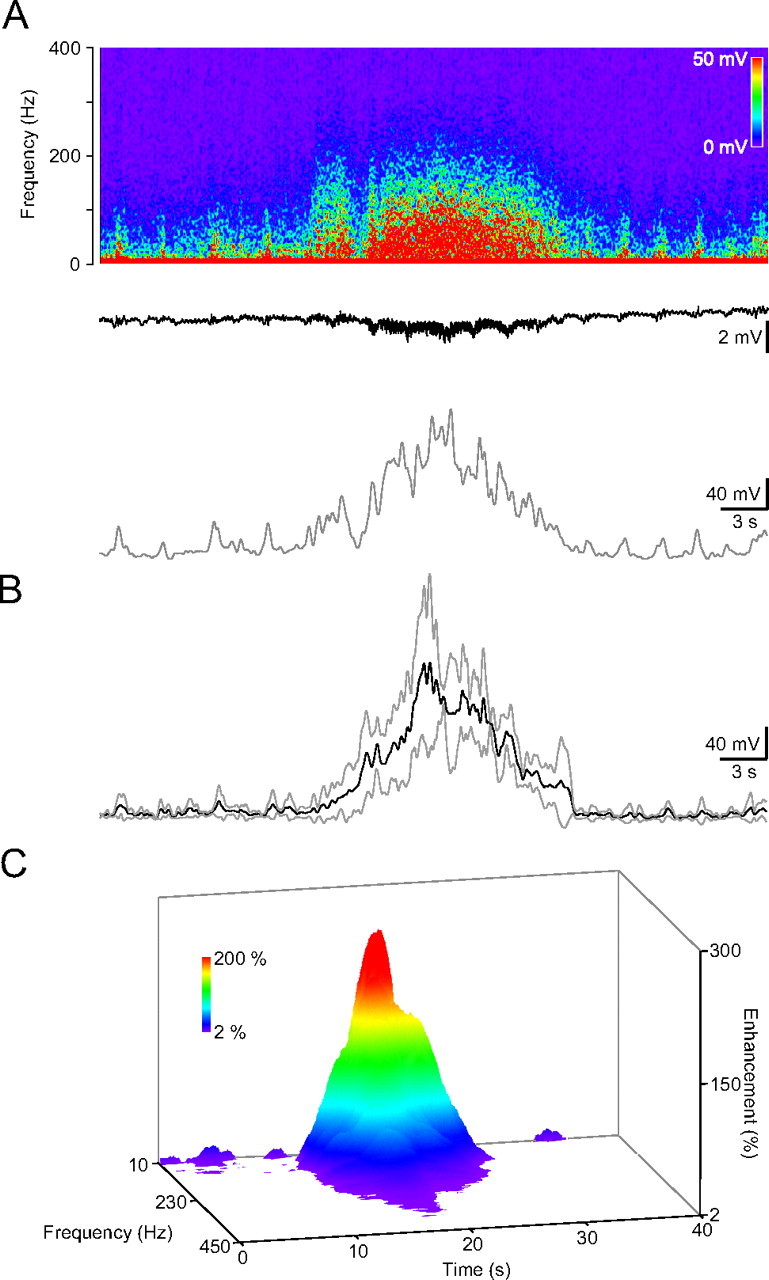
HFD appears in the contralateral hippocampus. A, Frequency spectrogram of the in vivo recording from the dorsal hippocampal CA1 region (top), the recorded DC activity (middle trace) and the average amplitude in the low gamma, 30–57 Hz range. Note the missing DC voltage shift after the HFD. B, Averaged HFD in the low-gamma range (dark trace, gray traces, ±SD; n = 4). C, Color-coded 3-D surface spectrogram of the averaged contralateral HFD.
Figure 8.
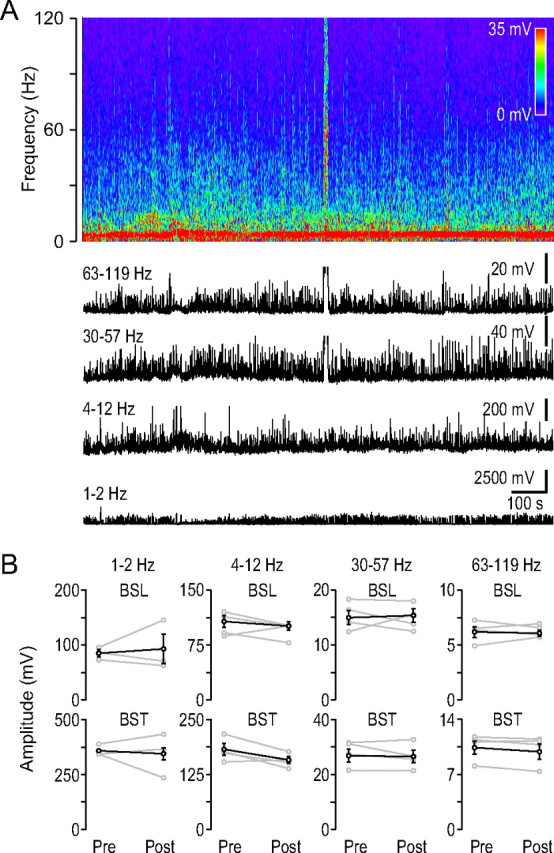
Gamma activity did not change after the HFD in the contralateral hippocampus. A, Frequency spectrogram of the contralateral field potential recording from the dorsal hippocampal CA1 region during ischemia induction (top). Note the contralateral HFD. Below the black traces show the average amplitudes of the frequency spectrograms in the indicated frequency ranges. B, Baseline-burst components before and after the HFD in the four frequency ranges indicated at the top, similar arrangement as in Figure 5. (n = 4).
Figure 9.
Gamma components are preserved on the large theta cycle after ischemia induction in the contralateral hippocampus. A, Sample large theta cycle (second row from top) before (left) and after (right) the HFD with the corresponding frequency spectrogram (top), low (bottom)-, and high (second from bottom)-gamma components. B, Distribution of the inter-event intervals of the large theta cycle before (black) and after (red) the HFD. C, Averaged large theta cycle and the corresponding low- and high-gamma components before (black) and after (red) the HFD.
Simultaneous bilateral hippocampal recordings
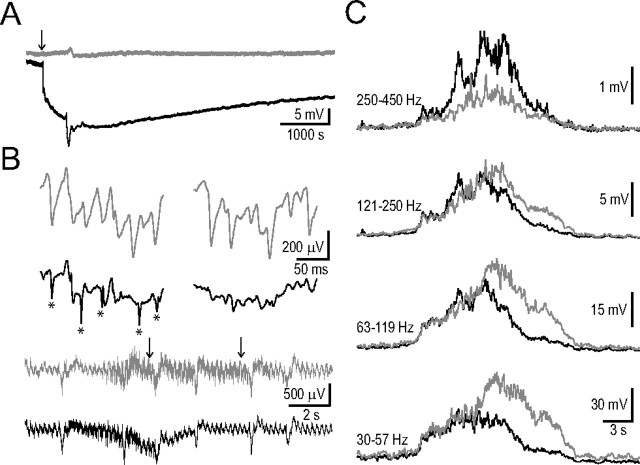
To characterize the obvious differences between ipsi- and contralateral frequency spectrograms of the HFDs (Figs. 4, 7) and the duration of the extracellular DC shift and decreased gamma activity we performed 10 simultaneous bilateral AC/DC recordings from the dorsal hippocampal CA1 region. In 4 cases we made recordings up to 4 h following unilateral hippocampal ischemia induction. These long recordings corroborated the differences between DC shifts and revealed the long-lasting, large-amplitude (−18.0 ± 2.8 mV; n = 4) ipsilateral DC shift (Fig. 10A) most likely reflecting the terminal negativity/depolarization (Higuchi et al., 2002). The gamma activity did not recover in these recordings (comparing averaged components of 8-min-long segments 9–1 min before and 160–168 min after the HFD; low gamma baseline (given as percentage of control): 66.5 ± 6.9%, p < 0.05; burst: 61.0 ± 4.8%, p < 0.05; high gamma baseline: 85.4 ± 3.0%, p < 0.05; burst: 77.0 ± 3.0%, p < 0.05; n = 4).
Figure 10.
Simultaneous bilateral AC/DC field potential recordings from the dorsal hippocampal CA1 region during and after ischemia induction. A, Bilateral DC channels show the long-lasting ipsilateral DC shift following the HFD (contralateral, gray; ipsilateral, black). B, Bilateral AC channels (same animal as in A). Bottom two traces, HFD preceding the DC drop can be observed in both hippocampi (arrow in A indicates the timing of the sections). Top two rows show enlarged AC field potential sections indicated by arrows on the bottom two traces (contralateral, gray; ipsilateral, black). Note the contralateral large population spikes at both time points, and ipsilaterally the narrow fast spikes (indicated by asterisks) at the first time point. C, Bilaterally averaged HFD in four frequency ranges (contralateral, gray; ipsilateral, black; n = 10). The contralateral frequency components in the 30–119 Hz band continue to increase and achieve larger amplitude while the ipsilateral components are starting to decline. Note that in the highest frequency range (250–450 Hz) the ipsilateral side overcomes the contralateral side.
Next we compared the HFDs preceding the DC baseline shift. In each case we could observe narrow fast population spikes in the ipsilateral recordings which then disappeared by the end of the HFD (Fig. 10B). Ipsilaterally the amplitude of the HFD in the low- and high-gamma range rapidly decreased while contralaterally it continued to rise reaching larger amplitudes, then gradually decreased (Fig. 10C). In contrast, at higher frequencies (250–450 Hz) the ipsilateral HFD had more prominent components corresponding to the ipsilateral narrow fast population spikes (comparing ipsilateral and contralateral values in the four frequency bands given as percentage of the contralateral side the values were as follows; for peak amplitudes at: 30–57 Hz: 71.0 ± 9.9%, p < 0.05; 63–119 Hz: 80.4 ± 9.5%, p < 0.05; 121–250 Hz: 85.1 ± 12.6%, p > 0.05; 250–450 Hz: 203.7 ± 33.4%, p < 0.05; for total areas at: 30–57 Hz: 67.3 ± 7.9%, p < 0.05; 63–119 Hz: 75.2 ± 8.3%, p < 0.05; 121–250 Hz: 86.7 ± 10.2%, p > 0.05; 250–450 Hz: 144.3 ± 13.9%, p < 0.05) (Fig. 10C).
Discussion
The hippocampal formation is one of the most sensitive brain areas to cerebrovascular trauma, but to date there are no reliable, reproducible and specific in vivo hippocampal ischemia models. There are also no studies describing the electrical activity in the brain during and immediately following hippocampal ischemia in vivo. Our novel mouse model of photothrombotic ischemia in vivo allowed us to examine its acute neuronal correlates.
The main findings of our study are as follows: (1) vascular landmarks should be used for accurate targeting of deep brain vasculature in mice; (2) unilateral hippocampal ischemia results in a brief bilateral HFD (30–250 Hz), peaking in the low-gamma frequency (30–57 Hz) range; (3) the fast decline, smaller amplitude and the appearance of epileptiform spikes ipsilaterally results in different dynamics and frequency spectra of the HFDs of the two hippocampi; (4) the HFD is followed ipsilaterally by a characteristic extracellular negative field potential shift that might resemble hypoxic terminal depolarization; (5) the HFD is followed ipsilaterally by a step-like long-lasting decrease in the gamma (30–119 Hz) activity; (6) the contralateral hippocampus displays only the HFD without any ensuing and lasting electrical signs.
Oscillatory activity under urethane anesthesia in mice
Urethane, a carcinogenic substance, is favored for acute in vivo electrophysiological experiments because it induces long-lasting steady level of anesthesia with muscle relaxation (Maggi and Meli, 1986a) and minimally affects the autonomic and cardiovascular systems (Maggi and Meli, 1986b; Hara and Harris, 2002; Janssen et al., 2004). Most of our knowledge about the specific neurons involved in various brain oscillations comes from urethane anesthetized rats (Klausberger and Somogyi, 2008). Urethane affects both inhibitory and excitatory systems but the magnitude of the alterations is less than that produced by other more selective anesthetics (Hara and Harris, 2002). Based on these data we have chosen urethane to use in our experiments to preserve the oscillations in the brain, such as theta and gamma rhythms, which are critically dependent on the fine interplay of excitation and inhibition (Buzsáki, 2002; Bartos et al., 2007). It is widely assumed that urethane anesthetized and unanesthetized animals show many similarities in their brain activities. However many laboratories experience low success rates using urethane because breathing problems occur frequently during urethane anesthesia, especially in mice (Moldestad et al., 2009). Tracheotomy can be a solution to the breathing problems (Moldestad et al., 2009), but in our experiments, selecting mice in a narrow weight and age range, individualizing and precisely determining the dose of urethane and the previous anesthesia with a volatile anesthetic eliminated the breathing problems without necessitating a tracheotomy.
TTC staining
Urethane anesthesia is usually restricted to terminal (acute) experiments due to its potential long-term toxicity. This fact necessitates showing the ischemic damage in early stage (∼4 h after ischemia induction). The 2,3,5-triphenyltetrazolium chloride method rests on the functioning of mitochondrial enzymes (Liszczak et al., 1984) and has been used by several groups to mark cerebral infarct area (Bose et al., 1988; Park et al., 1988; Hatfield et al., 1991; Goldlust et al., 1996; Kuroiwa et al., 2009; Popp et al., 2009). An obvious advantage of this method is its easy applicability, suitability for infarct volume evaluation and the immediate availability of results (Bederson et al., 1986; Mathews et al., 2000; Türeyen et al., 2004; Popp et al., 2009). Evidence shows that only a sustained ischemia can result in an early (i.e., 4 h after ischemia onset) reliable TTC stain (Popp et al., 2009), agreement with the fact that irreversible injury to mitochondria in brain cells may not occur until after a long period of ischemia (Rehncrona et al., 1979). In our experiments 4 h after hippocampal ischemia induction the TTC staining clearly showed the extensive unilateral hippocampal damage demonstrating a sustained hippocampal ischemia.
HFD and DC shift during hippocampal ischemia
The HFD generated before the extracellular DC voltage shift in our recordings from the dorsal hippocampal CA1 region is reminiscent of the network activity observed in rat models of global ischemia (Freund et al., 1989). In this four vessel occlusion model, the ischemia induced in the entire forebrain resulted in a rapid reduction of electrical activity in the hippocampus. The cessation of the activity was accompanied by a similar short period high-frequency (25–50 Hz) spindle. High-frequency electrical activity, synaptic noise, and impulse firing precede the DC voltage shift of the spreading depression as observed in cells in the hippocampus and neocortex (Rosenblueth and García Ramos, 1966; Ichijo and Ochs, 1970; Munoz-Martinez, 1970; Higashida et al., 1974; Somjen and Aitken, 1984; Haglund and Schwartzkroin, 1990). Lasting oscillations at high frequencies (200–600 Hz) have been recorded in normal neocortex, but hippocampal “pathological high-frequency oscillations” probably represent field potentials of population spikes from clusters of synchronous pathologically bursting cells (Engel, Jr. et al., 2009).
In our experiments, the HFD was followed by a negative DC shift in the extracellular field potential most likely due to an ischemia-induced collective neuronal depolarization (Balestrino and Somjen, 1986; Sick et al., 1987; Korf et al., 1988; Somjen et al., 1989; Katayama et al., 1992; Lauritzen and Hansen, 1992; Kral et al., 1993; Xie et al., 1995). The observed persistent reduction in the gamma activity and long-duration DC shift resembles the terminal depolarization characteristic of the ischemic core (Higuchi et al., 2002). The fact that in our experimental arrangement the recording electrode and the illumination site (occlusion induction site) are ∼2 mm apart further supports the extensive hippocampal infarction area.
Decreased gamma activity after HFD
Our data show that there is a step-like, large and lasting reduction in the gamma activity after the HFD while the activities in the lower frequency ranges remain preserved. In vivo and in vitro data show increased energy demand during gamma oscillations (Niessing et al., 2005) and that gamma oscillations are highly sensitive to decreases in oxygen tension (Fano et al., 2007; Huchzermeyer et al., 2008; Pietersen et al., 2009). How can we explain the step-like reduction of the gamma activity after the HFD and DC shift complex? The hypoxic spreading depression like depolarization results in the rapid loss of transmembrane ion gradients. Subsequent normalization requires oxidative energy (Hansen and Lauritzen, 1984; Lipton, 1999) however in hypoxic brain tissue mitochondrial enzymes become reduced (Rosenthal and Somjen, 1973; Mayevsky and Chance, 1974; Rex et al., 1999). Fast-spiking interneurons, the pillars of gamma oscillations might be a critical target of alterations in oxygen tension and mitochondrial function (Ackermann et al., 1984; Fuchs et al., 2007).
A cellular substrate of the theta-gamma uncoupling may be the selective impairment of fast inhibition onto hippocampal parvalbumin-containing interneurons. It has been shown that such uncoupling results when GABAergic inhibition is selectively reduced in these cells (Wulff et al., 2009). It remains to be determined whether the function of GABAergic afferents onto the PV cells is the first to be impaired by ipsilateral ischemia.
Changes in the contralateral hippocampus
Our data show that the HFD propagates to the contralateral hippocampus but the characteristic DC voltage shift does not. High-frequency activities originating in one hippocampus often propagate to the contralateral side. Seizures induced by unilateral microinjection of kainic acid into the dorsal hippocampus or the early bursts and nonsynaptic late bursts of epileptiform activities induced by lowering calcium in the CA1 of hippocampus regularly propagate to the contralateral hippocampus (Goto et al., 1994; Feng and Durand, 2005). However, we have found important differences in the frequency spectra of the HFDs of the two hippocampi: in the gamma range contralaterally achieves a larger amplitude then gradually decreases while ipsilaterally a rapid decline follows a smaller peak. In contrast, the appearance of epileptiform spikes in the ipsilateral HFD results in more prominent components above 250 Hz. This is similar to the findings for seizure propagation in the unilateral kainic acid microinjection epilepsy model where the epileptiform spikes in the histologically intact contralateral hippocampus lacked any superimposed high-frequency activity (Meier et al., 2007).
Hypoxic spreading depression like depolarization in the photothrombosis model with cortical ischemic lesions, only occurs on the side of the lesion, not in the contralateral cortex (Schroeter et al., 1995). Occlusion of the middle cerebral artery causes a similar phenomenon in the contralateral cortex too but this is explained by the massive damage secondary to edema-induced compression (Witte et al., 2000). Our data show that the hypoxic terminal depolarization induced by an unilateral hippocampal ischemia spares the contralateral hippocampus.
Conclusions
We have developed the first mouse model of unilateral extensive hippocampal ischemia in vivo which allowed us to investigate the electrophysiological changes during and after the ischemia induction in both hippocampi. We also developed the technique of occluding a deep brain artery in vivo. Our findings demonstrate that the gamma oscillations are highly sensitive to acute ischemic insult and are affected in a long-lasting manner, while the contralateral hippocampus shows only transient changes in oscillatory activity.
Our model can also be adapted to examine the effects of acute ischemia on brain activity in freely moving mice and therefore, the long-term effects of an acute cerebrovascular trauma on brain excitability (e.g., epileptogenesis) providing new therapeutical opportunities to prevent long-term brain disorders.
Footnotes
This research was supported by National Institutes of Health–National Institute of Neurological Disorders and Stroke Grant NS 002808, the CURE Epilepsy Foundation, and the Coelho Endowment to I.M. We thank Maksim Gill for providing the Igor procedure for event detection.
References
- Ackermann RF, Finch DM, Babb TL, Engel J., Jr Increased glucose metabolism during long-duration recurrent inhibition of hippocampal pyramidal cells. J Neurosci. 1984;4:251–264. doi: 10.1523/JNEUROSCI.04-01-00251.1984. [DOI] [PMC free article] [PubMed] [Google Scholar]
- Akai F, Yanagihara T. Identity of the dorsal hippocampal region most vulnerable to cerebral ischemia. Brain Res. 1993;603:87–95. doi: 10.1016/0006-8993(93)91302-9. [DOI] [PubMed] [Google Scholar]
- Balestrino M, Somjen GG. Chlorpromazine protects brain tissue in hypoxia by delaying spreading depression-mediated calcium influx. Brain Res. 1986;385:219–226. doi: 10.1016/0006-8993(86)91067-x. [DOI] [PubMed] [Google Scholar]
- Bartos M, Vida I, Jonas P. Synaptic mechanisms of synchronized gamma oscillations in inhibitory interneuron networks. Nat Rev Neurosci. 2007;8:45–56. doi: 10.1038/nrn2044. [DOI] [PubMed] [Google Scholar]
- Bederson JB, Pitts LH, Germano SM, Nishimura MC, Davis RL, Bartkowski HM. Evaluation of 2,3,5-triphenyltetrazolium chloride as a stain for detection and quantification of experimental cerebral infarction in rats. Stroke. 1986;17:1304–1308. doi: 10.1161/01.str.17.6.1304. [DOI] [PubMed] [Google Scholar]
- Bland BH. The physiology and pharmacology of hippocampal formation theta rhythms. Prog Neurobiol. 1986;26:1–54. doi: 10.1016/0301-0082(86)90019-5. [DOI] [PubMed] [Google Scholar]
- Bose B, Jones SC, Lorig R, Friel HT, Weinstein M, Little JR. Evolving focal cerebral ischemia in cats: spatial correlation of nuclear magnetic resonance imaging, cerebral blood flow, tetrazolium staining, and histopathology. Stroke. 1988;19:28–37. doi: 10.1161/01.str.19.1.28. [DOI] [PubMed] [Google Scholar]
- Bragin A, Jandó G, Nádasdy Z, Hetke J, Wise K, Buzsáki G. Gamma (40–100 Hz) oscillation in the hippocampus of the behaving rat. J Neurosci. 1995;15:47–60. doi: 10.1523/JNEUROSCI.15-01-00047.1995. [DOI] [PMC free article] [PubMed] [Google Scholar]
- Buzsáki G. Hippocampal sharp waves: their origin and significance. Brain Res. 1986;398:242–252. doi: 10.1016/0006-8993(86)91483-6. [DOI] [PubMed] [Google Scholar]
- Buzsáki G. Theta oscillations in the hippocampus. Neuron. 2002;33:325–340. doi: 10.1016/s0896-6273(02)00586-x. [DOI] [PubMed] [Google Scholar]
- Buzsáki G. Rhythms of the brain. New York: Oxford UP; 2006. [Google Scholar]
- Buzsáki G, Leung LW, Vanderwolf CH. Cellular bases of hippocampal EEG in the behaving rat. Brain Res. 1983;287:139–171. doi: 10.1016/0165-0173(83)90037-1. [DOI] [PubMed] [Google Scholar]
- Buzsáki G, Freund TF, Bayardo F, Somogyi P. Ischemia-induced changes in the electrical activity of the hippocampus. Exp Brain Res. 1989;78:268–278. doi: 10.1007/BF00228898. [DOI] [PubMed] [Google Scholar]
- Chan E, Kovacevíc N, Ho SK, Henkelman RM, Henderson JT. Development of a high resolution three-dimensional surgical atlas of the murine head for strains 129S1/SvImJ and C57BL/6J using magnetic resonance imaging and micro-computed tomography. Neuroscience. 2007;144:604–615. doi: 10.1016/j.neuroscience.2006.08.080. [DOI] [PubMed] [Google Scholar]
- Clement EA, Richard A, Thwaites M, Ailon J, Peters S, Dickson CT. Cyclic and sleep-like spontaneous alternations of brain state under urethane anaesthesia. PLoS One. 2008;3:e2004. doi: 10.1371/journal.pone.0002004. [DOI] [PMC free article] [PubMed] [Google Scholar]
- Dorr A, Sled JG, Kabani N. Three-dimensional cerebral vasculature of the CBA mouse brain: a magnetic resonance imaging and micro computed tomography study. Neuroimage. 2007;35:1409–1423. doi: 10.1016/j.neuroimage.2006.12.040. [DOI] [PubMed] [Google Scholar]
- Engel J, Jr, Bragin A, Staba R, Mody I. High-frequency oscillations: what is normal and what is not? Epilepsia. 2009;50:598–604. doi: 10.1111/j.1528-1167.2008.01917.x. [DOI] [PubMed] [Google Scholar]
- Fano S, Behrens CJ, Heinemann U. Hypoxia suppresses kainate-induced gamma-oscillations in rat hippocampal slices. Neuroreport. 2007;18:1827–1831. doi: 10.1097/WNR.0b013e3282f13e4f. [DOI] [PubMed] [Google Scholar]
- Feng Z, Durand DM. Propagation of low calcium non-synaptic induced epileptiform activity to the contralateral hippocampus in vivo. Brain Res. 2005;1055:25–35. doi: 10.1016/j.brainres.2005.06.076. [DOI] [PubMed] [Google Scholar]
- Freund TF, Buzsáki G, Prohaska OJ, Leon A, Somogyi P. Simultaneous recording of local electrical activity, partial oxygen tension and temperature in the rat hippocampus with a chamber-type microelectrode. Effects of anaesthesia, ischemia and epilepsy. Neuroscience. 1989;28:539–549. doi: 10.1016/0306-4522(89)90003-1. [DOI] [PubMed] [Google Scholar]
- Fuchs EC, Zivkovic AR, Cunningham MO, Middleton S, Lebeau FE, Bannerman DM, Rozov A, Whittington MA, Traub RD, Rawlins JN, Monyer H. Recruitment of parvalbumin-positive interneurons determines hippocampal function and associated behavior. Neuron. 2007;53:591–604. doi: 10.1016/j.neuron.2007.01.031. [DOI] [PubMed] [Google Scholar]
- Fujioka M, Nishio K, Miyamoto S, Hiramatsu KI, Sakaki T, Okuchi K, Taoka T, Fujioka S. Hippocampal damage in the human brain after cardiac arrest. Cerebrovasc Dis. 2000;10:2–7. doi: 10.1159/000016018. [DOI] [PubMed] [Google Scholar]
- Glykys J, Mody I. The main source of ambient GABA responsible for tonic inhibition in the mouse hippocampus. J Physiol. 2007;582:1163–1178. doi: 10.1113/jphysiol.2007.134460. [DOI] [PMC free article] [PubMed] [Google Scholar]
- Goldlust EJ, Paczynski RP, He YY, Hsu CY, Goldberg MP. Automated measurement of infarct size with scanned images of triphenyltetrazolium chloride-stained rat brains. Stroke. 1996;27:1657–1662. doi: 10.1161/01.str.27.9.1657. [DOI] [PubMed] [Google Scholar]
- Goto Y, Araki T, Kato M, Fukui M. Propagation of hippocampal seizure activity arising from the hippocampus: a local cerebral blood flow study. Brain Res. 1994;634:203–213. doi: 10.1016/0006-8993(94)91923-2. [DOI] [PubMed] [Google Scholar]
- Haglund MM, Schwartzkroin PA. Role of Na-K pump potassium regulation and IPSPs in seizures and spreading depression in immature rabbit hippocampal slices. J Neurophysiol. 1990;63:225–239. doi: 10.1152/jn.1990.63.2.225. [DOI] [PubMed] [Google Scholar]
- Hansen AJ, Lauritzen M. The role of spreading depression in acute brain disorders. An Acad Bras Cienc. 1984;56:457–479. [PubMed] [Google Scholar]
- Hara K, Harris RA. The anesthetic mechanism of urethane: the effects on neurotransmitter-gated ion channels. Anesth Analg. 2002;94:313–318. doi: 10.1097/00000539-200202000-00015. [DOI] [PubMed] [Google Scholar]
- Hatfield RH, Mendelow AD, Perry RH, Alvarez LM, Modha P. Triphenyltetrazolium chloride (TTC) as a marker for ischaemic changes in rat brain following permanent middle cerebral artery occlusion. Neuropathol Appl Neurobiol. 1991;17:61–67. doi: 10.1111/j.1365-2990.1991.tb00694.x. [DOI] [PubMed] [Google Scholar]
- Higashida H, Mitarai G, Watanabe S. A comparative study of membrane potential changes in neurons and neuroglial cells during spreading depression in the rabbit. Brain Res. 1974;65:411–425. doi: 10.1016/0006-8993(74)90232-7. [DOI] [PubMed] [Google Scholar]
- Higuchi T, Takeda Y, Hashimoto M, Nagano O, Hirakawa M. Dynamic changes in cortical NADH fluorescence and direct current potential in rat focal ischemia: relationship between propagation of recurrent depolarization and growth of the ischemic core. J Cereb Blood Flow Metab. 2002;22:71–79. doi: 10.1097/00004647-200201000-00009. [DOI] [PubMed] [Google Scholar]
- Huchzermeyer C, Albus K, Gabriel HJ, Otáhal J, Taubenberger N, Heinemann U, Kovács R, Kann O. Gamma oscillations and spontaneous network activity in the hippocampus are highly sensitive to decreases in pO2 and concomitant changes in mitochondrial redox state. J Neurosci. 2008;28:1153–1162. doi: 10.1523/JNEUROSCI.4105-07.2008. [DOI] [PMC free article] [PubMed] [Google Scholar]
- Ichijo M, Ochs S. Spreading depression of negative wave of direct cortical response and pyramidal tract responses. Brain Res. 1970;23:41–56. doi: 10.1016/0006-8993(70)90348-3. [DOI] [PubMed] [Google Scholar]
- Janssen BJ, De Celle T, Debets JJ, Brouns AE, Callahan MF, Smith TL. Effects of anesthetics on systemic hemodynamics in mice. Am J Physiol Heart Circ Physiol. 2004;287:H1618–H1624. doi: 10.1152/ajpheart.01192.2003. [DOI] [PubMed] [Google Scholar]
- Katayama Y, Tamura T, Becker DP, Tsubokawa T. Early cellular swelling during cerebral ischemia in vivo is mediated by excitatory amino acids released from nerve terminals. Brain Res. 1992;577:121–126. doi: 10.1016/0006-8993(92)90544-j. [DOI] [PubMed] [Google Scholar]
- Klausberger T, Somogyi P. Neuronal diversity and temporal dynamics: the unity of hippocampal circuit operations. Science. 2008;321:53–57. doi: 10.1126/science.1149381. [DOI] [PMC free article] [PubMed] [Google Scholar]
- Korf J, Klein HC, Venema K, Postema F. Increases in striatal and hippocampal impedance and extracellular levels of amino acids by cardiac arrest in freely moving rats. J Neurochem. 1988;50:1087–1096. doi: 10.1111/j.1471-4159.1988.tb10577.x. [DOI] [PubMed] [Google Scholar]
- Kral T, Luhmann HJ, Mittmann T, Heinemann U. Role of NMDA receptors and voltage-activated calcium channels in an in vitro model of cerebral ischemia. Brain Res. 1993;612:278–288. doi: 10.1016/0006-8993(93)91673-g. [DOI] [PubMed] [Google Scholar]
- Kuroiwa T, Xi G, Hua Y, Nagaraja TN, Fenstermacher JD, Keep RF. Development of a rat model of photothrombotic ischemia and infarction within the caudoputamen. Stroke. 2009;40:248–253. doi: 10.1161/STROKEAHA.108.527853. [DOI] [PMC free article] [PubMed] [Google Scholar]
- Lauritzen M, Hansen AJ. The effect of glutamate receptor blockade on anoxic depolarization and cortical spreading depression. J Cereb Blood Flow Metab. 1992;12:223–229. doi: 10.1038/jcbfm.1992.32. [DOI] [PubMed] [Google Scholar]
- Lipton P. Ischemic cell death in brain neurons. Physiol Rev. 1999;79:1431–1568. doi: 10.1152/physrev.1999.79.4.1431. [DOI] [PubMed] [Google Scholar]
- Liszczak TM, Hedley-Whyte ET, Adams JF, Han DH, Kolluri VS, Vacanti FX, Heros RC, Zervas NT. Limitations of tetrazolium salts in delineating infarcted brain. Acta Neuropathol. 1984;65:150–157. doi: 10.1007/BF00690469. [DOI] [PubMed] [Google Scholar]
- Maggi CA, Meli A. Suitability of urethane anesthesia for physiopharmacological investigations in various systems. Part 1: General considerations. Experientia. 1986a;42:109–114. doi: 10.1007/BF01952426. [DOI] [PubMed] [Google Scholar]
- Maggi CA, Meli A. Suitability of urethane anesthesia for physiopharmacological investigations in various systems. Part 2: Cardiovascular system. Experientia. 1986b;42:292–297. doi: 10.1007/BF01942510. [DOI] [PubMed] [Google Scholar]
- Mathews KS, McLaughlin DP, Ziabari LH, Toner CC, Street PC, Hisgrove E, Bezzina EL, Stamford JA. Rapid quantification of ischaemic injury and cerebroprotection in brain slices using densitometric assessment of 2,3,5-triphenyltetrazolium chloride staining. J Neurosci Methods. 2000;102:43–51. doi: 10.1016/s0165-0270(00)00277-6. [DOI] [PubMed] [Google Scholar]
- Mayevsky A, Chance B. Repetitive patterns of metabolic changes during cortical spreading depression of the awake rat. Brain Res. 1974;65:529–533. doi: 10.1016/0006-8993(74)90243-1. [DOI] [PubMed] [Google Scholar]
- Meier R, Häussler U, Aertsen A, Deransart C, Depaulis A, Egert U. Short-term changes in bilateral hippocampal coherence precede epileptiform events. Neuroimage. 2007;38:138–149. doi: 10.1016/j.neuroimage.2007.07.016. [DOI] [PubMed] [Google Scholar]
- Moldestad O, Karlsen P, Molden S, Storm JF. Tracheotomy improves experiment success rate in mice during urethane anesthesia and stereotaxic surgery. J Neurosci Methods. 2009;176:57–62. doi: 10.1016/j.jneumeth.2008.08.015. [DOI] [PubMed] [Google Scholar]
- Muñoz-Martínez EJ. Facilitation of cortical cell activity during spreading depression. J Neurobiol. 1970;2:47–60. doi: 10.1002/neu.480020105. [DOI] [PubMed] [Google Scholar]
- Niessing J, Ebisch B, Schmidt KE, Niessing M, Singer W, Galuske RA. Hemodynamic signals correlate tightly with synchronized gamma oscillations. Science. 2005;309:948–951. doi: 10.1126/science.1110948. [DOI] [PubMed] [Google Scholar]
- Ordy JM, Wengenack TM, Bialobok P, Coleman PD, Rodier P, Baggs RB, Dunlap WP, Kates B. Selective vulnerability and early progression of hippocampal CA1 pyramidal cell degeneration and GFAP-positive astrocyte reactivity in the rat four-vessel occlusion model of transient global ischemia. Exp Neurol. 1993;119:128–139. doi: 10.1006/exnr.1993.1014. [DOI] [PubMed] [Google Scholar]
- Park CK, Mendelow AD, Graham DI, McCulloch J, Teasdale GM. Correlation of triphenyltetrazolium chloride perfusion staining with conventional neurohistology in the detection of early brain ischaemia. Neuropathol Appl Neurobiol. 1988;14:289–298. doi: 10.1111/j.1365-2990.1988.tb00889.x. [DOI] [PubMed] [Google Scholar]
- Pietersen AN, Lancaster DM, Patel N, Hamilton JB, Vreugdenhil M. Modulation of gamma oscillations by endogenous adenosine through A1 and A2A receptors in the mouse hippocampus. Neuropharmacology. 2009;56:481–492. doi: 10.1016/j.neuropharm.2008.10.001. [DOI] [PubMed] [Google Scholar]
- Popp A, Jaenisch N, Witte OW, Frahm C. Identification of ischemic regions in a rat model of stroke. PLoS One. 2009;4:e4764. doi: 10.1371/journal.pone.0004764. [DOI] [PMC free article] [PubMed] [Google Scholar]
- Rehncrona S, Mela L, Siesjö BK. Recovery of brain mitochondrial function in the rat after complete and incomplete cerebral ischemia. Stroke. 1979;10:437–446. doi: 10.1161/01.str.10.4.437. [DOI] [PubMed] [Google Scholar]
- Rex A, Pfeifer L, Fink F, Fink H. Cortical NADH during pharmacological manipulations of the respiratory chain and spreading depression in vivo. J Neurosci Res. 1999;57:359–370. [PubMed] [Google Scholar]
- Rosenblueth A, García Ramos J. Some phenomena usually associated with spreading depression. Acta Physiol Lat Am. 1966;16:141–179. [PubMed] [Google Scholar]
- Rosenthal M, Somjen G. Spreading depression, sustained potential shifts, and metabolic activity of cerebral cortex of cats. J Neurophysiol. 1973;36:739–749. doi: 10.1152/jn.1973.36.4.739. [DOI] [PubMed] [Google Scholar]
- Schmidt-Kastner R, Freund TF. Selective vulnerability of the hippocampus in brain ischemia. Neuroscience. 1991;40:599–636. doi: 10.1016/0306-4522(91)90001-5. [DOI] [PubMed] [Google Scholar]
- Schroeter M, Schiene K, Kraemer M, Hagemann G, Weigel H, Eysel UT, Witte OW, Stoll G. Astroglial responses in photochemically induced focal ischemia of the rat cortex. Exp Brain Res. 1995;106:1–6. doi: 10.1007/BF00241351. [DOI] [PubMed] [Google Scholar]
- Sick TJ, Solow EL, Roberts EL., Jr Extracellular potassium ion activity and electrophysiology in the hippocampal slice: paradoxical recovery of synaptic transmission during anoxia. Brain Res. 1987;418:227–234. doi: 10.1016/0006-8993(87)90090-4. [DOI] [PubMed] [Google Scholar]
- Silva VM, Corson N, Elder A, Oberdörster G. The rat ear vein model for investigating in vivo thrombogenicity of ultrafine particles (UFP) Toxicol Sci. 2005;85:983–989. doi: 10.1093/toxsci/kfi142. [DOI] [PubMed] [Google Scholar]
- Soltesz I, Deschênes M. Low- and high-frequency membrane potential oscillations during theta activity in CA1 and CA3 pyramidal neurons of the rat hippocampus under ketamine-xylazine anesthesia. J Neurophysiol. 1993;70:97–116. doi: 10.1152/jn.1993.70.1.97. [DOI] [PubMed] [Google Scholar]
- Somjen GG, Aitken PG. The ionic and metabolic responses associated with neuronal depression of Leao's type in cerebral cortex and in hippocampal formation. An Acad Bras Cienc. 1984;56:495–504. [PubMed] [Google Scholar]
- Somjen GG, Aitken PG, Balestrino M, Crain BJ, Czéh G, Kawasaki K, Nadler JV, Neill KH, Urbán L. Extracellular ions, hypoxic irreversible loss of function and delayed postischemic neuron degeneration studied in vitro. Acta Physiol Scand Suppl. 1989;582:58. [PubMed] [Google Scholar]
- Sugawara T, Lewén A, Noshita N, Gasche Y, Chan PH. Effects of global ischemia duration on neuronal, astroglial, oligodendroglial, and microglial reactions in the vulnerable hippocampal CA1 subregion in rats. J Neurotrauma. 2002;19:85–98. doi: 10.1089/089771502753460268. [DOI] [PubMed] [Google Scholar]
- Suzuki SS, Smith GK. Spontaneous EEG spikes in the normal hippocampus. I. Behavioral correlates, laminar profiles and bilateral synchrony. Electroencephalogr Clin Neurophysiol. 1987;67:348–359. doi: 10.1016/0013-4694(87)90123-4. [DOI] [PubMed] [Google Scholar]
- Türeyen K, Vemuganti R, Sailor KA, Dempsey RJ. Infarct volume quantification in mouse focal cerebral ischemia: a comparison of triphenyltetrazolium chloride and cresyl violet staining techniques. J Neurosci Methods. 2004;139:203–207. doi: 10.1016/j.jneumeth.2004.04.029. [DOI] [PubMed] [Google Scholar]
- Vanderwolf CH, Kolb B, Cooley RK. Behavior of the rat after removal of the neocortex and hippocampal formation. J Comp Physiol Psychol. 1978;92:156–175. doi: 10.1037/h0077447. [DOI] [PubMed] [Google Scholar]
- Verhaegen MJ, Todd MM, Warner DS, James B, Weeks JB. The role of electrode size on the incidence of spreading depression and on cortical cerebral blood flow as measured by H2 clearance. J Cereb Blood Flow Metab. 1992;12:230–237. doi: 10.1038/jcbfm.1992.33. [DOI] [PubMed] [Google Scholar]
- Watson BD, Dietrich WD, Busto R, Wachtel MS, Ginsberg MD. Induction of reproducible brain infarction by photochemically initiated thrombosis. Ann Neurol. 1985;17:497–504. doi: 10.1002/ana.410170513. [DOI] [PubMed] [Google Scholar]
- Williams GR, Jiang JG, Matchar DB, Samsa GP. Incidence and occurrence of total (first-ever and recurrent) stroke. Stroke. 1999;30:2523–2528. doi: 10.1161/01.str.30.12.2523. [DOI] [PubMed] [Google Scholar]
- Witte OW, Bidmon HJ, Schiene K, Redecker C, Hagemann G. Functional differentiation of multiple perilesional zones after focal cerebral ischemia. J Cereb Blood Flow Metab. 2000;20:1149–1165. doi: 10.1097/00004647-200008000-00001. [DOI] [PubMed] [Google Scholar]
- Wulff P, Ponomarenko AA, Bartos M, Korotkova TM, Fuchs EC, Bähner F, Both M, Tort AB, Kopell NJ, Wisden W, Monyer H. Hippocampal theta rhythm and its coupling with gamma oscillations require fast inhibition onto parvalbumin-positive interneurons. Proc Natl Acad Sci U S A. 2009;106:3561–3566. doi: 10.1073/pnas.0813176106. [DOI] [PMC free article] [PubMed] [Google Scholar]
- Xie Y, Zacharias E, Hoff P, Tegtmeier F. Ion channel involvement in anoxic depolarization induced by cardiac arrest in rat brain. J Cereb Blood Flow Metab. 1995;15:587–594. doi: 10.1038/jcbfm.1995.72. [DOI] [PubMed] [Google Scholar]
- Ylinen A, Bragin A, Nádasdy Z, Jandó G, Szabó I, Sik A, Buzsáki G. Sharp wave-associated high-frequency oscillation (200 Hz) in the intact hippocampus: network and intracellular mechanisms. J Neurosci. 1995;15:30–46. doi: 10.1523/JNEUROSCI.15-01-00030.1995. [DOI] [PMC free article] [PubMed] [Google Scholar]


