

Abstract
Heparan sulfate proteoglycans are cell surface and secretory proteins that modulate intercellular signaling pathways including Slit/Robo and FGF/FGFR. The heparan sulfate sugar moieties on HSPGs are subject to extensive postsynthetic modification, generating enormous molecular complexity that has been postulated to provide increased diversity in the ability of individual cells to respond to specific signaling molecules. This diversity could help explain how a relatively small number of axon guidance molecules are able to instruct the extremely complex connectivity of the mammalian brain. Consistent with this hypothesis, we previously showed that mutant mice lacking the heparan sulfotransferases (Hsts) Hs2st or Hs6st1 display major axon guidance defects at the developing optic chiasm. Here we further explore the role of these Hsts at the optic chiasm and investigate their function in corpus callosum development. Each Hst is expressed in a distinct pattern and each mutant displays a specific spectrum of axon guidance defects. Particular Hs2st−/− and Hs6st1−/− phenotypes closely match those of Slit1−/− and Slit2−/− embryos respectively, suggesting possible functional relationships. To test functional interactions between Hs2st or Hs6st1 and Slits we examined optic chiasm and corpus callosum phenotypes in a panel of genotypes where Hs2st or Hs6st1 and Slit1 or Slit2 function were simultaneously reduced or absent. We find examples of Hs2st and Hs6st1 having epistatic, synergistic, and antagonistic genetic relationships with Slit1 and/or Slit2 depending on the context. At the corpus callosum we find that Hs6st1 has Slit-independent functions and our data indicate additional roles in FGF signaling.
Introduction
The mammalian brain is composed of an enormous number of neurons forming appropriate synaptic connections to enable sensory perception and cognitive processing power. Most axon tracts connecting the different brain regions are initiated during embryonic development. The optic pathway and corpus callosum are two axonal pathways which distribute information between the left and right sides of the brain. The corpus callosum comprises axons crossing the midline to interconnect the left and right cerebral hemispheres (Lindwall et al., 2007). The optic pathway comprises retinal ganglion cell (RGC) axons exiting the retina to form the optic nerve before being sorted at the optic chiasm and entering the brain (Erskine and Herrera, 2007). Both have been subject to intensive study so provide good model systems to investigate the function of novel axon guidance molecules.
Heparan sulfate proteoglycans (HSPGs) are secreted and membrane associated proteins attached to unbranched glycosaminoglycan heparan sulfate (HS) molecules (Esko and Selleck, 2002; Kirn-Safran et al., 2009). HSPGs are cofactors in the cellular response to secreted proteins, including Slits and FGFs (supplemental Fig. 1A, available at www.jneurosci.org as supplemental material), involved in the development of axon pathways so HS could play a pivotal coordinating role (Dickson, 2002; Inatani et al., 2003; Johnson et al., 2004; Kantor et al., 2004; Lee and Chien, 2004; Lin, 2004; Hussain et al., 2006; Sánchez-Camacho and Bovolenta, 2009). HS is critically important for corpus callosum and optic chiasm development as both develop abnormally when HS biosynthesis is blocked in the developing mouse embryonic brain (Inatani et al., 2003). An intriguing feature of HS is its enormous potential for structural diversity, produced by an array of HS modifying enzymes including the heparan sulfotransferases Hs2st and Hs6st1 (supplemental Fig. 1B, available at www.jneurosci.org as supplemental material). While it remains conceivable that HS simply provides a nonspecifically permissive environment for the formation of commissural axon tracts, a more interesting possibility is that the rich variation in HS structure generated by the action of HS modifying enzymes is exploited to generate functional diversity in a range of physiological processes including axon navigation (Turnbull et al., 2001; Bülow and Hobert, 2004; Holt and Dickson, 2005; Kreuger et al., 2006).
The axon guidance molecules Slit1 and Slit2 and their receptors Robo1 and Robo2 have context-specific roles in guiding RGC axons through the optic chiasm and callosal axons across the telencephalic midline (Erskine et al., 2000; Bagri et al., 2002; Plump et al., 2002; Shu et al., 2003b; Andrews et al., 2006; Thompson et al., 2006; López-Bendito et al., 2007; Plachez et al., 2008). We showed previously that Hs6st1−/− RGCs are less sensitive to Slit2's chemorepellant activity than wild type RGCs and that defects seen in the optic chiasms of Hs2st−/− and Hs6st1−/− embryos are similar to those seen in Slit;Robo mutants (Pratt et al., 2006). Specifically, Hs6st1−/−, Slit1−/−;Slit2−/−, and Robo2−/− embryos all have increased inter-retinal innervation while Hs2st−/−, Slit1−/−, Slit1−/−;Slit2−/−, and Robo2−/− embryos all show ectopic wandering of axons along the midline (Plump et al., 2002; Pratt et al., 2006; Plachez et al., 2008).
Here we extend our optic chiasm analysis and show that Hs2st−/− and Hs6st1−/− embryos have distinct cellular and axon guidance defects in the developing corpus callosum. We demonstrate the importance of Hs2st and Hs6st1 in a number of axon navigation events in these systems and identify context-specific roles in Slit/Robo and FGF/FGFR signaling.
Materials and Methods
Animals.
The Hs2stLacZ (Hs2st−) mutant allele was obtained by insertion of a LacZ gene trap vector into the Hs2st locus (Bullock et al., 1998) and the Hs6st1LacZ-ires-hPLAP (Hs6st1−) mutant allele by insertion of a LacZ-ires-hPLAP gene trap vector into intron 1 of the Hs6st1 locus (Leighton et al., 2001; Mitchell et al., 2001). The Hs2st allele and the Hs6st1 allele were maintained on a pigmented CBA background. Embryos used in this study were a mixture of genders and were not sexed. Hs2st animals and embryos were genotyped by multiplex PCR using primers 5′-TACTCAGTGCAGTGCAGTCA-3′, 5′-GGGAAGAAATTCACCCCAACA-3′ and 5′-ATCAATGAATAATTGCCTAGGTC-3′: Wild type allele, ∼150bp; mutant allele, ∼400bp. Hs6st1 animals were genotyped by multiplex PCR using primers 5′-ATGGTGACTGTGACCCACAA-3′, 5′-GGGATATAGGGGACCTTGGA-3′, 5′-ACAGCTGCCAGGATCCTAAA-3′ and 5′-CCCACCTTGGCTGTAGTCAT-3′: Wild-type allele; ∼200bp; mutant allele, ∼600bp. Slit1 and Slit2 mutant alleles were produced by homologous recombination to delete coding sequences (Plump et al., 2002). Slit1 animals were genotyped by multiplex PCR using primers 5′-ACCCTTAGCTTCTACCAACC-3′, 5′-TCTCCTTTGATCTGAGACCG-3′ and 5′-AGGTTTCTCGAGCGTCATAG-3′: Wild-type allele, 544bp; mutant allele, 393bp. Slit2 animals were genotyped by multiplex PCR using primers 5′-AAGACCTGTCGCTTCTGTCAG-3′, 5′-AAACAGGTTTCTACCGCACG-3′, and 5′-AAGTCTAGTAGAGTCGAGCG-3′: Wild-type allele ∼600bp, mutant allele ∼350bp. Slit1 and Slit2 mutant alleles were maintained on a pigmented C57BL6 background.
Tract tracing.
E15.5 embryo heads or E18.5 dissected brains were fixed at 4°C in 4% paraformaldehyde in PBS overnight and DiA and/or DiI crystals (Molecular probes) were packed into either (1) the optic cup of one eye after removal of the lens to label RGC axons entering or leaving the retina or (2) in a rostro-caudal line along the cerebral cortex to label as many corpus callosum axons as possible. Heads were returned to 4% paraformaldehyde in PBS in the dark at room temperature for 6 weeks for retinal injections or 37°C for 2 weeks for cortical injections to allow tracers to diffuse along axons. The brains were sectioned (200 μm) with a vibratome, cleared in 9:1 glycerol:PBS, mounted in Vectashield (Vector Laboratories), and images acquired using an epifluorescence microscope and digital camera (Leica Microsystems, Germany) or a TCS NT confocal microscope (Leica Microsystems, Germany). For quantification of RGC projections the total number of DiI labeled RGCs were counted in serial vibratome sections using an epifluorescent microscope as previously described (Pratt et al., 2006). For semiquantitative analysis presented in Tables 1 and 2 and Figure 8, serial vibratome sections were examined and each phenotype was scored, blind to genotype, as described in Results.
Table 1.
Optic chiasm phenotype of axons labeled by DiI injection into the retina at E15.5. (incidence/number of embryos scored)
| Genotype | Preoptic area wandering | Ventral midline wandering | Telencephalic wandering |
|---|---|---|---|
| Wild-type | − (6/6) | − (6/6) | − (6/6) |
| Hs2st−/− | ++ (4/4) | + (4/4) | − (4/4) |
| Hs6st1−/− | − (4/4) | − (4/4) | − (4/4) |
| Slit1−/− | − (3/3) | + (3/3) | − (3/3) |
| Slit2−/− | − (7/7) | − (7/7) | − (7/7) |
| Slit1−/−;Slit2+/− | − (3/3) | +(3/3) | ++ (3/3) |
| Slit1−/−;Slit2−/− | ++ (3/3) | ++ (3/3) | ++ (3/3) |
| Hs2st−/−;Slit1−/− | ++ (6/6) | + (6/6) | − (6/6) |
| Hs6st1−/−;Slit2−/− | ++ (5/5) | ++ (5/5) | ++ (5/5) |
Summary of optic chiasm axon phenotypes in wild-type and Hs2st, Hs6st1, Slit1, and Slit2 genotypes revealed by DiI injection into the retina at E15.5. For each phenotype each embryo was scored blind to genotype according to the following relativistic criteria: −, no phenotype; +, intermediate phenotype; ++, severe phenotype. Examples of the intermediate and severe ventral midline wandering phenotypes are shown in Figures 2B,E,H and 3E,H,K (black arrows), respectively. The severe preoptic area wandering and telencephalic wandering phenotypes are illustrated in Figures 2E,H and 3B,K, respectively.
Table 2.
Corpus callosum phenotype of axons labeled by DiI injection into the cerebral cortex at E18.5 (incidence/number of embryos scored)
| Genotype | Severity of midline crossing defect | Axon whorls flanking midline | Septal axons ventral to the corpus callosum |
|---|---|---|---|
| Wild-type | − (5/5) | − (5/5) | − (5/5) |
| Hs2st−/− | − (4/8), ++ (4/8) | ++ (5/8), − (3/8) | − (4/4) |
| Hs6st1−/− | ++ (6/6) | ++ (6/6) | + (4/6), − (2/6) |
| Slit2−/− | + (3/3) | ++ (6/6) | ++ (3/3) |
| Slit2−/−;Hs6st1−/− | + (3/4), ++ (1/4) | ++ (6/6) | ++ (4/4) |
| Slit1−/− | − (3/3) | − (3/3) | − (3/3) |
| Slit2−/−;Slit1−/− | + (2/2) | ++ (2/2) | ++ (2/2) |
Summary of corpus callosum axon phenotypes in wild-type and Hs2st, Hs6st1, Slit1, and Slit2 complete loss of function genotypes revealed by DiI injection into the cerebral cortex at E18.5. Severity of midline crossing defect: −, large numbers of callosal axons crossing the midline indistuinguishable from wild types; +, diminished crossing (Fig 9A–D); ++, absolutely no crossing (Fig 5C,F,I). Probst-like axon whorls flanking the midline were scored as follows: −, absent; ++, present (Fig 5C,F,I). Septal axon phenotypes were as follows: −, no phenotype compared with wild type; +, intermediate phenotype (Fig 5C,F,I), ++, severe phenotype (Fig 9A–C,E).
Figure 8.
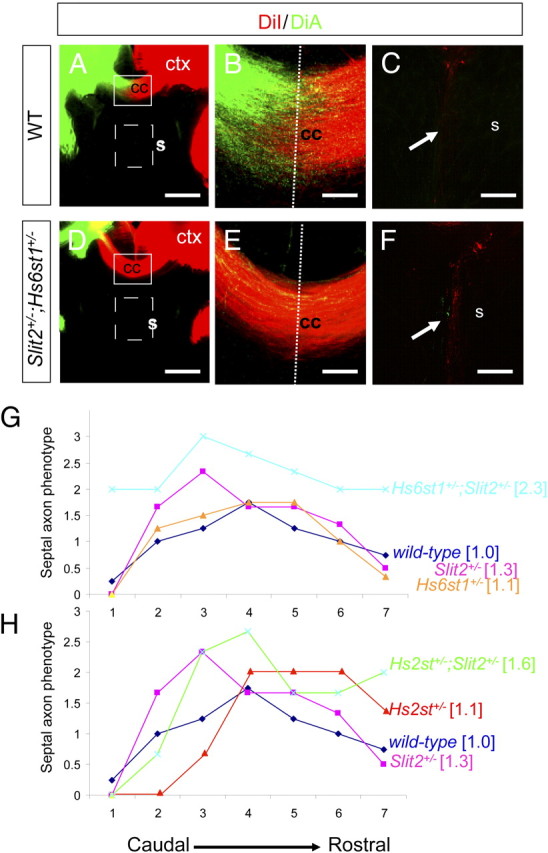
Hs6st1 and Slit2 act in synergy to keep cortical axons out of the septum. A–F, Axon labeling following DiI and DiA injection into opposite cerebral cortices (ctx) of wild-type (A–C) and Hs6st1+/−;Slit2+/− (D–F) compound heterozygote E18.5 embryos. The overall structure of the corpus callosum is not affected (compare A to D), with large numbers of axons crossing the midline in both genotypes (compare B to E). C, F, Higher magnifications of the septal area demarcated by dotted box in A and D, showing more septal axons (white arrows) in Hs6st1+/−;Slit2+/− embryos (F) compared with wild-type. G, H, A semiquantitative analysis the of Slit2+/−, Hs2st+/−, and Hs6st1+/− heterozygous and Hs6st1+/−;Slit2+/− Hs2st+/−;Slit2+/− compound heterozygous septal axon phenotypes. Consecutive sections though the corpus callosum region of each embryo were each scored blind to genotype according the following criteria: 0, no axons; 1, <10 axons; 2, >10 axons; 3, too many axons to count (∼100 or more axons). Graphs show means of septal phenotype scores for each genotype plotted against their postion on the rostro-caudal axis (1, most caudal to 7, most rostral). Numbers in square brackets are averages across all sections for each genotype. G, Hs6st1+/−;Slit2+/− embryos (pale blue) consistently scores higher than all other genotypes indicating a synergistic genetic interaction between Hs6st1 and Slit2 in preventing axons from transiting between the cerebral cortex and the septum. H, There is no clear difference between Hs2st+/−;Slit2+/− embryos and other genotypes providing no evidence of genetic interaction. Numbers of embryos scored: wild-type and Hs6st1+/−, n = 4; all other genotypes, n = 3. All sections coronal with dorsal at the top. Scale bars, 200 μm.
In situ hybridization.
E14.5 embryonic heads were fixed overnight in 4% PFA/PBS pH 9.5 at 4°C. In situ hybridization for Slit1, Slit2, Robo1, Robo2, and Sprouty2 were performed on 100 μm vibratome sections using digitoxigenin labeled antisense riboprobes as previously described (Erskine et al., 2000).
Quantitative reverse transcription-PCR (QRT-PCR): cDNA synthesis.
RNA was extracted from E14.5 retina, chiasm, or the corticoseptal boundary region tissue using Qiagen RNAeasy micro kit (Qiagen) according to the manufacturer's instructions. First strand cDNA synthesis was performed using oligo (dT)15 primers (Promega) with the Qiagen Sensiscript Reverse Transcriptase kit (Qiagen) according to the manufacturer's instructions. qRT-PCR was performed on cDNA using the following primer pairs: Robo1 5′-GCCACTTCCATGCCTCTCAG-3′, 5′-GTGCCTTGGACTGGACAGTG-3′; Robo2 5′-GCAGAAGTAAACCGGACGAA-3′, 5′-CTCCAAGATTGCAGGCTCTC-3′; Slit1, 5′-TCACTGACCTGCAGAACTGG-3′, 5′-ACCATCTGGTCGAAGGTGAC-3′; Slit2, 5′-CCTGCCAGATGATCAAGTGC-3′, 5′-GCTGCTTCTGGTAATAGTCC-3′, Sprouty2 (5′-CGATCACGGAGTTCAGATG-3′ & 5′-ACTGTCATGGGCTGTCTGC-3′, and GAPDH (5′-GGGTGTGAACCACGAGAAAT-3′ and 5′-CCTTCCACAATGCCAAAGTT-3′. Quantitative RT-PCR was performed using Qiagen Quantitect SYBR Green PCR Kit (Qiagen) and a DNA Engine Opticon Continuous Fluorescence Detector (GRI, UK). The abundance of each transcript in the original RNA sample was extrapolated from PCR kinetics using Opticon software.
Histochemistry.
E15.5 and E16.5 embryonic heads or E18.5 dissected brains were fixed overnight at 4°C in 0.2% gluteraldehyde, 100 mm MgCl2 in phosphate buffered saline (PBS). For human placental alkaline phosphatase (hplap) staining, heads were heated at 70°C for 3 h to inactivate endogenous alkaline phosphatase before sectioning. Tissue was embedded in agar and sectioned (200 μm) using a vibratome. For LacZ histochemistry sections were rinsed several times in wash buffer (2 mm MgCl2, 0.02% NP40, 0.01% sodium deoxycholate in PBS) and incubated in LacZ stain (wash buffer supplemented with 5 mm potassium ferricyanide, 5 mm potassium ferrocyanide and 1 mg/ml X-gal). For hplap histochemistry sections were rinsed several times in 2 mm MgCl2 in PBS and incubated in 0.38 mg/ml NBT/ 0.18 mg/ml BCIP (Roche) in NTM buffer (100 mm Tris, 100 mm Nacl, 50 mm MgCl2) at 37°C. Once the staining reaction was complete sections were postfixed in 2% gluteraldehyde. Thick sections were mounted in 90% glycerol.
Immunohistochemistry and immunofluorescence.
Embryonic heads were placed in 4% PFA/PBS overnight at 4°C and 100 μm thin sections cut using a vibratome. For L1/GFAP immunohistochemistry, sections were permeabilized for 15 min at room temperature in permeabilization solution (PBS/1% Triton X-100). Sections were then blocked using blocking solution (PBS/0.5% Triton X-100 + 10% goat serum) for 60 min at room temp. Rat anti L1 primary antibody (Millipore Bioscience Research Reagents, MAB5272) (1:1000 dilution in blocking solution) and/or rabbit anti GFAP antibody (Dako) (1:1000 dilution in blocking buffer) was added to the sections and then stored overnight at room temperature with shaking. Sections were washed several times in PBS and then Alexa 568 goat anti rat secondary antibody (Invitrogen) (1:200 dilution in blocking solution), Alexa 488 goat anti rabbit secondary antibody (Invitrogen) (1:200 dilution). The sections were washed several times in PBS and sections were mounted in Vectashield hard set (Vector Laboratories).
Results
Hs2st and Hs6st1 functions in optic chiasm development
Our previous findings suggest the hypothesis that Hs2st and Hs6st1 function in the Robo/Slit signaling pathway in the developing optic chiasm. To investigate this possibility we first re-examined aspects of chiasm development in the two Hst mutants and Slit mutants to allow a more systematic comparison of the phenotypes.
Ectopic retinal innervation in Slit2−/− embryos
Inter-retinal innervation involves RGC axons growing from one eye into the other. Hs6st1−/− embryos have increased inter-retinal innervation compared with Hs2st−/− or wild-type embryos (Pratt et al., 2006). The extent of ectopic inter-retinal innervation in Slit1−/− and Slit2−/− single mutants has not yet been reported. We therefore compared the numbers of RGCs retrogradely labeled by DiI injection in the contralateral eye of wild-type (Fig. 1A), Slit1−/− (Fig. 1B), and Slit2−/− (Fig. 1C,D) embryos at E15.5. This revealed that the extent of inter-retinal innervation in Slit2−/− embryos was greater than that seen in wild-type and Slit1−/− embryos. Quantification of contralaterally projecting RGCs (Fig. 1G) revealed that levels of inter-retinal innervation in Slit1+/− and Slit1−/− embryos were no different to those seen in wild-types while Slit2+/− heterozygotes and Slit2−/− homozygotes showed a threefold and tenfold increase respectively over wild-types. The similar magnitude of inter-retinal innervation in Slit2−/− and Hs6st1−/− embryos (compare bars 6, 8 in Fig. 1G) suggests a possible shared function for Slit2 and Hs6st1 in this context.
Figure 1.
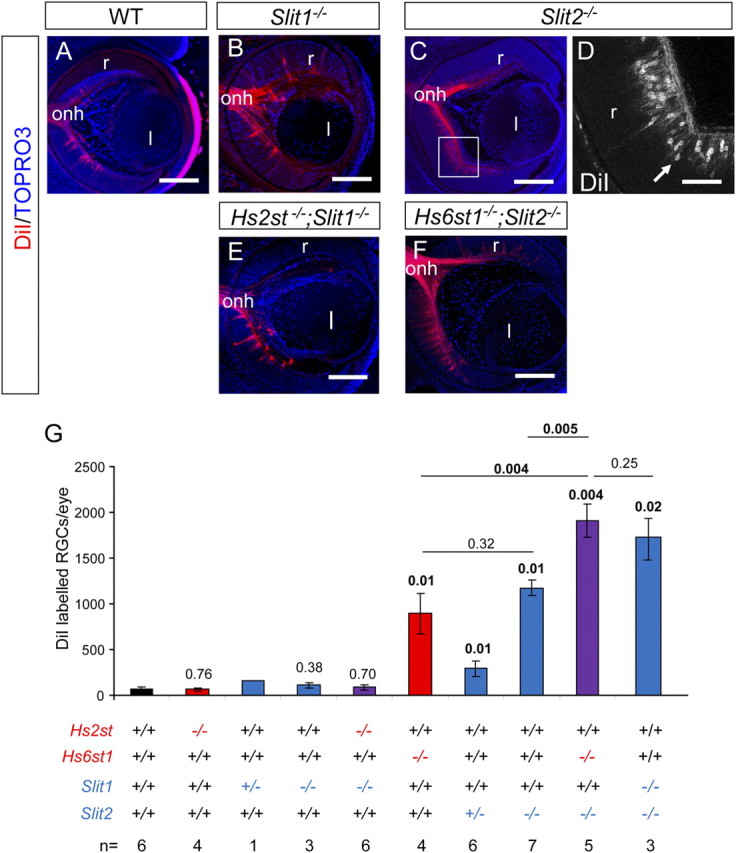
Slit and Hst;Slit double mutant inter-retinal innervation phenotypes at E15.5. A–F, DiI labeling of RGCs projecting to the contralateral retina in wild-type (A), Slit1−/− (B), Slit2−/− (C, D), Hs2st−/−;Slit1−/− (E), and Hs6st1−/−;Slit2−/− (F) embryos. Although RGCs project to the contralateral retina in all genotypes, more are retrogradely labeled in Slit2−/− (C) (D is a magnification of box in C showing retrogradely labeled RGC bodies) and Hs6st1−/−;Slit2−/− embryos (F). G, Quantification of numbers of RGCs retrogradely labeled by DiI injection into the contralateral retina in wild-type, Hs2st−/−, Slit1+/−, Slit1−/−, Hs2st−/−;Slit1−/−, Hs6st1−/−, Slit2+/−, Slit2−/−, and Hs6st1−/−;Slit2−/− embryos. Hs6st1−/− (sixth bar), Slit2+/− (seventh bar), Slit2−/− (eighth bar), Hs6st1−/−;Slit2−/− (ninth bar), and Slit1−/−;Slit2−/− (10th bar) values are significantly greater than wild-type. Slit2−/− and Hs6st1−/− values are not significantly different from each other, both are significantly different from the Hs6st1−/−;Slit2−/− genotype, and there is no significant difference between Hs6st1−/−;Slit2−/− and Slit1−/−;Slit2−/− genotype. Kruskal–Wallis one-way ANOVA on ranks between all groups p < 0.001. p Values for statistically significant differences (p < 0.05) are in bold. Numbers above bars indicate p values for pairwise comparison of ranks for each genotype to wild-type using Dunn's method. p Values for pairwise comparisons between other genotypes are shown above horizontal lines bracketing the genotypes. Error bars are ±SEM. Numbers of embryos of each genotype analyzed are indicated at the very bottom. l, Lens; r, retina; onh, optic nerve head. All sections horizontal with caudal at top. Scale bars: A–C, E–F, 200 μm; D, 100 μm.
Ectopic RGC axon growth into the Hs2st−/− preoptic area
During normal development RGC axons in the optic nerves converge at the ventral midline posterior to the preoptic area to form the optic chiasm. The combined activities of Slit1 and Slit2 are needed to prevent the optic nerve from invading the preoptic area as Slit1−/−;Slit2−/− and Slit1+/−;Slit2−/− double mutant embryos have an ectopic anterior branch of the optic nerve which crosses the midline at the preoptic area to generate an ectopic chiasm while Slit1−/− and Slit2−/− single mutant embryos do not (Plump et al., 2002) (compare phenotype summaries in Fig. 11D–F). Unilateral DiI labeling of RGC axons in E15.5 Hs2st−/− embryos (Fig. 2B,E,H) revealed an axon bundle branching off the optic nerve and crossing the midline anterior to the main X-shaped optic chiasm (Fig. 2E,H, green arrows) which is absent in wild-type (Fig. 2A,D,G) and Hs6st1−/− (Fig. 2C,F,I) embryos. Neurofilament staining of axons in thin sections shows ectopic axons in the preoptic area in Hs2st−/− (Fig. 2K,N, green arrows) but not wild-type (Fig. 2J,M) or Hs6st1−/− (Fig. 2L,O) embryos. The phenotypes are summarized in Figure 2P–R. Thus, Hs2st activity is required to prevent RGC axons from invading the preoptic area. The similarity between Hs2st−/− single mutant and Slit1−/−; Slit2−/− double mutant preoptic area phenotypes suggests that Hs2st has a possible shared function with both Slit1 and Slit2 in this context.
Figure 11.
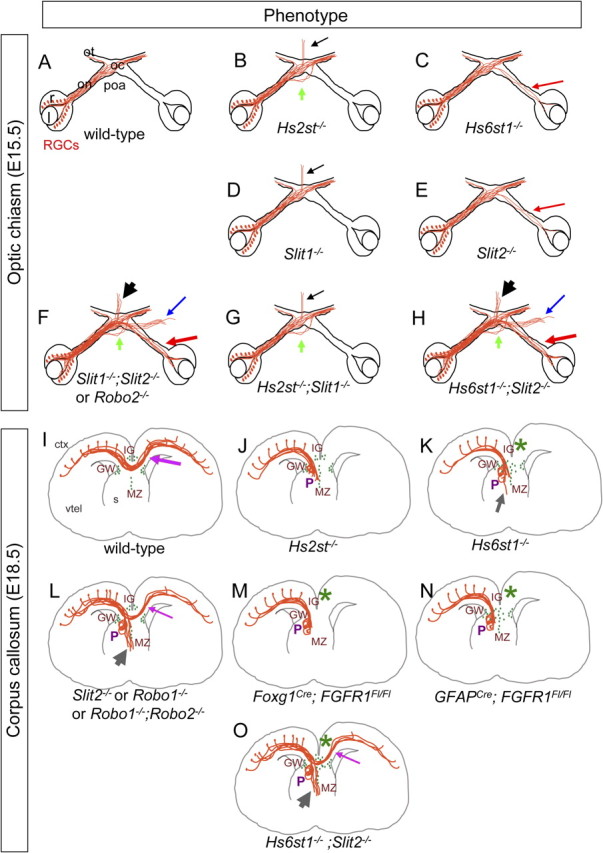
Summary and comparison of optic chiasm and corpus callosum phenotypes. A–H, The optic chiasm. Diagrams show RGC axons navigating through the optic chiasm in the genotypes indicated at E15.5. Phenotypes: green arrow, ectopic growth though the poa; black arrow, midline wandering; red arrow, growth into the opposite eye; blue arrow, ectopic tract growing over the ventral telencephalon. A, Wild-type. B–E, Hst and Slit single mutant phenotypes (data in Figs. 1, 3) (Plump et al., 2002; Pratt et al., 2006). F, Slit1−/−;Slit2−/− diagram based on data from Plump et al. (2002), Thompson et al. (2006), and Plachez et al. (2008). G, H, Hst and Slit double mutant phenotypes (data in Figs. 2, 3). I–N, The corpus callosum. Diagrams show axons navigating through the corpus callosum and the distribution of GFAP-expressing glia (green ovals) in the GW, IG, and MZ in the genotypes indicated at E18.5. Phenotypes: gray arrow, ectopic growth into the septum; P, Probst-like knotted axons; *, severe midline glial defect; purple arrow, callosal axons crossing the midline. I, Wild-type. J, K, Hst single mutants (data in Figs. 5, 6). L–M, Slit/Robo and FGFR mutants. L, Slit2−/−, Robo1−/−, and Robo1−/−;Robo2−/− (Bagri et al., 2002; Andrews et al., 2006; López-Bendito et al., 2007). Foxg1Cre;FGFR1Fl/Fl conditional knockout of FGFR1 throughout the developing telencephalon using Foxg1Cre in which midline glia are absent (Tole et al., 2006) (M) and GFAPCre;FGFR1Fl/Fl is a more restricted conditional knockout of FGFR1 in glia using GFAPCre where glial distribution is disrupted (Smith et al., 2006) (N). O, Hs6st1−/−;Slit2−/− embryos in which callosal axons are able to cross the midline, in contrast to the Hs6st1−/− phenotype (compare with K) where axons do not cross, and despite a major midline glial disorganization phenotype. r, Retina; l, lens; on, optic nerve; oc, optic chiasm; ot, optic tract; poa, preoptic area; ctx, cerebral cortex; vtel, ventral telencephalon; s, septum; P, Probst-like knotted axons.
Figure 2.
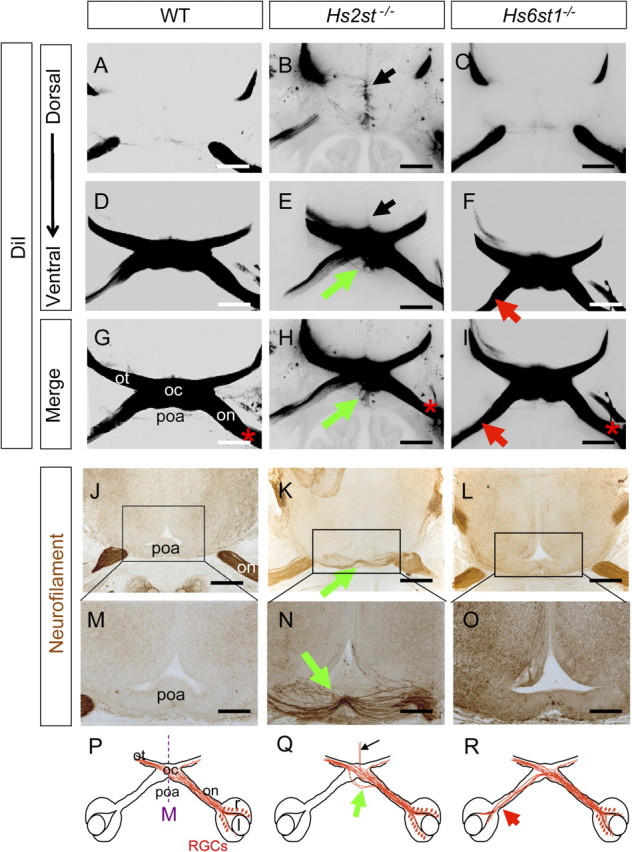
Ectopic retinal ganglion cell axon growth through the preoptic area in Hs2st−/− embryos. A–F, DiI injection into the retina labeling RGC axons at the optic chiasm in E15.5 embryos. DiI images are presented as grayscale negatives for clarity. B, E, Hs2st−/− embryos RGC axons escape the normal chiasm region and grow ectopically across the preoptic area (E, green arrow) as well as dorsally up the midline (B, black arrow). This ectopic axon growth does not occur in wild-type (A, D) or Hs6st1−/− (C, F) embryos. G–I, Merges of A and D (G), B and E (H), and C and F (I), with * marking side of DiI application. J–O, RGC axons stained brown using neurofilament immunohistochemistry. J–O, E15.5. Wild-type embryo (J, M), Hs2st−/− embryo (K, N), Hs6st1−/− embryo (L, O). An ectopic branch of the optic nerve enters the preoptic area in Hs2st−/− embryos (K, N, green arrows) which is absent in the other genotypes. P–R, Diagrams summarizing RGC axon navigation at the chiasm of wild-type, Hs2st−/−, and Hs6st1−/− embryos; green arrows, preoptic area tract; black arrows, midline wandering; red arrow (R), increased inter-retinal innervation previously described (Pratt et al., 2006). on, Optic nerve; oc, optic chiasm; ot, optic tract; r, retina; l, lens; poa, preoptic area; M, midline. All sections horizontal with caudal at top. Scale bars: A–L, 500 μm; M–O, 250 μm.
Genetic interactions between Hst and Slit functions at the optic chiasm
The new findings presented here, in combination with the previously published data, are consistent with a model in which Hs2st and Hs6st1 have unique functions in optic chiasm formation. Our observations that both Hs2st and Slit1 act to prevent ectopic midline wandering (described previously by Pratt et al., 2006) (summarized in Fig. 11B,D, black arrows) and both Hs6st1 and Slit2 act to prevent ectopic inter-retinal innervation (Fig. 1C,D,G) (summarized in Fig. 11C,E, red arrows) suggest the hypotheses that (1) Hs2st and Slit1 act together in the same signaling pathway to prevent ectopic midline wandering and (2) Hs6st1 and Slit2 act together in the same signaling pathway to prevent ectopic axon navigation into the opposite eye. Alternatively, the phenocopies could simply be coincidental, for example Hs6st1 and Slit2 might have completely independent functions in suppressing inter-retinal innervation. To distinguish between these possibilities we generated Hs2st−/−;Slit1−/− and Hs6st1−/−;Slit2−/− double mutant embryos. If Hs2st/Slit1 or Hs6st1/Slit2 do indeed act exclusively in the same signaling pathway to regulate a particular process (for example preventing axons navigating into the opposite eye) then the particular aspect of a phenotype (for example increased inter-retinal innervation) in the double mutant will be no more severe than that of either single mutant. Conversely, a more severe phenotype indicates that they act independently of one another. Any additional phenotypes not seen in either single mutant would indicate functional redundancy where loss of either gene can be compensated by the activity of the other, such that the phenotype only appears when both genes are absent. We concentrated on four optic chiasm phenotypes associated with Hst and/or Slit/Robo function (Plump et al., 2002; Pratt et al., 2006; Thompson et al., 2006; Plachez et al., 2008): (1) inter-retinal innervation (Fig 3, red arrows); (2) ectopic midline wandering (Fig. 3, black arrows); (3) ectopic growth into the preoptic area (Fig. 3, green arrows); and (4) ectopic growth over the ventral telencephalon (Fig. 3, blue arrows). Wild-type (Figs. 1A,G, 3C,F,I,L), Hs2st−/−; Slit1−/− (Figs. 1E,G, 3A,D,G,J,M), and Hs6st1−/−;Slit2−/− (Figs. 1F,G, 3B,E,H,K,N) phenotypes are summarized in Figure 3O-Q. Note that while it is straightforward to precisely quantify the magnitude of inter-retinal innervation (by counting retrogradely labeled RGCs) it is not possible to count the numbers of ectopic axons growing down the midline or over the preoptic area or telencephalon. The ectopic tracts were therefore scored blind to genotype on the basis of relative severity judged by careful examination of serial sections from several DiI labeled embryos of each genotype following the approach previously described for Slit mutant chiasm phenotypes (Plump et al., 2002). This semiquantitative analysis is presented in Table 1.
Figure 3.
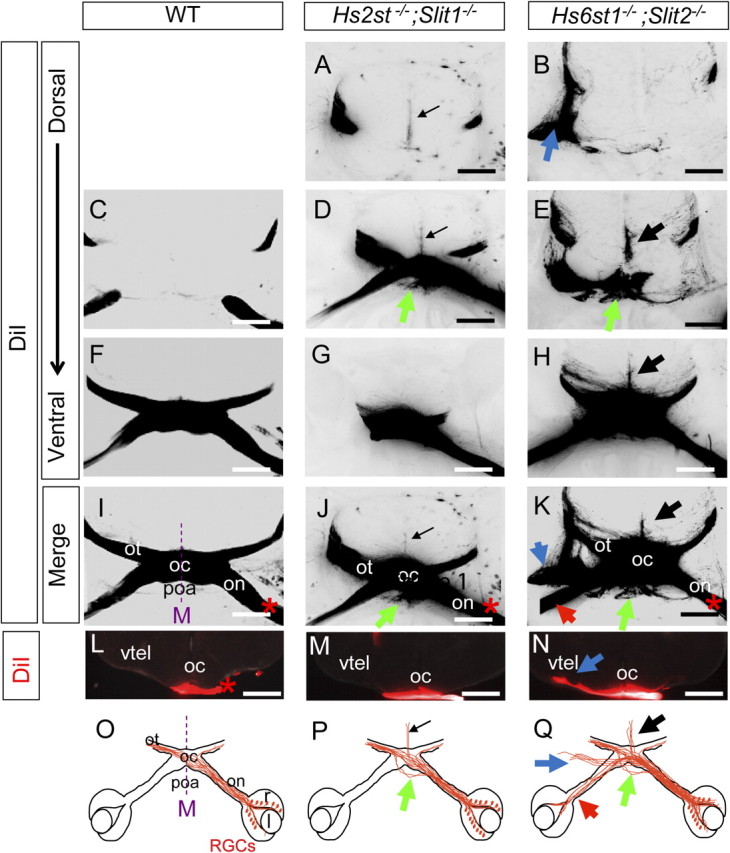
Hst;Slit double mutant optic chiasm phenotypes at E15.5. A–H, Consecutive horizontal sections following unilateral DiI injection into the retina labeling RGC axons at the optic chiasm in E15.5 embryos. DiI images are presented as grayscale negatives for clarity. A–H, Wild-type (C, F), Hs2st−/−;Slit1−/− (A, D, G), and Hs6st1−/−;Slit2−/− (B, E, H) embryos. Hs2st−/−; Slit1−/− embryos exhibit ectopic RGC axon growth dorsally and caudally (A, D, black arrows) up the midline as well as ectopic growth into the preoptic area (D, green arrow). B, E, H, Hs6st1−/−;Slit2−/− embryos exhibit ectopic dorsal and caudal growth up the midline (E, H, black arrows), ectopic growth into the preoptic area (E, green arrow) and an ectopic tract growing laterally from the optic chiasm (B, blue arrow). I–K, Merges of C and F (I); A, D, and G (J); and B, E, and H (K), with * marking side of DiI application. L—N, Coronal sections through the optic chiasm following unilateral DiI labeling of the retina. N, Hs6st1−/−;Slit2−/− embryos an ectopic axon tract grows over the surface of the ventral telencephalon (blue arrow), which is not seen in wild-type (L) or Hs2st−/−;Slit1−/− (M) embryos. O–Q, Diagrams summarizing the phenotypes; green arrows, preoptic area tract; black arrows, midline wandering; red arrows, increased inter-retinal innervation. on, Optic nerve; oc, optic chiasm; ot, optic tract; r, retina; l, lens; poa, preoptic area; M, midline. Scale bars, 500 μm.
Single mutant Hs2st−/− or Slit1−/− embryos do not show increased inter-retinal innervation compared with wild-types (Fig. 1B,G) (Pratt et al., 2006, their Fig. 4) and neither do Hs2st−/−;Slit1−/− double mutant embryos (Fig. 1E,G). While Hs6st1−/− and Slit2−/− embryos both have an 8–10-fold increase in inter-retinal innervation compared with wild-types (Fig. 1C,D,G) (Pratt et al., 2006, their Fig. 4), Hs6st1−/−;Slit2−/− embryos have an even greater increase of ∼17-fold (Fig. 1F,G) which is not significantly different to that of Slit1−/−; Slit2−/− embryos (Fig. 1F, compare bars 9, 10) which have previously been reported to have the greatest inter-retinal innnervation of all the Slit1;Slit2 single and compound mutants (Plump et al., 2002).
Figure 4.

Expression of Slit1, Slit2, Robo1, and Robo2 mRNA in the retina and optic chiasm of wild-type, Hs2st−/−, and Hs6st1−/− embryos at E14.5. A–P, Slit1 (A–D), Slit2 (E–H), Robo1 (I–L), Robo2 (M–P) . A–C, E–G, I–K, M–O, In situ hybridization on horizontal sections. D, H, L, P, qRT-PCR on RNA extracted from optic chiasm (D, H) or eye (L, P) with mRNA levels normalized to GAPDH. For each transcript, normalized mRNA levels were compared between genotypes using Kruskal–Wallis one-way ANOVA on ranks. In situ hybridization showed indistinguishable expression patterns of Robo1/2 and Slit1/2 mRNAs between genotypes in the retina and at the optic chiasm. qRT-PCR did not reveal any significant differences in the levels of Robo and Slit mRNAs between wild-type, Hs2st−/−, or Hs6st1−/− embryos except for Slit1 mRNA which was significantly reduced at the optic chiasm of Hs6st1−/− embryos (D). r, Retina; oc, optic chiasm; poa, preoptic area; l, lens. All sections horizontal with caudal at top. Scale bars: A–G, 500 μm; I–O, 250 μm.
Ectopic midline wandering involves RGC axons escaping from the optic chiasm and growing in a dorsocaudal direction at the thalamic midline (Plump et al., 2002; Pratt et al., 2006) Hs2st−/−;Slit1−/− double mutant optic chiasms have ectopic midline wandering similar to the Hs2st−/− and Slit1−/− single mutants (Table 1; compare midline wandering indicated by black arrows in Hs2st−/−;Slit1−/− in Fig. 3A,D,J with Hs2st−/− in Fig. 2B,H and by Pratt et al., 2006, their Fig. 3). Hs6st1−/−;Slit2−/− double mutant optic chiasms exhibit a midline wandering phenotype (Fig. 3E,H,K, black arrows) which is interesting as neither Hs6st1−/− nor Slit2−/− single mutant embryos have a midline wandering phenotype (Plump et al., 2002; Pratt et al., 2006). In fact the Hs6st1−/−;Slit2−/− midline wandering phenotype is more severe than seen in Hs2st−/−;Slit1−/− mutants and is comparable to that of Slit1−/−;Slit2−/− embryos in which Slit1 and Slit2 function are both lost (supplemental Fig. 2, available at www.jneurosci.org as supplemental material) (Table 1).
Hs2st−/−;Slit1−/− double mutant embryos have ectopic RGC axon navigation into the preoptic area which is not noticeably more severe than the single mutant Hs2st−/− phenotype (Table 1; compare preoptic area growth indicated by green arrows in Hs2st−/−;Slit1−/− embryos in Fig. 3D,J with Hs2st−/− embryos in Fig. 2E,H). Hs6st1−/−;Slit2−/− double mutant optic chiasms have growth into the preoptic area which is not seen in either Hs6st1−/− or Slit2−/− single mutant embryos (compare robust preoptic area growth indicated by green arrows in Hs6st1−/−;Slit2−/− embryos in Fig. 3E,K with the lack of phenotype in Hs6st1−/− embryos in Fig. 2C,F,I and lack of phenotype described in Slit2−/− embryos by Plump et al., 2002, their Fig. 4).
Ectopic growth over the ventral telencephalon involves a bundle of axons branching off the optic tract and growing over the ventral surface of the telencephalon instead of proceeding dorsally over the thalamus. Interestingly, in contrast to the other optic chiasm phenotypes, this tract is far more pronounced in Slit1−/−;Slit2+/− embryos than in Slit1−/−;Slit2−/− embryos indicating that its formation is exquisitely sensitive to Slit1/2 dosage and is assisted by retention of some Slit1 function (Thompson et al., 2006). Ectopic growth over the ventral telencephalon is not seen at all in wild-types (Fig. 3C,F,I,L) (Thompson et al., 2006), single mutant Hs2st−/− (Fig. 2B,E,H) or double mutant Hs2st−/−;Slit1−/− embryos (Fig. 3A,D,G,J,M). While neither Hs6st1−/− or Slit2−/− single mutant embryos exhibit this phenotype (Fig. 2C,F,I) (Thompson et al., 2006), an ectopic bundle does branch off the contralateral optic tract and grow over the surface of the telencephalon in Hs6st1−/−;Slit2−/− double mutant embryos (compare Hs6st1−/−;Slit2−/− in Fig. 3B,K,N with ectopic tract indicated by blue arrows with Hs6st1−/− in Fig. 2C,F,I and in Slit1−/−;Slit2+/− and Slit1−/−;Slit2−/− embryos in supplemental Fig. 2, available at www.jneurosci.org as supplemental material). These comparisons are summarized in Table 1 and Figure 11.
What can we deduce from these Hst/Slit mutant phenotypes? Loss of Slit2 function in addition to Hs6st1 function in the Hs6st1−/−;Slit2−/− double mutant experiment results in increased severity of all optic chiasm phenotypes examined compared with the single mutants (Table 1; compare phenotype summaries in Fig. 11H with C,E). The severity of inter-retinal innervation in Hs6st1−/−;Slit2−/− double mutant embryos is greater than in Hs6st1−/− or Slit2−/− single mutant embryos and preoptic area innervation, midline wandering, and ectopic growth over the ventral telencephalon phenotypes not present in the single mutants at all emerged in the double mutant. Together this shows that Hs6st1 functions in optic chiasm development independent of Slit2. The strongest candidate for the additional factor is Slit1 based on the close overlap between the Hs6st1−/−;Slit2−/− double mutant phenotype and the phenotype of embryos in which Slit1 and Slit2 function are simultaneously reduced or abolished [Table 1; compare phenotype summaries in Fig. 11H with F based on data in Figs. 1, 3 and supplemental Fig. 2 (available at www.jneurosci.org as supplemental material) and by Plump et al. (2002), Thompson et al. (2006), and Plachez et al. (2008)]. The double mutant Hs2st−/−;Slit1−/− experiment shows that loss of Slit1 function in addition to loss of Hs2st function does not drastically increase the severity of any of the optic chiasm phenotypes compared with Hs2st−/− single mutant embryos (Table 1; compare phenotype summaries in Fig. 11G with B,D) consistent with Hs2st and Slit1 acting in the same signaling pathway to prevent midline wandering. We were unable to count numbers of axons growing up the midline using this semiquantitative analysis and so we cannot formally exclude the possibility that Hs2st and Slit1 have some independent functions here as they clearly do in the preoptic area where Hs2st cannot act exclusively through Slit1 to prevent preoptic area innervation as Slit1−/− embryos lack this phenotype (Plump et al., 2002) (see Fig. 11D). As the preoptic area phenotype occurs in Slit1−/−;Slit2−/− embryos [Table 1; see Fig. 11F; supplemental Fig. 2 (available at www.jneurosci.org as supplemental material) (Plump et al., 2002)], it is likely that in this context Hs2st functions simultaneously with Slit1 and Slit2.
Expression of Robo1&2 and Slit1&2 in Hs2st−/− and Hs6st1−/− retina and chiasm
During normal development of the optic chiasm, RGC axons are kept confined to the highly characteristic X-shaped pathway by the repulsive activities of Slit1 and Slit2, mediated through Robo2 receptors on the navigating axons (Plump et al., 2002; Plachez et al., 2008; Thompson et al., 2009). The similarities between the phenotypes of Hst mutants and Slit/Robo mutants at the optic chiasm could be due to differential sulfation of HSPGs affecting the biochemistry of Slit/Robo signaling or from effects on gene expression, for example reduced expression of Robo receptors on RGC axons or their Slit ligands at the optic chiasm in Hs2st−/− and Hs6st1−/− embryos. To look for evidence of any such changes in levels or patterns of gene expression in Hs2st−/− and Hs6st1−/− embryos, we examined expression of Robo1 and Robo2 in the retina and Slit1 and Slit2 at the optic chiasm using both in situ hybridization and qRT-PCR. Although Robo1 is not thought to play a role in normal RGC axon navigation at the optic chiasm (Plachez et al., 2008) we included Robo1 in the analysis as changes in its expression level in mutant embryos might have functional consequences. We analyzed E14.5 embryos, the stage at which retinal axons are navigating the optic chiasm and make abnormal decisions in Hs2st−/− and Hs6st1−/− embryos (Pratt et al., 2006).
Using in situ hybridization we found no differences in the distribution of Slit1 (Fig. 4A–C) or Slit2 (Fig. 4E–G) transcripts at the optic chiasm or in the distribution of Robo1 (Fig. 4I–K) or Robo2 (Fig. 4M–O) transcripts in the retinas of either Hs2st−/− or Hs6st1−/− embryos compared with wild types (Fig. 4A,E,I,M) (Erskine et al., 2000) at E14.5.
Using qRT-PCR to assess transcript levels we found that while Slit1 is not altered at the Hs2st−/− optic chiasm there was a twofold reduction in Slit1 at the Hs6st1−/− optic chiasm (Fig. 4D). Slit2 transcript levels were not significantly affected at the optic chiasm of Hs2st−/− or Hs6st1−/− embryos (Fig. 4H). Neither Robo1 nor Robo2 transcript levels were significantly altered in the retinas of Hs2st−/− or Hs6st1−/− embryos compared with wild-types (Fig. 4L,P). There is no evidence to support the hypothesis that the Hs2st−/− or Hs6st1−/− optic chiasm phenotypes are a consequence of reduced expression of Robo1, Robo2, or Slit2 as we found no significant change in their expression in either genotype. While Slit1 levels are not significantly altered in the Hs2st−/− optic chiasm they are reduced at the chiasm of Hs6st1−/− embryos. This is unlikely to be a cause of the Hs6st1−/− inter-retinal innervation phenotype as there is no increase in inter-retinal innervation in Slit1−/− mutants (Fig. 1B,G) but it could contribute to the phenotype of Hs6st1−/−;Slit2−/− embryos where our genetic experiments identified a likely loss of Slit1 function.
Hs2st and Hs6st1 functions in corpus callosum development
To investigate whether Hs2st and Hs6st1 are required for Slit/Robo-mediated axon guidance at sites other than the optic chiasm, we examined formation of the corpus callosum in the Hst mutants. The corpus callosum is a commissural tract containing axons that form reciprocal connections between neurons in layers 2,3 and 5 of the cerebral hemispheres (Silver et al., 1982; Katz et al., 1983; Silver and Ogawa, 1983). Cerebral cortical axons navigate medially toward the midline through the intermediate zone with the first callosal axons crossing the midline at E16.5 and more axons crossing during subsequent embryonic development and for the first few postnatal days. The midline crossing point is a structure formed by the fusion of the cerebral hemispheres just above the septum which, by E18.5, is surrounded by populations of neurons and glia in the indusium griseum (IG), glial wedge (GW), midline zipper (MZ), and subcallosal sling (SCS) (Lindwall et al., 2007; Paul et al., 2007).
Differential requirement for Hs2st and Hs6st1 in midline axon navigation at the corpus callosum
Using carbocyanine dye tract tracing to assess formation of the corpus callosum in Hs2st−/− and Hs6st1−/− embryos at E18.5, we found distinct defects in each mutant. At this stage in wild-type embryos cortical axons have crossed the telencephalic midline above the septum to form a smooth U-shaped tract (Fig. 5A,D,G) with axon crossing observed in 5/5 embryos examined. In Hs2st−/− embryos (Fig. 5B,E,H), axons frequently failed to cross the telencephalic midline at all (4/8 embryos) and formed abnormal knotted structures resembling Probst bundles on either side of the midline (5/8 embryos). In some cases we were unable to detect any gross axon guidance defects (3/8 embryos), indicating that this phenotype is partially penetrant. In all of the Hs6st1−/− embryos, callosal axons failed to cross the midline and formed abnormal knotted Probst bundle-like structures on either side of the midline (Fig. 5C,F,I) (6/6 embryos). We also frequently saw ectopic growth of axons ventrally into the septum (4/6 embryos) (Fig. 5C,F,G) which was not apparent in wild-type or Hs2st−/− embryos. These corpus callosum axon navigation phenotypes are summarized in Figure 5J–L. In conclusion, Hs2st and Hs6st1 are each critical for the normal projection of axons across the corpus callosum and differences in their loss of function phenotypes suggest that each has a different function in the normal development of the corpus callosum.
Figure 5.
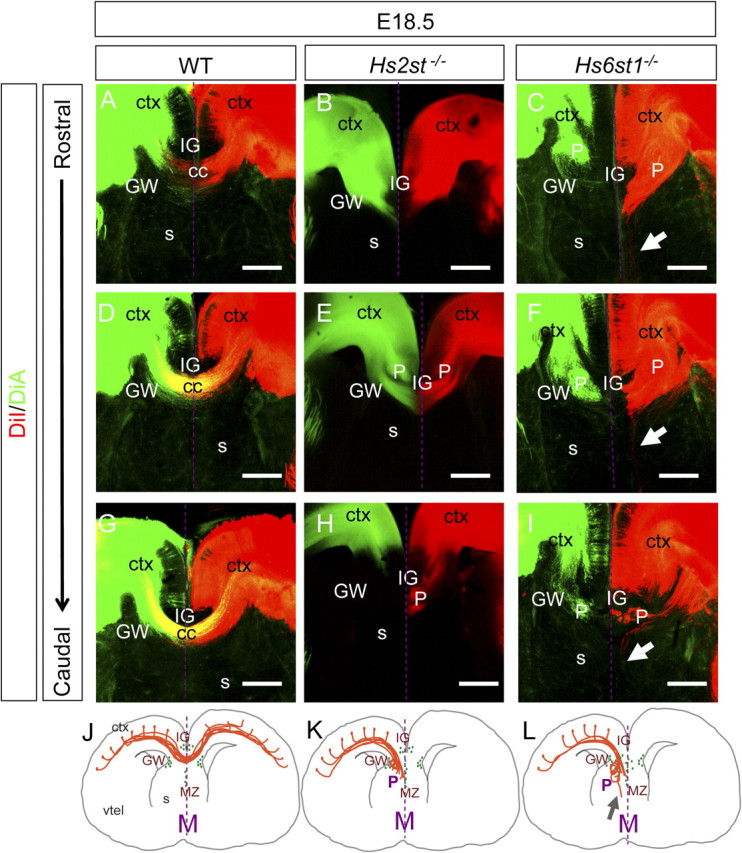
Hs2st−/− and Hs6st1−/− corpus callosum axon navigation phenotypes. A–I, Callosal axons were labeled by injecting DiI (red) and DiA (green) into the cerebral cortices of E18.5 mouse brains. A, D, G, In wild-type embryos, callosal axons cross the midline and form the characteristic “U” shape of the corpus callosum. At E18.5, a large number of callosal axons cross the midline along the rostral to caudal axis. Similar DiI/DiA injections in Hs2st−/− (B, E, H) and Hs6st1−/− (C, F, I) embryos reveal distinct corpus callosum axon navigation phenotypes. B, E, H, In Hs2st−/− embryos large knotted Probst-like axon bundles develop on either side of the midline and the callosal axons completely fail to cross the midline. C, F, I, In Hs6st1−/− embryos large knotted Probst-like axon bundles develop on either side of the midline and the callosal axons completely fail to cross the midline. More axons grow ectopically into the septum (white arrows) than in other genotypes. J–L, Schematic representations of corpus callosum phenotypes observed in wild-type (J), Hs2st−/− (K), and Hs6st1−/− (L) embryos. P, Probst-like knotted axons; gray arrow, sepatal axons; purple arrow, callosal axons crossing the midline. GFAP-expressing glia (see Fig. 6) are represented by green ovals. ctx, Cerebral cortex; cc, corpus callsoum; s, septum; P, knotted Probst-like axon bundle; s, septum; M, midline; vtel, ventral telencephalon. All sections coronal with dorsal at top. Scale bars, 200 μm.
Development of telencephalic midline neuronal structures in Hs2st−/− and Hs6st1−/− embryos
Neurons at the telencephalic midline function in guiding callosal projections by contributing to the SCS and can be visualized by staining for the transcription factor Tbr1 (Niquille et al., 2009). In addition to marking postmitotic neurons in the SCS, Tbr1 also labels postmitotic neurons in the IG (Piper et al., 2009).
At E16.5 we were unable to detect any differences in Tbr1 staining between wild-type (Fig. 6A), Hs2st−/− (Fig. 6B), and Hs6st1−/− (Fig. 6C) embryos in the region where the corpus callosum will subsequently form, indicating that this region is not grossly mis-patterned in the mutants at this stage.
Figure 6.
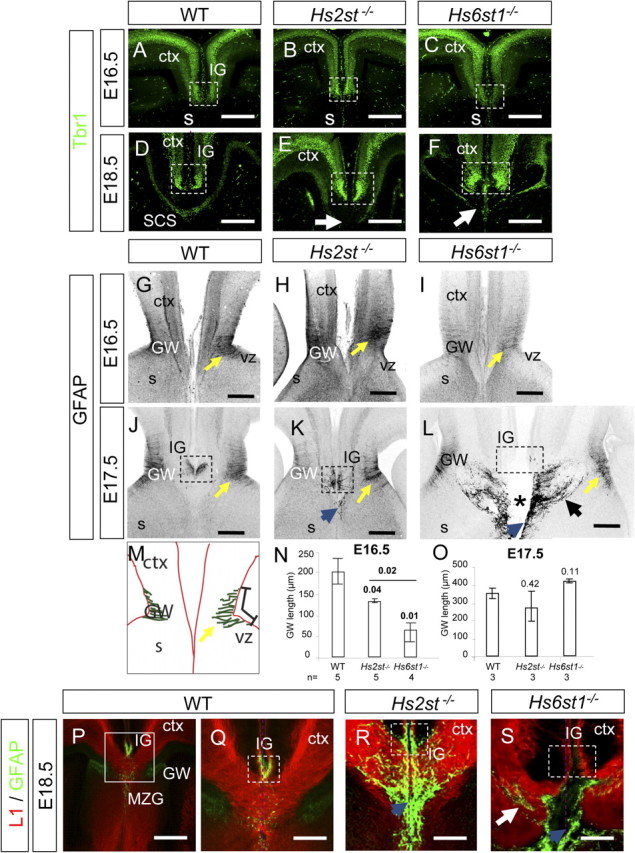
Development of telencephalic midline neuronal and glial structures critical for corpus callosum development in Hs2st−/− and Hs6st1−/− embryos. A–F, Tbr1 (green) is a marker for neurons that populate the IG and the SCS. A–C, E16.5. A, In wild-type embryos, Tbr1-expressing cells are located in the cortex and into the IG region (dotted box). This pattern is not altered in Hs2st−/− (B) or Hs6st1−/− (C) embryos. D–F, E18.5. D, In wild-type embryos Tbr1-expressing cells form a continuous sling at the ventral border of the corpus callosum called the SCS. Densely packed cells expressing high levels of Tbr1 mark the IG region (enclosed by dotted box) with less dense labeling in the cerebral cortex. E, Although Hs2st−/− embryos have cortical and IG (dotted box) staining similar to wild-type embryos, the SCS pattern is different with a gap (white arrow) devoid of Tbr1-positive cells at the midline. F, In Hs6st1−/− embryos densely packed Tbr1-expressing cells mark the IG (dotted box) but the Tbr1-expressing cells do not span the midline and there is a gap in the sling (white arrow). G–L, P–R, Immunohistochemistry for GFAP labels glia (P–R) are double labeled with the axonal marker L1 (red). G–I, E16.5. G, In wild types, glia are arranged in the GW in the ventricular zone of the corticoseptal boundary (yellow arrow). H, In Hs2st−/− embryos the GFAP pattern is comparable to wild types at the GW (yellow arrow). I, Hs6st1−/− embryos have a more severe phenotype with very few glia found in the GW at this stage (yellow arrow, glial fascicle). J–L, By E17.5 there are no longer gross differences in the GW (yellow arrows) but glial organization at the midline differs dramatically between genotypes. J, In wild-type embryos, glia have populated the IG above the corpus callosum. K, In Hs2st−/− embryos, glia are present in the IG (dotted box) and there are a few ectopic glia in the path of corpus callosum axons (blue arrow). L, In Hs6st1−/− embryos there are no glia populating the region of the IG (dotted box) and many ectopic glia are seen along the midline (blue arrow) and medial to the GW (black arrow). The cerebral hemispheres have become separated with the gap marked by an asterisk. M–O, Quantification of GFAP staining at the GW in wild-type, Hs2st−/−, and Hs6st1−/− embryos. M, Diagram illustrating the measurement of the length of the GW taken from the dorsal-most to the ventral-most GFAP stained glial process as described in Results. N, At E16.5 there are significant differences between all genotypes and the GW is by far the smallest in Hs6st1−/− embryos. O, At E17.5, there is no significant difference between genotypes. Error bars are ±SEM with the number of embryos analyzed shown below each bar. Numbers above each bar indicate Student's t test p values for comparison to wild type or bracketed for comparison between mutants. Significant differences (p < 0.05) in bold. P–S, At E18.5 glia occupy the IG in wild-type (P, Q) and Hs2st−/− (R) embryos but absent from the IG in Hs6st1−/− (S) embryos (dashed boxes in Q–S enclose IG). More glia are seen at the midline in Hs2st−/− embryos than in wild types (R, blue arrow) and in Hs6st1−/− embryos large numbers of ectopic glia are found both at the midline (S, blue arrow) and forming ectopic strands intermingled with the axons (S, white arrow). s, Septum; vz, ventricular zone; ctx, cerebral cortex. All sections coronal with dorsal at the top. Scale bars: A–L, P, 200 μm; Q–S, 100 μm.
In wild-type embryos by E18.5 Tbr1-expressing cells form a U-shaped sling ventral to the corpus callosum axon bundle (Fig. 6D, SCS) and mark the IG region dorsal to the corpus callosum. In Hs2st−/− embryos the IG staining is still apparent but the Tbr1-expressing cells are absent from the telencephalic midline (Fig. 6E, white arrow). In Hs6st1−/− embryos the IG staining is also apparent but the Tbr1-expressing cells are clustered around the knotted axon bundles flanking the telencephalic midline (Fig. 6F, white arrow). Thus, Tbr1-expressing cells are unable to form a normal subcallosal sling in the absence of Hs2st or Hs6st1 function but instead remain associated with the noncrossing callosal axon bundles. The presence of Tbr1-expressing neurons marking the IG in wild-type, Hs2st−/−, and Hs6st1−/− embryos (Fig. 6D–F, dashed box) indicates that the IG develops in its normal position in both mutants.
Differential requirement for Hs2st and Hs6st1 during the development of glial structures required for corpus callosum formation
We next analyzed the formation of the glial structures that are critical to corpus callosum formation using a glial cytoskeletal marker, GFAP, from E16.5 to E18.5.
In wild-type embryos at E16.5 GFAP staining is detected in large numbers of glial processes which extend from the ventricular surface of the corticoseptal boundary toward the midline to form the GW (Fig. 6G, yellow arrow). At E16.5 the GW glial processes are visible in Hs2st−/− embryos (Fig. 6H, yellow arrow) although the staining is fainter and less extensive suggesting a reduction in the number of GFAP-expressing glia. In Hs6st1−/− embryos at E16.5 only a very few GFAP-expressing glia are seen at the GW (Fig. 6I, yellow arrow). To quantify the GW glial phenotype we measured the distance between the dorsal- and ventral-most GFAP stained glial processes in the left and right hand side corticoseptal ventricular zone in consecutive coronal sections [2–3 × 100 μm sections measured for each E16.5 embryo] spanning the full rostro-caudal extent of the corticoseptal boundary (for illustration of GW measurement, see Fig. 6M). Comparison of this measurement between genotypes at E16.5 revealed a 35% reduction in Hs2st−/− embryos and a 69% reduction in Hs6st1−/− embryos compared with wild-type embryos (Fig. 6N). The development of the GW glia is therefore defective in both mutants with the most severe defect in Hs6st1−/− embryos.
By E17.5 in wild-type embryos (Fig. 6J) GFAP staining has expanded in the GW, and GFAP-expressing glia are found in the IG (Fig. 6J, dotted box) dorsal to the corpus callosum at the midline. By E17.5 we were unable to identify differences in GFAP staining at the GW in wild-type (Fig. 6J, yellow arrow), Hs2st−/− (Fig. 6K, yellow arrow), and Hs6st1−/− (Fig. 6L, yellow arrow) embryos indicating that the GW phenotype at E16.5 represents a developmental delay rather than a failure of glial differentiation at the GW [a comparison of GW measurements at E17.5 (taken from 3–4 × 100 μm sections from each embryo) is shown in Fig. 6O]. In E17.5 Hs2st−/− embryos, glia are present in the IG (Fig. 6K, dotted box) but some glia occupy ectopic positions at the telencephalic midline (Fig. 6K, blue arrow). In E17.5 Hs6st1−/− embryos, glia are extremely disorganized at the telencephalic midline where they form a continuous strip (Fig. 6L, blue arrow) and ectopic streams of glia coincide with knotted axon bundles at the telencephalic midline and extend laterally toward the GW (Fig. 6L, black arrow) and are absent from the IG (Fig. 6L, dotted box). E17.5 Hs6st1−/− vibratome sections frequently exhibited separation of the cerebral hemispheres (Fig. 6L, *) indicating a mechanical defect in inter-hemispheric connection at this stage. At E18.5 large numbers of glia are present in the path of callosal axons in both Hs2st−/− (Fig. 6R) and Hs6st1/−/− (Fig. 6S) embryos in contrast to their normal positions in the wild-type (Fig. 6P,Q) and are absent from the IG (Fig. 6S, dotted box) in Hs6st1−/− embryos indicating that the absence of glia from the Hs6st1−/− IG is delayed by >1 d. The very low survival rate of Hs6st1−/− embryos after birth prevented us from assessing whether glia ever subsequently populate the IG. The neuronal structures of the IG, as defined by Tbr1 staining, are comparable in all genotypes (Fig. 6D–F, dashed box) so the specific inability of GFAP-expressing glia to populate the IG in Hs6st1−/− (but not Hs2st−/−) embryos indicates a specific Hs6st1−/− glial cell phenotype. In conclusion we find that Hs2st and Hs6st1 are each critical, in distinct ways, for the generation of telencephalic glial structures required for corpus callosum axon navigation. The glial phenotype in Hs6st1−/− embryos is more severe than in Hs2st−/− embryos with a more extreme glial differentiation defect in the GW at E16.5 and failure to populate the IG after E17.5 as well as the presence of numerous ectopic glia flanking the midline in Hs6st1−/− embryos.
Hs2st and Hs6st1 are expressed in areas associated with formation of the corpus callosum
The abnormal axonal and glial behaviors exhibited at the corpus callosum of Hs2st−/− and Hs6st1−/− embryos presumably stem from the lack of HS sugar structures normally generated by Hs2st and Hs6st1 (supplemental Fig. 1B, available at www.jneurosci.org as supplemental material). To better understand the normal function of these HS modifying enzymes and their sites of action during corpus callosum development we next examined their gene expression patterns. Hs2st and Hs6st1-expressing cells in Hs6st1+/− and Hs2st+/− embryos were identified by virtue of the LacZ reporter transgenes incorporated in each gene-trap mutant allele. At E16.5 cortical axons start to project and the midline glial populations are assembling. At this stage, Hs2st expression in the cortex is highest medially with strong expression in the ventricular zone of the septum at the location of the GW and extending past the corticoseptal boundary into the medial cortex (Fig. 7A,C). Hs6st1 expression is highest in the lateral cortical plate with expression levels diminishing medially (Fig. 7B). Hs6st1 is expressed in the ventricular zone of the septum up to the location of the GW at the corticoseptal boundary with expression diminishing more dorsally in the medial cortex (Fig. 7E). At E18.5 many callosal axons have crossed the midline to form a thick corpus callosum axon bundle and the midline glial populations have reached their final positions. In the cerebral cortex, Hs2st (Fig. 7G) and Hs6st1 (Fig. 7H) are expressed in distinct, and largely complementary, laminar patterns. Hs2st expression is largely restricted to the deepest and most superficial cortical layers (presumptive layers 1 and 6) (Fig. 7G) while Hs6st1 is restricted to intermediate layers (presumptive layers 3–5) with a prominent strip of nonexpressing cells separating a thin, deep expressing population from a broader, more superficial expressing population (Fig. 7H). At the telencephalic midline, Hs2st and Hs6st1 are both expressed in the IG region (Fig. 7J,L, red arrows) dorsal to callosal axons with Hs2st expression prominent at the GW. Ventral to the corpus callosum, Hs2st is expressed in the region of the subcallosal sling (Fig. 7J, yellow arrows) and Hs6st1 is expressed in the septum (Fig. 7L).
Figure 7.

Expression of Hs2st and Hs6st1 in the formation of the corpus callosum. Hs2st and Hs6st1 expression analysis using LacZ and hplap gene-trap reporter transgenes. A–M, Hs2st+/− (A, C, G, J), Hs2st−/− (D, K), Hs6st1+/− (B, E, H, I, I', L), and Hs6st1−/− (F, M) embryos at E16.5 (A–F) and E18.5 (G–M). A–H, J–M, LacZ histochemistry (blue). I, I', Hplap histochemistry (purple). At E16.5 both Hs2st (A, C) and Hs6st1 (B, E) are expressed widely in the telencephalon including the cerebral cortex, ventral telencephalon, and septum with variations in staining intensity across these structures. (D) Hs2st−/− embryos show similar GW staining to (C) Hs2st+/− embryos. F, Hs6st1−/− embryos have similar patterns of expression to (E) Hs6st1+/− embryos. G–M, At E18.5 LacZ expression in Hs2st+/− (G) and Hs6st1+/− (H) embryos are in distinct laminar patterns in the cerebral cortex. G, H, Red boxes, Regions shown at higher magnification in J and L. I, Weak hplap staining of corpus callosum axons in coronal section from Hs6st1+/− embryo. I', Strong hplap staining of the anterior commissure crossing the midline at a more ventral location in the same section. J, Hs2st+/− LacZ expression is high in the glial wedge and in the IG (red arrow) and the SCS (yellow arrows). K, The IG shows high LacZ expression in Hs2st−/−, however unlike the Hs2st+/− (J), there is high LacZ expression at the midline below the IG. L, Hs6st1+/− LacZ is expressed strongly dorsal to the corpus callosum in the IG (red arrow). M, Hs6st1−/− embryos have ectopically located LacZ cells intermingled with the corpus callosum axon bundles (dashed red arrow) and no apparent LacZ expression in the IG. ctx, Cerebral cortex; s, septum, vtel, ventral telencephalon; P, Probst-like bundle; cc, corpus callosum. All sections are coronal with dorsal at the top. Scale bars: A–B, G–H, 500 μm; C–F, I–M, 500 μm.
Thus, Hs2st and Hs6st1 are each expressed in distinct sets of cells in regions known to be important for corpus callosum formation. Hs2st is not expressed at high levels in cortical cells projecting axons to the corpus callosum but is expressed in the GW, IG, and SCS, consistent with a possible role in the generation of the midline environment required for callosal axon crossing. Hs6st1 is expressed in cortical layers which project axons to the corpus callosum as well as in the IG and GW consistent with a possible role both in navigating axons themselves and in the generation of the midline environment. To further address a possible cell autonomous role for Hs6st1 in callosal axon navigation we took advantage of the human placental alkaline phosphatase (hplap) cassette included in the Hs6st1 gene trap reporter allele (Mitchell et al., 2001) which marks axons of expressing cells. At E18.5 hplap reporter expression is very weak in the corpus callosum axon bundle indicating low (if any) Hs6st1 expression in cortical cells projecting axons to the corpus callosum (Fig. 7I, compare with strong hplap staining of the anterior commisure in the same section in I′, which provides a positive control). The low Hs6st1 expression in callosal projection neurons argues against a cell autonomous role for Hs6st1 in cortical axon navigation in the corpus callosum.
Roles for Hs2st and Hs6st1 in midline cell positioning
The positioning of specific populations of cells at the midline is critical for normal development of the corpus callosum (Lindwall et al., 2007; Paul et al., 2007). One possible function for Hs2st or Hs6st1 might be to regulate neuronal or glial positioning cell autonomously so we next asked whether the cells marked by high expression of Hs2st or Hs6st1 are positioned normally in each Hst mutant. We examined the locations of LacZ-expressing cells in Hs2st−/− and Hs6st1−/− embryos. Cells marked by Hs2st-LacZ gene expression (but unable to make functional Hs2st protein) in Hs2st−/− embryos occupy the same positions as their heterozygous counterparts in the GW at E16.5 and E18.5 (Fig. 7D,K) with strong staining of the IG at E18.5 (Fig. 7K, red arrows). Strongly stained cells are apparent at the midline in the normal path of callosal axons at E18.5, coinciding with ectopic glia in Hs2st−/− embryos (Fig. 6K). Further, Hs2st-LacZ is no longer expressed continuously along the midline ventral to callosal axons (Fig. 7K) reminiscent of the noncontinuous SCS labeling by Tbr1 in Hs2st−/− embryos (Fig. 6E, white arrows). At E16.5 there is little difference in the distribution of Hs6st1-LacZ-expressing cells in Hs6st1−/− embryos compared with Hs6st1+/− embryos (Fig. 7, compare F with E). However, by E18.5 there are clear differences with Hs6st1-LacZ-expressing cells in Hs6st1−/− embryos failing to populate the IG and instead occupying ectopic locations at the corticoseptal boundary and intermingling with callosal axons (Fig. 7M, dashed red arrow) in clumps reminiscent of the ectopic clusters of glia seen in Hs6st1−/− embryos (Fig. 6S, white arrow). In conclusion cells marked by Hs2st and Hs6st1 gene expression end up in ectopic locations in their respective loss of function mutants consistent with a cell autonomous role for Hs2st and Hs6st1 in normal cell positioning at the midline.
Genetic interactions between Hst and Slit functions at the corpus callosum
Slit2 is the key Slit for corpus callosum development
The Slit2−/− corpus callosum phenotype comprises Probst-like bundles, prolific ectopic ventrally deflected septal axons, and a reduction in the numbers of axons able to cross the midline (Bagri et al., 2002). Our analysis of the optic chiasm indicated roles for Hs6st1 and Hs2st in Slit1 and Slit2 function and we wondered whether the same was the case at the corpus callosum. The role of Slit1 in corpus callosum development has not yet been reported. We find that Slit1−/− embryos (3/3) have no discernible corpus callosum axon phenotype (supplemental Fig. 3A, available at www.jneurosci.org as supplemental material) and we were unable to detect any disorganization of the midline glia (supplemental Fig. 3B, available at www.jneurosci.org as supplemental material). The Slit1−/−;Slit2−/− callosal axon phenotype (supplemental Fig. 3G–I, available at www.jneurosci.org as supplemental material) (2/2) is indistinguishable from the Slit2−/− phenotype (Table 2) (supplemental Fig. 3C,D, available at www.jneurosci.org as supplemental material). A relatively mild midline glial disorganization phenotype has previously been reported for Robo1−/− embryos at E18.5 (Andrews et al., 2006) and this is closely phenocopied by Slit2−/− embryos (arrow in supplemental Fig. 3F, available at www.jneurosci.org as supplemental material). Together these findings indicate that Slit2 is responsible for Slit/Robo function in the development of the corpus callosum and that Slit1 has a minor, if any, role in the development of this tract.
Genetic interaction between Hs6st1 and Slit2 in corpus callosum development
Hs6st1−/− and Slit2−/− embryos share two corpus callosum phenotypes namely the formation of Probst-like axon whorls flanking the midline and axons wandering ventral to the corpus callosum in the septum. The relative severity of the phenotypes differs between Hs6st1−/− and Slit2−/− genotypes with Hs6st1−/− embryos presenting a more severe midline crossing phenotype and Slit2−/− embryos a more severe septal axon wandering phenotype (Table 2). This observation is consistent with Hs6st1 normally functioning to facilitate the corpus callosum axon guidance function of Slit2. We hypothesized that if Hs6st1 and Slit2 act in synergy then simultaneous reduction of gene dosage in compound heterozygous Hs6st1+/−;Slit2+/− embryos would provoke more severe corpus callosum phenotypes than occur in Slit2+/−, Hs6st1+/−, or wild-type embryos. DiI/DiA tract tracing from the cerebral cortex revealed that Hs6st1+/−;Slit2+/− (3/3) embryos formed a U-shaped corpus callosum (Fig. 8D) which was indistinguishable from wild-type (4/4) (Fig. 8A), Hs6st1+/− (4/4), and Slit2+/− (3/3) (not shown) embryos and we did not detect Probst-like axon whorls flanking the midline in any of these genotypes (Table 2). In contrast there were more DiI labeled axons ventral to the corpus callosum in Hs6st1+/−;Slit2+/− embryos compared with wild types (Fig. 8, compare F with C, arrows point to septal axons in the area indicated by dashed boxes in A,D). To analyze this systematically we scored serial coronal sections covering the rostral-caudal extent (‘section 1′ most caudal to ‘section 7′ most rostral) of the corpus callosum according to whether there were: no (score = 0); <10 (score = 1); >10 (score = 2); or too many to count (score = 3) axons and calculated the genotype average score at each position along the rostro-caudal axis. All genotypes had some axons and retrogradely labeled cell bodies in the septum presumably corresponding to the perforating pathway (Shu et al., 2001) and these axons were included in the scoring as there was no way of distinguishing them from callosal axons using our DiI labeling technique. The results for the Hs6st1;Slit2 genotypes are presented in Figure 8G. The curves for wild-type (dark blue line) showed that the majority of the septal axons occur in the middle of the series (section 4) with numbers diminishing rostrally and caudally. Hs6st1+/− (orange line) and Slit2+/− embryos (pink line) had a very similar profile indicating a lack of heterozygous phenotype. In contrast the scores for Hs6st1+/−;Slit2+/− embryos (pale blue line) were consistently higher than the other genotypes along the entire extent of the rostro-caudal axis with the difference being particularly apparent in the caudal and rostral most positions (sections 1 and 7) although note that the average score approaches the maximum possible score of 3 in the intervening sections. Following an identical approach we next looked for genetic interactions between Hs2st and Slit2 by examining corpus callosum development in Hs2st+/−, Slit2+/−, and Hs2st+/−;Slit2+/− embryos. In this case we were unable to identify any defects in corpus callosum morphology in Hs2st+/−;Slit2+/− embryos (n = 3, data not shown). Semiquantitative analysis of the septal axon phenotype presented in Figure 8H does not reveal a convincing enhancement of phenotype in the Hs2st+/−;Slit2+/− embryos (green line) compared with the other genotypes. In conclusion, our semiquantitative analysis clearly demonstrates an increase in cortical axon growth in the septum in Hs6st1+/−;Slit2+/− embryos compared with the other genotypes and provides positive evidence of a synergistic genetic interaction between Hs6st1 and Slit2 in preventing axons transiting between the cerebral cortex and the septum. While we cannot exclude the possibility that Slit2 interacts with Hs6st1 in other aspects of corpus callosum development, or with Hs2st at all, at the very least these interactions must be less sensitive to reduced gene dosage or any phenotypes produced were below our limits of detection.
Slit2 blocks callosal axon midline crossing in Hs6st1−/− embryos
Examination of corpus callosum development in embryos simultaneously lacking both Hs6st1 and Slit2 function reveals an intriguingly complex, and nonepistatic, relationship between these two genes in generating the Hs6st1−/− mutant phenotype. In Hs6st1−/− embryos the failure of callosal axons to cross the midline is accompanied by large numbers of ectopic glia lining up along the midline (Fig. 6L,S). During normal development Slit2, produced by glia in the GW and IG, guides callosal axons by repulsive interactions (Bagri et al., 2002; Shu et al., 2003b) so we hypothesized that a contributory factor to failed midline crossing in Hs6st1−/− embryos is Slit2-mediated repulsion from the midline caused by the ectopically located glia. This hypothesis predicts that the additional removal of Slit2 function in an Hs6st1−/− embryo would attenuate the repulsive force exerted by the mutant midline environment on callosal axons and rescue midline crossing. DiI injection into the cerebral cortex of E18.5 Hs6st1−/−; Slit2−/− embryos labels abnormally large numbers of axons growing in the septum (Fig. 9A–C) and Probst-like axon whorls flanking the midline (Fig. 9D,E) indicating that this genotype has a major callosal defect. More interestingly, we saw callosal axons crossing the midline in 3/4 embryos examined although crossing was obviously not rescued to wild-type levels (Fig. 9B–D; Table 2). This rescue is consistent with the hypothesis that Slit2 function blocks callosal axons from crossing the midline in Hs6st1−/− embryos. GFAP/L1 staining revealed that large numbers of ectopic glia are present at the midline of Hs6st1−/−;Slit2−/− embryos (Fig. 9E) but, in contrast to the Hs6st1−/− phenotype, the axons have grown through them consistent with the idea that the loss of Slit2 function makes them less repulsive. Critically this phenotype shows that Hs6st1 must have Slit independent functions in the developing corpus callosum.
Figure 9.

The complete failure of callosal axons to cross the midline in Hs6st1−/− embryos is rescued in Hs6st1−/−;Slit2−/− embryos. A–E, Axon labeling following DiI and DiA injection into opposite cerebral cortices of Hs6st1−/−;Slit2−/− compound homozygote E18.5 embryos. A–C, Rostral-caudal series of section showing that although Probst-like axon whorls flank the midline, and many axons grow into the septum, large numbers of callosal axons are able to cross into the contralateral cerebral cortex (red arrows) with higher magnification of crossing axons shown in D. E, A higher magnification showing large numbers of axons in the septum (F) L1/GFAP immunohistochemistry of Hs6st1−/−;Slit2−/− embryo. Large numbers of ectopically positioned glia occupy the midline and callosal axons have been able to cross to form a corpus callosum (cc). G, Diagram illustrating the Hs6st1−/−;Slit2−/− corpus callosum phenotype. Gray arrow, ectopic growth into the septum; P, Probst-like knotted axons; *, severe midline glial defect; purple arrow, callosal axons crossing the midline. All sections coronal with dorsal at the top. Scale bars, 200 μm.
In Hs6st1−/− and Slit2−/− embryos we observed increased numbers of axons in the septum ventral to the corpus callosum with a more severe phenotype in Slit2−/− embryos (Fig. 5C,F,I; Table 2) (supplemental Fig. 3C,E, available at www.jneurosci.org as supplemental material). The amount of septal axon growth in the Hs6st1−/−;Slit2−/− embryos was comparable to the Slit2−/− phenotype (Table 2; compare Fig. 9A,E to supplemental Fig. 3C,E, available at www.jneurosci.org as supplemental material). Therefore, in contrast to midline crossing, the septal axon phenotype was not rescued in Hs6st1−/−;Slit2−/− embryos and, as we did not detect any obvious enhancement of this phenotype compared with, Slit2−/− embryos, this is consistent with a more straightforward epistatic relationship between Hs6st1 and Slit2 reminiscent of our findings at the optic chiasm (Pratt et al., 2006), present study).
FGF signaling is reduced in the corticoseptal region in Hs6st1−/− embryos
At the optic chiasm and in the optic tracts the spectrum of RGC axon navigation phenotypes found in Hs2st−/−, Hs6st1−/−, Hs2st−/−; Slit1−/−, and Hs6st1−/−;Slit2−/− embryos closely overlap, suggesting that these Hsts and Slits function in the same signaling pathways (Table 1; see Fig 11). Hs6st1−/− mutants have more severe defects in corpus callosum axon midline crossing and the production of glial structures than do Slit1−/−, Slit2−/−, Robo2−/− or Slit1−/−;Slit2−/− embryos (Bagri et al., 2002; Richards, 2002; Andrews et al., 2006; López-Bendito et al., 2007) (Table 2; see Fig. 11, compare K with L), indicating that Hs6st1 likely acts in one or more additional pathways to Slit/Robo. Further support for this idea comes from the analysis of Hs6st1−/−;Slit2−/− embryos which provide clear evidence for nonepistatic relations between Slit2 and Hs6st1. The absence of glia in the IG and the ectopically located glia that we find in Hs6st1−/− embryos, neither of which is seen in Robo/Slit mutants (Bagri et al., 2002; Andrews et al., 2006), resemble the phenotype reported in conditional FGFR1−/− mutant embryos, which have reduced levels of FGF signaling (Smith et al., 2006; Tole et al., 2006; Moldrich et al., 2010) (compare phenotype summaries in Fig. 11 K and M,N). The normal differentiation and migration of glia which form the GW and IG starts at E14.5 and requires FGF signaling (Smith et al., 2006; Tole et al., 2006). To determine whether reduced FGF signaling could contribute to the Hs6st1−/− callosal phenotype we examined the expression of Sprouty2, a transcriptional target of FGF signaling, at the telencephalic midline. In situ hybridization did not reveal any clear differences in the expression pattern of Sprouty2 between E14.5 wild-type and Hs6st1−/− embryos, both of which showed high expression at the corticoseptal boundary where the IG glia are born before translocating to the IG (Fig. 10A,B, red arrow). We quantified the levels of FGF signaling by measuring Sprouty2 mRNA levels in tissue dissected from E14.5 telencephalon comprising the medial cortex, corticoseptal boundary and septum but excluding the ganglionic eminences and more lateral cortex. We found a significant 25% reduction in Sprouty2 levels in Hs6st1−/− embryos compared with wild-types (Fig. 10C) confirming that Hs6st1 is required to achieve normal FGF signaling levels. These findings are consistent with a model in which Hs6st1 function is required to attain the FGF signaling levels required for proper glial cell differentiation.
Figure 10.

Hs6st1 and FGF signaling in the corticoseptal region of E14.5 embryos. A, B, In situ hybridization for Sprouty2, which is transcriptionally upregulated in response to FGF signaling. A, Wild-type embryo. B, Hs6st1−/− embryo. In both genotypes Sprouty2 is expressed in the telencephalic ventricular zone with particularly high expression at the corticoseptal boundary (A, B, red arrows) and no obvious difference in the expression pattern between genotypes. C, qRT-PCR for Sprouty2 mRNA (levels normalized to GAPDH) in RNA extracted from the E14.5 septum, corticoseptal boundary, and medial cortex. Sprouty2 levels are reduced by ∼25% in Hs6st1−/− embryos indicating a reduction in FGF signaling. vtel, Ventral telencephalon; s, septum; ctx, cerebral cortex. Scale bars, 500 μm.
Discussion
The optic chiasm
Similarities between Hst and Slit/Robo optic chiasm phenotypes (present study and (Plump et al., 2002; Pratt et al., 2006; Thompson et al., 2006; Plachez et al., 2008) (summarized in Fig. 11A–F; Table 1) suggest that Hs2st and Hs6st1 function in the same pathways as Slit1, Slit2, and Robo2. Here we used genetic analysis to elucidate the detail of the Hst/Slit interactions at the optic chiasm. The optic chiasm phenotypes of embryos with single or compound Hs2st−/−, Hs6st1−/−, Slit1−/−, or Slit2−/− loss of function genotypes are best explained by a model in which Hs2st and Hs6st1 are both capable of mediating the function of Slit1 and/or Slit2 depending on the context. Our data show that the function of Hs2st and Hs6st1 at the optic chiasm can mainly be accounted for by a role in mediating Slit1 and Slit2 function.
Mechanistically, Hsts might exert their influence on Robo/Slit signaling biochemically by regulating the formation of the Robo/Slit/HS signaling complex (Hussain et al., 2006), the distribution of Slit proteins (Johnson et al., 2004), or gene expression. HSPGs modulate the activity of morphogens, including Wnt, Shh and FGF, which control gene expression (Perrimon and Bernfield, 2000; Selleck, 2000; Lin, 2004). We found decreased levels of Slit1 transcripts at the optic chiasm of Hs6st1−/− embryos. Reduced Slit1 is unlikely to account for the inter-retinal guidance phenotype in Hs6st1−/− embryos, as even complete loss of Slit1 function alone does not result in increased inter-retinal innervation. Reduced Slit1 could contribute to the Hs6st1−/−;Slit2−/− optic chiasm phenotype (present study) and explain the phenocopy between Hs6st1−/−;Slit2−/− and Slit1+/−;Slit2−/−/Slit1−/−;Slit2−/− embryos (Table 1, Fig. 11) (Plump et al., 2002; Thompson et al., 2006). Hs6st1 might regulate Slit1 expression via the Slit/Robo or FGF/FGFR pathways as (1) Hsts regulate Slit/Robo signaling (present study) and Slit/Robo signaling regulates gene expression by inducing phosporylation and nuclear translocation of β-catenin (Rhee et al., 2002, 2007) and (2) Hsts regulates FGF signaling (Grobe et al., 2005) (present study) and in Xenopus FGF signaling upregulates Slit1 (but not Slit2) expression in the diencephalon (Atkinson-Leadbeater et al., 2010).
Although interactions between Hs6st1 and Slit1/Slit2 appear to dominate at the optic chiasm, interactions with additional factors cannot be ruled out. One candidate is the secreted morphogen Shh which can guide RGC axons and whose signaling activity depends on HSPGs (Trousse et al., 2001; Grobe et al., 2005; Dierker et al., 2009a,b). Disrupting Shh or its receptor BOC produces increased ectopic RGC axon navigation into the contralateral optic nerve reminiscent of the Hs6st1−/− phenotype (Sánchez-Camacho and Bovolenta, 2008; Fabre et al., 2010).
The corpus callosum
Corpus callosum development is a complex event requiring the precise coordination of tissue fusion, neuron and glial cell production, cell migration, and axon guidance molecule expression (Serafini et al., 1996; Bagri et al., 2002; Shu et al., 2003a,b; Andrews et al., 2006; Keeble et al., 2006; Smith et al., 2006; Tole et al., 2006; Lindwall et al., 2007; López-Bendito et al., 2007; Paul et al., 2007; Islam et al., 2009; Niquille et al., 2009). Embryos lacking the HS biosynthetic enzyme Ext1 in the developing CNS exhibit severe morphological distortions at the telencephalic midline and axons fail to connect the cerebral hemispheres illustrating the vital importance of HS in this developing system (Inatani et al., 2003). HS modification is also critical as embryos lacking the heparan sulfotransferase Ndst1 have major midline morphological defects and no axon crossing in the corpus callosum and embryos lacking the Sulf heparan endosulphatases have corpus callosum dysgenesis (Grobe et al., 2005; Kalus et al., 2009).
Our data fit a model in which Hs2st and Hs6st1 have context specific functions in generating the midline cellular environment needed for callosal axon navigation. First, Hs2st and Hs6st1 are regionally expressed around the telencephalic midline with high expression at positions coinciding with key sites of gliogeneis and differentiation in the developing GW and IG. Second, cells marked by Hs2st and Hs6st1 expression are mislocated in Hs2st−/− and Hs6st1−/− embryos consistent with a cell autonomous role in cell positioning. Third, the midline glial cell populations, whose normal function is to guide callosal axons by secreting guidance cues including Slit2 (Shu et al., 2003b; Lindwall et al., 2007; Paul et al., 2007) develop abnormally in Hs2st−/− and Hs6st1−/− embryos with a more severe glial phenotype in Hs6st1−/− embryos at the GW and IG. The IG is populated by glia which originate in the GW (Smith et al., 2006) so the delay in GW glial maturation may well contribute to the subsequent paucity of glia in the IG in Hs6st1−/− embryos at E17.5 and E18.5. Importantly, the delay in GW glial differentiation at E16.5 precedes the axon navigation defect. Fourth, neurons comprising the subcallosal sling, whose normal function is to attract callosal axons across the midline by secreting Sema3c (Niquille et al., 2009) fail to form a bridge across the telencephalic midline.
The Hs6st1−/− corpus callosum phenotype shares Probst like bundles, defective midline crossing and ectopic axon growth into the septum with Robo/Slit mutants although phenotype severity differs (Bagri et al., 2002; Andrews et al., 2006; López-Bendito et al., 2007) (Table 2; Fig. 11), suggesting that Hs6st1 acts in synergy with Slit/Robo in this system and we confirmed this by analysis of Hs6st1+/−;Slit2+/− compound heterozygotes. Excitingly the Hs6st1−/−;Slit2−/− callosal phenotype revealed an unexpected interaction between Hs6st1 and Slit2. Rather than acting epistatically, as would be expected if Hs6st1 functioned to facilitate growth cone sensitivity to Slit2, our results can best be explained by Slit2 actually preventing callosal axons crossing the midline in Hs6st1−/− embryos. Our data fit a model where a primary function of Hs6st1 is to regulate the formation of Slit2-expressing glial structures and that the ectopic positioning of these glia in the path of callosal axons in Hs6st1−/− embryos blocks midline crossing. Regardless of the mechanistic details this case provides an example of a pathological axon guidance phenotype in which the defect can be treated by interfering with a second gene. In this case a defect caused by perturbation of sugar structure, via loss of a modifying enzyme, can be rescued by abrogating the function of the axon guidance molecule Slit2.
Robo/Slit and Hs2st mutants share a relatively mild disruption of midline glia and midline axon crossing defects with the formation of Probst-like axon bundles (Bagri et al., 2002; Andrews et al., 2006; López-Bendito et al., 2007) (Table 2; Fig. 11). On the other hand Hs2st and Robo/Slit mutants differ in (1) the proportion of callosal axons able to cross the midline, (2) in the penetrance of the axon guidance phenotype, and (3) Hs2st−/− callosal axons do not grow ventrally into the septum. Our examination of Hs2st+/−;Slit2+/− compound heterozygotes failed to identify, although does not rule out, a genetic interaction between Hs2st and Slit2. Overall our results suggest possible roles for Hs2st in some Robo/Slit functions but provides little indication of roles in additional pathways.
Our data points to primary functions for Hs6st1 in additional pathways to Slit/Robo. A good candidate is the FGF signaling pathway which, like Hs6st1, is critical for both axon navigation and the formation of midline glial structures (Fig. 11, compare K with M,N). HS is a component of the FGF/FGFR complex (supplemental Fig. 1A, available at www.jneurosci.org as supplemental material) and the sulfation pattern of HS can dictate FGFR signaling and FGF-mediated axon guidance (Walz et al., 1997; DiGabriele et al., 1998; Guimond and Turnbull, 1999; Irie et al., 2002; Grobe et al., 2005). Telencephalic expression of FGF8 or its receptor FGFR1 is critical for the generation of GW and IG glia and later knockout of FGFR1 restricted to the GFAP-expressing glia blocks their translocation from GW to IG (Smith et al., 2006; Tole et al., 2006; Moldrich et al., 2010). Corpus callosum axon midline crossing is blocked in all three models illustrating the importance of FGF signaling for the production of midline glial structures and subsequent corpus callosum development. We find that FGF signaling is reduced in the corticoseptal region of Hs6st1−/− embryos at E14.5, glial differentiation in the GW is delayed so that there are very few mature glia in the GW at E16.5, and glia fail to populate the IG at E17.5. Together our results suggest a model in which Hs6st1 is required (1) for the normal developmental timetable of the glial structures required for corpus callosum formation and (2) for FGF-dependent events important in glial developememt.
The heparan sulfate code hypothesis
The heparan sulfate code hypothesis postulates that the interactions between HS and effector molecules involved in axon guidance, such as Slits or FGF molecules and their receptors, are dependent on the specific HS sugar structures generated by HS modifying enzymes (Turnbull et al., 2001; Bülow and Hobert, 2004; Holt and Dickson, 2005; Kreuger et al., 2006). In the present study we have taken advantage of mouse genetics to reveal the unique physiological functions for Hs2st and Hs6st1 in the development of two commissural axon tracts. Hs2st and Hs6st1 differ in both their biochemical action on HS sugar structure (supplemental Fig. 1B, available at www.jneurosci.org as supplemental material) and in their gene expression patterns (Pratt et al., 2006; present study) so it is not possible to know, from the current study, the extent to which their unique functions rely on their biochemistry as opposed to their expression patterns. Future experiments involving more refined manipulation of Hs2st and Hs6st1 combined with glycomic technologies will help answer this important question.
Footnotes
This work was supported by the Medical Research Council, Biotechnology and Biological Sciences Research Council, and the Wellcome Trust. We thank Jennifer Bush, Michael McCormick, and Robert Chou who worked on this project as part of their Honours or Masters research, Lynda Erskine and Albert Basson for supplying in situ probes, and William Andrews and Marc Tessier-Lavigne for supplying Slit transgenic mice. We are grateful to Trudi Gillespie [IMPACT (for Image Analysis, Multiphoton, and Confocal Technologies) Facility, University of Edinburgh] for help with confocal imaging and the Biological Research Resources staff for skilled animal husbandry.
References
- Andrews W, Liapi A, Plachez C, Camurri L, Zhang J, Mori S, Murakami F, Parnavelas JG, Sundaresan V, Richards LJ. Robo1 regulates the development of major axon tracts and interneuron migration in the forebrain. Development. 2006;133:2243–2252. doi: 10.1242/dev.02379. [DOI] [PubMed] [Google Scholar]
- Atkinson-Leadbeater K, Bertolesi GE, Hehr CL, Webber CA, Cechmanek PB, McFarlane S. Dynamic expression of axon guidance cues required for optic tract development is controlled by fibroblast growth factor signaling. J Neurosci. 2010;30:685–693. doi: 10.1523/JNEUROSCI.4165-09.2010. [DOI] [PMC free article] [PubMed] [Google Scholar]
- Bagri A, Marín O, Plump AS, Mak J, Pleasure SJ, Rubenstein JL, Tessier-Lavigne M. Slit proteins prevent midline crossing and determine the dorsoventral position of major axonal pathways in the mammalian forebrain. Neuron. 2002;33:233–248. doi: 10.1016/s0896-6273(02)00561-5. [DOI] [PubMed] [Google Scholar]
- Bullock SL, Fletcher JM, Beddington RS, Wilson VA. Renal agenesis in mice homozygous for a gene trap mutation in the gene encoding heparan sulfate 2-sulfotransferase. Genes Dev. 1998;12:1894–1906. doi: 10.1101/gad.12.12.1894. [DOI] [PMC free article] [PubMed] [Google Scholar]
- Bülow HE, Hobert O. Differential sulfations and epimerization define heparan sulfate specificity in nervous system development. Neuron. 2004;41:723–736. doi: 10.1016/s0896-6273(04)00084-4. [DOI] [PubMed] [Google Scholar]
- Dickson BJ. Molecular mechanisms of axon guidance. Science. 2002;298:1959–1964. doi: 10.1126/science.1072165. [DOI] [PubMed] [Google Scholar]
- Dierker T, Dreier R, Petersen A, Bordych C, Grobe K. Heparan sulfate-modulated, metalloprotease-mediated sonic hedgehog release from producing cells. J Biol Chem. 2009a;284:8013–8022. doi: 10.1074/jbc.M806838200. [DOI] [PMC free article] [PubMed] [Google Scholar]
- Dierker T, Dreier R, Migone M, Hamer S, Grobe K. Heparan sulfate and transglutaminase activity are required for the formation of covalently cross-linked hedgehog oligomers. J Biol Chem. 2009b;284:32562–32571. doi: 10.1074/jbc.M109.044867. [DOI] [PMC free article] [PubMed] [Google Scholar]
- DiGabriele AD, Lax I, Chen DI, Svahn CM, Jaye M, Schlessinger J, Hendrickson WA. Structure of a heparin-linked biologically active dimer of fibroblast growth factor. Nature. 1998;393:812–817. doi: 10.1038/31741. [DOI] [PubMed] [Google Scholar]
- Erskine L, Herrera E. The retinal ganglion cell axon's journey: insights into molecular mechanisms of axon guidance. Dev Biol. 2007;308:1–14. doi: 10.1016/j.ydbio.2007.05.013. [DOI] [PubMed] [Google Scholar]
- Erskine L, Williams SE, Brose K, Kidd T, Rachel RA, Goodman CS, Tessier-Lavigne M, Mason CA. Retinal ganglion cell axon guidance in the mouse optic chiasm: expression and function of robos and slits. J Neurosci. 2000;20:4975–4982. doi: 10.1523/JNEUROSCI.20-13-04975.2000. [DOI] [PMC free article] [PubMed] [Google Scholar]
- Esko JD, Selleck SB. Order out of chaos: assembly of ligand binding sites in heparan sulfate. Annu Rev Biochem. 2002;71:435–471. doi: 10.1146/annurev.biochem.71.110601.135458. [DOI] [PubMed] [Google Scholar]
- Fabre PJ, Shimogori T, Charron F. Segregation of ipsilateral retinal ganglion cell axons at the optic chiasm requires the Shh receptor Boc. J Neurosci. 2010;30:266–275. doi: 10.1523/JNEUROSCI.3778-09.2010. [DOI] [PMC free article] [PubMed] [Google Scholar]
- Grobe K, Inatani M, Pallerla SR, Castagnola J, Yamaguchi Y, Esko JD. Cerebral hypoplasia and craniofacial defects in mice lacking heparan sulfate Ndst1 gene function. Development. 2005;132:3777–3786. doi: 10.1242/dev.01935. [DOI] [PMC free article] [PubMed] [Google Scholar]
- Guimond SE, Turnbull JE. Fibroblast growth factor receptor signalling is dictated by specific heparan sulphate saccharides. Curr Biol. 1999;9:1343–1346. doi: 10.1016/s0960-9822(00)80060-3. [DOI] [PubMed] [Google Scholar]
- Holt CE, Dickson BJ. Sugar codes for axons? Neuron. 2005;46:169–172. doi: 10.1016/j.neuron.2005.03.021. [DOI] [PMC free article] [PubMed] [Google Scholar]
- Hussain SA, Piper M, Fukuhara N, Strochlic L, Cho G, Howitt JA, Ahmed Y, Powell AK, Turnbull JE, Holt CE, Hohenester E. A molecular mechanism for the heparan sulfate dependence of slit-robo signaling. J Biol Chem. 2006;281:39693–39698. doi: 10.1074/jbc.M609384200. [DOI] [PMC free article] [PubMed] [Google Scholar]
- Inatani M, Irie F, Plump AS, Tessier-Lavigne M, Yamaguchi Y. Mammalian brain morphogenesis and midline axon guidance require heparan sulfate. Science. 2003;302:1044–1046. doi: 10.1126/science.1090497. [DOI] [PubMed] [Google Scholar]
- Irie A, Yates EA, Turnbull JE, Holt CE. Specific heparan sulfate structures involved in retinal axon targeting. Development. 2002;129:61–70. doi: 10.1242/dev.129.1.61. [DOI] [PubMed] [Google Scholar]
- Islam SM, Shinmyo Y, Okafuji T, Su Y, Naser IB, Ahmed G, Zhang S, Chen S, Ohta K, Kiyonari H, Abe T, Tanaka S, Nishinakamura R, Terashima T, Kitamura T, Tanaka H. Draxin, a repulsive guidance protein for spinal cord and forebrain commissures. Science. 2009;323:388–393. doi: 10.1126/science.1165187. [DOI] [PubMed] [Google Scholar]
- Johnson KG, Ghose A, Epstein E, Lincecum J, O'Connor MB, Van Vactor D. Axonal heparan sulfate proteoglycans regulate the distribution and efficiency of the repellent slit during midline axon guidance. Curr Biol. 2004;14:499–504. doi: 10.1016/j.cub.2004.02.005. [DOI] [PubMed] [Google Scholar]
- Kalus I, Salmen B, Viebahn C, von Figura K, Schmitz D, D'Hooge R, Dierks T. Differential involvement of the extracellular 6-O-endosulfatases Sulf1 and Sulf2 in brain development and neuronal and behavioral plasticity. J Cell Mol Med. 2009;13:4505–4521. doi: 10.1111/j.1582-4934.2008.00558.x. [DOI] [PMC free article] [PubMed] [Google Scholar]
- Kantor DB, Chivatakarn O, Peer KL, Oster SF, Inatani M, Hansen MJ, Flanagan JG, Yamaguchi Y, Sretavan DW, Giger RJ, Kolodkin AL. Semaphorin 5A is a bifunctional axon guidance cue regulated by heparan and chondroitin sulfate proteoglycans. Neuron. 2004;44:961–975. doi: 10.1016/j.neuron.2004.12.002. [DOI] [PubMed] [Google Scholar]
- Katz MJ, Lasek RJ, Silver J. Ontophyletics of the nervous system: development of the corpus callosum and evolution of axon tracts. Proc Natl Acad Sci U S A. 1983;80:5936–5940. doi: 10.1073/pnas.80.19.5936. [DOI] [PMC free article] [PubMed] [Google Scholar]
- Keeble TR, Halford MM, Seaman C, Kee N, Macheda M, Anderson RB, Stacker SA, Cooper HM. The Wnt receptor Ryk is required for Wnt5a-mediated axon guidance on the contralateral side of the corpus callosum. J Neurosci. 2006;26:5840–5848. doi: 10.1523/JNEUROSCI.1175-06.2006. [DOI] [PMC free article] [PubMed] [Google Scholar]
- Kirn-Safran C, Farach-Carson MC, Carson DD. Multifunctionality of extracellular and cell surface heparan sulfate proteoglycans. Cell Mol Life Sci. 2009;66:3421–3434. doi: 10.1007/s00018-009-0096-1. [DOI] [PMC free article] [PubMed] [Google Scholar]
- Kreuger J, Spillmann D, Li JP, Lindahl U. Interactions between heparan sulfate and proteins: the concept of specificity. J Cell Biol. 2006;174:323–327. doi: 10.1083/jcb.200604035. [DOI] [PMC free article] [PubMed] [Google Scholar]
- Lee JS, Chien CB. When sugars guide axons: insights from heparan sulphate proteoglycan mutants. Nat Rev Genet. 2004;5:923–935. doi: 10.1038/nrg1490. [DOI] [PubMed] [Google Scholar]
- Leighton PA, Mitchell KJ, Goodrich LV, Lu X, Pinson K, Scherz P, Skarnes WC, Tessier-Lavigne M. Defining brain wiring patterns and mechanisms through gene trapping in mice. Nature. 2001;410:174–179. doi: 10.1038/35065539. [DOI] [PubMed] [Google Scholar]
- Lin X. Functions of heparan sulfate proteoglycans in cell signaling during development. Development. 2004;131:6009–6021. doi: 10.1242/dev.01522. [DOI] [PubMed] [Google Scholar]
- Lindwall C, Fothergill T, Richards LJ. Commissure formation in the mammalian forebrain. Curr Opin Neurobiol. 2007;17:3–14. doi: 10.1016/j.conb.2007.01.008. [DOI] [PubMed] [Google Scholar]
- López-Bendito G, Flames N, Ma L, Fouquet C, Di Meglio T, Chedotal A, Tessier-Lavigne M, Marín O. Robo1 and Robo2 cooperate to control the guidance of major axonal tracts in the mammalian forebrain. J Neurosci. 2007;27:3395–3407. doi: 10.1523/JNEUROSCI.4605-06.2007. [DOI] [PMC free article] [PubMed] [Google Scholar]
- Mitchell KJ, Pinson KI, Kelly OG, Brennan J, Zupicich J, Scherz P, Leighton PA, Goodrich LV, Lu X, Avery BJ, Tate P, Dill K, Pangilinan E, Wakenight P, Tessier-Lavigne M, Skarnes WC. Functional analysis of secreted and transmembrane proteins critical to mouse development. Nat Genet. 2001;28:241–249. doi: 10.1038/90074. [DOI] [PubMed] [Google Scholar]
- Moldrich RX, Gobius I, Pollak T, Zhang J, Ren T, Brown L, Mori S, De Juan Romero C, Britanova O, Tarabykin V, Richards LJ. Molecular regulation of the developing commissural plate. J Comp Neurol. 2010;518:3645–3661. doi: 10.1002/cne.22445. [DOI] [PMC free article] [PubMed] [Google Scholar]
- Niquille M, Garel S, Mann F, Hornung JP, Otsmane B, Chevalley S, Parras C, Guillemot F, Gaspar P, Yanagawa Y, Lebrand C. Transient neuronal populations are required to guide callosal axons: a role for semaphorin 3C. PLoS Biol. 2009;7:e1000230. doi: 10.1371/journal.pbio.1000230. [DOI] [PMC free article] [PubMed] [Google Scholar]
- Paul LK, Brown WS, Adolphs R, Tyszka JM, Richards LJ, Mukherjee P, Sherr EH. Agenesis of the corpus callosum: genetic, developmental and functional aspects of connectivity. Nat Rev Neurosci. 2007;8:287–299. doi: 10.1038/nrn2107. [DOI] [PubMed] [Google Scholar]
- Perrimon N, Bernfield M. Specificities of heparan sulphate proteoglycans in developmental processes. Nature. 2000;404:725–728. doi: 10.1038/35008000. [DOI] [PubMed] [Google Scholar]
- Piper M, Moldrich RX, Lindwall C, Little E, Barry G, Mason S, Sunn N, Kurniawan ND, Gronostajski RM, Richards LJ. Multiple non-cell-autonomous defects underlie neocortical callosal dysgenesis in Nfib-deficient mice. Neural Dev. 2009;4:43. doi: 10.1186/1749-8104-4-43. [DOI] [PMC free article] [PubMed] [Google Scholar]
- Plachez C, Andrews W, Liapi A, Knoell B, Drescher U, Mankoo B, Zhe L, Mambetisaeva E, Annan A, Bannister L, Parnavelas JG, Richards LJ, Sundaresan V. Robos are required for the correct targeting of retinal ganglion cell axons in the visual pathway of the brain. Mol Cell Neurosci. 2008;37:719–730. doi: 10.1016/j.mcn.2007.12.017. [DOI] [PubMed] [Google Scholar]
- Plump AS, Erskine L, Sabatier C, Brose K, Epstein CJ, Goodman CS, Mason CA, Tessier-Lavigne M. Slit1 and Slit2 cooperate to prevent premature midline crossing of retinal axons in the mouse visual system. Neuron. 2002;33:219–232. doi: 10.1016/s0896-6273(01)00586-4. [DOI] [PubMed] [Google Scholar]
- Pratt T, Conway CD, Tian NM, Price DJ, Mason JO. Heparan sulphation patterns generated by specific heparan sulfotransferase enzymes direct distinct aspects of retinal axon guidance at the optic chiasm. J Neurosci. 2006;26:6911–6923. doi: 10.1523/JNEUROSCI.0505-06.2006. [DOI] [PMC free article] [PubMed] [Google Scholar]
- Rhee J, Mahfooz NS, Arregui C, Lilien J, Balsamo J, VanBerkum MF. Activation of the repulsive receptor Roundabout inhibits N-cadherin-mediated cell adhesion. Nat Cell Biol. 2002;4:798–805. doi: 10.1038/ncb858. [DOI] [PubMed] [Google Scholar]
- Rhee J, Buchan T, Zukerberg L, Lilien J, Balsamo J. Cables links Robo-bound Abl kinase to N-cadherin-bound beta-catenin to mediate Slit-induced modulation of adhesion and transcription. Nat Cell Biol. 2007;9:883–892. doi: 10.1038/ncb1614. [DOI] [PubMed] [Google Scholar]
- Richards LJ. Surrounded by Slit–how forebrain commissural axons can be led astray. Neuron. 2002;33:153–155. doi: 10.1016/s0896-6273(02)00566-4. [DOI] [PubMed] [Google Scholar]
- Sánchez-Camacho C, Bovolenta P. Autonomous and non-autonomous Shh signalling mediate the in vivo growth and guidance of mouse retinal ganglion cell axons. Development. 2008;135:3531–3541. doi: 10.1242/dev.023663. [DOI] [PubMed] [Google Scholar]
- Sánchez-Camacho C, Bovolenta P. Emerging mechanisms in morphogen-mediated axon guidance. Bioessays. 2009;31:1013–1025. doi: 10.1002/bies.200900063. [DOI] [PubMed] [Google Scholar]
- Selleck SB. Proteoglycans and pattern formation: sugar biochemistry meets developmental genetics. Trends Genet. 2000;16:206–212. doi: 10.1016/s0168-9525(00)01997-1. [DOI] [PubMed] [Google Scholar]
- Serafini T, Colamarino SA, Leonardo ED, Wang H, Beddington R, Skarnes WC, Tessier-Lavigne M. Netrin-1 is required for commissural axon guidance in the developing vertebrate nervous system. Cell. 1996;87:1001–1014. doi: 10.1016/s0092-8674(00)81795-x. [DOI] [PubMed] [Google Scholar]
- Shu T, Shen WB, Richards LJ. Development of the perforating pathway: an ipsilaterally projecting pathway between the medial septum/diagonal band of Broca and the cingulate cortex that intersects the corpus callosum. J Comp Neurol. 2001;436:411–422. doi: 10.1002/cne.1077. [DOI] [PubMed] [Google Scholar]
- Shu T, Puche AC, Richards LJ. Development of midline glial populations at the corticoseptal boundary. J Neurobiol. 2003a;57:81–94. doi: 10.1002/neu.10252. [DOI] [PubMed] [Google Scholar]
- Shu T, Sundaresan V, McCarthy MM, Richards LJ. Slit2 guides both precrossing and postcrossing callosal axons at the midline in vivo. J Neurosci. 2003b;23:8176–8184. doi: 10.1523/JNEUROSCI.23-22-08176.2003. [DOI] [PMC free article] [PubMed] [Google Scholar]
- Silver J, Ogawa MY. Postnatally induced formation of the corpus callosum in acallosal mice on glia-coated cellulose bridges. Science. 1983;220:1067–1069. doi: 10.1126/science.6844928. [DOI] [PubMed] [Google Scholar]
- Silver J, Lorenz SE, Wahlsten D, Coughlin J. Axonal guidance during development of the great cerebral commissures: descriptive and experimental studies, in vivo, on the role of preformed glial pathways. J Comp Neurol. 1982;210:10–29. doi: 10.1002/cne.902100103. [DOI] [PubMed] [Google Scholar]
- Smith KM, Ohkubo Y, Maragnoli ME, Rasin MR, Schwartz ML, Sestan N, Vaccarino FM. Midline radial glia translocation and corpus callosum formation require FGF signaling. Nat Neurosci. 2006;9:787–797. doi: 10.1038/nn1705. [DOI] [PubMed] [Google Scholar]
- Thompson H, Barker D, Camand O, Erskine L. Slits contribute to the guidance of retinal ganglion cell axons in the mammalian optic tract. Dev Biol. 2006;296:476–484. doi: 10.1016/j.ydbio.2006.06.017. [DOI] [PubMed] [Google Scholar]
- Thompson H, Andrews W, Parnavelas JG, Erskine L. Robo2 is required for Slit-mediated intraretinal axon guidance. Dev Biol. 2009;335:418–426. doi: 10.1016/j.ydbio.2009.09.034. [DOI] [PMC free article] [PubMed] [Google Scholar]
- Tole S, Gutin G, Bhatnagar L, Remedios R, Hébert JM. Development of midline cell types and commissural axon tracts requires Fgfr1 in the cerebrum. Dev Biol. 2006;289:141–151. doi: 10.1016/j.ydbio.2005.10.020. [DOI] [PubMed] [Google Scholar]
- Trousse F, Martí E, Gruss P, Torres M, Bovolenta P. Control of retinal ganglion cell axon growth: a new role for Sonic hedgehog. Development. 2001;128:3927–3936. doi: 10.1242/dev.128.20.3927. [DOI] [PubMed] [Google Scholar]
- Turnbull J, Powell A, Guimond S. Heparan sulfate: decoding a dynamic multifunctional cell regulator. Trends Cell Biol. 2001;11:75–82. doi: 10.1016/s0962-8924(00)01897-3. [DOI] [PubMed] [Google Scholar]
- Walz A, McFarlane S, Brickman YG, Nurcombe V, Bartlett PF, Holt CE. Essential role of heparan sulfates in axon navigation and targeting in the developing visual system. Development. 1997;124:2421–2430. doi: 10.1242/dev.124.12.2421. [DOI] [PubMed] [Google Scholar]