

Abstract
Application of phorbol 12,13-diacetate (PDA) caused marked enhancement of synaptic transmission of nociceptive parabrachio-amygdaloid (PBA) input onto neurons of the capsular central amygdaloid (CeAC) nucleus. The potentiation of PBA–CeAC EPSCs by PDA involved a presynaptic protein kinase C (PKC)-dependent component and a postsynaptic PKC–extracellular-regulated kinase (ERK)-dependent component. NMDA glutamatergic receptor (NMDAR)-dependent long-term potentiation (LTP) of PBA–CeAC EPSCs, which was also dependent on the PKC–ERK signaling pathway, was induced by tetanus stimulation at 100 Hz. In slices from mice subjected to acid-induced muscle pain (AIMP), phosphorylated ERK levels in the CeAC increased, and PBA–CeAC synaptic transmission was postsynaptically enhanced. The enhanced PBA–CeAC synaptic transmission in AIMP mice shared common mechanisms with the postsynaptic potentiation effect of PDA and induction of NMDAR-dependent LTP by high-frequency stimulation in normal slices, both of which required ERK activation. Since the CeAC plays an important role in the emotionality of pain, enhanced synaptic function of nociceptive (PBA) inputs onto CeAC neurons might partially account for the supraspinal mechanisms underlying central sensitization.
Introduction
Chronic pain is characterized by postinjury pain hypersensitivity, which might result from altered synaptic functions of nociceptive pathways in the CNS, an effect known as central sensitization (Ji et al., 2003). Long-term potentiation (LTP) is a use-dependent change in synaptic efficacy that is generally accepted as a cellular substrate for information storage in the brain (Bliss and Collingridge, 1993). LTP has been demonstrated at synapses of nociceptive inputs on dorsal horn (DH) neurons in the spinal cord (Ikeda et al., 2003). In the anterior cingulate cortex, in which most neurons respond to both noxious and non-noxious stimuli, LTP-like synaptic changes occur locally after peripheral injury (Wei and Zhuo, 2001; Zhuo, 2007). These plastic changes in synaptic function in the pain-related CNS areas are considered to be a part of the cellular mechanisms underlying the development of central sensitization in chronic pain (Ji et al., 2003). At some cortical synapses, LTP induction requires activation of extracellular signal-regulated kinase (ERK) (Impey et al., 1999; Giovannini et al., 2001; Lin et al., 2003, 2006). Since a biochemical hallmark of chronic pain is increased levels of phosphorylated ERK (pERK) in the DH (Ji et al., 1999; Garry et al., 2005; Wei et al., 2006) (for review, see Ji et al., 2009), it is likely that ERK activity triggered by repeated and excessive noxious stimuli might induce LTP of nociceptive inputs onto DH neurons, thereby resulting in central sensitization.
The development of pain-like behavioral hypersensitivity is usually associated with emotionality, which requires activation of high brain regions, such as the amygdala, a limbic structure that plays a key role in the emotional evaluation of sensory stimuli, including pain (Davis, 1998; LeDoux, 2000; Zald, 2003, Neugebauer et al., 2004). Neuroimaging studies have repeatedly identified pain-related signal changes in the amygdala when painful stimuli are administered to human subjects (Bingel et al., 2002; Bornhövd et al., 2002). Using a formalin-induced pain model, Carrasquillo and Gereau (2007) showed increased levels of pERK in capsular central amygdaloid nucleus (CeAC). They also showed that direct injection into the CeAC of an ERK activator [phorbol 12,13-diacetate (PDA)] or blocker (U0126) respectively increases or reduces behavioral hypersensitivity in normal animals or those with formalin-induced pain. Recently, Chen et al. (2010) also showed increased levels of pERK in the central nucleus of the amygdala in the acid-induced muscle pain (AIMP). These studies suggest that ERK activation in the CeAC is directly involved in central sensitization.
The CeAC consists of many nociceptive neurons (Bernard et al., 1992, 1996; Neugebauer et al., 2004) and receives nociceptive-related fibers from the parabrachial area via the parabrachio-amygdaloid (PBA) pathway (Bernard et al., 1996; Gauriau and Bernard, 2002). In neuropathic and arthritic pain models, synaptic transmission of the PBA pathway on CeAC neurons (referred as to PBA–CeAC synapses) is enhanced (Neugebauer et al., 2003; Ikeda et al., 2007). However, whether such a change in efficacy of PBA–CeAC synapses is related to the reported elevation of ERK activity in the CeAC in animals with behavioral hypersensitivity (Carrasquillo and Gereau, 2007; Chen et al., 2010) remains unclear. We addressed this issue by examining the effect of an ERK activator, PDA, on the function of PBA–CeAC synapses and the interactions of ERK activation and LTP expression at these synapses in slices from normal mice and mice subjected to AIMP.
Materials and Methods
Animals.
The use of animals in this study was approved by the Ethical Committee for Animal Research of the National Taiwan University. C57BL/6 mice of either sex aged 8–12 weeks were used. In one series of experiments, the AIMP model was established according to the protocol of Sluka et al. (2001). On the day of the experiment (defined as D0), baseline mechanical sensitivity was measured using a Von Frey filament with a force of 9.8 mN. The filament was applied 10 times to the left and right hindpaws and mechanical sensitization assessed by measuring the incidence of observed withdrawal behavior. The mice were anesthetized with 1.5–2% isoflurane in O2, and 20 μl of acidic saline, pH 4.0, was injected into the left gastrocnemius muscle, then mechanical sensitization was assessed after 4 and 24 h. On D3 (3 d after D0), mechanical sensitization was assessed and the animals were reanesthetized and a second dose of acidic saline given, then mechanical sensitization was assessed 4 h later and on D4, D6, D10, and D14. In the control group, the protocols were the same except that 20 μl of neutral saline, pH 7.2, was injected. The pH of the saline (0.9% NaCl) in 0.01 m 2-[N-morpholino]ethanesulfonic acid (MES) or HEPES base was adjusted with 0.1 m HCl or NaOH.
Preparation of amygdala slices and electrophysiology.
The mice were decapitated and their brains rapidly removed and placed in ice-cold artificial CSF (ACSF), containing the following (in mm): 119 NaCl, 2.5 KCl, 1.3 MgSO4, 26.2 NaHCO3, 1 NaH2PO4, 2.5 CaCl2, and 11 glucose, with the pH adjusted to 7.4 by gassing with 95% O2/5% CO2. Coronal slices (300 μm thick) containing the central and basolateral amygdala and ventral amygdaloid tract (VAT) (see supplemental Fig. 1A,B, available at www.jneurosci.org as supplemental material) were cut using a vibroslicer (ZERO 1, DSK). Slices cut from the right and left amygdala were used for recording unless specified and were kept in oxygenated ACSF (95% O2/5% CO2) at room temperature (24–25°C) to allow recovery for at least 90 min before recording commenced.
Slices were transferred to an immersion-type recording chamber mounted on an upright microscope (BX50WI, Olympus Optical) equipped with an infrared-differential interference-contrast microscopic video. The VAT, lateral nucleus of the central amygdala (CeAL), and CeAC were clearly identified under low magnification (see supplemental Fig. 1A,B, available at www.jneurosci.org as supplemental material). Neurons in the CeAL and CeAC were recorded under visual guidance with patch pipettes pulled from borosilicate glass (1.5 mm outer diameter, 0.32 mm wall thickness; G150F-4, Warner Instruments). The patch pipettes had a resistance of 3–8 MΩ when filled with a solution consisting of the following (in mm): 131 K-gluconate, 20 KCl, 10 HEPES, 0.2 EGTA, 8 NaCl, 2 ATP, 0.3 GTP, and 6.7 biocytin, with the pH adjusted to 7.2 by KOH and the osmolarity to 300–305 mOsm. Recordings were made at room temperature with an Axopatch 1D amplifier (Molecular Devices). For voltage-clamp recordings, the series resistance (Rs) was continuously monitored by applying a voltage pulse of 1 mV and was usually <20 MΩ and was not compensated for. For current-clamp recordings, the input resistance (Rn) was continuously monitored by applying a current pulse of −30 pA and the bridge was balanced by adjusting the Rs compensation of the amplifier. Data were discarded when the Rs or Rn varied by >20% from its original value during the recording. The membrane potential (Vm) of the recorded neurons was clamped (or held) at −70 mV unless stated otherwise. All signals were low-pass filtered at a corner frequency of 2 kHz and digitized at 10 kHz using a Micro 1401 interface (Cambridge Electronic Design). Data were collected using Signal or Spike2 software (Cambridge Electronic Design). To evoke EPSCs or EPSPs, slices were continuously perfused with ACSF containing 0.1 mm picrotoxin after transfer to the recording chamber to block GABAA receptor-mediated currents. A bipolar stainless-steel electrode (FHC) was placed in the VAT to stimulate EPSCs or EPSPs by delivering a stimulating current pulse of 20 μs duration and 100–300 μA intensity at 0.1 Hz. For paired-pulse stimulation, two pulses of the same intensity was given at 0.067 Hz with an interpulse interval of 50 ms. For the LTP experiments, recordings were made in current-clamp mode and three trains of 100 stimuli at 100 Hz separated by 30 s were applied for LTP induction.
Drugs.
The chemicals used for the ACSF and internal solution were purchased from Merck. dl-APV, DNQX, and TTX were purchased from Tocris Cookson. Chelerythrine, MgATP, NaGTP, BAPTA, picrotoxin, PDA, U0124, and U0126 were purchased from Sigma. All drugs were added to the ACSF and bath applied.
Data and statistical analyses.
The amplitudes of the EPSCs and EPSPs were measured and normalized to the average value of the baseline responses, and the average EPSC and EPSP amplitudes recorded 15–20 min after PDA application or 25–30 min after LTP induction were used for statistical comparisons. A paired t test was used to compare responses before (baseline) and after PDA application or LTP induction. One-way ANOVA was used to compare the pooled results for different experimental conditions in which drugs were added to the ACSF to test their effect on PDA application or LTP induction. To analyze miniature EPSC (mEPSC) activity, the amplitude and interevent interval were measured using Mini Analysis software (Synaptosoft) and the Kolmogorov–Smirnov (K–S) test was used for statistical comparison of the amplitude and interevent intervals. To analyze asynchronous EPSCs (aEPSCs), two windows with a 500 ms duration were symmetrically placed 3 ms before and after the stimulating artifice (SA), and the number of mEPSC-like events following synchronous EPSCs within the second window and the number of spontaneous EPSC within the first window were counted. The number of aEPSCs was estimated by subtracting the number of events counted in the first window (the estimated number of randomly occurring events) from that counted in the second window. The amplitude was measured for aEPSCs with a rising phase not contaminated by other events. The paired-pulse ratio (PPR) was measured as the ratio of the response evoked by a second pulse to that evoked by the first pulse. All data are presented as the mean ± SEM. The criterion for significance was p < 0.05.
Cannulation and microinfusion.
The animals were anesthetized by intraperitoneal injection of a mixture of ketamine (17.5 mg/kg) and xylazine (5 mg/kg) and mounted in a stereotaxic frame. A 23 gauge stainless steel cannula (8 mm) was implanted above the right amygdala (coordinates: anteroposterior: −1.7 mm, lateral: +2.6 mm, depth: 3.7 mm from the bregma) and fixed to the skull with dental cement. A stainless steel flush-fitting stylet was inserted into the cannula, and the animal was returned to its cage for recovery. The animals were subject to acidic saline injections as described above, except that U0126 or vehicle was infused into central amygdala before second acidic saline injection. Briefly, on D3, the stylet was removed and an infusion cannula (30 gauge, 8.5 mm) inserted and 0.3 μl of 1.5 mm U0126 or vehicle (50% DMSO in saline) infused into the right central amygdala over a period of 3 min using a syringe pump and a 10 μl Hamilton syringe connected to the infusion cannula with PE10 tubing (Portex), then the injection cannula was left in place for another 3 min to allow drug diffusion. The second injection of acidic saline was given 3 min after the injection cannula was withdrawn.
Western blotting.
Control or AIMP mice were decapitated 10 min after the second injection of acidic or neutral saline, and brain slices were cut (see above, Preparation of amygdala slices and electrophysiology) and both sides of the CeAC punched out and frozen on dry ice. The brain tissue samples were lysed in extraction buffer [1× cell lysis buffer (Cell Signaling Technology), 1 μg/ml leupeptin, 1 μg/ml aprotinin, 2 mm PMSF, 1 mm glycerol-2-phosphate, 0.5 mm Na3VO4, and 5 mm NaF] and centrifuged at 16,100 × g for 30 min at 4°C, then the supernatant was collected and the protein concentration determined using a BCA Protein Assay kit (Pierce) with bovine serum albumin (BSA) as the standard. Samples (30 μg of protein) were separated by 10% SDS-PAGE and transferred to a nitrocellulose membrane (Bio-Rad Laboratories), which was then blocked for 1 h at room temperature with TTBS (50 mm Tris-HCl, pH 7.5, 0.15 m NaCl, and 0.1% Tween 20) containing 5% BSA and 5% nonfat milk, then incubated overnight at 4°C with rabbit polyclonal antibodies against p44/42 MAPK (ERK1/2) (1:1000, Cell Signaling Technology) or rabbit monoclonal antibody against phospho-p44/42 MAPK (pERK1/2) (1:500, Cell Signaling Technology) in TTBS, then sequentially for 1 h at room temperature with goat anti-rabbit IgG antibodies (Vector Laboratories), followed by avidin–biotinylated horseradish peroxidase (HRP) complex (Vector Laboratories) in TTBS. Bound antibodies were detected using an enhanced chemiluminescence (ECL) detection system (Fujifilm) and the intensities of the bands quantified using the ImageGauge program (Fujifilm Software). All Western blot quantification results were normalized to the levels of the same protein in the amygdala of controls (e.g., vehicle-treated) and expressed as a “fold control” value.
Histochemistry.
In all experiments, the recorded neuron was filled by passive diffusion of biocytin from the patch pipette during the recording period. After recording, the slices were fixed with 4% paraformaldehyde and the recorded neurons viewed by reacting the injected biocytin with an avidin–biotinylated HRP complex (Vector Laboratories), with 3,3′-diaminobenzidine (DAB) as the chromogen. The location of the recorded neuron was checked by light microscopy and data collected from neurons outside the CeAC discarded. For pERK immunohistochemistry (IHC), the animals were deeply anesthetized and sequentially perfused through the left ventricle with PBS (0.9% NaCl in 0.01 m phosphate buffer, pH 7.4), then with 10% formaldehyde in 0.1 m phosphate buffer, then the brains were rapidly removed, placed in the same fixative at 4°C for 3–4 h, stored overnight in cold (4°C) 0.1 m phosphate buffer, and embedded in paraffin blocks. Coronal brain sections (5 μm thick) containing the amygdala and surrounding regions were cut, mounted on gelatin-coated slides, and incubated in boiling 0.01 m citric acid for 40 min for antigen retrieval. They were then treated with 3% H2O2 for 10 min, incubated for 1 h with 0.05% Tween 20 in PBS (TPBS) containing 2% BSA and 2% normal goat serum, then incubated overnight at 4°C with anti-pERK antibody (1:100 in TPBS, Cell Signaling Technology) and for 1 h at room temperature with biotinylated anti-rabbit IgG antibodies (Vector Laboratories) diluted 1/200 in TPBS. They were then incubated for 1 h with avidin–biotin HRP complex (ABC; Vector Laboratories) and stained using DAB as the chromogen. The staining results were examined and photographed under bright-field microscopy. In one series of experiments, after pERK staining, sections from three AIMP and three control mice were stained for NeuN, a neuronal marker protein, using the same method as above except that the primary antibodies were anti-NeuN antibodies (1:1000, Millipore Bioscience Research Reagents), and the ABC-AP method (Vectastain ABC-AP KIT, Vector Laboratories) was used for signal detection. Neurons that were only NeuN-immunoreactive (ir) or both NeuN-ir and pERK-ir were counted, and the ratio was calculated. For each mouse, neurons in both the right and the left CeAC were counted in three sections, and the averaged percentage was taken.
For DiI tracing, animals were perfused with 4% paraformaldehyde as described above (n = 3 animals), then the brains were removed and blocks prepared between bregma −6.5 and 1 according to Paxinos and Franklin (1997). The brain blocks were then glued to the stage of a vibrating tissue slicer (Campden Instruments) via the rostral surface and 100 μm coronal sections of the midbrain cut. As each section was cut, it was immediately examined by stereomicroscopy and sectioning was stopped when the superior cerebellar peduncle (spc) was identified at the level of about bregma −5.3. The brain blocks were then transferred to a stereoscopic dissecting microscope and a small amount of DiI crystal (Invitrogen) applied using a micropipette to the lateral parabrachial nuclei, located dorsal to the spc (Fig. 1). The brain blocks were placed in 4% paraformaldehyde and incubated at 37°C for 4–6 months, then coronal sections (100 μm) containing the central amygdala were cut with the vibrating tissue slicer and examined by confocal microscopy (Axioplan 2, Zeiss).
Figure 1.
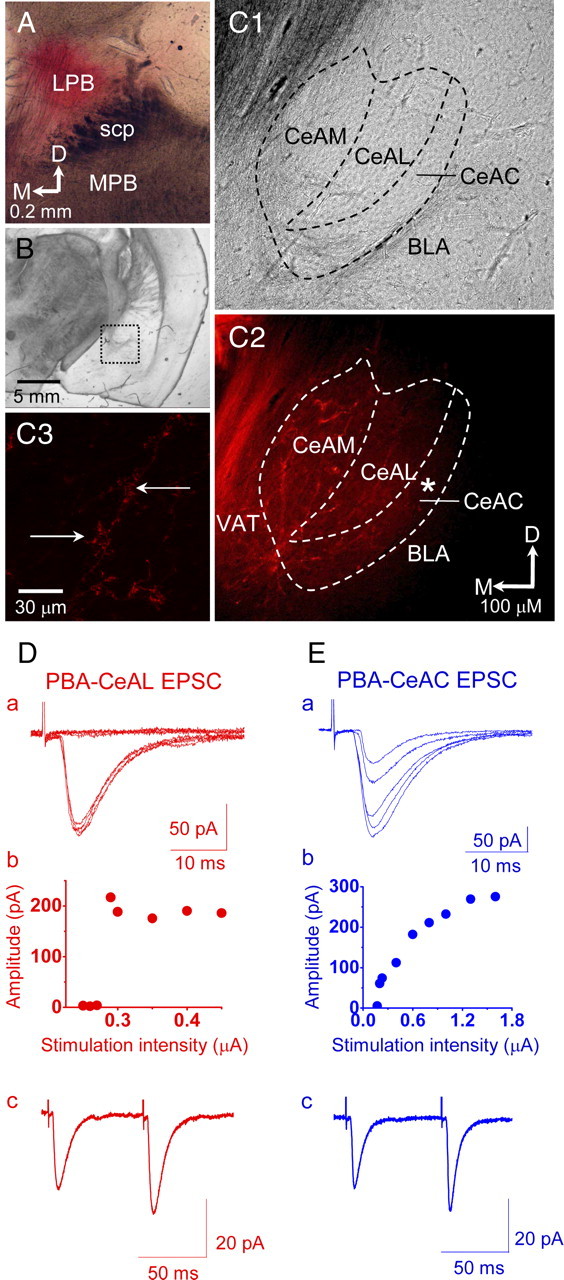
Recording of PBA–CeAL and PBA–CeAC EPSCs in naive mice. A, Light microscopy photograph showing a section cut through the parabrachial area and the application site of a small amount of DiI crystals in the lateral parabrachial nuclei (LPB). B, Light microscopic photograph showing a section cut through the amygdala at low magnification. The dotted rectangular area is shown at high magnification in C. C, Light microscopy (C1) and confocal microscopy (C2) photographs showing the amygdala at high magnification. Note the DiI-labeled fibers in the VAT and the nuclei of the central amygdala (C2). The asterisk in C2 indicates the area shown at high magnification in C3. Note the DiI-labeled fibers and associated varicosity-like structures in the CeAC (C3). All data shown in A–C are from the same brain block. scp, Superior cerebellar peduncle; MPB, medial PB; CeAM, medial central amygdala; BLA, basolateral amygdala; D, dorsal; M, medial. D, EPSCs evoked in a CeAL neuron by stimulating the VAT, showing the all-or-none feature of the stimulation intensity/response relationship (a, b) and paired-pulse facilitation (c). E, EPSCs evoked in a CeAC neuron without changing the position of the stimulating electrode, showing an increased response with increased intensity (a, b) and paired-pulse facilitation (c). The recordings shown in D and E are from the same slice.
Results
Recording of CeAC neurons and PBA–CeAC EPSCs
Based on the firing patterns, we categorized neurons recorded in the CeAC into two types (supplemental Fig. 1C,D, available at www.jneurosci.org as supplemental material). Type I neurons, which accounted for 77% of all recorded neurons in the CeAC, showed a prominent delay in firing the first action potential (AP) on injection of depolarizing current pulses and a voltage sag on injection of hyperpolarizing current pulses (supplemental Fig. 1C1, available at www.jneurosci.org as supplemental material). Morphologically, type I CeAC neurons had 6 ± 0.6 primary dendrites, each of which had, on average, 2.4 ± 0.37 branch nodes (n = 9 neurons for each value) (supplemental Fig. 1C2,C3, available at www.jneurosci.org as supplemental material). Type II neurons, which accounted for 23% of all recorded CeAC neurons, did not show a delay in the firing of the AP or a voltage sag (supplemental Fig. 1D1, available at www.jneurosci.org as supplemental material) and had 5.8 ± 0.9 primary dendrites, each of which had, on average, 2.5 ± 0.39 branch nodes (n = 6 neurons for each value) (supplemental Fig. 1D2,D3, available at www.jneurosci.org as supplemental material). No significant difference was found in the Rn between the two types of CeAC neurons (type I 155 ± 2.6 MΩ, type II 165 ± 17.8 MΩ). Since type I neurons accounted for the vast majority of the recorded CeAC neurons and their morphological and physiological properties resembled those of previously reported projection neurons of the CeAC (Chieng et al., 2006), the data shown in the rest of this study were obtained from type I neurons, and these are referred to as CeAC neurons.
Application of DiI crystals to the lateral parabrachial nuclei of paraformaldehyde-fixed brains labeled fibers in the VAT, located ventromedially to the central amygdala (Fig. 1A–C). In addition, DiI-labeled fibers with varicosity-like structures were also found in all nuclei of the central amygdala (Fig. 1C). These results showed that nociceptive signals from the parabrachial nuclei enter the central amygdala through the VAT, which is consistent with observations made in rats (Delaney et al., 2007). Since Delaney et al. (2007) showed that EPSCs evoked in neurons of the CeAL by stimulating the VAT (referred to as PBA–CeAL EPSCs) displayed paired-pulse facilitation and an all-or-none feature of the stimulation-intensity/response relationship, we first made whole-cell recordings from CeAL neurons and evoked PBA–CeAL EPSCs by stimulating the VAT and found that the evoked EPSCs showed both an all-or-none feature of the stimulation-intensity/response relationship and paired-pulse facilitation (Fig. 1Db,Dc). Overall, these DiI tracings and physiological observations showed that the fibers carrying nociceptive signals from the parabrachial nuclei to the central amygdala run through the VAT in mice, as in rats, and that some physiological properties of PBA–CeAL EPSCs are consistent in these two species. After recording CeAL neurons, we then recorded CeAC neurons in the same slice without changing the position of the stimulating electrode. EPSCs evoked in CeAC neurons by stimulating the VAT did not show the all-or-none response, but showed a gradual increase in amplitude with increasing stimulation intensity (Fig. 1Eb), and also showed facilitation when paired-pulse stimulation was delivered (Fig. 1Ec). Since these features are consistent with previously reported properties of synaptic transmission of the PBA pathway onto CeAC neurons (referred to as PAB-CeAC EPSCs) in mice (Neugebauer et al., 2003; Ikeda e al., 2007) and since the properties of PBA–CeAL EPSCs recorded in the present study and a previous study were consistent (Delaney et al., 2007), we are confident that our recording of PBA–CeAC EPSCs was reliable.
Application of PDA enhances PBA–CeAC EPSCs through PKC- and PKC–ERK-dependent pathways
Following the establishment of PBA–CeAC EPSCs recording, we examined the role for ERK in modulating the efficacy of PBA–CeAC synapse by testing the effect of PDA, a PKC–ERK activator. Application of PDA dramatically and significantly enhanced PBA–CeAC EPSCs in a dose-dependent manner, with an EC50 of 1.41 μm (Fig. 2A,B). Since the potentiation caused by 3 μm PDA (396 ± 56% of baseline, n = 7 cells, p < 0.01, paired t test) was at the top of the linear part of the response curve (Fig. 2A,B), this concentration was used in all subsequent experiments unless otherwise specified. In slices bathed with 50 μm PD98059 (Fig. 2C1), an inhibitor of MEK (mitogen-activated protein kinase/ERK kinase), or pretreated with 10 μm (Fig. 2C2) or 50 μm (Fig. 2C3) U0126, a more selective MEK inhibitor, PDA application still resulted in significant potentiation of PBA–CeAC EPSCs (PD98059: 167 ± 12% of baseline, n = 6 cells, p < 0.01; 10 μm U0126: 181 ± 16% of baseline, n = 6 cells, p < 0.01; 50 μm U0126: 217 ± 9% of baseline, n = 6 cells, p < 0.001; all tested using the paired t test). However, the amount of potentiation by PDA in these three experimental conditions was significantly smaller than in the control (p < 0.05 for three conditions, ANOVA test) (Fig. 2G). In slices pretreated with U0124 (Fig. 2C4), an inactive analog of U0126, PDA application resulted in potentiation of 323 ± 53% of baseline (n = 6 cells, p < 0.001 in the paired t test compared to baseline,), which was not significantly different from the control results, but was significantly larger than that for slices bathed in PD98059 or pretreated with U0126 (p < 0.05, ANOVA test) (Fig. 2G). In slices pretreated with U0126, then bathed in 10 μm chelerythrine, a PKC inhibitor, to block both ERK and PKC, the potentiation by PDA was only 106 ± 30% of baseline (n = 5 cells) (Fig. 2D, white diamond), not significantly different from the baseline (p = 0.51, paired t test) and significantly smaller than that in slices bathed in PD98059 or pretreated with 50 μm U0126 (p < 0.05, ANOVA test) (Fig. 2G). When chelerythrine was applied alone to block PKC, potentiation by PDA was only 103 ± 4% of baseline (n = 4 cells) (Fig. 2D, black diamond), similar to that in slices cotreated with U0126 (Fig. 2G). Together, these results showed that potentiation of PBA–CeAC EPSCs by application of PDA involved PKC-dependent and PKC–ERK-dependent components. Blocking of NMDA glutamatergic receptors (NMDARs) by addition of 50 μm APV, a selective NMDAR blocker, to the bath did not significantly alter the effect of PDA (344 ± 63% of baseline) (Fig. 2E) compared to the control (Fig. 2G) (p = 0.24, ANOVA). Intracellular perfusion of CeAC neurons with 10 mm BAPTA, a calcium chelator, through patch pipettes attenuated the potentiation by PDA to 225 ± 25% of baseline (n = 5 cells, p < 0.01, paired t test) (Fig. 2F), significantly less than in the control (p < 0.01, ANOVA) (Fig. 2G). These results showed that PDA potentiation of PBA–CeAC EPSCs was also partially dependent on an increase in the cytosolic calcium concentration in postsynaptic neurons, but independent of NMDAR activation.
Figure 2.

PDA application potentiates PBA–CeAC EPSCs. A, B, Effect of bath application of 3 μm PDA (A) and the dose-dependent effect of PDA (B) on PBA–CeAC EPSCs. In A1, traces shown are an overlay of representative raw data recorded at baseline, during 3 μm PDA application, and during washout. In A2, the dotted lines and symbols plus solid lines in the plot are individual and summarized results, respectively. C–F, The upper traces are an overlay of representative raw data recorded at the baseline, during PDA application, and after washout; the trace in D is for pretreatment with U0126 and chelerythrine. The time and amplitude scales shown in C1 also apply to C2–C4, and those shown in D also apply to E and F. The dotted lines and the symbols plus solid lines in the lower plot are individual and summarized results, respectively. C, Effect of addition of PD98059 (C1) or pretreatment of slices with 10 μm (C2) or 50 μm (C3) U0126 or 10 μm U0124 (C4) on potentiation by PDA. D–F, Potentiation by PDA in chelerythrine-bathed slices (black diamonds) or chelerythrine-bathed plus U0126-pretreated slices (white diamonds) (D), APV-bathed slices (E), or neurons intracellularly perfused with BAPTA (F). G, Summarized result and statistical comparisons. The asterisks indicate a statistical comparison of the test result and baseline results using the paired t test, while # indicates statistical comparison with the result for PDA under control conditions, • comparison with U0124 treatment, and ″ comparison with U0126 (10 or 50 μm) or PD98059 by one-way ANOVA. A single symbol indicates p < 0.05, two symbols p < 0.01, and three symbols p < 0.001.
PDA application enhances PBA–CeAC EPSCs through PKC-dependent presynaptic and PKC–ERK-dependent postsynaptic modulation
We next investigated the sites at which PDA modulated PBA–CeAC EPSCs. Since PDA has been shown to enhance glutamate release at many synapses in the brain (Malenka et al., 1986; Shapira et al., 1987; Parfitt and Madison, 1993; Capogna et al., 1997; Hori et al., 1999; Francis et al., 2002; Lou et al., 2008), we tested its effect on the PPR of PBA–CeAC EPSCs, an approach that is sensitive to presynaptic modulation (Zucker and Regehr, 2002). As shown in Figure 3, A and B, the PDA-induced potentiation of PBA–CeAC EPSCs was associated with a decrease in the PPR (baseline PPR 1.42 ± 0.33, PPR during PDA application 0.73 ± 0.32; n = 5 cells, p < 0.001, paired t test), showing presynaptic modulation by PDA. In slices pretreated with 50 μm U0126, PDA application still decreased the PPR (1.33 ± 0.09 at baseline vs 0.67 ± 0.05 during PDA application; n = 5 cells, p < 0.001, paired t test) (Fig. 3A,B). These results showed that blockade of ERK activity did not alter the effect of PDA on PPR and suggested that the PKC–ERK-dependent component of potentiation by PDA was not presynaptic. Together, these results and the fact that the potentiation by PDA was significantly reduced by intracellular perfusion of BAPTA into postsynaptic neurons (Fig. 2F,G) suggested that postsynaptic modification might be involved. To test this possibility, we examined the effect of PDA on mEPSCs in CeAC neurons. When 1 μm TTX, a selective voltage-dependent sodium channel blocker, was added to the bath to block AP-dependent spontaneous EPSC activity, the average mean frequency and amplitude of the mEPSCs from five CeAC neurons were 3.2 ± 0.6 Hz and 12.1 ± 0.9 pA, respectively (Fig. 3C,D). PDA application in the presence of TTX significantly increased the mean frequency to 17.6 ± 3.5 Hz and the amplitude to 17.0 ± 2.0 pA (n = 5 cells; p < 0.01 for both, K–S test) (Fig. 3C,D), showing that PDA potentiation of PB-CeAC EPSCs involved both presynaptic (increasing mEPSC frequency) and postsynaptic (increasing mEPSC amplitude) modulation. Since mEPSCs originate not only from the PBA, but also other inputs on CeAC neurons, to determine whether postsynaptic modulation by PDA occurred at PBA–CeAC synapses, we tested the effect of PDA application on evoked EPSCs in recording conditions in which extracellular Ca2+ was replaced with 4 mm Sr2+ to cause asynchronous release of glutamate from axonal terminals, thereby resulting in aEPSCs, the unitary events comprising synchronous EPSCs evoked at a normal calcium concentration (Oliet et al., 1996; Xu-Friedman and Regehr, 2000). Under these conditions, PDA application increased the number of spontaneous events and the number of evoked aEPSCs in CeAC neurons (Fig. 4A). The estimated mean number of aEPSCs after correcting for the number of spontaneous events was 2.5 ± 0.4 events/trial in the controls (n = 6 cells) and 9.4 ± 1.0 events/trial (p < 0.01, paired t test) in the PDA-treated slices (Fig. 4A,D). Likewise, the mean amplitude of the aEPSCs at PBA–CeAC synapses was 8.9 ± 0.5 pA in controls and 11.6 ± 0.8 pA (p < 0.05; paired t test) in PDA-treated slices (Fig. 4A,C). These results showed that both presynaptic (increasing aEPSC event incidence) and postsynaptic (increasing aEPSC amplitude) modulation of PDA occurred with parabrachial input to CeAC neurons. When the same experiments were repeated in slices pretreated with U0126 to block ERK activity, PDA application did not result in any significant change in the mean amplitude of the aEPSCs in five of five cells tested (K–S test) (Fig. 4B), the average mean amplitudes at baseline and after PDA application being 9.0 ± 0.6 and 9.5 ± 0.9 pA (Fig. 4B,C), but still resulted in a robust increase in the mean incidence of aEPSCs similar to that in the control (p < 0.001, ANOVA test) (Fig. 4B), the average mean incidences at baseline and after PDA application being 1.9 ± 0.2 and 7.4 ± 0.4 events/trial, respectively (n = 5 cells) (Fig. 4B,D). Overall, these results showed that, while presynaptic modulation by PDA was independent of ERK activation, as the increase in the number of aEPSC events was not affected by U0126, postsynaptic modulation by PDA was dependent on ERK activation, as the increase in aEPSC amplitude was blocked by U0126.
Figure 3.

The potentiation effect of PDA application on PBA–CeAC EPSCs involves both presynaptic and postsynaptic modulation. A, Representative raw data recorded from CeAC neurons showing responses to paired-pulse stimulation at baseline and during PDA application in control (upper traces) and U0126-pretreated (lower traces) slices. Normalizing the response to that for the first pulse revealed a decrease in the PPR caused by PDA application. B, Summarized results (symbol plus solid line) showing that PDA application significantly decreased the PPR in control (top) and U0126-pretreated (bottom) slices. The dotted lines show results of individual experiments. For comparison, summarized results for control slices (filled circles) are superimposed on the results for the U0126-pretreated slices (white circles). C, Effects of PDA application on mEPSCs. C1, Representative raw data recorded from a CeAC neuron showing recording of mEPSCs at baseline (top three traces) and during PDA application (bottom three traces). C2, C3, Cumulative distribution of analyzed amplitudes (C2) and interevent intervals (C3) of mEPSCs showing a significant decrease in the interevent interval and an increase in the amplitude on PDA application (K–S test). All the data shown in C are from the same neuron. D, Summarized results from five cells showing a significant increase in the mean amplitude (left plot) and mean frequency (reciprocal of the interevent interval) (right plot). The asterisks indicate a statistical comparison with the baseline result using the paired t test (*p < 0.05, **p < 0.01, and ***p < 0.001).
Figure 4.
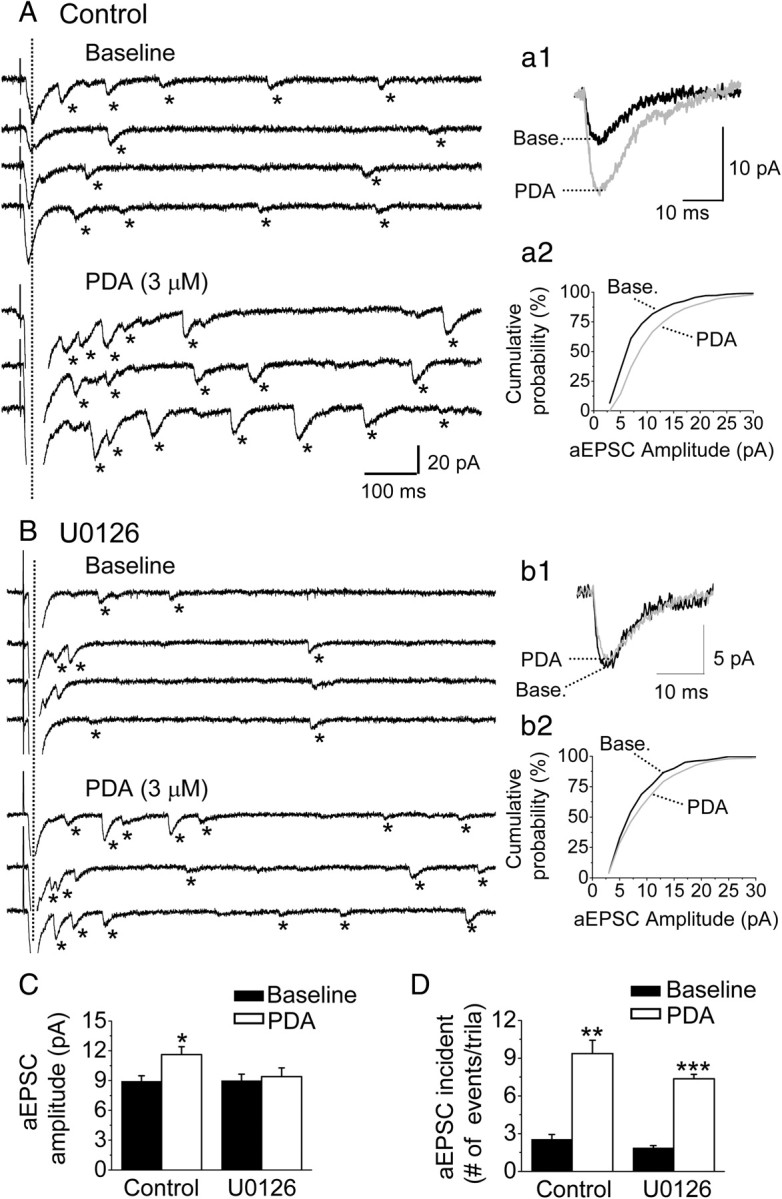
Postsynaptic enhancement of PBA–CeAC EPSCs by PDA application depends on the PKC–ERK signaling pathway. A, B, Effect of PDA application on aEPSCs in control slices (A) or U0126-pretreated slices (B). The traces are representative raw data for aEPSCs recorded at baseline (top four traces) and during PDA application (bottom three traces). The dotted vertical lines mark the evoked synchronous activity, which was followed by asynchronous events, marked by asterisks. Individual aEPSCs were superimposed and their responses averaged (a1, b1), revealing a marked increase in aEPSC amplitude after PDA application in a control slice (a1), but not a U0126-pretreated slice (b1). The cumulative distribution of the aEPSC amplitude (a2, b2) also revealed a marked increase in the aEPSC amplitude with PDA application in a control slice (a2), but not a U0126-pretreated slice (b2). All data shown in A and B are from the same neuron. C, D, Summarized results from five cells showing a significant increase in the mean amplitude on PDA application in control, but not U0126-pretreated slices (C), and in the mean incidence of aEPSCs on PDA application in both control and U0126-pretreated slices (D). The asterisks indicate a statistical comparison with the baseline result using the paired t test (*p < 0.05, **p < 0.01, and ***p < 0.001).
Enhancement of synaptic transmission in AIMP mice includes PKC–ERK-dependent postsynaptic modulation
Since increased pERK levels in the CeAC result in behavioral hypersensitivity in mice (Carrasquillo and Gereau, 2007; Chen et al., 2010), we compared the effects of ERK activation on the mean incidence and amplitude of PBA–CeAC aEPSCs in slices from AIMP mice and controls. We adopted the AIMP model developed by Sluka et al. (2001), which is generally accepted as an animal model for chronic musculoskeletal pain syndrome, such as fibromyalgia, arthritis, and myofacial pain syndromes. Consistent with the results of a study by Sluka et al. (2001) (see also Chen et al., 2010), injection of acidic saline into the left gastrocnemius muscle induced transient mechanical hypersensitivity, and a second dose of acidic saline given 3 d later produced a long-lasting mechanical hypersensitivity in both hindpaws (n = 6 animals) (Fig. 5A, triangles). Behavioral hypersensitivity was not observed when the two injections of acidic saline were replaced with neutral saline (n = 5 animals) (Fig. 5A, squares). In line with observations by Carrasquillo and Gereau (2007), we also observed a marked increase in the number of neurons in both sides of the CeAC labeled by anti-pERK antibody in AIMP mice (Fig. 5B2a–B2d), but not in neutral saline-injected controls (Fig. 5B1), killed 10 min (Fig. 5B2a–B2c) or 2 h (Fig. 5B2d) after the second injection. To quantify the percentage of CeAC neurons with increased pERK after AIMP, we double stained sections with antibodies against NeuN protein, a neuronal marker, and pERK (Fig. 5C1). In the AIMP mice, the percentage of CeAC neurons showing pERK-ir at 10 min after the second acidic saline injection was 48.2 ± 6.1% for the right CeAC and 47.9 ± 5.0% for the left CeAC (Fig. 5C2) and was almost the same when animals were killed 2 h after the second acidic saline injection (right amygdala: 48.6 ± 1.1%, left amygdala: 47.4 ± 1.2%) (Fig. 5C3). In contrast, in neutral saline-injected control animals, only 4.0 ± 2.5% or 3.1 ± 2.3% of NeuN-ir neurons showed pERK-ir at 10 min after second injection in the right or left CeAC, respectively. Consistent with this, Western blot analysis showed a 3.8 ± 1.2- or 3.9 ± 0.8-fold increase in pERK1 or pERK2, respectively, in the left amygdala of AIMP mice compared to the left amygdala of the neutral saline-injected mice (n = 7, p < 0.05, paired t test), the corresponding values for the right amygdala being 2.5 ± 0.5- and 2.5 ± 0.6-fold (n = 7, p < 0.05, paired t test) (Fig. 5D). After confirming the increase in ERK activity in AIMP mice, we examined whether it had any effect on PBA–CeAC EPSCs. Based on the IHC results, recordings were performed within the 2 h following the second injection in this series of experiments. Since the percentage of pERK-ir neurons in the CeAC after AIMP was similar in the right and left amygdala, slices from both sides were used. In slices taken from neutral saline-injected animals (n = 6 cells from three animals), the mean incidence and amplitude of PBA–CeAC aEPSCs were 2.9 ± 0.3 events/trial and 8.0 ± 0.5 pA at baseline and increased significantly to 10.9 ± 0.6 events/trial and 11.0 ± 0.7 pA after PDA application (p < 0.01 for both, K–S test) (Fig. 6A,C,D). These results showed that PDA application had the same effect on PBA–CeAC aEPSCs in slices from control animals (neutral saline injection) as in slices from naive animals (Fig. 4). In slices taken from AIMP animals (n = 6 cells in three animals), the mean incidence of PBA–CeAC aEPSCs was 2.3 ± 0.3 events/trial at baseline and increased significantly to 9.9 ± 0.7 events/trial after PDA application (p < 0.001, paired t test), whereas the mean amplitude was not significant affected (baseline 11.8 ± 0.9 pA; after PDA application 11.9 ± 1.1 pA) (Fig. 6B–D). It should be noted that the mean amplitudes of the PBA–CeAC aEPSCs recorded at baseline and after PDA application in slices from AIMP animals were similar to those recorded during PDA application, but significantly greater than the values recorded at baseline in slices from neutral saline-injected mice (p < 0.05 for both cases, ANOVA test) (Fig. 6C). These results showed that, in AIMP animals, pERK levels were increased in CeAC neurons and the PKC–ERK-dependent postsynaptic potentiation of PBA–CeAC EPSC by PDA application was occluded, while the PKC-dependent presynaptic enhancement was unaffected. After replacement of the external Ca2+ with Sr2+, we analyzed spontaneous EPSCs recorded during episodes between two consecutive stimuli and found that the mean amplitude (11.9 ± 1.1 pA) and frequency (10.9 ± 2.1 Hz) recorded in slices from acidic saline-injected animals were significantly higher than those recorded in slices from neutral saline-injected control animals (amplitude: 8.0 ± 0.5 pA, frequency: 6.4 ± 0.6 Hz, n = 6 cells; p < 0.05 for both, one-way ANOVA) (Fig. 7). Spontaneous aEPSCs are recorded in the absence of extracellular Ca2+ (replaced by Sr2+), a condition that has the same functional meaning as the recording of mEPSC, in which the AP-triggering Ca2+ influx into presynaptic terminals is blocked by TTX. Accordingly, these observations showed that the strength of the overall synaptic inputs other than the PBA input onto CeAC neurons was also enhanced in AIMP mice, with both presynaptic and postsynaptic modulation being involved. Since previous studies have demonstrated lateralization of behavioral hypersensitivity and CeAC neuronal excitability in rats (Carrasquillo and Gereau, 2008; Ji and Neugebauer, 2009; Kolber et al., 2010), we compared aEPSC recorded from a further four left and four right CeAC neurons in slices from animals with AIMP and tested their responses to PDA application. No significant difference in the mean amplitude and the mean number of events per trial of aEPSC was found between the left and right CeAC neurons, and the values recorded from the right and left CeAC neurons were similar to the pooled data recorded from right and left CeAC neurons shown in Figure 6 (see supplemental Fig. 2, available at www.jneurosci.org as supplemental material). For both right and left CeAC neurons, PDA application increased the mean number of events per trial by an extent similar to that shown in Figure 6, but did not affect the mean amplitude (see supplemental Fig. 2, available at www.jneurosci.org as supplemental material). Overall, the immunostaining, Western blotting, and electrophysiology data suggested that lateralization of behavioral hypersensitivity and CeAC neuronal excitability may not occur in our AIMP model.
Figure 5.
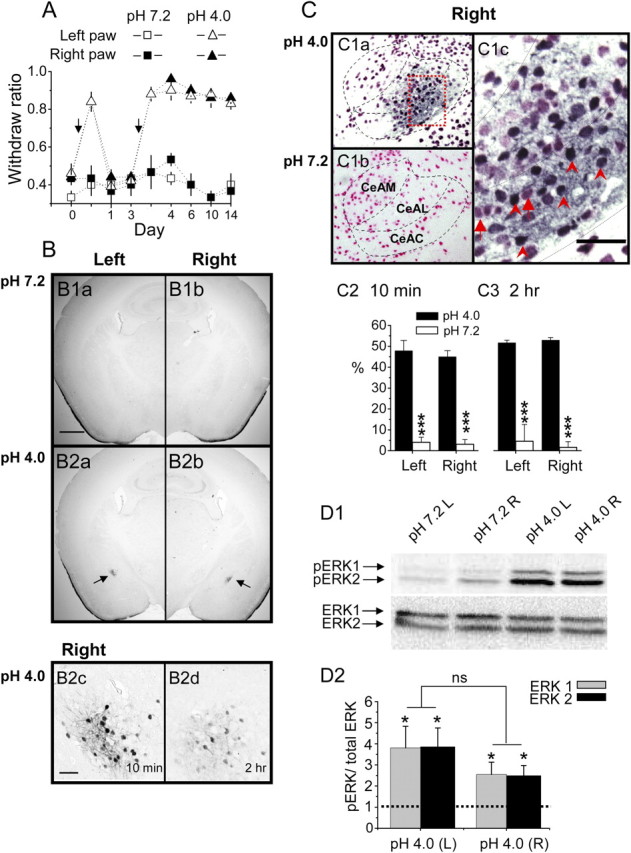
Mice with AIMP have increased pERK levels in both the right and left CeAC. A, Injections of acidic saline (triangles), but not neutral saline (squares), into the left gastrocnemius muscle induces long-lasting mechanical hyperalgesia in mice. Note that behavioral hypersensitivity was observed when mechanical stimulation was applied to the paw on either the injured (white symbols) or noninjured (black symbols) side. Arrows indicate timing of acidic saline injection. B, Representative photograph of immunostaining showing increased pERK-ir neurons on both sides of the central amygdala (arrow) in AIMP mice (B2) but not in neutral saline-injected mice (B1). The labeled central amygdaloid neurons are clearly seen at high magnification (B2c, taken from the field marked by the arrow in B2b). The photographs shown in B1 and B2a–B2c are taken from animals killed 10 min after the second injection of neutral or acidic saline, while that in B2d was taken 2 h after the second injection of acidic saline; note that there are still some labeled central amygdaloid neurons. The scale bar in B1a is 500 μm and also applies to B1b and B2a and B2b, while that in B2c is 50 μm and also applies to B2d. C, Representative photographs showing double-immunostaining results. A large number of cells in the CeAC (only the right side is shown here) are labeled with anti-NeuN and PERK antibodies (C1a, stained dark blue) in mice injected with acidic saline, while most cells are only labeled with anti-NeuN antibody in mice injected with neutral saline (C1b, stained pink-red). The dotted rectangular area in C1a is shown at high magnification in C1c. Note that, at high magnification (C1c), cells labeled with only anti-NeuN antibodies (marked with arrows) or with both anti-NeuN and anti-pERK antibodies (marked with arrowheads) can be easily differentiated. The scale bar in C1c is 50 μm. C2, C3, Quantification of staining showing the ratio of double-labeled cells to cells labeled only for NeuN on both sides of the CeAC in mice injected with acidic saline (black bars) or neutral saline (white bars) and killed 10 min (C2) or 2 h (C3) after the second injection. D, Representative Western blot showing pERK1/ERK2 bands (D1, top) and total ERK1 and ERK2 (D1, bottom) in the right and left CeAC of mice injected with acidic or neutral saline. Quantification of the bands on Western blots showing increased activation of ERK after injection with acidic saline compared to neutral saline (D2). The asterisks indicate statistical comparison with the neutral saline-injected mice using the paired t test (*p < 0.05, **p < 0.01, and ***p < 0.001).
Figure 6.

Postsynaptic enhancement of the PBA–CeAC EPSC by PDA application is occluded in slices from AIMP mice. A, B, Effect of PDA application on aEPSCs in slices from control (A) and AIMP (B) mice. A1, B1, Representative raw data for aEPSCs recorded at baseline (top three traces) and during PDA application (bottom three traces). A2, B2, The cumulative distribution of the aEPSC amplitude shows a marked increase in the aEPSC amplitude on PDA application in a control slice (A2), but not an AIMP slice (B2). The insets are the average aEPSC responses taken from A1 and B1. C, D, Summarized results from six cells showing a significant increase in the mean amplitude on PDA application in slices from control mice, but not AIMP mice (C), and in the mean incidence of aEPSCs in slices from both control and AIMP mice (D). The asterisks indicate a statistical comparison with the baseline results using the paired t test, and the hatch sign indicates a statistical comparison with the neutral saline-injected mice using the ANOVA test. A single symbol indicates significance at the level of p < 0.05, two symbols p < 0.01, and three symbols p < 0.001.
Figure 7.
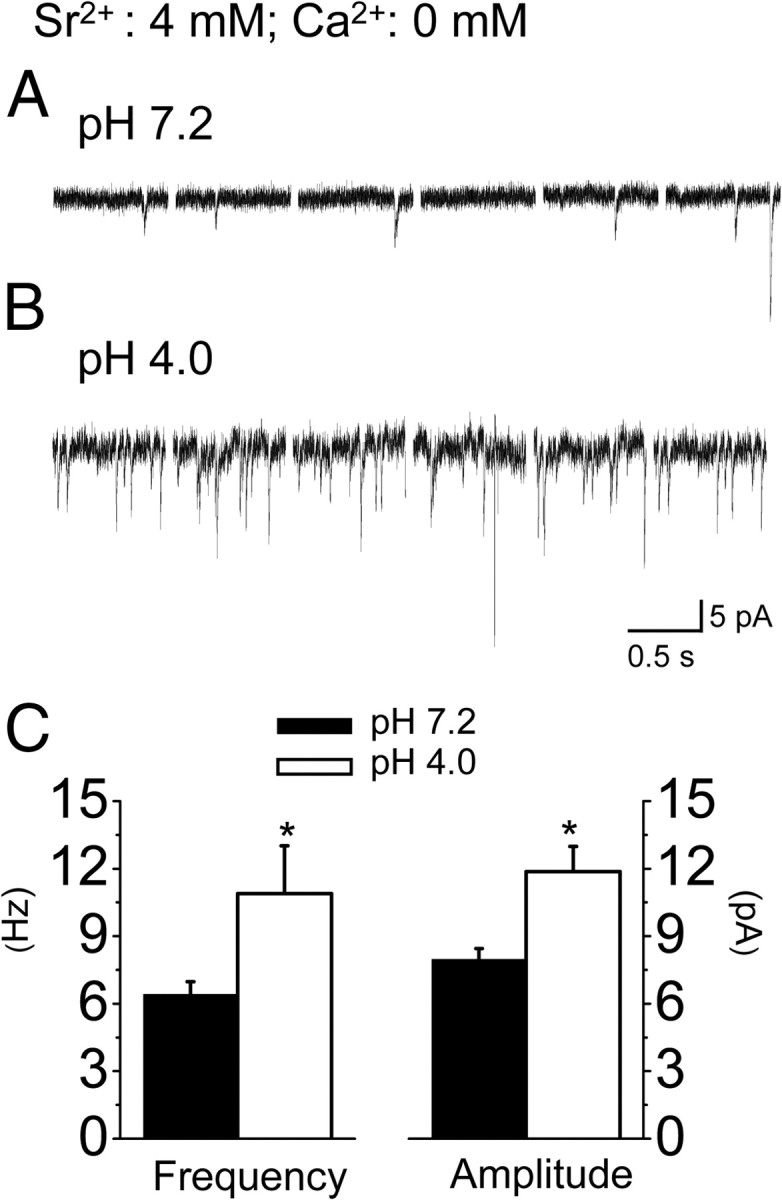
Enhancement of spontaneous PBA–CeAC aEPSC in slices from mice with AIMP. A, B, Recordings of spontaneous aEPSCs in slices from control mice (A) and AIMP mice (B). C, Summarized results from six cells showing a significant higher mean frequency (left) and a larger mean amplitude (right) in slices from AIMP mice compared to neutral saline-injected mice. * indicates statistical comparison with the baseline result using the paired t test and a significance level of p < 0.05.
Induction of NMDAR-PKC–ERK-dependent LTP of PBA–CeAC EPSCs
Since ERK activation is essential for the induction of certain forms of LTP at cortical synapses (Impey et al., 1999; Lin et al., 2003, 2006), we tested whether ERK-dependent LTP could be induced by high-frequency stimulation (HFS) at PBA–CeAC synapses in slices from normal mice and whether LTP induction might share common mechanisms with induction of PKC–ERK-dependent potentiation by PDA and with postsynaptic enhancement of PBA–CeAC EPSCs in AIMP animals. As shown in Figure 8A (squares), after application of three trains of HFS at 100 Hz to slices from normal mice, the PBA–CeAC EPSP was significantly potentiated to 191 ± 30% of baseline (n = 9 cells tested, p < 0.05, paired t test), and potentiation lasted for at least 30 min. LTP induction was blocked by addition of either 50 μm AP5 to the bath to block NMDARs (LTP = 114 ± 25% of baseline; n = 11 cells, p = 0.33, paired t test) (Fig. 8A, half-filled triangles) or of chelerythrine to block PKC (LTP = 103 ± 13% of baseline; n = 6 cells, p = 0.37, paired t test) (Fig. 8A, open circles) or by pretreating slices with U0126 to block ERK activity (LTP = 104 ± 14% of baseline; n = 6 cells, p = 0.31, paired t test) (Fig. 8A, filled circles). These results showed that a homosynaptic LTP could be induced by HFS at PBA–CeAC synapses and that its induction depended on activation of the NMDAR-PKC–ERK signaling pathway. If the induction of LTP shared common mechanisms with the PKC–ERK-dependent component of potentiation by PDA, PDA application should induce LTP and occlude subsequent induction of LTP by HFS. To test this, we recorded PBA–CeAC EPSCs for 60 min after washout of PDA and observed a potentiation of 237 ± 36% of baseline (n = 7 cells, p < 0.01) (Fig. 8B, squares), which could not be ascribed to incomplete washout of PDA, as, after PDA application to slices pretreated with 50 μm U0126 to block ERK activity, the EPSCs returned to the baseline level after 60 min of washout (113 ± 15% of baseline, n = 6 cells) (Fig. 8B, filled circles). To test whether PDA occluded subsequent induction of LTP, a seal was obtained between the membrane and the electrode tip and the cell-attached configuration kept and PDA applied in ACSF for 10 min to allow the PDA to reach a stable concentration in the slice, then the seal was broken for whole-cell recording and LTP induction tested. As shown in Figure 8C (crossed triangles), application of three trains of HFS did not induce significant potentiation of the PBA–CeAC EPSP (82 ± 8% of baseline; n = 7 cells, p = 0.06, paired t test). If a high concentration of PDA saturated ERK and thus prevented LTP, it should be possible to induce LTP of a smaller magnitude if a low concentration of PDA were applied. Since the EC50 of PDA is ∼1 μm, the above experiments was repeated with 1 μm PDA and, as shown in Figure 8C (filled circles), application of three trains of HFS induced a small, but significant, LTP (132 ± 12% of baseline; n = 12 cells, p < 0.05, paired t test), the magnitude of which was significantly less than that induced in control conditions (p < 0.05, ANOVA test), but higher than that induced with 3 μm PDA application (p < 0.05, ANOVA test). Together, the above results support the argument that induction of LTP by HFS and induction of the PKC–ERK-dependent component of potentiation by PDA share common mechanisms. Likewise, if the induction of LTP shares common mechanisms with the postsynaptic potentiation of the PBA–CeAC EPSP in slices from AIMP animals, there should be no further room for expression of the NMDAR-PKC–ERK-dependent LTP. In fact, in slices from AIMP animals, application of three trains of HFS resulted in post-tetanus potentiation, but not in LTP (92 ± 10% of baseline; n = 6 cells, p = 0.43, paired t test) (Fig. 8D, filled hexagons). In contrast, LTP was induced in slices from animals injected with neutral saline (Fig. 8D, open diamonds) (165 ± 30% of baseline; n = 11 cells, p < 0.05, paired t test). Together, the above results show that, at PBA–CeAC synapses, the PKC–ERK-dependent component of the potentiation caused by PDA in slices from control mice and the increased mean amplitude of the aEPSC in slices from AIMP mice might share common molecular mechanisms with the induction of NMDAR-ERK-dependent LTP in control slices. Finally, we examined whether synaptic potentiation by ERK activity was involved in behavioral hypersensitivity by examining the effect of blocking synaptic potentiation with U0126 on pain-like behavior in AIMP mice in vivo. As shown in Figure 8E, infusion of U0126, but not of vehicle (DMSO), into the right amygdala blocked the increase in pERK-ir neurons in both the left and right CeAC in AIMP mice, showing functional connection between the left and right CeAC. Furthermore, the mechanical hypersensitivity in both the left and right hindpaws was blocked in AIMP animals that received U0126 infusion into the right CeAC (Fig. 8F), showing that the mechanical hypersensitivity in AIMP can be, in part, attributed to postsynaptic changes in synaptic responses.
Figure 8.

Induction of LTP by HFS at PBA–CeAC synapses in slices from naive mice is NMDAR-PKC–ERK dependent and is occluded by PDA application, and LTP induction is not seen in slices from mice with AIMP, and this might account for the in vivo behavioral hypersensitivity. A, LTP was induced in a slice from a normal mouse by HFS under control conditions (empty squares), and induction was blocked by addition of AP5 to the bath to block NMDARs (half-filled triangles), by addition of chelerythrine to the bath to block PKC (empty circles), or by pretreating slices with U0126 to block ERK activity (filled circles). B, Application of 3 μm PDA to a slice from a normal mouse causes LTP (empty squares), which is blocked by addition of 50 μm U0126 to the bath (filled circles). C, Bath application of 1 μm PDA to slices from normal mice still allows subsequent induction of a small LTP (filled circles), while 3 μm PDA completely occludes induction of subsequent LTP (crossed triangles). The LTP induced under control conditions is superimposed for comparison (empty squares). D, Induction of LTP in slices from AIMP mice is occluded (filled hexagons), while LTP is induced in slices taken from animals injected with neutral saline (empty diamonds). E, Representative photographs showing that infusion of U0126 (top panels), but not vehicle (DMSO) (bottom panels), blocks ERK activation in the left and right amygdala in mice with AIMP. F, Behavioral hypersensitivity is blocked in AIMP mice receiving right intra-amygdala infusion of U0126 (diamonds), but is unaffected in mice receiving DMSO (circles).
Discussion
In this study, we report several novel roles for ERK in synaptic transmission and plasticity of the PBA pathway, a nociceptive input, on CeAC neurons in normal and AIMP mice.
First, in addition to the well established presynaptic modulation reported for other cortical synapses (Malenka et al., 1986; Shapira et al., 1987; Parfitt and Madison, 1993; Swartz et al., 1993; Stea et al., 1995; Hori et al., 1999; Lou et al., 2008), application of PDA also caused postsynaptic modulation of PBA–CeAC synaptic transmission, which required downstream activation of ERK. Furthermore, we are the first to show NMDAR-dependent LTP of PBA–CeAC synaptic transmission, which again required downstream ERK activation. Since PDA application induced LTP and occluded subsequent induction of LTP, we conclude that postsynaptic enhancement by PDA and induction of LTP of the PBA–CeAC EPSC might share common molecular mechanisms.
Second, we observed an increase in pERK levels in neurons of the central amygdala in AIMP mice, which is consistent with the results of a study using a formalin-induced pain model (Carrasquillo and Gereau, 2007), though lateralization of behavioral hypersensitivity and CeAC neuronal excitability was not seen in our AIMP model. In AIMP mice, the mean amplitude of the aEPSCs was significantly larger than that in control animals, showing postsynaptic enhancement of PBA–CeAC synaptic transmission, whereas ERK-dependent potentiation by PDA and induction of LTP by HFS at PBA–CeAC synapses were occluded in these animals. These results showed that LTP-like enhancement of PBA–CeAC synaptic transmission was induced following an increase in pERK levels in CeAC neurons in AIMP animals.
PDA induces potentiation of PBA–CeAC synaptic transmission
Application of PDA or its analogs has been shown to potentiate synaptic transmission by facilitating glutamate release at many cortical synapses (Malenka et al., 1986; Shapira et al., 1987), and this effect has been shown to be caused by PKC-dependent upregulation of voltage-gated calcium channels located at axonal terminals (Parfitt and Madison, 1993; Swartz et al., 1993; Stea et al., 1995) and/or PKC-dependent modulation of proteins involved in exocytosis (Hori et al., 1999; Lou et al., 2008). In agreement with these previous studies, we found that PDA application resulted in PKC-dependent potentiation of PBA–CeAC synaptic transmission, which was associated with a decrease in the PPR of EPSCs and an increase in the mean frequency of mEPSCs and mean incidence of aEPSCs, showing that modulation was presynaptic. In addition, another important and novel finding of the present study is that we identified a significant postsynaptic role for ERK in the PDA-induced potentiation of PBA–CeAC synaptic transmission. In addition to PKC-dependent presynaptic modulation, we found that the PDA-induced potentiation of PBA–CeAC synaptic transmission was associated with an increase in the mean amplitudes of mEPSCs and aEPSCs, suggesting that postsynaptic modulation is involved. Since the enhancement of aEPSC amplitude was blocked by an ERK inhibitor, we conclude that this postsynaptic modulation accounts for the PKC–ERK-dependent component of the PDA-induced potentiation of PBA–CeAC synaptic transmission. It is possible that such postsynaptic modulation might occur through the upregulation of non-NMDAR functions by the activation of the PKC–ERK signaling pathway (Derkach et al., 2007; Schmid et al., 2008). Interestedly, PKC–ERK-dependent postsynaptic potentiation was not only observed when ERK was activated by bath-applied PDA, but was also seen in animals subjected to AIMP, in which ERK activity in the central amygdala was increased. The latter finding is based on the observations of increased pERK levels in CeAC neurons in AIMP mice and a significantly larger mean amplitude of PBA–CeAC aEPSCs in slices from AIMP mice than in slices from control animals that was similar to that recorded during PDA application to slices from normal mice. Furthermore, the potentiation of the aEPSC amplitude by PDA application was occluded in slices from AIMP mice. Accordingly, we propose that, in AIMP mice, an excessive nociceptive signal triggered by acidic saline injection into the gastrocnemius muscle activates ERK in the central amygdala, thereby enhancing PBA–CeAC synaptic transmission [see also Neugebauer et al. (2003, 2004) and Ikeda et al. (2007)]. Although the observation of increased pERK levels in the CeAC is consistent with previous studies, there is a substantial difference between the results of the present study and those of previous studies, in which mechanical hypersensitivity was shown to be functionally lateralized to the right amygdala in intraplantar formalin and arthritic models (Carrasquillo and Gereau, 2008; Ji and Neugebauer, 2009; Kolber et al., 2010). However, the results of the present study showed that functional lateralization of mechanical hypersensitivity to the right amygdala did not occur in the AIMP model.
NMDAR-PKC–ERK-dependent LTP of PBA–CeAC synaptic transmission
Another novel finding of this study is that the NMDAR-dependent LTP of PBA–CeAC synaptic transmission required downstream activation of the PKC–ERK signaling pathway. Since the postsynaptic modulation component of the PDA-induced potentiation also depended on PKC–ERK activation, it is likely that the induction of LTP in slices from normal mice shared a common cellular mechanism with this component of the PDA-induced potentiation. This argument is supported by results showing that LTP could be induced by PDA application to slices from normal animals and that induction of further LTP was occluded when the slices were bathed in PDA before HFS. Likewise, LTP induction in slices from normal mice might share a common cellular mechanism with the postsynaptic potentiation of PBA–CeAC synaptic transmission in slices from AIMP mice, as LTP induction was occluded in slices from AIMP mice. Thus, we propose that the increase in the mean amplitude of PBA–CeAC aEPSCs observed in slices from AIMP mice was actually an expression of PKC–ERK-dependent LTP induced by excessive nociceptive signaling during acidic saline injection into the gastrocnemius muscle. In support of this argument, in vivo blockade of synaptic potentiation with intra-amygdaloid infusion of U0126 reduces behavior sensitization in mice with AIMP. This LTP-like enhancement might also account for the increased non-NMDAR-mediated currents at PBA–CeAC synapses seen in an arthritic pain model (Ikeda et al., 2007).
Enhanced synaptic transmission in CeAC neurons in AIMP mice
Although potentiation of synaptic transmission was clearly demonstrated at PBA–CeAC synapses, the present results indicated that it should also occur at synapses of other inputs synapsing on CeAC neurons in AIMP mice. This argument is based on the observation that, in addition to the increase in the evoked aEPSCs, there was an increase in the mean amplitude of spontaneous EPSCs recorded in conditions in which extracellular Ca2+ was replaced by 4 mm Sr2+, referred to as “spontaneous aEPSCs.” Spontaneous aEPSCs are AP-independent, as they are recorded in the absence of extracellular Ca2+ (replaced by Sr2+), a condition that has the same functional meaning as the recording of mEPSC, in which the AP-triggering Ca2+ influx into presynaptic terminals is blocked by TTX. An analysis of this activity suggested that, in AIMP mice, postsynaptic enhancement might occur not only at PBA–CeAC synapses (shown by analysis of evoked aEPSC), but also at synapses of other inputs synapsing on CeAC neurons (shown by an analysis of spontaneous aEPSCs). Another interesting observation was that the mean frequency of the spontaneous aEPSCs was significantly higher in recordings made in slices from AIMP mice than in slices from control mice, showing that the efficacy of glutamate release at excitatory synapses on CeAC neurons was higher in AIMP mice than in control mice. This observation suggests that the signaling pathways activated by excessive nociceptive inputs in AIMP mice to enhance synaptic transmission should include an ERK-dependent pathway in postsynaptic CeAC neurons and also involve other signaling pathways that enhance glutamate release from presynaptic terminals. The present results could not determine what mechanisms caused this presynaptic enhancement of glutamate release. However, they might differ from the signaling pathway activated by PDA application, as PKC-dependent (presynaptic) potentiation by PDA was still observed in slices from AIMP mice. One possibility could be that the excitability of presynaptic neurons that make synaptic contacts on CeAC neurons was increased by the increased ERK activity in the central amygdala in AIMP mice.
Conclusions and implications for central sensitization
In summary, the results of this study showed that, in AIMP mice, synaptic transmission between nociceptive inputs from the parabrachial nucleus and CeAC neurons was markedly enhanced and that this involved both presynaptic and postsynaptic modulation and might account for the development of behavioral hypersensitivity in these animals. While the mechanisms underlying presynaptic modulation remain unclear, the induction of postsynaptic modulation might share common molecular mechanisms with a postsynaptic potentiation effect of PDA and the induction of NMDAR-dependent LTP by HFS at this synapse, both of which require downstream activation of ERK. The present results also suggest that enhanced synaptic transmission might occur with PBA inputs and also with other inputs to CeAC neurons in AIMP mice, although the determination of the properties of synaptic transmission at other inputs to CeAC neurons requires further investigation. Computational and experimental studies have shown that synaptic noise can change specific aspects of signal integration in cortical neurons (Hô and Destexhe, 2000; Chance et al., 2002) and control spike transfer from the thalamus to the cortex in thalamic relay neurons (Wolfart et al., 2005). It is likely that the use-dependent change in function of overall synaptic inputs onto CeAC neurons might provide a means by which the level of background synaptic conductance can be adjusted, thereby affecting the spike transfer of CeAC neurons. The CeAC is the main output of the amygdala and the axons of CeAC neurons form widespread direct and indirect connections with forebrain and brainstem areas, and the projections of the CeAC to the thalamus and cortical areas are believed to be related to cognitive and conscious components of pain, while the projection to the hypothalamus is believed to be related to autonomic and neuroendocrine pain-like responses (Davis, 1998; LeDoux, 2000; Bourgeais et al., 2001; Price, 2003). Thus, the use-dependent enhancement of synaptic function of nociceptive signals from the parabrachial nuclei and other non-nociceptive signals, possibly from the basolateral amygdala, which conveys polymodal signals from the thalamus and the cortex, onto CeAC neurons might increase the gain of the input/output relationship, thereby increasing the output of the central amygdala and partially causing central sensitization of supraspinal origin.
Footnotes
This work was supported by Grant NSC96–2311-B-002-025-MY2 from the National Science Council, Taiwan.
References
- Bernard JF, Huang GF, Besson JM. Nucleus centralis of the amygdala and the globus pallidus ventralis: electrophysiological evidence for an involvement in pain processes. J Neurophysiol. 1992;68:551–569. doi: 10.1152/jn.1992.68.2.551. [DOI] [PubMed] [Google Scholar]
- Bernard JF, Bester H, Besson JM. Involvement of the spino-parabrachio -amygdaloid and -hypothalamic pathways in the autonomic and affective emotional aspects of pain. Prog Brain Res. 1996;107:243–255. doi: 10.1016/s0079-6123(08)61868-3. [DOI] [PubMed] [Google Scholar]
- Bingel U, Quante M, Knab R, Bromm B, Weiller C, Büchel C. Subcortical structures involved in pain processing: evidence from single-trial fMRI. Pain. 2002;99:313–321. doi: 10.1016/s0304-3959(02)00157-4. [DOI] [PubMed] [Google Scholar]
- Bliss TV, Collingridge GL. A synaptic model of memory: long-term potentiation in the hippocampus. Nature. 1993;361:31–39. doi: 10.1038/361031a0. [DOI] [PubMed] [Google Scholar]
- Bornhövd K, Quante M, Glauche V, Bromm B, Weiller C, Büchel C. Painful stimuli evoke different stimulus-response functions in the amygdala, prefrontal, insula and somatosensory cortex: a single-trial fMRI study. Brain. 2002;125:1326–1336. doi: 10.1093/brain/awf137. [DOI] [PubMed] [Google Scholar]
- Bourgeais L, Gauriau C, Bernard JF. Projections from the nociceptive area of the central nucleus of the amygdala to the forebrain: a PHA-L study in the rat. Eur J Neurosci. 2001;14:229–255. doi: 10.1046/j.0953-816x.2001.01640.x. [DOI] [PubMed] [Google Scholar]
- Capogna M, McKinney RA, O'Connor V, Gähwiler BH, Thompson SM. Ca2+ or Sr2+ partially rescues synaptic transmission in hippocampal cultures treated with botulinum toxin A and C, but not tetanus toxin. J Neurosci. 1997;17:7190–7202. doi: 10.1523/JNEUROSCI.17-19-07190.1997. [DOI] [PMC free article] [PubMed] [Google Scholar]
- Carrasquillo Y, Gereau RW., 4th Activation of the extracellular signal-regulated kinase in the amygdala modulates pain perception. J Neurosci. 2007;27:1543–1551. doi: 10.1523/JNEUROSCI.3536-06.2007. [DOI] [PMC free article] [PubMed] [Google Scholar]
- Carrasquillo Y, Gereau RW., 4th Hemispheric lateralization of a molecular signal for pain modulation in the amygdala. Mol Pain. 2008;4:24. doi: 10.1186/1744-8069-4-24. [DOI] [PMC free article] [PubMed] [Google Scholar]
- Chance FS, Abbott LF, Reyes AD. Gain modulation from background synaptic input. Neuron. 2002;35:773–782. doi: 10.1016/s0896-6273(02)00820-6. [DOI] [PubMed] [Google Scholar]
- Chen WK, Liu IY, Chang YT, Chen YC, Chen CC, Yen CT, Shin HS, Chen CC. Ca(v)3.2 T-type Ca2+ channel-dependent activation of ERK in paraventricular thalamus modulates acid-induced chronic muscle pain. J Neurosci. 2010;30:10360–10368. doi: 10.1523/JNEUROSCI.1041-10.2010. [DOI] [PMC free article] [PubMed] [Google Scholar]
- Chieng BC, Christie MJ, Osborne PB. Characterization of neurons in the rat central nucleus of the amygdala: cellular physiology, morphology, and opioid sensitivity. J Comp Neurol. 2006;497:910–927. doi: 10.1002/cne.21025. [DOI] [PubMed] [Google Scholar]
- Davis M. Anatomic and physiologic substrates of emotion in an animal model. J Clin Neurophysiol. 1998;15:378–387. doi: 10.1097/00004691-199809000-00002. [DOI] [PubMed] [Google Scholar]
- Delaney AJ, Crane JW, Sah P. Noradrenaline modulates transmission at a central synapse by a presynaptic mechanism. Neuron. 2007;56:880–892. doi: 10.1016/j.neuron.2007.10.022. [DOI] [PubMed] [Google Scholar]
- Derkach VA, Oh MC, Guire ES, Soderling TR. Regulatory mechanisms of AMPA receptors in synaptic plasticity. Nat Rev Neurosci. 2007;8:101–113. doi: 10.1038/nrn2055. [DOI] [PubMed] [Google Scholar]
- Francis HW, Scott JC, Manis PB. Protein kinase C mediates potentiation of synaptic transmission by phorbol ester at parallel fibers in the dorsal cochlear nucleus. Brain Res. 2002;951:9–22. doi: 10.1016/s0006-8993(02)03095-0. [DOI] [PubMed] [Google Scholar]
- Garry EM, Delaney A, Blackburn-Munro G, Dickinson T, Moss A, Nakalembe I, Robertson DC, Rosie R, Robberecht P, Mitchell R, Fleetwood-Walker SM. Activation of p38 and p42/44 MAP kinase in neuropathic pain: involvement of VPAC2 and NK2 receptors and mediation by spinal glia. Mol Cell Neurosci. 2005;30:523–537. doi: 10.1016/j.mcn.2005.08.016. [DOI] [PubMed] [Google Scholar]
- Gauriau C, Bernard JF. Pain pathways and parabrachial circuits in the rat. Exp Physiol. 2002;87:251–258. doi: 10.1113/eph8702357. [DOI] [PubMed] [Google Scholar]
- Giovannini MG, Blitzer RD, Wong T, Asoma K, Tsokas P, Morrison JH, Iyengar R, Landau EM. Mitogen-activated protein kinase regulates early phosphorylation and delayed expression of Ca2+/calmodulin-dependent protein kinase II in long-term potentiation. J Neurosci. 2001;21:7053–7062. doi: 10.1523/JNEUROSCI.21-18-07053.2001. [DOI] [PMC free article] [PubMed] [Google Scholar]
- Hô N, Destexhe A. Synaptic background activity enhances the responsiveness of neocortical pyramidal neurons. J Neurophysiol. 2000;84:1488–1496. doi: 10.1152/jn.2000.84.3.1488. [DOI] [PubMed] [Google Scholar]
- Hori T, Takai Y, Takahashi T. Presynaptic mechanism for phorbol ester-induced synaptic potentiation. J Neurosci. 1999;19:7262–7267. doi: 10.1523/JNEUROSCI.19-17-07262.1999. [DOI] [PMC free article] [PubMed] [Google Scholar]
- Ikeda H, Heinke B, Ruscheweyh R, Sandkühler J. Synaptic plasticity in spinal lamina I projection neurons that mediate hyperalgesia. Science. 2003;299:1237–1240. doi: 10.1126/science.1080659. [DOI] [PubMed] [Google Scholar]
- Ikeda R, Takahashi Y, Inoue K, Kato F. NMDA receptor-independent synaptic plasticity in the central amygdala in the rat model of neuropathic pain. Pain. 2007;127:161–172. doi: 10.1016/j.pain.2006.09.003. [DOI] [PubMed] [Google Scholar]
- Impey S, Obrietan K, Storm DR. Making new connections: role of ERK/MAP kinase signaling in neuronal plasticity. Neuron. 1999;23:11–14. doi: 10.1016/s0896-6273(00)80747-3. [DOI] [PubMed] [Google Scholar]
- Ji G, Neugebauer V. Hemispheric lateralization of pain processing by amygdala neurons. J Neurophysiol. 2009;102:2253–2264. doi: 10.1152/jn.00166.2009. [DOI] [PMC free article] [PubMed] [Google Scholar]
- Ji RR, Baba H, Brenner GJ, Woolf CJ. Nociceptive-specific activation of ERK in spinal neurons contributes to pain hypersensitivity. Nat Neurosci. 1999;2:1114–1119. doi: 10.1038/16040. [DOI] [PubMed] [Google Scholar]
- Ji RR, Kohno T, Moore KA, Woolf CJ. Central sensitization and LTP: do pain and memory share similar mechanisms? Trends Neurosci. 2003;26:696–705. doi: 10.1016/j.tins.2003.09.017. [DOI] [PubMed] [Google Scholar]
- Ji RR, Gereau RW, 4th, Malcangio M, Strichartz GR. MAP kinase and pain. Brain Res Rev. 2009;60:135–148. doi: 10.1016/j.brainresrev.2008.12.011. [DOI] [PMC free article] [PubMed] [Google Scholar]
- Kolber BJ, Montana MC, Carrasquillo Y, Xu J, Heinemann SF, Muglia LJ, Gereau RW., 4th Activation of metabotropic glutamate receptor 5 in the amygdala modulates pain-like behavior. J Neurosci. 2010;30:8203–8213. doi: 10.1523/JNEUROSCI.1216-10.2010. [DOI] [PMC free article] [PubMed] [Google Scholar]
- LeDoux JE. Emotion circuits in the brain. Annu Rev Neurosci. 2000;23:155–184. doi: 10.1146/annurev.neuro.23.1.155. [DOI] [PubMed] [Google Scholar]
- Lin YW, Min MY, Chiu TH, Yang HW. Enhancement of associative long-term potentiation by activation of beta-adrenergic receptors at CA1 synapses in rat hippocampal slices. J Neurosci. 2003;23:4173–4181. doi: 10.1523/JNEUROSCI.23-10-04173.2003. [DOI] [PMC free article] [PubMed] [Google Scholar]
- Lin YW, Yang HW, Wang HJ, Gong CL, Chiu TH, Min MY. Spike-timing-dependent plasticity at resting and conditioned lateral perforant path synapses on granule cells in the dentate gyrus: different roles of N-methyl-D-aspartate and group I metabotropic glutamate receptors. Eur J Neurosci. 2006;23:2362–2374. doi: 10.1111/j.1460-9568.2006.04730.x. [DOI] [PubMed] [Google Scholar]
- Lou X, Korogod N, Brose N, Schneggenburger R. Phorbol esters modulate spontaneous and Ca2+-evoked transmitter release via acting on both Munc13 and protein kinase C. J Neurosci. 2008;28:8257–8267. doi: 10.1523/JNEUROSCI.0550-08.2008. [DOI] [PMC free article] [PubMed] [Google Scholar]
- Malenka RC, Madison DV, Nicoll RA. Potentiation of synaptic transmission in the hippocampus by phorbol esters. Nature. 1986;321:175–177. doi: 10.1038/321175a0. [DOI] [PubMed] [Google Scholar]
- Neugebauer V, Li W, Bird GC, Bhave G, Gereau RW., 4th Synaptic plasticity in the amygdala in a model of arthritic pain: differential roles of metabotropic glutamate receptors 1 and 5. J Neurosci. 2003;23:52–63. doi: 10.1523/JNEUROSCI.23-01-00052.2003. [DOI] [PMC free article] [PubMed] [Google Scholar]
- Neugebauer V, Li W, Bird GC, Han JS. The amygdala and persistent pain. Neuroscientist. 2004;10:221–234. doi: 10.1177/1073858403261077. [DOI] [PubMed] [Google Scholar]
- Oliet SH, Malenka RC, Nicoll RA. Bidirectional control of quantal size by synaptic activity in the hippocampus. Science. 1996;271:1294–1297. doi: 10.1126/science.271.5253.1294. [DOI] [PubMed] [Google Scholar]
- Parfitt KD, Madison DV. Phorbol esters enhance synaptic transmission by a presynaptic, calcium-dependent mechanism in rat hippocampus. J Physiol. 1993;471:245–268. doi: 10.1113/jphysiol.1993.sp019900. [DOI] [PMC free article] [PubMed] [Google Scholar]
- Paxinos G, Franklin KB. The mouse brain in stereotaxic coordinates. Ed 2. San Diego: Academic; 1997. [Google Scholar]
- Price JL. Comparative aspects of amygdala connectivity. Ann N Y Acad Sci. 2003;985:50–58. doi: 10.1111/j.1749-6632.2003.tb07070.x. [DOI] [PubMed] [Google Scholar]
- Schmid A, Hallermann S, Kittel RJ, Khorramshahi O, Frölich AM, Quentin C, Rasse TM, Mertel S, Heckmann M, Sigrist SJ. Activity-dependent site-specific changes of glutamate receptor composition in vivo. Nat Neurosci. 2008;11:659–666. doi: 10.1038/nn.2122. [DOI] [PubMed] [Google Scholar]
- Shapira R, Silberberg SD, Ginsburg S, Rahamimoff R. Activation of protein kinase C augments evoked transmitter release. Nature. 1987;325:58–60. doi: 10.1038/325058a0. [DOI] [PubMed] [Google Scholar]
- Sluka KA, Kalra A, Moore SA. Unilateral intramuscular injections of acidic saline produce a bilateral, long-lasting hyperalgesia. Muscle Nerve. 2001;24:37–46. doi: 10.1002/1097-4598(200101)24:1<37::aid-mus4>3.0.co;2-8. [DOI] [PubMed] [Google Scholar]
- Stea A, Soong TW, Snutch TP. Determinants of PKC-dependent modulation of a family of neuronal calcium channels. Neuron. 1995;15:929–940. doi: 10.1016/0896-6273(95)90183-3. [DOI] [PubMed] [Google Scholar]
- Swartz KJ, Merritt A, Bean BP, Lovinger DM. Protein kinase C modulates glutamate receptor inhibition of Ca2+ channels and synaptic transmission. Nature. 1993;361:165–168. doi: 10.1038/361165a0. [DOI] [PubMed] [Google Scholar]
- Wei F, Zhuo M. Potentiation of sensory responses in the anterior cingulate cortex following digit amputation in the anaesthetised rat. J Physiol. 2001;532:823–833. doi: 10.1111/j.1469-7793.2001.0823e.x. [DOI] [PMC free article] [PubMed] [Google Scholar]
- Wei F, Vadakkan KI, Toyoda H, Wu LJ, Zhao MG, Xu H, Shum FW, Jia YH, Zhuo M. Calcium calmodulin-stimulated adenylyl cyclases contribute to activation of extracellular signal-regulated kinase in spinal dorsal horn neurons in adult rats and mice. J Neurosci. 2006;26:851–861. doi: 10.1523/JNEUROSCI.3292-05.2006. [DOI] [PMC free article] [PubMed] [Google Scholar]
- Wolfart J, Debay D, Le Masson G, Destexhe A, Bal T. Synaptic background activity controls spike transfer from thalamus to cortex. Nat Neurosci. 2005;8:1760–1767. doi: 10.1038/nn1591. [DOI] [PubMed] [Google Scholar]
- Xu-Friedman MA, Regehr WG. Probing fundamental aspects of synaptic transmission with strontium. J Neurosci. 2000;20:4414–4422. doi: 10.1523/JNEUROSCI.20-12-04414.2000. [DOI] [PMC free article] [PubMed] [Google Scholar]
- Zald DH. The human amygdala and the emotional evaluation of sensory stimuli. Brain Res Brain Res Rev. 2003;41:88–123. doi: 10.1016/s0165-0173(02)00248-5. [DOI] [PubMed] [Google Scholar]
- Zhuo M. A synaptic model for pain: long-term potentiation in the anterior cingulate cortex. Mol Cells. 2007;23:259–271. [PubMed] [Google Scholar]
- Zucker RS, Regehr WG. Short-term synaptic plasticity. Annu Rev Physiol. 2002;64:355–405. doi: 10.1146/annurev.physiol.64.092501.114547. [DOI] [PubMed] [Google Scholar]