

Abstract
Growing evidence from electrophysiological data in animal and human studies suggests that multisensory interaction is not exclusively a higher-order process, but also takes place in primary sensory cortices. Such early multisensory interaction is thought to be mediated by means of phase resetting. The presentation of a stimulus to one sensory modality resets the phase of ongoing oscillations in another modality such that processing in the latter modality is modulated. In humans, evidence for such a mechanism is still sparse. In the current study, the influence of an auditory stimulus on visual processing was investigated by measuring the electroencephalogram (EEG) and behavioral responses of humans to visual, auditory, and audiovisual stimulation with varying stimulus-onset asynchrony (SOA). We observed three distinct oscillatory EEG responses in our data. An initial gamma-band response around 50 Hz was followed by a beta-band response around 25 Hz, and a theta response around 6 Hz. The latter was enhanced in response to cross-modal stimuli as compared to either unimodal stimuli. Interestingly, the beta response to unimodal auditory stimuli was dominant in electrodes over visual areas. The SOA between auditory and visual stimuli—albeit not consciously perceived—had a modulatory impact on the multisensory evoked beta-band responses; i.e., the amplitude depended on SOA in a sinusoidal fashion, suggesting a phase reset. These findings further support the notion that parameters of brain oscillations such as amplitude and phase are essential predictors of subsequent brain responses and might be one of the mechanisms underlying multisensory integration.
Introduction
In our natural environment, we constantly receive inputs from multiple sensory channels. To integrate the multisensory inputs efficiently, the brain has to evaluate whether the signals from different channels belong to a common perceptual event, or whether the signals give rise to conflict and need to be processed separately. Among the mechanisms that could achieve this goal, cortical oscillations have recently been proposed [for review, see Senkowski et al. (2008) and Kaiser and Naumer (2010)].
Although once considered brain “noise,” it has been shown that variability in the power of spontaneous brain activity in certain frequency bands predicts perceptual performance (Ergenoglu et al., 2004; Thut et al., 2006; Hanslmayr et al., 2007; van Dijk et al., 2008). In addition to oscillatory power, recent studies also highlight the importance of oscillatory phase for visual perception by demonstrating that perceptual performance depends on the phase of spontaneous oscillations of the EEG in the low alpha and theta bands shortly before stimulus onset (Busch et al., 2009; Mathewson et al., 2009). Given that the phase of ongoing brain activity influences human perception, one could hypothesize that also the phase of oscillations evoked by external stimulation exerts an influence on perceptual performance. Such externally evoked phase modulations of EEG oscillations have been described in response to sensory stimulation and have been shown to significantly contribute to event-related potentials (ERPs) (Başar, 1980; Makeig et al., 2002, 2004). Phase modulations of ongoing oscillations might also serve multisensory integration in that a nonpreferred modality stimulus (e.g., auditory) could prepare the system of the preferred modality (e.g., visual) for subsequent processing of incoming information (Schroeder et al., 2008). Indeed, in monkeys it has been demonstrated that somatosensory inputs reset the phase of ongoing oscillatory activity in primary auditory cortex, resulting in amplified neuronal responses for auditory inputs arriving during a high-excitability phase (Lakatos et al., 2007). Similar findings were reported also for visual influences on oscillations in auditory cortex (Kayser et al., 2008; Lakatos et al., 2009). Recently, Thorne et al. (2011) presented evidence from the human EEG that visual input resets the phase of oscillatory activity in auditory cortex.
In the present study, we investigated how auditory stimuli modulate ongoing EEG oscillations in visual cortex. Human observers responded to visual flashes at the left or right eye preceded by the binaural presentation of an auditory stimulus with varying stimulus-onset asynchronies (SOAs). Following the proposed phase reset model (Schroeder et al., 2008), we hypothesize that auditory stimuli will evoke a response in visual cortex (hypothesis I). Furthermore, we assume that this response is generated by a phase reset of the ongoing oscillations (hypothesis II). Finally, we expect that those visual inputs that arrive at SOA latencies corresponding to a high-excitability phase result in enhanced responses as compared to those presented during a low-excitability phase (hypothesis III). This model is depicted in Figure 1 and based on the model of Schroeder et al. (2008).
Figure 1.

Schematic illustration of the mechanism by which the phase of an evoked or reset oscillation influences subsequent brain responses. Before stimulation, oscillatory EEG activity is already present. While the oscillation is probably below the threshold for causing neurons in visual cortex to fire, the membrane voltage of visual neurons oscillates between more depolarized (high excitability) and more hyperpolarized (low excitability) states. At the time of an auditory stimulus (A), the phase of the ongoing visual oscillation is either reset to a fixed value (phase reset), or a visual oscillation is evoked. If a visual stimulus (V1) is presented during the more depolarized state (after SOA1), it can more easily exceed the firing threshold of visual neurons and evoke a brain response with subsequent conscious detection and manual reaction. If, however, a visual stimulus (V2) is presented during the more hyperpolarized state (after SOA2), it is less likely to excite visual neurons.
Materials and Methods
Subjects.
Thirteen university students (10 female), aged 19–33 years (mean = 21.92; SD = 3.55) participated in the study. All gave their written informed consent and were paid or received course credits for their participation. The subjects had normal or corrected to normal vision and reported no neurological or psychiatric disorders. The experiment was conducted in accordance with the Declaration of Helsinki and the local guidelines of the University of Magdeburg.
Stimuli and procedure.
White noise bursts were used as auditory stimuli that were generated using MATLAB R2009a and delivered binaurally through insert earphones (EARTone 3A). The duration of the white noise burst was 40 ms (5 ms rise and fall times). Before the experiment started, the individual hearing thresholds for the left and right ear were determined by a staircase procedure in intensity steps of 2 dB for each participant. Based on the individual sensation level, the white noise burst was presented at an intensity of 60 dB above threshold. A calibrated attenuator was used to control the sound level (Tucker Davis Technologies, model PA5), individually adjusted for each ear. The light flashes were produced by white LEDs (diameter: 5 mm, luminous intensity: 10 Cd, viewing angle: 20°), five LEDs per eye, and presented via a fiber optic cable and goggles. The luminance of the flash inside the goggles was about 30 lux. The duration of each flash was 40 ms. During the experiment, the course of events was controlled by MATLAB R2009a and an input/output device (National Instruments DAQ USB-6229).
Note that we follow the terminology suggested by Stein et al. (2010) by using “cross-modal” when referring to the stimulus complex or the experimental condition and “multisensory” when referring to the (observed) biological consequences. The auditory (A) and visual (V) stimuli were delivered modality specific, or in combination (cross-modal, AV). In the cross-modal conditions, we presented the visual and auditory stimuli in synchrony (condition: AV0) and with seven different SOAs ranging from 40 to 70 ms in steps of 5 ms (conditions: AV40 to AV70), always presenting the auditory stimulus first. The visual stimulus was presented randomly at the left or the right eye only and the subjects had to judge the side of presentation and respond by corresponding button presses with their left or right index fingers (forced-choice reaction task). A total of 1000 trials were presented, 100 trials in each condition (50 trials for each eye per condition). The intertrial interval was randomly varied between 1500 and 3000 ms.
Data acquisition.
The experiment was conducted in an electrically shielded and sound-attenuated room (IAC). All devices inside the room were battery operated to avoid line frequency interference (50 Hz in Germany). EEG was recorded with a BrainAmp amplifier (Brain Products), using 32 sintered Ag/AgCl electrodes mounted in an elastic cap (Easycap, Falk Minow Services) and placed according to the 10-10 system, with a reference placed at the nose and ground electrode at position AFz. Eye-movement activity was measured from one electrode placed suborbitally to the right eye. Electrode impedances were kept below 5 kΩ. Data were acquired with a bandpass filter of 0.016–250 Hz and a sampling rate of 500 Hz. Analog–digital conversion was performed at an amplitude resolution of 16 bit. Stimulus markers and EEG signals were stored on hard disk for further analysis. Digitized EEG data were transferred to a computer outside the recording cabin with a fiber optic cable. An additional digital high-pass filter with a cutoff frequency of 0.5 Hz was applied offline to reduce slow shifts in the baseline. Averaged epochs lasted from 200 ms before to 800 ms after the auditory and visual stimulus onset. For cross-modal stimuli, the epochs were adjusted to the onset of the auditory stimulus. Baselines were calculated in the interval from −200 to −100 ms and subtracted before averaging. An automatic artifact rejection was applied to the data, which excluded trials from averaging if the SD within a moving 200 ms time window exceeded 40 μV in one channel. All epochs were also visually inspected for artifacts and rejected in cases of eye movements, electrode drifts, or electromyographic activity.
Data analysis.
For behavioral data analysis, only trials included in the EEG analyses were used. Responses shorter than 200 ms or longer than 1500 ms were considered incorrect.
For the analysis of oscillatory activity, a wavelet transform was computed by convolving the raw EEG signal with a complex Gaussian wavelet (Herrmann et al., 2004). The exact time–frequency resolution of the wavelet depended on the analyzed frequency. At 40 Hz, the wavelet had a temporal resolution of 2σt = 25 ms and a frequency resolution of 2σf ≈ 26 Hz. Oscillatory responses may occur either strictly phase locked to stimulus onset (evoked response) or with a high phase variability (induced response) (Başar-Eroglu et al., 1996). Therefore, different methods of evaluation were required. To analyze the evoked response, phase locked to the stimulus, the wavelet transform was applied to the averaged ERP. However, to reveal the non-phase-locked portion of the response, each trial was first transformed to the frequency domain and then absolute values of the resulting wavelet transforms were averaged. This measure represents the total activity, comprising the phase-locked and non-phase-locked part of the response. The wavelet analysis was performed for 1 Hz frequency bins in the frequency range of 1–80 Hz. Phase locking to the stimulus across trials was quantified by a time–frequency version of the so-called mean resultant length (Fisher, 1995) as has been described before (e.g., Fründ et al., 2007; Tallon-Baudry et al., 1996). The phase-locking factor (PLF) yields values between 0 and 1, where 1 indicates perfect phase locking across trials, while 0 indicates a constellation in which the phases exactly cancel each other out, as is the case for a uniform distribution of phases across trials. The time–frequency planes were transformed to a decibel scale for evoked and total responses if absolute values were presented, indicating the change relative to a baseline that extended from 200 to 100 ms before the onset of the stimulus. Phase locking to the stimulus was related to the same baseline by subtracting the average phase locking of this window. For statistical analysis, the resulting time–frequency representations were pooled into a region of interest (ROI) and averaged across the posterior electrodes that exhibited the strongest response to visual stimulation: P3, Pz, P4, O1, and O2. We calculated the mean amplitude and phase-locking values for three analysis windows in three different frequency bands at posterior electrodes, averaged across all subjects (cf. the white boxes in Fig. 2). The time–frequency windows for statistical analysis were defined as follows: gamma-band activity (γ): 30–60 Hz, 30–60 ms; beta-band activity (β): 13–30 Hz, 50–100 ms; and theta-band activity (ϑ): 4–8 Hz, 50–200 ms. Because the time point zero in each analyzed EEG epoch was equivalent to the onset of the auditory stimulus, the analysis time windows for the cross-modal conditions with SOA were shifted by adding the SOA value and therefore adapted to the peak of visual evoked activity, while the frequency range was kept constant. t tests were two-tailed unless otherwise noted.
Figure 2.

Time–frequency plots of the evoked and total activity as well as the PLF averaged across all subjects (N = 13) and the posterior ROI in the visual (upper row) and auditory condition (middle row) as well as the simultaneous audiovisual condition (bottom row). The white boxes illustrate the time–frequency ranges for statistical analysis in the γ, β, and ϑ bands (see also the Greek letters in the plot of the total visual response). The labels Vβ, Aγ, Aβ, and Vϑ in the left column refer to the topographic maps of these responses in Figure 3.
In addition, inverse models were computed for the averaged auditory gamma and beta responses (Aγ, Aβ) and for the visual beta response (Vβ) to assess putative similarities of the aforementioned conditions at the source level. Accordingly, the averaged time-domain data were bandpass filtered to extract the activity at the frequency bands of interest. Then, a model with four equivalent current dipoles was set up by first seeding two dipoles in symmetric locations in the visual cortex and estimating the orientation of the dipoles underlying Vβ. This procedure was repeated to model the early auditory response seen for Aβ. The positions for the equivalent current dipoles approximated local maxima repeatedly shown to be associated with early processing in the relevant sensory domain (compare Fig. 4). After merging these two-dipole models, the resulting four-dipole model was applied to all three conditions, leaving the dipole moment, i.e., source strength, the only free parameter to be estimated. Analyses were performed using a spherical head model with four shells using BESA (version 5.1, BESA).
Figure 4.

Dipole simulation. Left, Bar graphs depict the source strengths of dipoles modeling the auditory (red) and visual (blue) cortex activity corresponding of the topographies Aγ, Aβ and Vβ. For the auditory gamma response (Aγ, top panel), a clear dominance of auditory over visual dipoles was found. In contrast, visual dipoles dominated the auditory beta response (Aβ, middle panel), which is therefore more similar to the visual beta response (Vβ, bottom panel). Right, Visualization of the corresponding dipole locations in a template brain (MRIcron) in MNI coordinates: visual cortex (blue) = ±22, −90, 21; auditory cortex (red) = ±48, −15, 10.
Results
Behavioral results
Participants responded with a mean reaction time (RT) of 336 ± 48 ms (SD). RTs significantly decreased with increasing SOAs in a linear fashion (F(6,72) = 11.794; p < 0.001). Furthermore, participants responded with high accuracy and a mean hit rate of 95 ± 3.7% (SD). The behavioral results are summarized in Table 1.
Table 1.
RT and hit rate (percent correct, PC) averaged across subjects (N = 13) as function of sensory modality and SOA
| Visual | Audiovisual |
||||||||
|---|---|---|---|---|---|---|---|---|---|
| SOA 0 | SOA 40 | SOA 45 | SOA 50 | SOA 55 | SOA 60 | SOA 65 | SOA 70 | ||
| RT (ms) | 393 | 347 | 332 | 330 | 325 | 324 | 326 | 323 | 325 |
| PC (%) | 97.6 | 95.2 | 94.9 | 96.5 | 94.3 | 94.1 | 95.5 | 94.7 | 95.7 |
Electrophysiological results
Cross-modal and unimodal visual stimulation evoked responses in three frequency bands (ϑ, β, and γ) (Fig. 2, left column). The mean amplitude values of the statistical analysis windows (cf. white boxes in Fig. 2) in response to visual, auditory, and simultaneous cross-modal stimulation are listed in Table 2.
Table 2.
Mean amplitude values of evoked and total activity in microvolts, and PLF with (±) SEM averaged across subjects (N = 13) and ROI electrodes
| Condition | Evoked |
Total |
PLF |
||||||
|---|---|---|---|---|---|---|---|---|---|
| γ | β | ϑ | γ | β | ϑ | γ | β | ϑ | |
| V | 0.009 ± 0.006 | 0.290 ± 0.045 | 0.815 ± 0.075 | 0.014 ± 0.012 | 0.105 ± 0.027 | 0.719 ± 0.049 | 0.019 ± 0.004 | 0.072 ± 0.014 | 0.184 ± 0.020 |
| A | 0.130 ± 0.027 | 0.158 ± 0.026 | 0.581 ± 0.091 | 0.023 ± 0.010 | 0.058 ± 0.040 | 0.602 ± 0.056 | 0.076 ± 0.020 | 0.052 ± 0.013 | 0.156 ± 0.036 |
| AV0 | 0.108 ± 0.023 | 0.304 ± 0.061 | 1.498 ± 0.190 | 0.023 ± 0.016 | 0.133 ± 0.028 | 1.101 ± 0.159 | 0.069 ± 0.015 | 0.104 ± 0.021 | 0.329 ± 0.051 |
Gamma response
The gamma-band response, centered around 50 Hz, showed the earliest latency of the three responses (30–60 ms). This response was clearly visible in the auditory and the cross-modal condition (cf. middle and bottom rows in the left column of Fig. 2). A t test indicated a significantly larger gamma response for the cross-modal condition (AV0) than for the visual condition (p < 0.01). However, the gamma response in the cross-modal condition was not significantly stronger than in the auditory condition. The auditory and multisensory gamma-band responses were accompanied by increased phase locking (auditory: p < 0.01, cross-modal: p < 0.01). For the multisensory response, the PLF increased in the absence of a power increase (cross-modal: n.s.). Note that, in this article, an increase always refers to a change with respect to baseline. The topography of the auditory gamma-band response was strongest at electrode Cz (compare Fig. 3). This topography is consistent with two generators in auditory cortex (Schadow et al., 2009). This notion is supported by a dipole source analysis, modeling four dipoles in the left and right auditory and visual cortices (compare Fig. 4). For the gamma-band response in the auditory condition, the two dipoles in auditory cortex revealed stronger activation than the two dipoles in visual cortex.
Figure 3.

Topographic maps of the evoked responses in Figure 2. The auditory gamma response (Aγ) shows maximal amplitudes at electrode Cz. This topography is consistent with generators in auditory cortex. In contrast, the auditory beta response (Aβ) shows clear maxima at occipital electrodes, suggesting visual generation. The topography of the visual beta response (Vβ) is also maximal over occipital electrodes. For the visual theta response (Vϑ), two maxima are visible over frontocentral and occipital electrodes, separated by a parietal minimum.
Beta response
The beta-band response was centered around 25 Hz. In the visual and auditory condition, it showed a latency of 50–100 ms. Intriguingly, in the cross-modal condition, the latency increases with SOA, suggesting that this response is evoked by visual stimulation (compare Fig. 5, left column). It was clearly visible in the visual, auditory, and cross-modal condition (cf. left column of Fig. 2). A t test indicated a significantly larger beta response for the cross-modal condition (AV0) as compared to the auditory condition (p < 0.05). However, the beta response in the cross-modal condition was not significantly stronger than in the visual condition. In all three conditions, beta-band responses were accompanied by increased phase locking (visual: p < 0.001; auditory: p < 0.01, cross-modal: p < 0.001). For the visual and the cross-modal condition, the increase in PLF was accompanied by a power increase (visual: p < 0.01; cross-modal: p < 0.001). For the auditory response, the PLF increased but no power increase could be observed, i.e., the response did not differ significantly from zero. This suggests that the response was generated by a phase reset (hypothesis II). The topography of the beta-band response in the visual condition was strongest at posterior electrodes (compare Fig. 3). This topography is in line with generators in the visual cortex (Zaehle et al., 2009). In the auditory condition, the topography was also maximal at posterior electrodes but extended to anterior regions. In our dipole model, visual dipoles showed stronger activity than auditory dipoles in both the auditory and visual condition (compare Fig. 4). This suggests that the auditory stimulus evoked activity in visual brain areas (hypothesis I).
Figure 5.
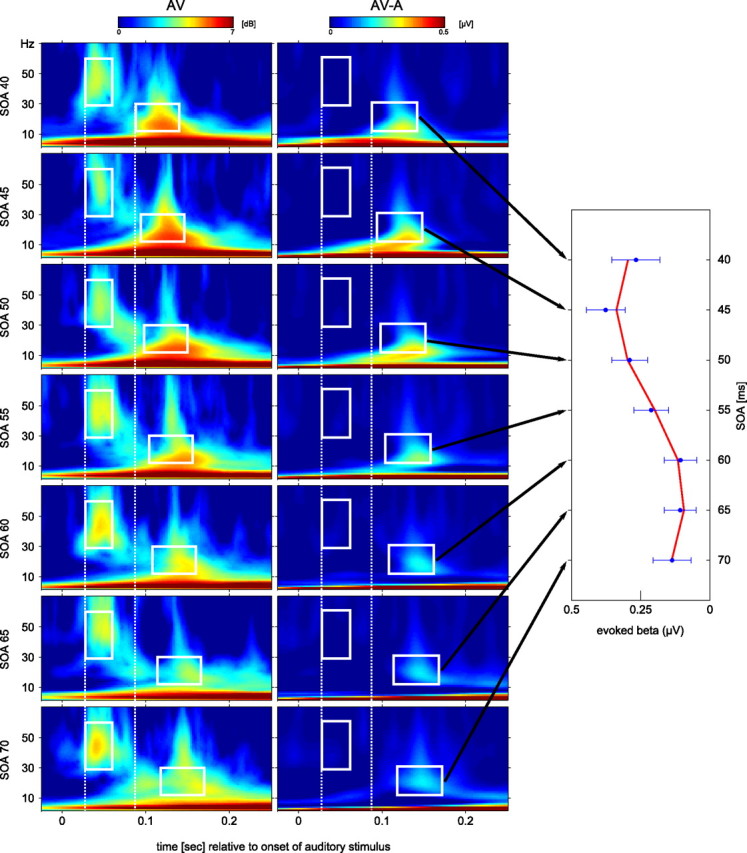
Left, Time–frequency plots for the cross-modal (AV) stimulation sorted according to their SOA (from 40 ms at top to 70 ms at bottom). Within the white boxes at 0.05 s in each of the TF plots, a gamma-band response is visible for each SOA around 50 Hz with a latency of 30–60 ms that was constant across SOAs (compare left dotted white line). The white boxes around 0.1–0.2 s in each TF plot mark the beta response for each SOA. Middle, TF plots for the difference between cross-modal and auditory stimulation (AV − A). Amplitudes for the test of SOA modulation were computed as averages for the frequency range (13–30 Hz) and for the time window 50–100 ms (relative to visual onset) as indicated by the corresponding white boxes in the time–frequency diagrams. These time windows are constant relative to the onset of the visual stimulus. However, they shift to the right with increasing SOA as shown by the distance from the second white dotted line, indicating that this is a visual response. Right, The amplitude of the beta response after cross-modal stimuli was modulated by the SOA between the auditory and the visual part of the stimulus. Mean values and SEs of these time windows are indicated by blue circles and error bars in the right panel. The seven values indicate a sinusoidal modulation that was confirmed by a nonlinear regression. The mean of all individually fitted sine wave is indicated in red.
Theta response
The theta-band response was centered around 6 Hz and showed a latency of 50–200 ms. It was clearly visible in all three conditions (cf. left column of Fig. 2). A t test showed that the theta response was significantly larger for the cross-modal condition (AV0) as compared to the auditory as well as the visual condition alone (auditory: p < 0.001; visual: p < 0.01). In all three conditions, theta-band responses were accompanied by increased phase locking (visual: p < 0.001; auditory: p < 0.01, cross-modal: p < 0.001). However, in all three conditions the PLF was accompanied by an increase in power (p < 0.001). The topography of the theta response showed two amplitude maxima over frontocentral and occipital areas, separated by a minimum in parietal electrodes (compare Fig. 3).
SOA modulation
Our third hypothesis assumed that the response evoked by auditory stimulation in visual areas would be modulated by SOA. Thus, we tested the beta response in cross-modal conditions with nonzero SOAs. To rule out a superposition by volume conduction of auditory and visual responses of the audiovisual stimulation, we computed the differences AV − A for all SOAs. To test the influence of SOA on beta amplitudes, we performed a nonlinear regression analysis assuming the sinusoidal model y = a · sin(b · 2π(t + c)). The fitting routine was initialized with random start values and the parameters were limited by the following constraints: a ∈ [0, 1], b ∈ [1, 100], and c ∈ [−π, π]. A Student's t test was then performed on parameters a and b to test for significance. The null hypothesis assumed a and b to be zero, i.e., representing a horizontal line that would indicate no modulation by SOA. The t test revealed that parameters a (t(1,12) = 6.9; p < 0.001) and b (t(1,12) = 8.5; p < 0.001) were significantly different from 0, demonstrating that the modulation by SOA was significant. The mean frequency across subjects was 28.9 Hz (11.8 Hz SD). Frequencies of 0 or 100 Hz were never reached. To further test whether the data are better described by a nonlinear (sinusoidal) or a linear regression, we performed a Student's t test on the root mean square values of the linear and nonlinear fits, revealing that the sinusoidal yielded significantly lower residual errors (t(1,12) = 2.89; p < 0.05).
Discussion
We observed three distinct oscillatory EEG responses in our experiment. An initial gamma-band response was present around 50 Hz with a latency of 30–60 ms in the auditory and cross-modal condition. Subsequently, a beta-band response around 25 Hz with a latency of 50–100 ms occurred in all three experimental conditions. In addition, a theta response around 6 Hz was visible in all three conditions with a latency of 50–200 ms.
Multisensory effects
A clear effect of multisensory integration, i.e., cross-modal stimuli resulting in stronger responses than either auditory or visual stimuli alone (subadditive enhancement) (Stein et al., 2009), was found for the theta response only. This finding is in line with other studies that found effects of multisensory integration within the theta frequency band (e.g., Sakowitz et al., 2005). Also the spatial distribution of this response is in accordance with previously described topographies that showed frontocentral as well as occipital maxima (Ishii et al., 1999; Demiralp et al., 2007). The beta frequency band also revealed interesting audiovisual interaction effects according to our first hypothesis based on the findings of Lakatos et al. (2007), who described activity in auditory cortex that was evoked by somatosensory stimulation in monkeys. In the present experiment, the topography of the beta response evoked by auditory stimuli was maximal over posterior brain regions, suggesting visual sources despite the auditory stimulation. The notion of auditory evoked visual activity was corroborated by the dipole source analysis. Dipoles in visual cortex exhibited stronger activations than those in the auditory cortex. This is consistent with the study of Raij et al. (2010), who showed MEG responses in auditory cortex in response to visual stimuli and vice versa. Along the same lines, Driver and Noesselt (2008) review recent findings that suggest that unisensory stimuli (e.g., auditory) can evoke responses in a sensory cortex that is not specific for this sensory domain (e.g., visual).
SOA modulation of visual responses
The most interesting finding of the current study was a modulation of the audiovisual evoked beta response by SOA. The beta response for cross-modal stimuli was enhanced for some SOAs as compared to others. In line with our third hypothesis, this could be due to an auditory evoked oscillatory response in visual cortex. This notion is supported by the fact that the frequency of this modulation was found to be in the analyzed beta frequency range (28.9 Hz). This coincides with the frequency of the beta response to purely auditory stimuli. We have argued that this auditory evoked response is actually present in visual cortex, i.e., the auditory stimulus did indeed evoke a visual oscillation that alternates between states of high and low excitability. Accordingly, subsequent visual stimuli would then either be presented during high or low excitability depending on their SOA, leading to the observed effect. Therefore, our data support the notion of a phase reset in one modality by stimuli of another modality in humans. However, note the following discussion of how to properly assess phase resetting.
Phase resetting
Evoked brain oscillations can in principle be produced by an increase in power, by the phase resetting of ongoing oscillations, or by a combination of both. An increase in power would be reflected in the total activity. In contrast, a pure phase resetting would result in an increase of intertrial phase synchrony, which is reflected in the PLF, without an accompanying power increase.
In the current study, visual and cross-modal stimulation elicited a significant response at posterior electrodes in all frequency bands in the total activity as well as in PLF. Thus, the evoked activity in response to visual and cross-modal stimulation was due to an increase in both power and phase locking.
More interestingly, auditory stimuli evoked a beta response with parameters that are typical for visual responses, i.e., a latency of 50–100 ms and a topography that was maximal at occipital electrodes. This response was characterized by a clear enhancement of phase locking without a significant power increase, which has been argued to reflect a cross-modal phase reset in animal studies (Lakatos et al., 2007, 2009). Using the same type of analysis (Lakatos et al., 2007), we demonstrated that auditory stimuli result in enhanced phase locking of beta oscillations in human visual cortex. This finding is consistent with our second hypothesis, i.e., a phase reset of visual oscillations by auditory stimuli. Note, however, that there is an ongoing debate on how phase reset can be demonstrated unambiguously (Sauseng et al., 2007). If total power showed a strong decrease after stimulation, this decrease could mask a weak increase that would otherwise contradict a phase reset, as has been shown for visually induced decrease of total power (Min et al., 2007). We have addressed this problem in the present study by testing that total power did not significantly differ from zero after stimulation. However, demonstrating a null effect is statistically not sufficient to show an absence of a power increase (Martínez-Montes et al., 2008). Therefore, further tests would need to be applied. However, such tests work only for signals with high signal-to-noise ratios, and are probably unsuited for EEG data (Krieg et al., 2011). Thus, our pattern of results would also be consistent with an evoked oscillation.
Task performance
The reaction times required to discriminate between left and right eye stimulation were significantly modulated by the SOA. Reaction times decreased linearly with increasing SOAs. This seems intuitive, since during long SOAs participants have more time between the auditory stimulus, which might be considered the warning or cue stimulus, and the visual stimulus, which required their reaction. However, the SOA was in the range from 40 to 70 ms, which has to be considered very short. In fact, during the debriefing after the experiment, none of the participants reported to have consciously perceived a temporal gap between the auditory and the visual stimulus. This observation is in line with other studies on multisensory integration showing that temporal gaps of this duration are usually not consciously detected (Senkowski et al., 2007; Powers et al., 2009). Thus, the modulation of the RT in the present study might reflect influences of low-level integration on behavioral performance independent of any conscious perceptual processes (Foxe and Schroeder, 2005).
Conclusion
Together, our findings suggest that phase modulations contribute to the mechanisms underlying multisensory integration in humans. In line with animal findings, our data demonstrate that auditory stimuli can reset or evoke oscillatory responses in visual brain areas. These oscillations represent an alternation between phases of high and low excitability. Thus, subsequent visual stimuli are presented during high or low excitability depending on their SOA relative to the preceding auditory stimulus. This pattern of results is consistent with the notion that the auditory stimulus resets the phase of the ongoing visual oscillations, although this could not be unambiguously demonstrated. Nevertheless, a modulation of visual oscillatory activity was clearly present in the response to auditory stimulation. Since the phase of that visual oscillation correlated with the strength of subsequent visual responses, these results further support the importance of oscillatory phase for human perception.
Footnotes
The work described was supported by the Honda Research Institute Europe (HRI-EU) and the German Research Foundation (DFG, Grants HE3353/6 and SFB/TRR31). We are very grateful to Sebastian Handrich for technical support. Furthermore, we thank Lars T. Boenke for helpful comments on the design and Jeremy Thorne for fruitful discussions and proofreading. We thank all participants in this study for their time, patience, and effort.
The authors declare no competing financial interests.
References
- Başar E. EEG-brain dynamics: relation between EEG and brain evoked potentials. Amsterdam: Elsevier; 1980. [Google Scholar]
- Başar-Eroglu C, Strüber D, Schürmann M, Stadler M, Başar E. Gamma-band responses in the brain: a short review of psychophysiological correlates and functional significance. Int J Psychophysiol. 1996;24:101–112. doi: 10.1016/s0167-8760(96)00051-7. [DOI] [PubMed] [Google Scholar]
- Busch NA, Dubois J, VanRullen R. The phase of ongoing EEG oscillations predicts visual perception. J Neurosci. 2009;29:7869–7876. doi: 10.1523/JNEUROSCI.0113-09.2009. [DOI] [PMC free article] [PubMed] [Google Scholar]
- Demiralp T, Bayraktaroglu Z, Lenz D, Junge S, Busch NA, Maess B, Ergen M, Herrmann CS. Gamma amplitudes are coupled to theta phase in human EEG during visual perception. Int J Psychophysiol. 2007;64:24–30. doi: 10.1016/j.ijpsycho.2006.07.005. [DOI] [PubMed] [Google Scholar]
- Driver J, Noesselt T. Multisensory interplay reveals crossmodal influences on ‘sensory-specific’ brain regions, neural responses, and judgments. Neuron. 2008;57:11–23. doi: 10.1016/j.neuron.2007.12.013. [DOI] [PMC free article] [PubMed] [Google Scholar]
- Ergenoglu T, Demiralp T, Bayraktaroglu Z, Ergen M, Beydagi H, Uresin Y. Alpha rhythm of the EEG modulates visual detection performance in humans. Brain Res Cogn Brain Res. 2004;20:376–383. doi: 10.1016/j.cogbrainres.2004.03.009. [DOI] [PubMed] [Google Scholar]
- Fisher NI. Statistical analysis of circular data. Cambridge, UK: Cambridge UP; 1995. [Google Scholar]
- Foxe JJ, Schroeder CE. The case for feedforward multisensory convergence during early cortical processing. Neuroreport. 2005;16:419–423. doi: 10.1097/00001756-200504040-00001. [DOI] [PubMed] [Google Scholar]
- Fründ I, Schadow J, Busch NA, Körner U, Herrmann CS. Evoked gamma oscillations in human scalp EEG are test-retest reliable. Clin Neurophysiol. 2007;118:221–227. doi: 10.1016/j.clinph.2006.09.013. [DOI] [PubMed] [Google Scholar]
- Hanslmayr S, Aslan A, Staudigl T, Klimesch W, Herrmann CS, Bäuml KH. Prestimulus oscillations predict visual perception performance between and within subjects. Neuroimage. 2007;37:1465–1473. doi: 10.1016/j.neuroimage.2007.07.011. [DOI] [PubMed] [Google Scholar]
- Herrmann CS, Grigutsch M, Busch NA. EEG oscillations and wavelet analysis. In: Handy TC, editor. Event-related potentials: a methods handbook. MIT Press; 2004. pp. 229–259. [Google Scholar]
- Ishii R, Shinosaki K, Ukai S, Inouye T, Ishihara T, Yoshimine T, Hirabuki N, Asada H, Kihara T, Robinson SE, Takeda M. Medial prefrontal cortex generates frontal midline theta rhythm. Neuroreport. 1999;10:675–679. doi: 10.1097/00001756-199903170-00003. [DOI] [PubMed] [Google Scholar]
- Kaiser J, Naumer MJ. Cortical oscillations and multisensory interactions in humans. In: Naumer MJ, Kaiser J, editors. Multisensory object perception in the primate brain. Heidelberg: Springer; 2010. pp. 71–82. [Google Scholar]
- Kayser C, Petkov CI, Logothetis NK. Visual modulation of neurons in auditory cortex. Cereb Cortex. 2008;18:1560–1574. doi: 10.1093/cercor/bhm187. [DOI] [PubMed] [Google Scholar]
- Krieg J, Trébuchon-Da Fonseca A, Martínez-Montes E, Marquis P, Liégeois-Chauvel C, Bénar CG. A comparison of methods for assessing alpha phase resetting in electrophysiology, with application to intracerebral EEG in visual areas. Neuroimage. 2011;55:67–86. doi: 10.1016/j.neuroimage.2010.11.058. [DOI] [PubMed] [Google Scholar]
- Lakatos P, Chen CM, O'Connell MN, Mills A, Schroeder CE. Neuronal oscillations and multisensory interaction in primary auditory cortex. Neuron. 2007;53:279–292. doi: 10.1016/j.neuron.2006.12.011. [DOI] [PMC free article] [PubMed] [Google Scholar]
- Lakatos P, O'Connell MN, Barczak A, Mills A, Javitt DC, Schroeder CE. The leading sense: supramodal control of neurophysiological context by attention. Neuron. 2009;64:419–430. doi: 10.1016/j.neuron.2009.10.014. [DOI] [PMC free article] [PubMed] [Google Scholar]
- Makeig S, Westerfield M, Jung TP, Enghoff S, Townsend J, Courchesne E, Sejnowski TJ. Dynamic brain sources of visual evoked responses. Science. 2002;295:690–694. doi: 10.1126/science.1066168. [DOI] [PubMed] [Google Scholar]
- Makeig S, Debener S, Onton J, Delorme A. Mining event-related brain dynamics. Trends Cogn Sci. 2004;8:204–210. doi: 10.1016/j.tics.2004.03.008. [DOI] [PubMed] [Google Scholar]
- Martínez-Montes E, Cuspineda-Bravo ER, El-Deredy W, Sánchez-Bornot JM, Lage-Castellanos A, Valdés-Sosa PA. Exploring event-related brain dynamics with tests on complex valued time-frequency representations. Stat Med. 2008;27:2922–2947. doi: 10.1002/sim.3132. [DOI] [PubMed] [Google Scholar]
- Mathewson KE, Gratton G, Fabiani M, Beck DM, Ro T. To see or not to see: prestimulus alpha phase predicts visual awareness. J Neurosci. 2009;29:2725–2732. doi: 10.1523/JNEUROSCI.3963-08.2009. [DOI] [PMC free article] [PubMed] [Google Scholar]
- Min BK, Busch NA, Debener S, Kranczioch C, Hanslmayr S, Engel AK, Herrmann CS. The best of both worlds: phase-reset of human EEG alpha activity and additive power contribute to ERP generation. Int J Psychophysiol. 2007;65:58–68. doi: 10.1016/j.ijpsycho.2007.03.002. [DOI] [PubMed] [Google Scholar]
- Powers AR, 3rd, Hillock AR, Wallace MT. Perceptual training narrows the temporal window of multisensory binding. J Neurosci. 2009;29:12265–12274. doi: 10.1523/JNEUROSCI.3501-09.2009. [DOI] [PMC free article] [PubMed] [Google Scholar]
- Raij T, Ahveninen J, Lin FH, Witzel T, Jääskeläinen IP, Letham B, Israeli E, Sahyoun C, Vasios C, Stufflebeam S, Hämäläinen M, Belliveau JW. Onset timing of cross-sensory activations and multisensory interactions in auditory and visual sensory cortices. Eur J Neurosci. 2010;31:1772–1782. doi: 10.1111/j.1460-9568.2010.07213.x. [DOI] [PMC free article] [PubMed] [Google Scholar]
- Sakowitz OW, Quian Quiroga R, Schürmann M, Başar E. Spatio-temporal frequency characteristics of intersensory components in audiovisually evoked potentials. Brain Res Cogn Brain Res. 2005;23:316–326. doi: 10.1016/j.cogbrainres.2004.10.012. [DOI] [PubMed] [Google Scholar]
- Sauseng P, Klimesch W, Gruber WR, Hanslmayr S, Freunberger R, Doppelmayr M. Are event-related potential components generated by phase resetting of brain oscillations? A critical discussion? Neuroscience. 2007;146:1435–1444. doi: 10.1016/j.neuroscience.2007.03.014. [DOI] [PubMed] [Google Scholar]
- Schadow J, Lenz D, Dettler N, Fründ I, Herrmann CS. Early gamma-band responses reflect anticipatory top-down modulation in the auditory cortex. Neuroimage. 2009;47:651–658. doi: 10.1016/j.neuroimage.2009.04.074. [DOI] [PubMed] [Google Scholar]
- Schroeder CE, Lakatos P, Kajikawa Y, Partan S, Puce A. Neuronal oscillations and visual amplification of speech. Trends Cogn Sci. 2008;12:106–113. doi: 10.1016/j.tics.2008.01.002. [DOI] [PMC free article] [PubMed] [Google Scholar]
- Senkowski D, Talsma D, Grigutsch M, Herrmann CS, Woldorff MG. Good times for multisensory integration: effects of the precision of temporal synchrony as revealed by gamma-band oscillations. Neuropsychologia. 2007;45:561–571. doi: 10.1016/j.neuropsychologia.2006.01.013. [DOI] [PubMed] [Google Scholar]
- Senkowski D, Schneider TR, Foxe JJ, Engel AK. Crossmodal binding through neural coherence: implications for multisensory processing. Trends Neurosci. 2008;31:401–409. doi: 10.1016/j.tins.2008.05.002. [DOI] [PubMed] [Google Scholar]
- Stein BE, Stanford TR, Ramachandran R, Perrault TJ, Jr, Rowland BA. Challenges in quantifying multisensory integration: alternative criteria, models, and inverse effectiveness. Exp Brain Res. 2009;198:113–126. doi: 10.1007/s00221-009-1880-8. [DOI] [PMC free article] [PubMed] [Google Scholar]
- Stein BE, Burr D, Constantinidis C, Laurienti PJ, Meredith MA, Perrault TJ, Jr, Ramachandran R, Röder B, Rowland BA, Sathian K, Schroeder CE, Shams L, Stanford TR, Wallace MT, Yu L, Lewkowicz DJ. Semantic confusion regarding the development of multisensory integration: a practical solution. Eur J Neurosci. 2010;31:1713–1720. doi: 10.1111/j.1460-9568.2010.07206.x. [DOI] [PMC free article] [PubMed] [Google Scholar]
- Tallon-Baudry C, Bertrand O, Delpuech C, Pernier J. Stimulus specificity of phase-locked and non-phase-locked 40 Hz visual responses in human. J Neurosci. 1996;16:4240–4249. doi: 10.1523/JNEUROSCI.16-13-04240.1996. [DOI] [PMC free article] [PubMed] [Google Scholar]
- Thorne JD, De Vos M, Viola FC, Debener S. Cross-modal phase reset predicts auditory task performance in humans. J Neurosci. 2011;31:3853–3861. doi: 10.1523/JNEUROSCI.6176-10.2011. [DOI] [PMC free article] [PubMed] [Google Scholar]
- Thut G, Nietzel A, Brandt SA, Pascual-Leone A. Alpha-band electroencephalographic activity over occipital cortex indexes visuospatial attention bias and predicts visual target detection. J Neurosci. 2006;26:9494–9502. doi: 10.1523/JNEUROSCI.0875-06.2006. [DOI] [PMC free article] [PubMed] [Google Scholar]
- van Dijk H, Schoffelen JM, Oostenveld R, Jensen O. Prestimulus oscillatory activity in the alpha band predicts visual discrimination ability. J Neurosci. 2008;28:1816–1823. doi: 10.1523/JNEUROSCI.1853-07.2008. [DOI] [PMC free article] [PubMed] [Google Scholar]
- Zaehle T, Fründ I, Schadow J, Thärig S, Schoenfeld MA, Herrmann CS. Inter- and intra-individual covariations of hemodynamic and oscillatory gamma responses in the human cortex. Front Hum Neurosci. 2009;3:8. doi: 10.3389/neuro.09.008.2009. [DOI] [PMC free article] [PubMed] [Google Scholar]