FIGURE 6.
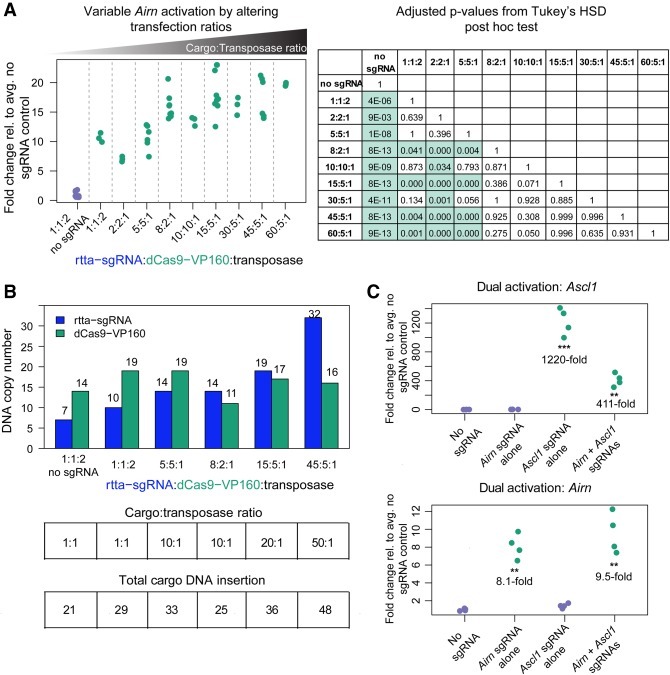
Cargo to transposase ratio controls the extent of activation and multiplex gene activation by CRISPR-Bac. See Supplemental Table S2 for details on replicates and experimental design for each figure panel. Each replicate in the no sgRNA control and sgRNA-expressing cells is shown relative to the average of the signal in “No sgRNA.” (***) P < 0.001; (**) P < 0.01 from a two-sided t-test between no sgRNA and sgRNA-expressing cells. (A) qPCR measuring Airn activation. X-axis gives the transfection ratio of rtTA-sgRNA to dCas9-VP160 to transposase for each experiment. Ratios are plotted in ascending order based on the summed cargo (rtTA-sgRNA plus dCas9-VP160) to transposase ratio. “1:1:2 no sgRNA” and “8:2:1” data are the same as shown in Figure 5B. Corresponding table gives adjusted P-values from Tukey's HSD post-hoc test for all comparisons, where P ≤ 0.05 are highlighted in green. (B) Bar plot showing DNA copy-number per cell for the rtTA-sgRNA and dCas9-VP160 cargos under each transfection condition. Numbers over each bar give the average copy-number calculated from three technical qPCR replicates. The tables below correspond to the bar plot showing the transfection ratio and total number of DNA cargos inserted (copy-number of rtTA-sgRNA plus dCas9-VP160). (C) Simultaneous activation of Ascl1 and Airn transcription upon cotransfection of a pool of four Ascl1 sgRNAs from Perez-Pinera et al. (2013) and one Airn. Data from the nontargeting sgRNA control (No sgRNA) and sgRNA-expressing cells are plotted relative to the average of the signal in the No sgRNA control cells. Individual qPCR data points are shown.

