

Abstract
Proprioceptive information from the foot/ankle provides important information regarding body sway for balance control, especially in situations where visual information is degraded or absent. Given known increases in catastrophic injury due to falls with older age, understanding the neural basis of proprioceptive processing for balance control is particularly important for older adults. In the present study, we linked neural activity in response to stimulation of key foot proprioceptors (i.e., muscle spindles) with balance ability across the lifespan. Twenty young and 20 older human adults underwent proprioceptive mapping; foot tendon vibration was compared with vibration of a nearby bone in an fMRI environment to determine regions of the brain that were active in response to muscle spindle stimulation. Several body sway metrics were also calculated for the same participants on an eyes-closed balance task. Based on regression analyses, multiple clusters of voxels were identified showing a significant relationship between muscle spindle stimulation-induced neural activity and maximum center of pressure excursion in the anterior–posterior direction. In this case, increased activation was associated with greater balance performance in parietal, frontal, and insular cortical areas, as well as structures within the basal ganglia. These correlated regions were age- and foot-stimulation side-independent and largely localized to right-sided areas of the brain thought to be involved in monitoring stimulus-driven shifts of attention. These findings support the notion that, beyond fundamental peripheral reflex mechanisms, central processing of proprioceptive signals from the foot is critical for balance control.
Introduction
Standing balance control relies substantively on proprioception (i.e., our sense of body position and movement). Supporting this notion, previous work shows that disrupting proprioception during standing increases body sway (Inglis et al., 1994; Lajoie et al., 1996; Horak et al., 2002; Speers et al., 2002), a well accepted indicator of postural stability. Further, studies comparing balance control under different sensory feedback conditions (e.g., eyes closed, standing on a compliant surface) estimate the contribution of proprioception to body sway is 58–69% (Lord et al., 1991; Simoneau et al., 1992). Ankle joint proprioception appears to be of particular importance, as it provides the most salient information regarding standing body sway (Fitzpatrick and McCloskey, 1994).
The effects of aging have been emphasized in the balance literature, due to epidemiological findings indicating that increased falls are linked to catastrophic injuries in older adults (Tinetti and Williams, 1998). With respect to proprioception, behavioral studies have shown clear evidence that age-related declines exist (for review, see Goble et al., 2009) and that proprioceptive deficits are associated with balance ability (Lord et al., 1991). Despite this knowledge, there is a gap in the literature regarding what the neural basis of proprioceptive processing is and to what extent areas of the brain responsible for processing proprioceptive information are associated with balance control. With respect to the first issue, we (Goble et al., 2011) recently provided the first brain mapping of ankle proprioception-related neural differences in young and older adults by stimulating key proprioceptors (i.e., muscle spindles) in the feet with tendon vibration during fMRI. In young and older individuals, muscle spindle-related neural activity was identified in brain areas that included primary and secondary sensorimotor cortices, secondary associative areas, and basal ganglia. Additionally, reduced right putamen activation in older versus young adults was found, which was related to a behavioral test of proprioception (i.e., ankle joint position sense).
In the present study, we sought to address the second question: how neural activity resulting from stimulation of young and older adult foot proprioceptors relates to performance on a proprioceptively demanding balance task (i.e., standing with eyes closed). This objective was significant not only because of the known role ankle proprioception plays in balance control but, also, because of the fact that associations between healthy brain function and balance ability have been difficult to obtain. Based on studies showing significant associations between global aspects of brain structure (e.g., white matter irregularities, ventricle size) and balance performance (Starr et al., 2003; Sullivan et al., 2009), we hypothesized that specific regions of proprioception-related neural activity would be determined explaining significant balance task variance. In particular, increased neural activity was expected to be associated with reduced body sway. Additionally, we attempted to determine whether any brain–behavior relationships were age-specific. Here, we hypothesized that older adults might have additional areas of correlated brain activity in line with our previous work demonstrating compensatory neural activity with older age (Heuninckx et al., 2005, 2008; Goble et al., 2010).
Materials and Methods
Participants
Twenty young (mean age, 26.1 years; range, 19.9–32.4 years) and 20 older (mean age, 68.9 years; range, 62.3–81.3 years) adults were recruited to participate in the study. The two age groups were gender-matched (12 females, 8 males) and all participants were right-handed and right-footed according to the Edinburgh Handedness Inventory (Oldfield, 1971). At the time of testing, participants reported having no neuromuscular impairment or use of psychoactive or vasoactive medications. The older adults tested were generally physically fit and had high (i.e., >26) scores on the Mini-Mental State Examination (Folstein et al., 1975). All participants gave written informed consent at the time of testing and procedures were performed according to guidelines established by the ethics committee of Biomedical Research at the Katholieke Universiteit Leuven in accord with the Code of Ethics laid down by the World Medical Association (Declaration of Helsinki).
Proprioceptive brain mapping
In a previous study (Goble et al., 2011), ankle proprioceptive brain mapping was performed on young and older participants using an established procedure involving tendon vibration in an fMRI scanner (Romaiguère et al., 2003; Naito et al., 2005, 2007; Kavounoudias et al., 2008). The set-up for this task consisted of participants being placed head-first and supine into an fMRI scanner with arms resting comfortably at the sides of their body. The lower limbs were supported in a slightly flexed position at the hip and knee so that the feet were elevated and hanging freely ∼10 cm above the scanner bed. Clothing below the knee was removed.
Once situated in the scan environment, custom-made pneumatic vibration devices (Mag Design and Engineering) were placed on the dorsal side of the foot perpendicular to the tendons of metatarsals 2–5 (TENDON) and on the crest of the lower portion of the tibia (BONE). It was assumed that TENDON vibration would stimulate both muscle spindle and vibrotactile cutaneous receptors (e.g., Pacinian corpuscles), while mostly vibrotactile receptors (and perhaps a small number of neighboring muscle spindles) would be stimulated during BONE vibration conditions. In this way, TENDON > BONE fMRI contrasts (described below, fMRI data processing/statistical analyses, First- and second-level fMRI modeling) would reveal neural activations that were related to muscle spindle (i.e., proprioceptive) stimulation of the foot. Specifically, muscle spindles from muscles crossing the anterior side of the ankle joint were stimulated, since tendons on the dorsal side of the foot were vibrated. This approach is just as relevant to determining ankle angle (and therefore body sway) as one where posterior ankle muscles are stimulated via vibration of, for example, the Achilles tendon, given the results of elegant studies demonstrating that joint angles are determined by the ratio of lengths between antagonist muscle pairs (Calvin-Figuière et al., 1999, 2000).
Each vibration device was secured to the skin surface (contact area = ∼8 cm2) using elastic straps, which have been shown to limit vibration being transmitted to adjacent structures (Montant et al., 2009). The frequency of applied vibration was ∼80 Hz, with amplitude of 0.2–1.0 mm. These parameters are known to provide optimal stimulation of muscle spindles (Goodwin et al., 1972; Roll and Vedel, 1982; Roll et al., 1989). During TENDON, but not BONE, vibration conditions, most (35 of 40; 17 old, 18 young) participants experienced a common proprioceptive illusion of ankle plantar flexion and/or toe flexion. Throughout scanning, participants continuously monitored the illusory state of the vibrated limb using a modified two-button computer mouse, whereby participants held down one button with their right index finger when they felt an illusion and the other button with their right middle finger when no illusion was present. These button press data were later used as a covariate in the fMRI model to account for group/individual differences related to the experience of proprioceptive illusions, as well as to confirm that participants maintained attention throughout testing.
The fMRI session consisted of alternating 21 s blocks of three vibration conditions: TENDON, BONE, and REST (i.e., no vibration). Participants kept their eyes closed throughout the fMRI session. Triggering of the vibration devices was accomplished via custom software developed within the LabVIEW environment (National Instruments). A 3-T Magnetom Trio MRI scanner (Siemens) with a standard head coil was used for fMRI acquisition. At the beginning of each fMRI session, a high-resolution T1-weighted image (MPRAGE; TR, 2300 ms; TE, 2.98 ms; 1 × 1 × 1.1 mm voxels, field of view, 240 × 256; 160 sagittal slices) was acquired for anatomical detail. A total of four fMRI time series (i.e., runs) were acquired with an interleaved echo planar imaging pulse sequence for T2*-weighted images (TR, 3000 ms; TE, 30 ms; flip angle, 90°; 50 oblique slices, 2 mm thick; interslice gap, 0.028 mm; in-plane resolution, 2.5 × 2.5 mm; 80 × 80 matrix). Vibration was applied on the left side of the body for two runs and on the right for two runs. Initial presentation of body side was counterbalanced across subjects and groups. Three scans at the beginning of each run were discarded to allow for scanner equilibration. Runs consisted of 147 scans, with seven blocks of each of the three task conditions (i.e., seven whole-brain images in 21 s). Condition order was randomized across time series' with rest periods inserted between all runs (∼3 min). Within 1 week before testing, 20 min of practice was provided to participants in a dummy scanner to ensure familiarity with experimental tasks and the scan environment.
Assessment of balance performance on a proprioceptively demanding standing task
Within 1–2 weeks of proprioceptive brain mapping, the upright standing ability of young and older participants was assessed. To accomplish this, participants were asked to stand on a balance platform (Neurocom International) and remain as still as possible for three trials that were each 20 s in duration. Participants closed their eyes during testing to eliminate visual cues and thus increase the relative reliance on proprioceptive information. Although no falls occurred during testing, a safety harness was used in case of loss of balance.
Center of pressure (COP) data collected from the balance platform during testing were subsequently used to calculate a series of sway metrics characterizing the participants' balance abilities. First, an equilibrium score (ES) measuring maximum anterior–posterior (AP) sway excursion for each participant was calculated according to the following formula: ES = [12.5 − (θmax − θmin)] * 100/12.5°. In this equation, θ is the angular displacement of the participant's center of gravity in the AP direction and, thus, AP sway is compared with a theoretical sway stability limit of 12.5°. Larger ES values indicate greater performance (i.e., less maximum AP excursion). This measure of balance performance has been common in the aging literature.
In addition to the ES, maximum medial-lateral (ML) excursion of the COP was determined by subtracting the smallest from the largest COP value in the ML direction, with greater maximum ML excursion considered to reflect poorer balance ability. The root mean square error (RMS) of the COP time series was also calculated for both the AP and ML directions, with larger RMS indicating more variable, less ideal performance on the balance task. Lastly, the average AP and ML COP velocities over the course of the balance time series' were quantified by taking the total distance traveled by the COP in each direction and dividing by the trial duration (i.e., 20 s). These sway parameters were chosen on the basis that they were thought to correspond well with the known characteristics of muscle spindle firing. Indeed, muscle spindles have both static (i.e., muscle length) and dynamic (i.e., change in muscle length) responses capable of garnering sway size (i.e., COP RMS), speed (i.e., COP velocity), and limits of excursion (i.e., equilibrium score or max excursion size) information. Group differences in the various balance metrics were determined according to one-sided (YOUNG > OLDER performance) t tests with significance of p < 0.05.
fMRI data processing/statistical analyses
Preprocessing of fMRI data.
Analyses of the fMRI data were performed with SPM 5 (Wellcome Department of Imaging Neuroscience, London, UK) according to the general linear model (Friston et al., 1995) and implemented using Matlab 7.4 (Mathworks). Preprocessing of data before running first- and second-level statistical models included realignment of T2*-weighted images to the first image of the time series and a mean image being created from the realigned volumes. From this realigned data, it was verified that no subject had head movement larger than 2 mm in any direction during any of the functional runs. The realigned images underwent an unwarp procedure to remove additional unwanted movement-related variance independent of variance related to the task conditions (Andersson et al., 2001). The resulting images were then normalized to a standard template that was based on the Montreal Neurological Institute (MNI) reference brain in Talairach space (Talairach and Tournaux, 1998) and subsampled at 2 × 2 × 2 mm. Lastly, the normalized data were smoothed using an isotropic 3D Gaussian smoothing kernel (10 mm full-width at half-maximum).
First- and second-level fMRI modeling.
At the first (i.e., individual subject) level, a model was specified with boxcar regressors for the TENDON and BONE conditions, while REST was implicitly modeled. These regressors were convolved with the canonical hemodynamic response function of SPM 5 and data were high-pass filtered (1/128 Hz) to remove low-frequency scanner signal drifts. The AR(1) autoregressive model of SPM was fit to residuals of the fMRI time series to account for temporal autocorrelations. Contrast images for BONE > REST and TENDON > BONE were then calculated to reveal neural activations related to vibrotactile and to muscle spindle stimulation in the absence of a vibrotactile response, respectively. These images were entered into separate second-level ANOVA models with the factors Group (YOUNG, OLDER) and Side (LEFT, RIGHT). In each ANOVA, clusterwise significance was determined at the level of p < 0.05 corrected for family-wise error (FWE), following voxelwise thresholding at p < 0.001 (uncorrected). In the case of the TENDON > BONE ANOVA, a constrained search approach (Friston et al., 2006) was used to help restrict analyses to voxels with significant activation (rather than deactivation). This involved creation of a binary mask image from the union (i.e., global conjunction) of voxels demonstrating significant activation (p < 0.001 uncorrected) for any group or body side condition in an independent, second-level ANOVA testing TENDON > REST first-level contrast images. Differences in illusion duration were corrected for (i.e., included as a covariate of no interest) in all ANOVA analyses. With respect to illusion duration, this regressor did not explain significant variance even when explored at a liberal fMRI threshold (i.e., p < 0.01 uncorrected). This suggests that individual differences in illusion experience did not influence the overall mapping data.
Relationship between ankle proprioception-stimulated neural activity and balance performance.
The primary aim of this study was to determine whether significant variance in balance data could be explained by brain activity in response to muscle spindle stimulation. To test this, multiple linear regression analyses were used to determine significant associations (i.e., variance explained) between neural activity during BONE > REST or TENDON > BONE conditions, and balance performance metrics (e.g., ES, COP RMS, COP velocity). Analyses were conducted within binary masks of significant voxels found in the union (i.e., global conjunction) of all group and body side BONE > REST or TENDON > BONE contrast images from the previous methods step (see First- and second-level fMRI modeling, above). Balance metrics from each participant were group mean corrected and entered into regression models as performance covariates of interest. Each age group (i.e., YOUNG, OLDER) and body side (i.e., RIGHT, LEFT) factor was entered separately. Significant associations between brain activity and balance performance were determined at a threshold of p < 0.01 with a false discovery rate (FDR) correction for multiple comparisons. The mean percentage signal change (PSC) from significant regions where activation predicted balance performance was then determined using the Marsbar toolbox (Brett et al., 2002) in SPM. PSC was used for graphical representations of the data, as well as determining clusterwise correlation strength (i.e., r values).
Results
Vibrotactile (BONE > REST) and muscle spindle (TENDON > BONE) brain mappings
Brain regions showing significant activation in response to BONE vibration versus REST (Fig. 1) were specific to the body side stimulated and did not differ between young and older adults. Vibration of the left foot resulted in significant activation (ANOVA, conjunction YOUNG LEFT and OLDER LEFT, p < 0.05 FWE cluster corrected) of Brodmann area (BA) 3 of the contralateral right primary somatosensory cortex (peak activation: x = 10, y = −34, z = 72), right posterior insula (peak activation: x = 30, y = −20, z = 16), and right supramarginal gyrus (peak activation: x = 50, y = −28, z = 26). During vibration of the right foot, significant activation (ANOVA, conjunction YOUNG RIGHT and OLDER RIGHT, p < 0.05 FWE cluster corrected) was seen only in the left primary somatosensory cortex (BA 3/4; peak activation: x = −16, y = −40, z = 78) and left posterior insula (peak activation: x = −32, y = −22, z = 14).
Figure 1.

Clusters of neural activity (p < 0.05 FWE cluster corrected) rendered on a standard T1 template for vibrotactile stimulation (i.e., BONE > REST) of the left (red) and right (blue) lower limbs of young and older adults. S1, Primary somatosensory cortex; SMG, supramarginal gyrus; Post Ins, posterior insula.
In contrast to the vibrotactile stimulation, neural activity related to muscle spindle stimulation was far more extensive (Fig. 2; Table 1). TENDON > BONE contrasts showed age-independent activity in the foot region of the right (ANOVA, conjunction YOUNG LEFT and OLDER LEFT, p < 0.05 FWE cluster corrected) and left (ANOVA, conjunction YOUNG RIGHT and OLDER RIGHT, p < 0.05 FWE cluster corrected) sensorimotor cortices depending on body side stimulated. Regardless of stimulation side or age group (ANOVA, conjunction YOUNG LEFT and YOUNG RIGHT and OLDER LEFT and OLDER RIGHT, p < 0.05 FWE cluster corrected), activation peaks were found in bilateral inferior parietal cortex (BA 2/40), bilateral inferior frontal gyri (BA 44/45), supplementary motor area (SMA), pre-SMA, bilateral anterior insula, basal ganglia (pallidum, putamen), and thalamus. Right hemisphere-specific activations were seen in ventral premotor area (BA 6), orbital frontal cortex (BA 47), dorsolateral prefrontal cortex (BA 9/46), and dorsal anterior cingulate (BA 32). Only one age difference was determined: reduced activity for older versus young adults was found in right putamen (ANOVA, mean YOUNG LEFT and YOUNG RIGHT > mean OLDER LEFT and OLDER RIGHT, p < 0.05 FWE cluster corrected).
Figure 2.

Clusters of neural activity (p < 0.05 FWE cluster corrected) rendered on standard T1 template for muscle spindle stimulation (i.e., TENDON > BONE) of the left (red), right (blue), and both (green) feet of young and older adults. IFG, Inferior frontal gyrus; Ant Ins, anterior insula; BG, basal ganglia; OFC, orbital frontal cortex; DLPFC, dorsolateral prefrontal cortex; SMG, supramarginal gyrus; IPC, inferior parietal cortex; PMv, premotor ventral region; S1, primary somatosensory cortex; M1, primary motor cortex.
Table 1.
List of clusters showing significant muscle spindle-related brain activity
| TENDON > BONE peak location | Side | x | y | z | t value |
|---|---|---|---|---|---|
| Cluster 1: 4205 voxels | |||||
| Inferior frontal gyrus (p. tri, BA 45) | R | 54 | 16 | −2 | 5.78 |
| Inferior frontal gyrus (p. oper, BA 44) | R | 52 | 16 | 16 | 4.97 |
| Anterior insular lobe (BA 48) | R | 28 | 20 | −8 | 5.63 |
| Precentral gyrus (PMv, BA 6) | R | 50 | 10 | 38 | 5.44 |
| R | 48 | 4 | 46 | 4.73 | |
| R | 50 | 6 | 48 | 4.73 | |
| Orbitofrontal cortex (BA 47) | R | 44 | 22 | −14 | 5.07 |
| R | 48 | 42 | −4 | 4.15 | |
| Basal ganglia (pallidum) | R | 18 | 0 | 0 | 4.8 |
| R | 22 | 0 | 2 | 4.75 | |
| Basal ganglia (putamen) | R | 34 | 10 | −4 | 4.74 |
| Thalamus | R | 14 | −8 | 0 | 4.49 |
| Cluster 2: 2142 voxels | |||||
| Supramarginal gyrus (BA 40) | R | 60 | −42 | 42 | 6.10 |
| Supramarginal gyrus (BA 40/2) | R | 64 | −38 | 40 | 6.08 |
| R | 64 | −34 | 30 | 5.57 | |
| Inferior parietal cortex (BA 40) | R | 60 | −44 | 48 | 5.88 |
| Cluster 3: 2123 voxels | |||||
| Inferior frontal gyrus (p. oper, BA 44) | L | −50 | 10 | 12 | 5.31 |
| L | −50 | 12 | 4 | 4.96 | |
| Anterior insular lobe | L | −30 | 20 | 4 | 5.2 |
| L | −32 | 20 | −6 | 4.94 | |
| L | −34 | 18 | −8 | 4.94 | |
| Inferior frontal gyrus (p. tri, BA 45) | L | −48 | 16 | −2 | 5.2 |
| Basal ganglia (putamen) | L | −24 | 0 | 8 | 4.38 |
| L | −26 | 2 | 6 | 4.35 | |
| Basal ganglia (pallidum) | L | −16 | 2 | 2 | 3.79 |
| Thalamus | L | −20 | −6 | 8 | 4.14 |
| Cluster 4: 1809 voxels | |||||
| Pre-SMA (BA 6) | R | 8 | 14 | 58 | 5.49 |
| R | 8 | 10 | 60 | 5.44 | |
| L | −10 | 2 | 70 | 4.18 | |
| L | −4 | 10 | 58 | 3.97 | |
| SMA (BA 6) | R | 10 | −4 | 70 | 4.71 |
| R | 2 | −20 | 72 | 4.22 | |
| L | −10 | −4 | 78 | 4.33 | |
| L | −14 | −6 | 70 | 4.18 | |
| L | −10 | −12 | 74 | 4.09 | |
| L | −6 | −6 | 64 | 3.85 | |
| Dorsal anterior cingulate (BA 32) | R | 6 | 22 | 48 | 5.27 |
| R | 8 | 26 | 34 | 4.61 | |
| Cluster 5: 938 voxels | |||||
| Inferior parietal cortex (BA 40) | L | −62 | −48 | 40 | 5.31 |
| L | −60 | −48 | 44 | 4.95 | |
| L | −58 | −44 | 50 | 4.81 | |
| L | −56 | −46 | 52 | 4.4 | |
| L | −60 | −58 | 34 | 3.65 | |
| Supramarginal gyrus (BA 40/2) | L | −64 | −44 | 36 | 4.81 |
| L | −66 | −36 | 32 | 4.04 | |
| L | −60 | −30 | 46 | 3.93 | |
| Supramarginal gyrus (BA 2) | L | −56 | −24 | 30 | 4.37 |
| L | −56 | −28 | 30 | 4.36 | |
| Cluster 6: 422 voxels | |||||
| Middle frontal gyrus (DLPFC, BA 46) | R | 28 | 50 | 20 | 4.49 |
| R | 38 | 40 | 34 | 4.23 |
R, Right; L, left; p. tri, pars triangularis; p. oper, pars opercularis; PMv, premotor ventral; DLPFC, dorsolateral prefrontal cortex.
Associations between vibration-induced neural activity and balance performance
All participants completed the proprioceptively demanding (i.e., eyes closed) balance task within relatively close temporal proximity (i.e., 1–2 weeks) to the time of fMRI testing. Balance metrics from the testing session were subsequently calculated and are summarized in Table 2) were found with increased muscle spindle-related (i.e., TENDON > BONE) activity in relation to lower maximum AP excursion of the COP as quantified by ES (multiple regression; conjunction positive YOUNG RIGHT, positive YOUNG LEFT, positive OLD RIGHT, positive OLD LEFT, p < 0.01 FDR). The largest cluster is depicted in Figure 3 and included the right anterior insula, right inferior frontal gyrus (BA 44/45), orbital frontal cortex (BA 47), and the right basal ganglia (pallidum and putamen). Three additional clusters of balance-related neural activity are shown in Figure 4, with peak correlations seen in the right pre-SMA, right dorsal anterior cingulate gyrus (BA 32), left anterior insula, and right supramarginal gyrus (BA 40). In Figure 5. Only the mean ES and AP velocity of eyes-closed standing were significantly different between young and older age groups (t test, YOUNG > OLD performance; p < 0.05). Despite this, balance abilities of older adults trended toward being worse on average for all sway measures quantified.
Table 2.
Summary of mean (±SE) sway metrics for younger and older adults with p values from t test measuring YOUNG > OLD performance
| Sway parameter | Younger | Older | p value |
|---|---|---|---|
| Max AP excursion (ES) | 93.1 (±0.4) | 91.8 (±0.5) | <0.05 |
| Max ML excursion (cm) | 0.60 (±0.04) | 0.67 (±0.05) | 0.16 |
| RMS AP (cm) | 0.34 (±0.02) | 0.4 (±0.1) | 0.10 |
| RMS ML (cm) | 0.11 (±0.01) | 0.13 (±0.01) | 0.09 |
| AP velocity (cm/s) | 25.3 (±0.6) | 29.1 (±1.8) | <0.05 |
| ML velocity (cm/s) | 18.9 (±0.4) | 20.2 (±0.8) | 0.07 |
Figure 3.

Left, Largest cluster (green, rendered on standard MNI template) of voxels showing a significant positive correlation (FDR < 0.01) between neural activity during TENDON > BONE (i.e., muscle spindle) stimulation and balance performance (i.e., ES). Right, Clusterwise PSC for YOUNG (red) and OLD (yellow) averaged across feet correlated with ES; r values are used as a measure of strength of relationship. OFC, Orbital frontal cortex; Ant Ins, anterior insula; IFG p. tri, inferior frontal gyrus pars triangularis; IFG p. oper, inferior frontal gyrus pars opercularis; BG, basal ganglia.
Figure 4.

Top, Second through fourth largest clusters (green, rendered on standard MNI templates at top) of voxels showing significant positive correlation (FDR < 0.01) between neural activity during TENDON > BONE (i.e., muscle spindle) stimulation and balance performance (i.e., ES). Bottom, Cross-plots of the relationship between clusterwise PSC averaged across feet and balance performance in YOUNG (red) and OLD (yellow), r values indicate strength of relation. Ant Ins, Anterior insula; SMG, supramarginal gyrus; IPC, inferior parietal cortex.
Figure 5.
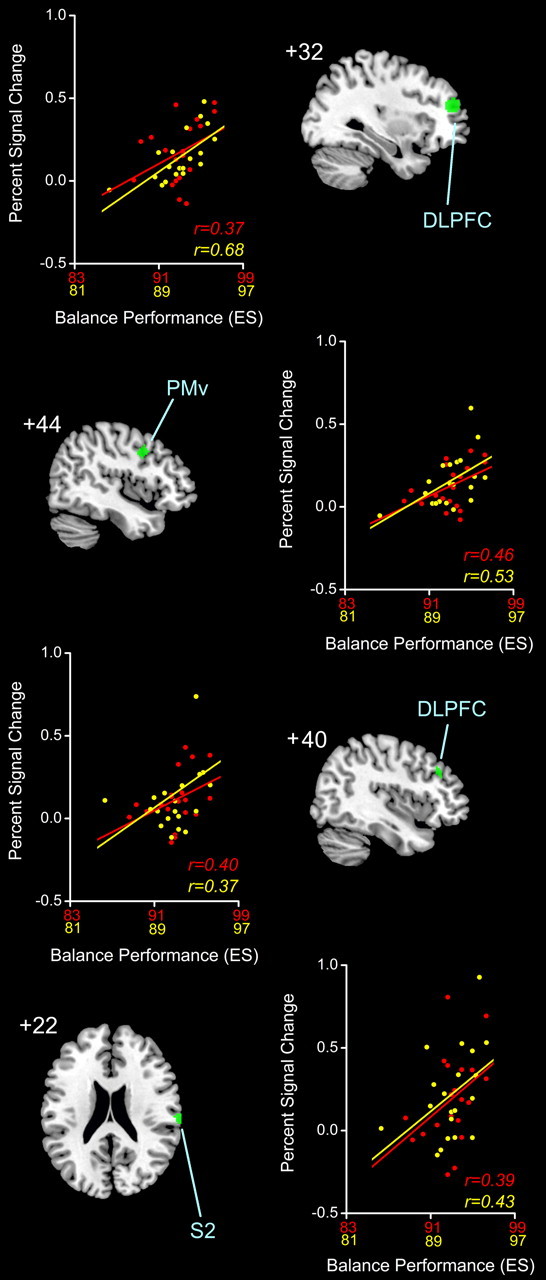
Fifth through eighth largest clusters (green, rendered on standard MNI templates) of voxels showing significant positive correlation (FDR < 0.01) between neural activity during TENDON > BONE (i.e., muscle spindle) stimulation and balance performance (i.e., ES). Next to each render, the relationship between clusterwise PSC averaged across feet and balance performance in YOUNG (red) and OLD (yellow) is cross-plotted with r values to indicate strength of relation. PMv, Premotor ventral; S2, secondary somatosensory; DLPFC, dorsolateral prefrontal cortex.
The relationship between proprioceptive mapping data and balance performance was of particular interest in this study. While no significant associations were found between vibrotactile-specific (i.e., BONE > REST) neural activity and measures of balance performance, eight clusters of significantly correlated voxels (Table 3, areas of greater ankle proprioceptive-related neural activity and higher ES are shown in the right dorsolateral prefrontal cortex (BA 9/46), right ventral premotor cortex (BA 6), and the parietal operculum (secondary somatosensory cortex; BA 43). No significant negative correlations were found; lower neural activity was associated with better ES performance and there was no difference between brain activity and ES-based balance behavior by age group or body side. It is worth noting, however, that the overall magnitude of associations between ES and neural activity were typically greater in older adults. No other balance metric (i.e., ML maximum excursion, AP and ML RMS, or AP and ML velocity) had a significant relationship with muscle spindle-related neural activity regardless of age group tested or body side stimulated.
Table 3.
List of brain areas showing significant association between muscle spindle-related brain activity (i.e. TENDON > BONE) and balance performance in terms of ES
| Location of peak association with ES | Side | x | y | z | t value | p value |
|---|---|---|---|---|---|---|
| Cluster 1: 2148 voxels | ||||||
| Anterior insula | R | 36 | 20 | 8 | 4.83 | 0.004 |
| R | 30 | 30 | 2 | 3.49 | 0.004 | |
| R | 30 | 26 | −2 | 3.47 | 0.004 | |
| Inferior frontal gyrus (p. tri, BA 45) | R | 38 | 44 | 8 | 4.62 | 0.004 |
| R | 36 | 44 | 4 | 4.53 | 0.004 | |
| Orbital frontal cortex (BA 47) | R | 50 | 22 | −14 | 4.44 | 0.004 |
| Inferior frontal gyrus (p. oper, BA 44) | R | 48 | 6 | 14 | 4.37 | 0.004 |
| R | 54 | 4 | 2 | 3.96 | 0.004 | |
| Basal ganglia (putamen) | R | 20 | −6 | 10 | 3.31 | 0.005 |
| Basal ganglia (pallidum) | R | 22 | −8 | 8 | 3.26 | 0.005 |
| Cluster 2: 528 voxels | ||||||
| pre-SMA (BA 6) | R | 8 | 18 | 68 | 4.13 | 0.004 |
| R | 8 | 2 | 70 | 3.72 | 0.004 | |
| R | 8 | 22 | 58 | 3.45 | 0.004 | |
| R | 2 | 16 | 48 | 3.19 | 0.006 | |
| Dorsal anterior cingulate (BA 32) | R | 8 | 24 | 42 | 2.97 | 0.008 |
| R | 6 | 28 | 40 | 2.96 | 0.008 | |
| Cluster 3: 404 voxels | ||||||
| Anterior insula | L | −30 | 28 | 0 | 4.25 | 0.004 |
| L | −36 | 16 | 0 | 3.72 | 0.004 | |
| L | −26 | 20 | −8 | 3.38 | 0.005 | |
| Cluster 4: 347 voxels | ||||||
| Supramarginal gyrus (BA 40) | R | 56 | −36 | 44 | 3.63 | 0.004 |
| R | 54 | −36 | 40 | 3.62 | 0.004 | |
| Cluster 5: 232 voxels | ||||||
| Middle frontal gyrus (DLPFC, BA 46) | R | 32 | 46 | 16 | 4.22 | 0.004 |
| R | 26 | 50 | 22 | 3.90 | 0.004 | |
| Cluster 6: 131 voxels | ||||||
| Middle frontal gyrus (DLPFC, BA 9) | R | 48 | 18 | 44 | 3.37 | 0.004 |
| R | 48 | 14 | 42 | 3.15 | 0.006 | |
| Precentral gyrus (BA 6) | R | 42 | 6 | 36 | 3.30 | 0.005 |
| R | 46 | 10 | 44 | 3.17 | 0.006 | |
| R | 46 | 12 | 40 | 3.16 | 0.006 | |
| R | 52 | 4 | 40 | 3.02 | 0.008 | |
| Cluster 7: 41 voxels | ||||||
| Middle frontal gyrus (DLPFC, BA 46) | R | 38 | 30 | 32 | 3.71 | 0.004 |
| R | 36 | 38 | 34 | 2.99 | 0.008 | |
| Cluster 8: 37 voxels | ||||||
| Parietal operculum (S2, BA 43) | R | 68 | −20 | 20 | 3.73 | 0.004 |
R, Right; L, left; p. tri, pars triangularis; p. oper, pars opercularis; DLPFC, dorsolateral prefrontal cortex; S2, secondary somatosensory region.
Discussion
Proprioceptive feedback regarding body sway is crucial for maintaining upright stance, particularly when vision is compromised (Lord et al., 1991; Simoneau et al., 1992; Fitzpatrick and McCloskey, 1994; Speers et al., 2002). Further, reduced balance control is thought to be one of the leading causes of morbidity and mortality with older age (Tinetti et al., 1995; Tinetti and Williams, 1998). In the present study, a link was sought between proprioception-related neural activity in response to foot muscle spindle stimulation and balance task performance. A brain–behavior approach revealed that increased activity in several distributed young and older adult brain regions was associated with a reduction in maximum COP excursion in the AP direction, as reflected by ES. Given that a similar relationship was not evident for other sway metrics or for neural activity elicited by vibration of a nearby bone, these results suggest a specific link between brain regions involved in the processing of foot proprioceptive information and maximum AP excursion of COP such that the limits of AP COP excursion are garnered through foot muscle spindle feedback monitoring.
While previous attempts have been made to establish the central basis of balance control using behavioral assessments (for review, see Jacobs and Horak, 2007) and clinical populations such as stroke (Perennou et al., 2000) or multiple sclerosis (Cameron and Lord, 2010) patients, studies using brain imaging techniques are limited. This is, in part, because of the difficulties of acquiring imaging data during upright standing, including scanner orientation and head position stabilization issues. The few studies quantifying brain activity during standing have focused on young adults and used either positron emission tomography (Ouchi et al., 1999, 2001) or near-infrared spectroscopy (Mihara et al., 2008). In this work, it has been shown that cerebellar vermis and prefrontal cortex play active roles in balance control. Such findings are important, as they extend traditional views that maintenance of balance involves only deep subcortical and spinal neural mechanisms, supporting the notion that central, executive processing is an important aspect of standing performance (Maylor and Wing, 1996; Woollacott and Shumway-Cook, 2002; Doumas et al., 2009).
Beyond direct brain imaging during balance performance, research within the realm of gait and posture has also attempted to quantify the neural correlates of balance control using mental imagery of standing upright while lying supine in an fMRI scanner. Reported areas of activation from these studies include premotor cortex, pre-SMA, dorsolateral prefrontal areas, precuneus, inferior parietal lobe, insula, and cingulate, among others (Malouin et al., 2003; Jahn et al., 2004; Zwergal et al., 2010). While imagery-based balance studies are novel, a notable limitation is that actual stimulation of key sensory and motor systems is lacking. This may be particularly relevant with respect to the neural processing of ankle proprioceptive feedback, as was emphasized in the present study, given the importance of this information for monitoring body sway.
One of the more successful approaches to date, in terms of linking brain and behavior in the control of upright stance, involves associating aspects of brain structure with body sway. Using this approach, significant correlations have been noted between neuroimaging-derived measures of white matter integrity and ventricle size with aspects of body sway (Tell et al., 1998; Guttmann et al., 2000; Starr et al., 2003; Sullivan et al., 2009). For example, with respect to aging, Sullivan et al. (2009) recently showed that sulcal/ventricular enlargement and increased white matter hyperintensities predicted increased body sway during standing. These results, although not specific to proprioceptive information, suggest that key brain-derived biomarkers might exist that elucidate the presence of balance-related movement disorders.
In the present study, a correlational approach was also used to determine the neural substrate underlying young and old balance performance. However, an fMRI-based foot proprioceptive mapping technique was invoked to specifically relate brain areas known to be active during stimulation of key proprioceptors (i.e., muscle spindles) with proprioceptively demanding balance performance. Voxels showing a significantly increased magnitude with better ES balance performance were found in right-sided inferior frontal gyrus (BA 44/45/47), anterior insular cortex, and putamen/pallidum of the basal ganglia. These inferior frontal and insular regions, combined with the positive ES correlations seen in the pre-SMA/cingulate, right temporoparietal junction (BA 40), and the dorsolateral prefrontal cortex (BA 9/46), comprise a classical right-sided attention network thought to be responsible for detecting salient sensory stimuli in the environment (for review, see Corbetta and Shulman, 2002). With respect to balance control, it seems likely that this network was used by young and older adults to monitor changes in body sway during standing through the detection of salient, higher-order ankle proprioceptive feedback signals related to the maximum excursion of the COP. Indeed, similar brain–behavior associations were not seen when participants experienced less meaningful simulation of vibrotactile receptors in the BONE condition or for other balance parameters such as RMS and velocity.
Other correlations between ES balance performance and neural activity were seen in basal ganglia structures (i.e., pallidum and putamen), which fits well with a number of clinical observations in individuals with Parkinson's disease indicating that basal ganglia damage is associated with balance difficulties (for review, see Visser and Bloem, 2005). Although the basal ganglia have been traditionally ascribed a series of motor functions, prior human and animal work has brought to light a role for the basal ganglia as a sensory analyzer in general, and a proprioceptive feedback processor in specific (Lidsky et al., 1985). For example, single-cell recording studies with monkeys have shown that neurons in putamen (Crutcher and DeLong, 1984a,b) and, to a lesser extent, globus pallidus (DeLong et al., 1985) code for passive joint displacement. With respect to right putamen, our previous proprioceptive mapping work (Goble et al., 2011) not only demonstrated that this structure was active during stimulation of foot muscle spindles, but that the degree of activation was correlated with a behavioral test of ankle proprioceptive acuity (i.e., joint position matching task). Moreover, older adults had reduced activation compared with younger individuals in this structure, which was well explained by changes in structural integrity as assessed using fractional anisotropy from diffusion tensor imaging. These changes likely reflect the previously demonstrated vulnerability of the basal ganglia to age effects including, especially, volumetric declines (Walhovd et al., 2011).
Correlations between muscle spindle stimulation-active brain areas and ES balance performance were also seen in right ventral premotor cortex (BA 6) and right orbital frontal (BA 47) areas. Right ventral premotor cortex is an area that has been shown to modulate primary somatosensory cortex activations (Christensen et al., 2007) and right orbital frontal cortex is thought to represent anticipatory activity related to the expected sensory consequences of sensorimotor tasks (Schoenbaum et al., 2009). The right hemispheric nature of these and other correlated regions in this study aligns well with both our previous proprioceptive mapping work (Goble et al., 2011) and that of Naito and colleagues (2005, 2007), who found right hemisphere dominance for muscle spindle feedback processing. Indeed, we have argued that such a hemispheric specialization might underlie contralateral left arm accuracy advantages demonstrated on tests of upper limb joint position sense (Goble et al., 2005, 2006, 2009a,b; Goble and Brown, 2007, 2008a,b, 2009, 2010; Goble, 2010).
Somewhat surprisingly, no significant differences in correlated activity with ES balance performance were seen between young and older adults, even though correlation values were typically higher in magnitude with older age. It seems logical to conclude that the relative contributions of various brain areas to balance-related proprioceptive processing remain of equal importance across the lifespan. In addition, it should be noted that balance control is multifaceted in nature, relying on multisensory (i.e., proprioceptive, visual, vestibular) inputs and the rapid integration of motor responses. To this extent, it should be recognized that proprioceptive processing-based interpretations of the data in this study, while most appealing, are noncausal in nature and, therefore, do not fully discount alternative explanations of the data based on other aspects of sensorimotor function. For example, it remains possible that the correlated regions identified in this study were related to the general role proprioception plays in motor function, rather than being specific to balance.
Conclusion
Proprioceptive information from the ankle is thought to be highly involved in the control of upright standing performance. Unlike previous, more general attempts to determine central processing factors underlying balance control, the present study was the first to attempt to specifically link ankle proprioception-specific neural activity with various balance performance metrics on a standing task. The results of this study showed that right-sided areas of the parietal, frontal, and insular cortex likely comprise a proprioceptive stimulus-driven attentional network for processing information related to the limits of body sway in the AP direction. These regions, in association with activity in right basal ganglia structures, also appear equally important for the balance control abilities of young and older adults. In future studies, the extent to which such brain–behavior relationships might comprise meaningful biomarkers of balance control in individuals with more substantive balance deficits will hopefully be determined.
Footnotes
This work was supported by grants from the Research Fund Katholieke Universiteit Leuven, Belgium (OT/07/073 and OT/11/071), the Flanders Fund for Scientific Research (G.0593.08 and G.0483.10N), and Grant P6/29 from the Interuniversity Attraction Poles program of the Belgian federal government. Additional postdoctoral support for D.J.G. was provided by the Research Council of the Katholieke Universiteit Leuven (F/07/063), the Research Foundation Flanders, and the Canadian Institutes of Health Research Institute of Aging. We thank Ben Krasnow and Paul Meugens for technical assistance related to development of vibration equipment.
References
- Andersson JL, Hutton C, Ashburner J, Turner R, Friston K. Modeling geometric deformations in EPI time series. Neuroimage. 2001;13:903–919. doi: 10.1006/nimg.2001.0746. [DOI] [PubMed] [Google Scholar]
- Brett M, Anton JL, Valabregue R, Poline JB. Region of interest analysis using an SPM toolbox. Paper presented at 8th International Conference on Functional Mapping of the Human Brain; June; Sendai, Japan. 2002. [Google Scholar]
- Calvin-Figuière S, Ramaiguère P, Gilhodes JC, Roll JP. Antagonist motor responses correlate with kinesthetic illusions induced by tendon vibration. Exp Brain Res. 1999;124:342–350. doi: 10.1007/s002210050631. [DOI] [PubMed] [Google Scholar]
- Calvin-Figuière S, Ramaiguère P, Roll JP. Relations between the directions of vibration-induced kinesthetic illusions and the pattern of activation of antagonist muscles. Brain Res. 2000;881:128–138. doi: 10.1016/s0006-8993(00)02604-4. [DOI] [PubMed] [Google Scholar]
- Cameron MH, Lord S. Postural control in multiple sclerosis: implications for fall prevention. Curr Neurol Neurosci Rep. 2010;10:407–412. doi: 10.1007/s11910-010-0128-0. [DOI] [PubMed] [Google Scholar]
- Christensen MS, Lundbye-Jensen J, Geertsen SS, Petersen TH, Paulson OB, Nielsen JB. Premotor cortex modulates somatosensory cortex during voluntary movements without proprioceptive feedback. Nat Neurosci. 2007;10:417–419. doi: 10.1038/nn1873. [DOI] [PubMed] [Google Scholar]
- Corbetta M, Shulman GL. Control of goal-directed and stimulus-driven attention in the brain. Nat Rev Neurosci. 2002;3:201–215. doi: 10.1038/nrn755. [DOI] [PubMed] [Google Scholar]
- Crutcher MD, DeLong MR. Single cell studies of the primate putamen. I. Functional organization. Exp Brain Res. 1984a;53:233–243. doi: 10.1007/BF00238153. [DOI] [PubMed] [Google Scholar]
- Crutcher MD, DeLong MR. Single cell studies of the primate putamen. II. Relations to direction of movement and pattern of muscular activity. Exp Brain Res. 1984b;53:244–258. doi: 10.1007/BF00238154. [DOI] [PubMed] [Google Scholar]
- DeLong MR, Crutcher MD, Georgopoulos AP. Primate globus pallidus and subthalamic nucleus: functional organization. J Neurophysiol. 1985;53:530–543. doi: 10.1152/jn.1985.53.2.530. [DOI] [PubMed] [Google Scholar]
- Doumas M, Rapp MA, Krampe RT. Working memory and postural control: adult age differences in potential for improvement, task priority, and dual tasking. J Gerontol B Psychol Sci Soc Sci. 2009;64:193–201. doi: 10.1093/geronb/gbp009. [DOI] [PMC free article] [PubMed] [Google Scholar]
- Fitzpatrick R, McCloskey DI. Proprioceptive, visual and vestibular thresholds for the perception of sway during standing in humans. J Physiol. 1994;478:173–186. doi: 10.1113/jphysiol.1994.sp020240. [DOI] [PMC free article] [PubMed] [Google Scholar]
- Folstein MF, Folstein SE, McHugh PR. “Mini-mental state”: a practical method for grading the cognitive state of patients for the clinician. J Psychiatr Res. 1975;12:189–198. doi: 10.1016/0022-3956(75)90026-6. [DOI] [PubMed] [Google Scholar]
- Friston KJ, Holmes AP, Poline JB, Grasby PJ, Williams SC, Frackowiak RS, Turner R. Analysis of fMRI time-series revisited. Neuroimage. 1995;2:45–53. doi: 10.1006/nimg.1995.1007. [DOI] [PubMed] [Google Scholar]
- Friston KJ, Rotshtein P, Geng JJ, Sterzer P, Henson RN. A critique of functional localisers. Neuroimage. 2006;30:1077–1087. doi: 10.1016/j.neuroimage.2005.08.012. [DOI] [PubMed] [Google Scholar]
- Goble DJ. Proprioceptive acuity assessment via joint position matching: from basic science to general practice. Phys Ther. 2010;90:1176–1184. doi: 10.2522/ptj.20090399. [DOI] [PubMed] [Google Scholar]
- Goble DJ, Brown SH. Task-dependent asymmetries in the utilization of proprioceptive feedback for goal-directed movement. Exp Brain Res. 2007;180:693–704. doi: 10.1007/s00221-007-0890-7. [DOI] [PubMed] [Google Scholar]
- Goble DJ, Brown SH. The biological and behavioral basis of upper limb asymmetries in sensorimotor performance. Neurosci Biobehav Rev. 2008a;32:598–610. doi: 10.1016/j.neubiorev.2007.10.006. [DOI] [PubMed] [Google Scholar]
- Goble DJ, Brown SH. Upper limb asymmetries in the matching of proprioceptive versus visual targets. J Neurophysiol. 2008b;99:3063–3074. doi: 10.1152/jn.90259.2008. [DOI] [PubMed] [Google Scholar]
- Goble DJ, Brown SH. Dynamic proprioceptive target matching behavior in the upper limb: effects of speed, task difficulty and arm/hemisphere asymmetries. Behav Brain Res. 2009;200:7–14. doi: 10.1016/j.bbr.2008.11.034. [DOI] [PubMed] [Google Scholar]
- Goble DJ, Brown SH. Upper limb asymmetries in the perception of proprioceptively determined dynamic position sense. J Exp Psychol Hum Percept Perform. 2010;36:768–775. doi: 10.1037/a0018392. [DOI] [PubMed] [Google Scholar]
- Goble DJ, Lewis CA, Hurvitz EA, Brown SH. Development of upper limb proprioceptive accuracy in children and adolescents. Hum Mov Sci. 2005;24:155–170. doi: 10.1016/j.humov.2005.05.004. [DOI] [PubMed] [Google Scholar]
- Goble DJ, Lewis CA, Brown SH. Upper limb asymmetries in the utilization of proprioceptive feedback. Exp Brain Res. 2006;168:307–311. doi: 10.1007/s00221-005-0280-y. [DOI] [PubMed] [Google Scholar]
- Goble DJ, Coxon JP, Wenderoth N, Van Impe A, Swinnen SP. Proprioceptive sensibility in the elderly: degeneration, functional consequences and plastic-adaptive processes. Neurosci Biobehav Rev. 2009;33:271–278. doi: 10.1016/j.neubiorev.2008.08.012. [DOI] [PubMed] [Google Scholar]
- Goble DJ, Hurvitz EA, Brown SH. Deficits in the ability to use proprioceptive feedback in children with hemiplegic cerebral palsy. Int J Rehabil Res. 2009a;32:267–269. doi: 10.1097/MRR.0b013e32832a62d5. [DOI] [PubMed] [Google Scholar]
- Goble DJ, Noble BC, Brown SH. Proprioceptive target matching asymmetries in left-handed individuals. Exp Brain Res. 2009b;197:403–408. doi: 10.1007/s00221-009-1922-2. [DOI] [PubMed] [Google Scholar]
- Goble DJ, Coxon JP, Van Impe A, De Vos J, Wenderoth N, Swinnen SP. The neural control of bimanual movements in the elderly: brain regions exhibiting age-related increases in activity, frequency-induced neural modulation, and task-specific compensatory recruitment. Hum Brain Mapp. 2010;31:1281–1295. doi: 10.1002/hbm.20943. [DOI] [PMC free article] [PubMed] [Google Scholar]
- Goble DJ, Coxon JP, Van Impe A, Geurts M, Van Hecke W, Sunaert S, Wenderoth N, Swinnen SP. The neural basis of central proprioceptive processing in older versus younger adults: an important sensory role for right putamen. Hum Brain Mapp. 2011 doi: 10.1002/hbm.21257. [DOI] [PMC free article] [PubMed] [Google Scholar]
- Goodwin GM, McCloskey DI, Matthews PB. Proprioceptive illusions induced by muscle vibration: contribution by muscle spindles to perception? Science. 1972;175:1382–1384. doi: 10.1126/science.175.4028.1382. [DOI] [PubMed] [Google Scholar]
- Guttmann CR, Benson R, Warfield SK, Wei X, Anderson MC, Hall CB, Abu-Hasaballah K, Mugler JP, 3rd, Wolfson L. White matter abnormalities in mobility-impaired older persons. Neurology. 2000;54:1277–1283. doi: 10.1212/wnl.54.6.1277. [DOI] [PubMed] [Google Scholar]
- Heuninckx S, Wenderoth N, Debaere F, Peeters R, Swinnen SP. Neural basis of aging: the penetration of cognition into action control. J Neurosci. 2005;25:6787–6796. doi: 10.1523/JNEUROSCI.1263-05.2005. [DOI] [PMC free article] [PubMed] [Google Scholar]
- Heuninckx S, Wenderoth N, Swinnen SP. Systems neuroplasticity in the aging brain: recruiting additional neural resources for successful motor performance in elderly persons. J Neurosci. 2008;28:91–99. doi: 10.1523/JNEUROSCI.3300-07.2008. [DOI] [PMC free article] [PubMed] [Google Scholar]
- Horak FB, Dickstein R, Peterka RJ. Diabetic neuropathy and surface sway-referencing disrupt somatosensory information for postural stability in stance. Somatosens Mot Res. 2002;19:316–326. doi: 10.1080/0899022021000037782. [DOI] [PubMed] [Google Scholar]
- Inglis JT, Horak FB, Shupert CL, Jones-Rycewicz C. The importance of somatosensory information in triggering and scaling automatic postural responses in humans. Exp Brain Res. 1994;101:159–164. doi: 10.1007/BF00243226. [DOI] [PubMed] [Google Scholar]
- Jacobs JV, Horak FB. Cortical control of postural responses. J Neural Transm. 2007;114:1339–1348. doi: 10.1007/s00702-007-0657-0. [DOI] [PMC free article] [PubMed] [Google Scholar]
- Jahn K, Deutschländer A, Stephan T, Strupp M, Wiesmann M, Brandt T. Brain activation patterns during imagined stance and locomotion in functional magnetic resonance imaging. Neuroimage. 2004;22:1722–1731. doi: 10.1016/j.neuroimage.2004.05.017. [DOI] [PubMed] [Google Scholar]
- Kavounoudias A, Roll JP, Anton JL, Nazarian B, Roth M, Roll R. Proprio-tactile integration for kinesthetic perception: an fMRI study. Neuropsychologia. 2008;46:567–575. doi: 10.1016/j.neuropsychologia.2007.10.002. [DOI] [PubMed] [Google Scholar]
- Lajoie Y, Teasdale N, Cole JD, Burnett M, Bard C, Fleury M, Forget R, Paillard J, Lamarre Y. Gait of a deafferented subject without large myelinated sensory fibers below the neck. Neurology. 1996;47:109–115. doi: 10.1212/wnl.47.1.109. [DOI] [PubMed] [Google Scholar]
- Lidsky TI, Manetto C, Schneider JS. A consideration of sensory factors involved in motor functions of the basal ganglia. Brain Res. 1985;356:133–146. doi: 10.1016/0165-0173(85)90010-4. [DOI] [PubMed] [Google Scholar]
- Lord SR, Clark RD, Webster IW. Postural stability and associated physiological factors in a population of aged persons. J Gerontol. 1991;46:M69–M76. doi: 10.1093/geronj/46.3.m69. [DOI] [PubMed] [Google Scholar]
- Malouin F, Richards CL, Jackson PL, Dumas F, Doyon J. Brain activations during motor imagery of locomotor-related tasks: a PET study. Hum Brain Mapp. 2003;19:47–62. doi: 10.1002/hbm.10103. [DOI] [PMC free article] [PubMed] [Google Scholar]
- Maylor EA, Wing AM. Age differences in postural stability are increased by additional cognitive demands. J Gerontol B Psychol Sci Soc Sci. 1996;51:P143–P154. doi: 10.1093/geronb/51b.3.p143. [DOI] [PubMed] [Google Scholar]
- Mihara M, Miyai I, Hatakenaka M, Kubota K, Sakoda S. Role of the prefrontal cortex in human balance control. Neuroimage. 2008;43:329–336. doi: 10.1016/j.neuroimage.2008.07.029. [DOI] [PubMed] [Google Scholar]
- Montant M, Romaiguère P, Roll JP. A new vibrator to stimulate muscle proprioceptors in fMRI. Hum Brain Mapp. 2009;30:990–997. doi: 10.1002/hbm.20568. [DOI] [PMC free article] [PubMed] [Google Scholar]
- Naito E, Roland PE, Grefkes C, Choi HJ, Eickhoff S, Geyer S, Zilles K, Ehrsson HH. Dominance of the right hemisphere and role of area 2 in human kinesthesia. J Neurophysiol. 2005;93:1020–1034. doi: 10.1152/jn.00637.2004. [DOI] [PubMed] [Google Scholar]
- Naito E, Nakashima T, Kito T, Aramaki Y, Okada T, Sadato N. Human limb-specific and non-limb-specific brain representations during kinesthetic illusory movements of the upper and lower extremities. Eur J Neurosci. 2007;25:3476–3487. doi: 10.1111/j.1460-9568.2007.05587.x. [DOI] [PubMed] [Google Scholar]
- Oldfield RC. The assessment and analysis of handedness: the Edinburgh inventory. Neuropsychologia. 1971;9:97–113. doi: 10.1016/0028-3932(71)90067-4. [DOI] [PubMed] [Google Scholar]
- Ouchi Y, Okada H, Yoshikawa E, Nobezawa S, Futatsubashi M. Brain activation during maintenance of standing postures in humans. Brain. 1999;122:329–338. doi: 10.1093/brain/122.2.329. [DOI] [PubMed] [Google Scholar]
- Ouchi Y, Okada H, Yoshikawa E, Futatsubashi M, Nobezawa S. Absolute changes in regional cerebral blood flow in association with upright posture in humans: an orthostatic PET study. J Nucl Med. 2001;42:707–712. [PubMed] [Google Scholar]
- Pérennou DA, Leblond C, Amblard B, Micallef JP, Rouget E, Pélissier J. The polymodal sensory cortex is crucial for controlling lateral postural stability: evidence from stroke patients. Brain Res Bull. 2000;53:359–365. doi: 10.1016/s0361-9230(00)00360-9. [DOI] [PubMed] [Google Scholar]
- Roll JP, Vedel JP. Kinaesthetic role of muscle afferents in man, studied by tendon vibration and microneurography. Exp Brain Res. 1982;47:177–190. doi: 10.1007/BF00239377. [DOI] [PubMed] [Google Scholar]
- Roll JP, Vedel JP, Ribot E. Alteration of proprioceptive messages induced by tendon vibration in man: a microneurographic study. Exp Brain Res. 1989;76:213–222. doi: 10.1007/BF00253639. [DOI] [PubMed] [Google Scholar]
- Romaiguère P, Anton JL, Roth M, Casini L, Roll JP. Motor and parietal cortical areas both underlie kinaesthesia. Brain Res Cogn Brain Res. 2003;16:74–82. doi: 10.1016/s0926-6410(02)00221-5. [DOI] [PubMed] [Google Scholar]
- Schoenbaum G, Roesch MR, Stalnaker TA, Takahashi YK. A new perspective on the role of the orbitofrontal cortex in adaptive behaviour. Nat Rev Neurosci. 2009;10:885–892. doi: 10.1038/nrn2753. [DOI] [PMC free article] [PubMed] [Google Scholar]
- Simoneau GG, Leibowitz HW, Ulbrecht JS, Tyrrell RA, Cavanagh PR. The effects of visual factors and head orientation on postural steadiness in women 55 to 70 years of age. J Gerontol. 1992;47:M151–M158. doi: 10.1093/geronj/47.5.m151. [DOI] [PubMed] [Google Scholar]
- Speers RA, Kuo AD, Horak FB. Contributions of altered sensation and feedback responses to changes in coordination of postural control due to aging. Gait Posture. 2002;16:20–30. doi: 10.1016/s0966-6362(02)00003-6. [DOI] [PubMed] [Google Scholar]
- Starr JM, Leaper SA, Murray AD, Lemmon HA, Staff RT, Deary IJ, Whalley LJ. Brain white matter lesions detected by magnetic resonance imaging are associated with balance and gait speed. J Neurol Neurosurg Psychiatry. 2003;74:94–98. doi: 10.1136/jnnp.74.1.94. [DOI] [PMC free article] [PubMed] [Google Scholar]
- Sullivan EV, Rose J, Rohlfing T, Pfefferbaum A. Postural sway reduction in aging men and women: relation to brain structure, cognitive status, and stabilizing factors. Neurobiol Aging. 2009;30:793–807. doi: 10.1016/j.neurobiolaging.2007.08.021. [DOI] [PMC free article] [PubMed] [Google Scholar]
- Talairach J, Tournaux P. Co-planar stereotaxic atlas of the human brain. Stuttgart: Thieme; 1998. [Google Scholar]
- Tell GS, Lefkowitz DS, Diehr P, Elster AD. Relationship between balance and abnormalities in cerebral magnetic resonance imaging in older adults. Arch Neurol. 1998;55:73–79. doi: 10.1001/archneur.55.1.73. [DOI] [PubMed] [Google Scholar]
- Tinetti ME, Williams CS. The effect of falls and fall injuries on functioning in community-dwelling older persons. J Gerontol A Biol Sci Med Sci. 1998;53:M112–M119. doi: 10.1093/gerona/53a.2.m112. [DOI] [PubMed] [Google Scholar]
- Tinetti ME, Doucette J, Claus E, Marottoli R. Risk factors for serious injury during falls by older persons in the community. J Am Geriatr Soc. 1995;43:1214–1221. doi: 10.1111/j.1532-5415.1995.tb07396.x. [DOI] [PubMed] [Google Scholar]
- Visser JE, Bloem BR. Role of the basal ganglia in balance control. Neural Plast. 2005;12:161–174. doi: 10.1155/NP.2005.161. [DOI] [PMC free article] [PubMed] [Google Scholar]
- Walhovd KB, Westlye LT, Amlien I, Espeseth T, Reinvang I, Raz N, Agartz I, Salat DH, Greve DN, Fischl B, Dale AM, Fjell AM. Consistent neuroanatomical age-related volume differences across multiple samples. Neurobiol Aging. 2011;32:916–932. doi: 10.1016/j.neurobiolaging.2009.05.013. [DOI] [PMC free article] [PubMed] [Google Scholar]
- Woollacott M, Shumway-Cook A. Attention and the control of posture and gait: a review of an emerging area of research. Gait Posture. 2002;16:1–14. doi: 10.1016/s0966-6362(01)00156-4. [DOI] [PubMed] [Google Scholar]
- Zwergal A, Linn J, Xiong G, Brandt T, Strupp M, Jahn K. Aging of human supraspinal locomotor and postural control in fMRI. Neurobiol Aging. 2010 doi: 10.1016/j.neurobiolaging.2010.09.022. [DOI] [PubMed] [Google Scholar]