

Abstract
It has been known for many years that the power of beta-band oscillatory activity in motor-related brain regions decreases during the preparation and execution of voluntary movements. However, it is not clear yet whether the amplitude of this desynchronization is modulated by any parameter of the motor task. Here, we examined whether the degree of uncertainty about the upcoming movement direction modulated beta-band desynchronization during motor preparation. To this end, we recorded whole-head neuromagnetic signals while human subjects performed an instructed-delay reaching task with one, two, or three possible target directions. We found that the reduction of power of beta-band activity (16–28 Hz) during motor preparation was scaled relative to directional uncertainty. Furthermore, we show that the change of beta-band power correlates with the change of latency of response associated with response uncertainty. Finally, we show that the main source of beta-band desynchronization was located in the peri-Rolandic region. The results establish directional uncertainty as an important determinant of beta-band power during motor preparation and indicate that neural activity in the sensorimotor cortex during motor preparation covaries with directional uncertainty.
Introduction
It has been known for many years that the power of the brain oscillatory activity in the beta-band (∼13–30 Hz) decreases during the preparation and the execution of voluntary movements (Jasper and Penfield, 1949). Such a decrease of oscillatory activity relative to a control state is often referred to as an event-related desynchronization (ERD), whereas an increase in power is referred to as an event-related synchronization (ERS) (Pfurtscheller and Lopes da Silva, 1999). These changes of oscillatory activity have been observed using techniques, such as electroencephalography, magnetoencephalography, and local field potentials, that are sensitive to the net effect of the ionic currents resulting from neuronal activity (Pfurtscheller and Lopes da Silva, 1999). Beta ERD in relation to actual or imagined motor activity can be found across the motor-related brain network (Klostermann et al., 2007), including the basal ganglia (Courtemanche et al., 2003; Alegre et al., 2005), the thalamus (Paradiso et al., 2004), the cerebellar nuclei (Aumann and Fetz, 2004), and the posterior parietal cortex (MacKay and Mendonca, 1995; Brovelli et al., 2004). However, the most prominent source of beta-band ERD is located in the contralateral peri-Rolandic region (Pfurtscheller and Berghold, 1989; Sanes and Donoghue, 1993; Murthy and Fetz, 1996; Pfurtscheller and Neuper, 1997; Schnitzler et al., 1997; Formaggio et al., 2008).
The onset of beta-band ERD varies with the onset of motor preparation (Kaiser et al., 2001; Alegre et al., 2003; Kilner et al., 2005). However, it is not clear yet whether the amplitude of beta-band ERD is modulated by any parameter of the motor task. Motor parameters such as movement direction (Waldert et al., 2008), force (Mima et al., 1999; Tombini et al., 2009), speed (Stancak and Pfurtscheller, 1996; Tombini et al., 2009), and movement time (Cassim et al., 2000; Tombini et al., 2009) were not found to affect significantly the amplitude of beta-band ERD. For these reasons, beta-band ERD has been considered to be an undifferentiated reflection of neuronal activity (Stancak and Pfurtscheller, 1996). However, if beta-band ERD reflects motor preparation, we should expect that it be modulated by parameters affecting the complexity of motor preparation.
For example, it is known that the latency of motor responses increases progressively with the number of possible movement directions, which indicates that the level of motor preparation covaries with the degree of directional uncertainty (Bock and Arnold, 1992; Basso and Wurtz, 1998; Dorris and Munoz, 1998; Pellizzer and Hedges, 2003; Kveraga et al., 2006; Pellizzer et al., 2006; Churchland et al., 2008). Consequently, if both response latency and beta-band ERD reflect the complexity of motor preparation, we expect beta-band ERD to be modulated by directional uncertainty as well. For this reason, we implemented an instructed-delay reaching task with different degrees of uncertainty about the location of the upcoming target and recorded whole-head neuromagnetic signals while subjects performed the task.
Materials and Methods
Participants.
Five right-handed human subjects participated in the study (three males and two females; age range, 24–43 years). They had a normal or corrected-to-normal vision and no reported history of neurological or psychiatric illness. All subjects gave informed consent for participating in the study. The experimental protocol was approved by the Institutional Review Board of the Minneapolis Veterans Affairs Medical Center.
Task.
We implemented an instructed-delay reaching task with different degrees of uncertainty about the location of the upcoming target. Uncertainty varied with the number of spatial cues (N = 1, 2, or 3) that marked on the screen in front of the subject the set of possible locations of the target. Three different cue directions relative to the center of the screen were used: 45, 165, and 285° (directions defined relative to the trigonometric circle). All seven possible combinations of one-, two-, and three-cue locations were used. That is, there were three one-cue conditions, one for each location; three two-cue conditions, made of all possible pairs; and one three-cue condition, when all three locations were cued. Each cue in each cue combination became the target the same number of times. Thirty repetitions of each cue combination were presented in a pseudorandom order. When an error occurred (see below), the trial was reinserted randomly in the list of remaining trials, so that each subject had a complete set of valid trials in all conditions. This means that there were 90 trials for the one-cue and the two-cue conditions and 30 trials for the three-cue condition. A block of 30 practice trials preceded the actual recording.
The subject initiated a trial by placing a joystick-controlled cursor within a circular window (radius, 0.3° of visual angle) in the center of the display for a 3 s center-hold period. The subjects were instructed to fixate the center of the display during the center-hold and until the end of the trial. The center-hold period was followed by a cue period that varied randomly between 1.0 and 1.5 s, after which the target was presented. During the cue period, one, two, or three white circles (radius, 0.75° of visual angle) indicated the location(s) at which the target could appear. These circles were located at 4° of visual angle from the center of the display. The target was a white disc of same size as the cues and presented at the location of one of them. When the target appeared, the subject had to move the cursor quickly and accurately from the center onto the target. The trajectory of the cursor had to stay within a straight path that had the same width as the target; otherwise, the trial was counted as a movement direction error. The reaction time (RT) was defined as the time elapsed between the onset of the target and the exit of the cursor from the center window. RTs <100 ms or >1000 ms were counted as RT errors. The movement time (MT) was defined as the time between when the cursor exited the center window and when it entered the target. MTs >0.5 s were considered MT errors. When any of these errors occurred, the trial was presented again at a random position in the sequence of the remaining trials. An intertrial interval of 3 s separated each trial. The task was controlled using a (Microsoft Visual Basic) custom-made computer program. Figure 1 shows schematically the sequence of events during a trial.
Figure 1.

Schematic sequence of events in a trial of the instructed-delay task. The subjects held the joystick-controlled cursor in the center of the display for 3 s. Then, N = 1, 2, or 3 cues (circles) were presented on the screen for 1–1.5 s. The cues indicated the locations at which the upcoming target could appear. The figure shows a case with two cues located at 45° and at 165°. Each cue had the same chance to become the target. In the example, the cue at 45° became the target (disc) onto which the subjects had to move the cursor quickly and accurately. The subjects were instructed to fixate the center of the screen during the trial. The RT was defined as the duration between the onset of the target and the onset of the response, which was determined by the exit of the cursor from the center window. The MT was the duration between the onset of the response and the time when the cursor entered the target. An ITI of 3 s followed each trial.
Magnetoencephalography recordings.
The subjects were lying supine on a bed inside of a magnetically shielded room with their head in the detector helmet. An individually shaped dense foam cushion was placed between the subject's head and the detector helmet to improve comfort and minimize head movements. The visual stimuli and joystick-controlled cursor were presented on a screen ∼60 cm in front of the subject using a LCD video projector (Sony VPL-PX20) located outside of the shielded room. The joystick (model M11C0A9F modified for magnetoencephalography (MEG) compatibility; CH Products) was attached to the bed next to the subject's right hip in a way that the arm rested on the bed and the handle could be manipulated with the hand.
Neuromagnetic signals were recorded using a 248-channel whole-head MEG system equipped with first-order axial gradiometers (Magnes 3600 WH; 4-D Neuroimaging). The signals were bandpass filtered (0.1–400 Hz) and sampled at a rate of 1017.25 Hz. An electrooculogram (EOG) was recorded to identify epochs contaminated by eye movements or eye blinks. In addition, the onset time of the visual stimuli (cue and target) on the screen was measured with a photodiode. The EOG, photodiode, and joystick signals were recorded at 1017.25 Hz in auxiliary channels of the MEG system to ensure their synchronization with the MEG recording. Five small coils were attached on the subject's head to measure the position of the head relative to the detector array at the beginning and end of the recording session. The head shape of each subject was digitized using a three-dimensional digitizer (Fastrak; Polhemus). In addition, the positions of three fiducial points (nasion and left and right preauricular points) as well as the positions of the five coils on the head were also digitized.
Source analysis.
Head magnetic resonance images (MRIs) were obtained in separate sessions for the coregistration of brain anatomy and MEG data. The scanned volume extended from the top of the head to the bottom of the cerebellum and included all fiducial points. T1-weighted images were acquired with a three-dimensional spoiled gradient-echo pulse sequence using a 1.5 tesla magnetic resonance (MR) system [General Electric Signa Horizon LX; repetition time (TR), 20 ms; echo time (TE), 6 ms; flip angle, 30°; field of view (FOV), 240 × 240 mm; matrix, 256 × 256; slice thickness, 1.5 mm; 124 slices] for two subjects and a 3 tesla MR system (Siemens Magnetom Trio; TR, 20 ms; TE, 4.7 ms; flip angle, 22°; FOV, 256 × 256 mm; matrix, 256 × 256; slice thickness, 1 mm; 160 slices) for three subjects. The MRI and MEG data were coregistered using the fiducial points and the shape of the head. The registration was performed using BESA (MEGIS Software) and BrainVoyager QX (Brain Innovation). The source of the beta-band ERD was localized using the modified linearly constrained minimum variance beamformer (Gross et al., 2001) implemented in BESA. This analysis was performed using the data from all sensors recorded during 1 s posttarget time window and using a baseline of 1 s center-hold period.
Preprocessing of MEG data.
Cardiac artifacts were removed from each MEG channel using event-synchronous subtraction (Leuthold, 2003). In addition, trials were discarded when EOG signals indicated the occurrence of eye saccades or eye blinks. Other potential artifacts were eliminated by removing data from channels with signal amplitude exceeding 3000 fT/cm. The selected data were then bandpass filtered (0.5–45 Hz) and downsampled to 128 Hz to reduce the size of the data files. After the examination of time–frequency plots, we selected the 16–28 Hz frequency range as beta-band suitable for all subjects (see example in Fig. 2). To analyze the time-varying power of the beta-band across experimental conditions, we computed, first, the envelope of the signal using the Hilbert transform. Then, for every MEG channel, we computed the power Pi,j,k, for each time point i, cue combination j, and subject k, averaged across trials. The time-varying power was calculated by integrating the squared amplitude of the envelope over a 125 ms size window and by shifting the window every 62.5 ms. The change of power relative to the baseline Bj,k, which was defined as the average power during the last 1 s of the center-hold period, was expressed in decibels as follows:
 |
Figure 2.
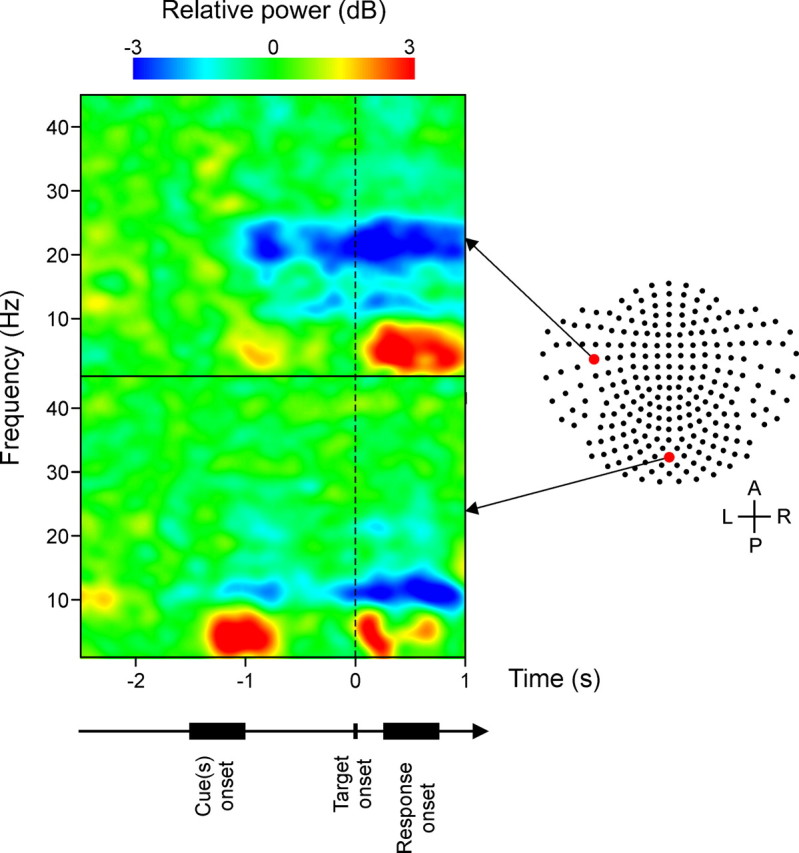
Examples of time–frequency (T–F) power plots for target-aligned data of subject 3. The range of cue onset and response onset is displayed below the time axis. The data originated from two channels identified on the two-dimensional map of the MEG 248-detector array. The anteroposterior (A–P) and left–right (L–R) axes are indicated as reference. The T–F plots show typical patterns of increase and decrease of power relative to the baseline in different frequency bands and with different time courses. We can notice the decrease of power in the beta-band (16–28 Hz) after cue onset for the channel from the left sensorimotor region.
Clustering of channels with beta-band ERD.
We sought to determine for each subject the ensemble of channels that described best the reduction of beta-band activity during the task. The goal was to aggregate channels that provided the same information about beta-band ERD and, consequently, improve the signal-to-noise ratio of the signal. To this end, we used a hierarchical clustering method to group channels that had similar changes of beta-band power during 1 s premovement and 0.5 s postmovement onset period. Similarity between channels was evaluated on the basis of the Euclidean distance between waveforms, whereas the clusters were formed using the complete linkage method (Johnson and Wichern, 2002). The number of clusters was determined for each subject on the basis of the scree test (Johnson and Wichern, 2002). We performed also the analysis by selecting the clusters on the basis of the pseudo-F criterion (Milligan and Cooper, 1985) and found very similar results (data not shown). The time course of beta-band power within each cluster was calculated by averaging the time-varying power across the channels forming each cluster. Finally, the cluster that had the greatest decrease of beta-band power relative to baseline was selected for the time-series analysis.
It is worthwhile to note that the adaptive search of channels with similar time-varying beta-band activity, described above, provides a nearly optimal cluster for the analysis of the signal. However, this cluster will necessarily vary across subjects. As a control, we analyzed also a fixed set of channels for all subjects (see supplemental material, available at www.jneurosci.org), even though a fixed set of channels is likely to be suboptimal because it might discard channels that provide the same information, or mix channels with different information. Nevertheless, the analysis of fixed clusters of channels has the advantage of being fairly straightforward to perform and can give interpretable results when considered with proper cautions.
Time-varying beta-band activity.
The event-related change of beta-band activity was analyzed in relation to the onset of the cues, the onset of the target, and the onset of the movement as follows. To analyze the data across subjects, we normalized the beta-band power relative to the level, Rk, reached during the motor response. For this purpose, we computed for each subject the average beta-band power, Rk, across all cue combinations during a 250 ms period aligned to and after the onset of the movement. The time-varying power relative to the power during the response was computed as follows:
 |
The absolute value of Rk was used to preserve the negative sign of ERD. As a consequence, Pi,j,k(%) varied for each subject between near 0% during the center-hold period to near −100% during the execution of the response. To determine the time at which beta-band power started to decrease after cue or target onset, we computed its 90% confidence interval during the 250 ms preceding stimulus onset, and then we selected the first time after stimulus onset at which beta-band power crossed the lower limit of the confidence interval.
Statistical analyses.
We tested the effect of number of cues on the time course of beta-band power using a linear mixed model (LMM) with the within-subject ARMA(1,1) covariance structure (Littell et al., 2000; West et al., 2007). The LMM included time and number of cue by time as fixed factors. The cue combination was nested within the number of cue condition and was defined as a random factor. In addition, we tested the effect of number of cues on RT and MT using a LMM with the within-subject compound symmetry covariance structure. This LMM included the fixed factor number of cues and the random factor cue combination nested within number of cues. Additional analyses were performed using a LMM to determine the effect of number of cues on the average beta-band power within a time window that either preceded the onset of the target or followed the onset of the motor response. For all LMM analyses, the covariance structure was selected on the basis of Schwarz's Bayesian criterion (Littell et al., 2000). The relation between change of RT and change of beta-band power was analyzed using an ANCOVA model with subject as random factor (Rutherford, 2001). All statistical analyses were implemented using SPSS (release 15; SPSS). Results at p < 0.05 were considered significant.
Results
Behavioral results
Average RT and average MT are plotted against number of cues in Figure 3. The analyses indicated that RT was significantly affected by number of cues (F(2,4) = 24.730; p = 0.006), whereas MT was not (F(2,4) = 0.186; p = 0.837). As expected, these results show that increasing the number of possible target locations increased RT, which is consistent with the results obtained previously with a similar experimental paradigm (Pellizzer and Hedges, 2003; Pellizzer et al., 2006).
Figure 3.

Average RT and MT for each number of cue condition. The error bars represent the SEM (N = 5 subjects).
Clusters of channels with beta-band ERD
The hierarchical cluster analysis resulted in an important decrease of complexity considering that 248 channels were reduced to two to four clusters per subject. The goal was to extract the channels that showed the same time-varying decrease of beta-band activity. As a consequence, we selected, for each subject, the cluster of channels that had the largest decrease in beta-band power during the perimovement onset period. Figure 4A shows the cluster selected for each subject, whereas Figure 4B represents the clusters cumulated across subjects. The size of the cluster of channels in which beta-band ERD had the same time course and amplitude varied greatly from subject to subject, but included in every case channels located in the contralateral mid-anteroposterior region. It has to be noted, however, that the relation between sensor space and source space is complex (Gross et al., 2001) and this selection of channels is not a substitute for the estimation of the brain source of beta-band ERD (see below). This analysis provided the basis for aggregating channels with the same information about beta-band ERD to improve the signal-to-noise ratio for the subsequent time-series analyses. We should note, however, that the time-series analysis of beta-band ERD using a fixed set of channels over regions of interest and presented as supplemental material (available at www.jneurosci.org) provided similar results to those reported below, which allowed for an independent verification of both the anatomic consistency and robustness of the findings.
Figure 4.

A, Channels with similar time-varying large decrease of beta-band power during the perimovement period. The channels, selected using a hierarchical cluster analysis, are shown in red on the map of the MEG 248-detector array for each subject (S1–S5). B, Cumulated clusters of channels across subjects. For each channel, the color code indicates the number of subjects that had that channel selected. All subjects had channels selected over the left sensorimotor region.
Time-series analysis of beta-band ERD
For each subject and condition, we computed the change of power of the beta-band relative to the baseline (Eq. 1) and normalized it relative to the power during the response (Eq. 2). Figure 5 shows the time course of the relative beta-band power for each number of cue condition aligned to the onset of the cues and aligned to the onset of the movement. As expected, the power of the beta-band decreased after the onset of the cues (time: F(23,373.616) = 17.657; p < 0.001). This change in power started on average 120 ms (SEM, 10 ms) after cue onset and was not significantly different across number of cue conditions (F(2,4) = 0.939; p = 0.463). In contrast, beta-band power decreased by an amount that varied with the number of cues (time by number of cues: F(48,214.602) = 2.457; p < 0.001). The greater the number of cues, the less the power of the beta-band decreased before stabilizing. As a consequence, the power level at the onset of the target varied with number of cues. The analysis of the average power during the 500 ms period preceding the onset of the target confirmed that it was significantly different across number of cue conditions (F(2,5.304) = 20.998; p = 0.003). Moreover, after the presentation of the target, the power of the beta-band decreased further (time: F(23,356.253) = 8.184; p < 0.001) after an average delay of 82 ms (SEM, 23 ms), which was not significantly different across number of cue conditions (F(2,4) = 0.164; p = 0.854). Again, however, the amount of decrease of beta-band power was dependent on the number of cues (time by number of cues: F(48,134.105) = 2.200; p < 0.001), so that it reached approximately the same level for each condition at the onset of the movement. Consequently, there was no significant effect of number of cues on beta-band power during the 250 ms after the onset of the motor response (F(2,8) = 0.047; p = 0.954). The analysis of response-aligned data provided similar statistical results to the target-aligned data.
Figure 5.

Time course of relative beta-band power for each number of cue condition. The power was centered relative to the baseline and normalized relative to the average power during all motor responses. The plots show the average time-series across subjects, and its SE, aligned to the onset of the cue period (left) and to the onset of the motor response (right). The gray rectangle indicates the range of target onset times.
Relation between RT and beta-band ERD
The effect of cue condition on both the level of beta-band power during motor preparation and RT indicates that the two measures are related, and suggests that the increase of mean RT with number of cues is associated with the widening of the gap between the level of beta-band power during the cue period and the level during the response. We characterized this relation further by analyzing how much RT changed as a function of the difference in beta-band power between the two task periods. More specifically, we analyzed the relation between the deviation of RT from each subject average RT against the difference in beta-band power measured during 500 ms preceding the onset of the target and the power during 250 ms at and after the onset of the motor response. The data for each subject and number of cue condition are plotted in Figure 6. In the one-cue condition, the level of beta-band power preceding target onset was close to the level reached during the response and the latency of response was shorter than average (Fig. 6, discs). In contrast, in the three-cue condition, the difference in power was larger and RT was longer than average (Fig. 6, triangles). The data for the two-cue condition were in-between (Fig. 6, squares) the data of the other conditions. Consequently, the ANCOVA indicated that the relation between change of RT and difference in beta-band power can be described by a linear model (Y = −61.4 − 1.3X; R2 = 0.686) with a significant slope (F(1,9) = 19.692; p = 0.002).
Figure 6.

Relation between RT and beta-band power. The scattergram shows the deviation of RT from the mean against the difference between beta-band power during the response and beta-band power preceding target onset for each number of cue condition and subject. The data from a same subject are connected by a gray line. The black line across the data points represents the least-squares fit considering subject as a random factor.
Source of beta-band ERD
The distributed source of beta-band ERD, computed using the data from all channels, is shown for each subject in Figure 7A, whereas the average source across subjects is displayed in Figure 7B. In all cases, the distributed source was strongly represented in the contralateral peri-Rolandic region, although it could extend to the ipsilateral hemisphere and/or to the posterior parietal region in some subjects. The transverse slice in Figure 7B, in which the central sulcus is indicated by a yellow line, shows that the average source included the left precentral and postcentral gyri. The Talairach space coordinates of the peak location of the source of beta-band ERD are indicated for each subject in Table 1. The results of the source analysis show that the reduction of beta-band activity originated mainly from the contralateral peri-Rolandic region, which is in agreement with the results of other studies mentioned above.
Figure 7.

Source of reduction of beta-band power estimated by the beamformer analysis. A, For each subject (S1–S5), the blue shading on the transverse slices of the subject's brain MRI indicates the region associated with 50–100% reduction of beta-band activity between baseline level and minimum level. The anteroposterior (A–P) and left–right (L–R) axes are indicated as reference. The left–right orientation of the MRI follows the radiological convention. B, Brain MRI and source of reduction of beta-band activity averaged across subjects after Talairach transformation. The yellow lines on the transverse slice identify the central sulcus. These analyses showed that the reduction of beta-band activity was originating mainly from the peri-Rolandic region contralateral to the hand used in the task.
Table 1.
Talairach space coordinates of the peak location of the source of reduction of beta-band power estimated by the beamformer analysis
| Subject | x (mm) | y (mm) | z (mm) | Cortical labels within ±5 mm of the x, y, z coordinates |
|---|---|---|---|---|
| S1 | −38 | −29 | +58 | Left postcentral gyrus; left precentral gyrus; left inferior parietal lobule |
| S2 | −26 | −23 | +52 | Left precentral gyrus; left postcentral gyrus |
| S3 | −32 | −17 | +58 | Left precentral gyrus |
| S4 | −41 | −17 | +52 | Left precentral gyrus; left postcentral gyrus |
| S5 | −54 | −23 | +43 | Left postcentral gyrus; left precentral gyrus; left inferior parietal lobule |
| Average | −38 | −22 | +53 | Left precentral gyrus; left postcentral gyrus |
The cortical labels were obtained using the automated database of Lancaster et al. (2000). They are listed in decreasing order of volume occupied within a 11-mm-side cube centered on the x, y, and z coordinates.
Discussion
Many studies have shown that the onset of beta-band ERD in motor-related brain regions is associated with motor preparation. Here, we have shown that beta-band ERD is modulated during motor preparation by the degree of uncertainty about the upcoming direction of response. More specifically, we found that the power of the beta-band decreased and stabilized at different levels depending on the number of possible responses: the greater the number of possible responses, the less the power decreased relative to baseline. In contrast, after the onset of the target, which resolved the response uncertainty and gave the “go” signal to respond, the power of the beta-band decreased further to reach the same level in every condition at the onset of the motor response. The consequence of the differential time course of beta-band ERD with number of cues was reflected on the latency of response: the smaller the gap of beta-band power between cue period and response period, the shorter the RT. Furthermore, we have shown that the main source of beta-band ERD was localized in the contralateral peri-Rolandic region. It should also be noted that the time course of the beta-band and its estimated brain source were quite consistent across subjects, unlike those of other bands including the alpha-band (8–13 Hz) (data not shown).
Localization of beta-band ERD
The hierarchical cluster analysis showed that a very similar time course of beta-band ERD was detected over an ensemble of sensors. However, this ensemble was variable across subjects, even though it always contained sensors over the contralateral central region. The variability across subjects underlines the advantage of using a method that adapts to each subject's pattern of signals and lets the data determine where a particular signal can be detected. This approach optimizes the signal-to-noise ratio by clustering channels with the same time-varying activity, in contrast to an approach that determines a priori sensors of interest. As mentioned in Introduction, a change of beta-band power can be detected in many different places within the brain motor-related network. However, individual differences in the position within the sensor helmet, in the brain sulci, and in regional brain activation have an effect on which sensors detect this change of activity in different subjects. Nevertheless, despite the variability at the sensor level, the group analysis of the main source of decrease of beta-band power showed that it was consistently located over the contralateral peri-Rolandic region.
Onset of beta-band ERD
We found that beta-band power decreased after 120 ms from cue onset regardless of the number of cues. This delay is similar to the 110 ms delay found by Zhang et al. (2008a) in go and no-go trials in monkeys. Both of these results suggest that the onset of motor preparation is not dependent on the type of information provided by the visual stimulus but rather that it is determined by a constant visuomotor delay. In addition, we found that the decrease of beta-band power after target onset and leading to the onset of the motor response occurred on average after 82 ms. This delay is also consistent with the finding by Zhang et al. (2008a) that the decision to execute or not the motor response in a go/no-go task occurs after ∼70 ms from the initial beta-band ERD. The shorter delay of beta-band ERD after target onset relative to the delay after cue onset suggests that the integration of visual information into the motor system is facilitated when there is less beta-band power.
Beta-band power and movement onset
We found that the change of RT across cue conditions was associated with a concomitant change in the gap between beta-band power during the preparatory period and the response period. Specifically, the closer beta-band power during motor preparation was to the level during the response, the shorter the response time was. A similar relation between RT and beta-band power before the response was found across different simple RT tasks (Senkowski et al., 2006) as well as in a visual discrimination task in monkeys (Zhang et al., 2008b). In other words, subjects respond more quickly if beta-band power is low when the stimulus to respond occurs. These results are consistent with the proposal that beta-band synchrony reflects a state of maintenance of posture at the expense of movement generation (Gilbertson et al., 2005; Androulidakis et al., 2007). Along the same line, elevated cortical and subthalamic beta-band synchrony is associated with bradykinesia in Parkinson's patients, whereas dopaminergic medication and subthalamic stimulation decrease beta-band synchrony and improves the motor function of these patients (Brown and Marsden, 1999; Doyle et al., 2005). In summary, all of these studies show that beta-band asynchrony is associated with readiness to move, whereas beta-band synchrony is associated with maintenance of posture.
Beta-band oscillations and neuronal spiking activity
Experimental and modeling studies have shown that neurons display spontaneous rhythmic spiking patterns that result from the synaptic interactions in corticocortical and corticothalamic loops and that these rhythms are modified by the behavioral state (Steriade, 2000; Robinson et al., 2001; Izhikevich and Edelman, 2008). In addition, it was demonstrated that inhibitory interneurons play a key role in the modulation of beta-band oscillations. In particular, the administration of benzodiazepines, which are GABAA receptor agonists, to healthy human subjects resulted in increased beta-band activity (Jensen et al., 2005), whereas the application of the GABAA receptor antagonist picrotoxin to motor cortical slices in vitro eliminated beta-band oscillations (Yamawaki et al., 2008). In other words, increased inhibition results in increased beta-band oscillations, whereas decreased inhibition results in decreased beta-band oscillations. Accordingly, even though the relation between motor cortical oscillatory activity and the spiking activity of single neurons can be complex (Murthy and Fetz, 1996; Donoghue et al., 1998), it was found that there is a strong negative correlation between pyramidal neurons spiking rate and beta-band power across motor cortical recording sites (Spinks et al., 2008). These results suggest that the different levels of beta-band power during motor preparation found in this experiment reflect different levels of motor cortical spiking rate, with the caveat that the two parameters are inversely related. This inference is consistent with the finding that neuronal preparatory spiking activity in oculomotor areas (specifically the superior colliculus and the lateral intraparietal sulcus) decreases when the number of potential saccadic targets increases (Basso and Wurtz, 1997; Dorris and Munoz, 1998; Churchland et al., 2008). Even though the skeletomotor and oculomotor systems are widely different, these results suggest that in both cases the degree of uncertainty about the upcoming response modulates in a very similar way the preparatory neuronal activity in the brain structures involved. Finally, the decrease of beta-band power during the response at the same level in all conditions suggests that motor cortical spiking activity was the same at the onset and during the motor response.
Beta event-related desynchronization versus event-related potentials
Event-related potentials (ERPs) have also been used to investigate brain processes of motor preparation. In particular, there is a sustained negativity during instructed-delay periods over central and parietal recording sites (Leuthold et al., 2004). It was shown that the amplitude of these signals is modulated by the amount of previous information provided to the subjects (Leuthold et al., 1996; Praamstra et al., 2009). The main advantage of ERPs is that they are more straightforward to compute than ERD/ERS. Indeed, ERPs are computed by averaging signals relative to a time event. For this reason, ERPs preserve only information that is both time-locked and phase-locked to the triggering event. In contrast, power components of brain signals preserve information that is time-locked whether or not it is also phase-locked (Pfurtscheller and Lopes da Silva, 1999). This difference explains why the time course of beta-band ERD is more tightly coupled with changes in motor preparation processes than the time course of ERPs (de Jong et al., 2006).
Different uncertainties
Several studies have investigated the brain mechanisms of decision making when there is uncertainty about the consequences of a response (Rushworth and Behrens, 2008; Schultz et al., 2008). Typically, in these studies, different responses have different probabilities to be rewarded as well as different payouts. In other words, the expected reward is a central component of these paradigms. Accordingly, it was found that brain regions processing reward-related information, such as the prefrontal cortex, which is the target of dopaminergic projections (Schultz, 2002), were prominently activated. In contrast, in the current study, uncertainty was related to the upcoming response to execute. However, once the target appeared, there was no uncertainty about the response to select nor about the outcome (reward) associated with it. As a consequence, this paradigm is useful for investigating how the brain processes information provided by the context to prepare potential responses.
Conclusion
In conclusion, the results establish response uncertainty as an important determinant of beta-band power during motor preparation. Furthermore, they indicate that neural activity in the sensorimotor cortex during motor preparation covaries with directional uncertainty. As a consequence, this finding provides a new tool for investigating how the brain processes information to prepare for potential responses in relatively unpredictable and complex contexts.
Footnotes
This study was supported by a Merit Review grant (G.P.) from the Office of Research and Development of the Department of Veterans Affairs and by the American Legion Brain Sciences Chair.
References
- Alegre M, Gurtubay IG, Labarga A, Iriarte J, Malanda A, Artieda J. Alpha and beta oscillatory changes during stimulus-induced movement paradigms: effect of stimulus predictability. Neuroreport. 2003;14:381–385. doi: 10.1097/00001756-200303030-00017. [DOI] [PubMed] [Google Scholar]
- Alegre M, Alonso-Frech F, Rodríguez-Oroz MC, Guridi J, Zamarbide I, Valencia M, Manrique M, Obeso JA, Artieda J. Movement-related changes in oscillatory activity in the human subthalamic nucleus: ipsilateral vs. contralateral movements. Eur J Neurosci. 2005;22:2315–2324. doi: 10.1111/j.1460-9568.2005.04409.x. [DOI] [PubMed] [Google Scholar]
- Androulidakis AG, Doyle LM, Yarrow K, Litvak V, Gilbertson TP, Brown P. Anticipatory changes in beta synchrony in the human corticospinal system and associated improvements in task performance. Eur J Neurosci. 2007;25:3758–3765. doi: 10.1111/j.1460-9568.2007.05620.x. [DOI] [PubMed] [Google Scholar]
- Aumann TD, Fetz EE. Oscillatory activity in forelimb muscles of behaving monkeys evoked by microstimulation in the cerebellar nuclei. Neurosci Lett. 2004;361:106–110. doi: 10.1016/j.neulet.2003.12.091. [DOI] [PubMed] [Google Scholar]
- Basso MA, Wurtz RH. Modulation of neuronal activity by target uncertainty. Nature. 1997;389:66–69. doi: 10.1038/37975. [DOI] [PubMed] [Google Scholar]
- Basso MA, Wurtz RH. Modulation of neuronal activity in superior colliculus by changes in target probability. J Neurosci. 1998;18:7519–7534. doi: 10.1523/JNEUROSCI.18-18-07519.1998. [DOI] [PMC free article] [PubMed] [Google Scholar]
- Bock O, Arnold K. Motor control prior to movement onset: preparatory mechanisms for pointing at visual targets. Exp Brain Res. 1992;90:209–216. doi: 10.1007/BF00229273. [DOI] [PubMed] [Google Scholar]
- Brovelli A, Ding M, Ledberg A, Chen Y, Nakamura R, Bressler SL. Beta oscillations in a large-scale sensorimotor cortical network: directional influences revealed by Granger causality. Proc Natl Acad Sci U S A. 2004;101:9849–9854. doi: 10.1073/pnas.0308538101. [DOI] [PMC free article] [PubMed] [Google Scholar]
- Brown P, Marsden CD. Bradykinesia and impairment of EEG desynchronization in Parkinson's disease. Mov Disord. 1999;14:423–429. doi: 10.1002/1531-8257(199905)14:3<423::aid-mds1006>3.0.co;2-v. [DOI] [PubMed] [Google Scholar]
- Cassim F, Szurhaj W, Sediri H, Devos D, Bourriez J, Poirot I, Derambure P, Defebvre L, Guieu J. Brief and sustained movements: differences in event-related (de)synchronization (ERD/ERS) patterns. Clin Neurophysiol. 2000;111:2032–2039. doi: 10.1016/s1388-2457(00)00455-7. [DOI] [PubMed] [Google Scholar]
- Churchland AK, Kiani R, Shadlen MN. Decision-making with multiple alternatives. Nat Neurosci. 2008;11:693–702. doi: 10.1038/nn.2123. [DOI] [PMC free article] [PubMed] [Google Scholar]
- Courtemanche R, Fujii N, Graybiel AM. Synchronous, focally modulated beta-band oscillations characterize local field potential activity in the striatum of awake behaving monkeys. J Neurosci. 2003;23:11741–11752. doi: 10.1523/JNEUROSCI.23-37-11741.2003. [DOI] [PMC free article] [PubMed] [Google Scholar]
- de Jong R, Gladwin TE, 't Hart BM. Movement-related EEG indices of preparation in task switching and motor control. Brain Res. 2006;1105:73–82. doi: 10.1016/j.brainres.2006.03.030. [DOI] [PubMed] [Google Scholar]
- Donoghue JP, Sanes JN, Hatsopoulos NG, Gaál G. Neural discharge and local field potential oscillations in primate motor cortex during voluntary movements. J Neurophysiol. 1998;79:159–173. doi: 10.1152/jn.1998.79.1.159. [DOI] [PubMed] [Google Scholar]
- Dorris MC, Munoz DP. Saccadic probability influences motor preparation signals and time to saccadic initiation. J Neurosci. 1998;18:7015–7026. doi: 10.1523/JNEUROSCI.18-17-07015.1998. [DOI] [PMC free article] [PubMed] [Google Scholar]
- Doyle LM, Kühn AA, Hariz M, Kupsch A, Schneider GH, Brown P. Levodopa-induced modulation of subthalamic beta oscillations during self-paced movements in patients with Parkinson's disease. Eur J Neurosci. 2005;21:1403–1412. doi: 10.1111/j.1460-9568.2005.03969.x. [DOI] [PubMed] [Google Scholar]
- Formaggio E, Storti SF, Avesani M, Cerini R, Milanese F, Gasparini A, Acler M, Pozzi Mucelli R, Fiaschi A, Manganotti P. EEG and FMRI coregistration to investigate the cortical oscillatory activities during finger movement. Brain Topogr. 2008;21:100–111. doi: 10.1007/s10548-008-0058-1. [DOI] [PubMed] [Google Scholar]
- Gilbertson T, Lalo E, Doyle L, Di Lazzaro V, Cioni B, Brown P. Existing motor state is favored at the expense of new movement during 13–35 Hz oscillatory synchrony in the human corticospinal system. J Neurosci. 2005;25:7771–7779. doi: 10.1523/JNEUROSCI.1762-05.2005. [DOI] [PMC free article] [PubMed] [Google Scholar]
- Gross J, Kujala J, Hämäläinen M, Timmermann L, Schnitzler A, Salmelin R. Dynamic imaging of coherent sources: studying neural interactions in the human brain. Proc Natl Acad Sci U S A. 2001;98:694–699. doi: 10.1073/pnas.98.2.694. [DOI] [PMC free article] [PubMed] [Google Scholar]
- Izhikevich EM, Edelman GM. Large-scale model of mammalian thalamocortical systems. Proc Natl Acad Sci U S A. 2008;105:3593–3598. doi: 10.1073/pnas.0712231105. [DOI] [PMC free article] [PubMed] [Google Scholar]
- Jasper H, Penfield W. Electrocorticograms in man: effect of voluntary movement upon the electrical activity of the precentral gyrus. Archiv fur Psychiatrie und Zeitschrift Neurologie. 1949;183:163–174. [Google Scholar]
- Jensen O, Goel P, Kopell N, Pohja M, Hari R, Ermentrout B. On the human sensorimotor-cortex beta rhythm: sources and modeling. Neuroimage. 2005;26:347–355. doi: 10.1016/j.neuroimage.2005.02.008. [DOI] [PubMed] [Google Scholar]
- Johnson RA, Wichern DW. Ed 5. Upper Saddle River, NJ: Prentice Hall; 2002. Applied multivariate statistical analysis. [Google Scholar]
- Kaiser J, Birbaumer N, Lutzenberger W. Event-related beta desynchronization indicates timing of response selection in a delayed-response paradigm in humans. Neurosci Lett. 2001;312:149–152. doi: 10.1016/s0304-3940(01)02217-0. [DOI] [PubMed] [Google Scholar]
- Kilner J, Bott L, Posada A. Modulations in the degree of synchronization during ongoing oscillatory activity in the human brain. Eur J Neurosci. 2005;21:2547–2554. doi: 10.1111/j.1460-9568.2005.04069.x. [DOI] [PubMed] [Google Scholar]
- Klostermann F, Nikulin VV, Kühn AA, Marzinzik F, Wahl M, Pogosyan A, Kupsch A, Schneider GH, Brown P, Curio G. Task-related differential dynamics of EEG alpha- and beta-band synchronization in cortico-basal motor structures. Eur J Neurosci. 2007;25:1604–1615. doi: 10.1111/j.1460-9568.2007.05417.x. [DOI] [PubMed] [Google Scholar]
- Kveraga K, Berryhill M, Hughes HC. Directional uncertainty in visually guided pointing. Percept Mot Skills. 2006;102:125–132. doi: 10.2466/pms.102.1.125-132. [DOI] [PubMed] [Google Scholar]
- Lancaster JL, Woldorff MG, Parsons LM, Liotti M, Freitas CS, Rainey L, Kochunov PV, Nickerson D, Mikiten SA, Fox PT. Automated Talairach atlas labels for functional brain mapping. Hum Brain Mapp. 2000;10:120–131. doi: 10.1002/1097-0193(200007)10:3<120::AID-HBM30>3.0.CO;2-8. [DOI] [PMC free article] [PubMed] [Google Scholar]
- Leuthold A. Subtraction of heart artifact from MEG data: the matched filter revisited. Soc Neurosci Abstr. 2003;29:863–15. [Google Scholar]
- Leuthold H, Sommer W, Ulrich R. Partial advance information and response preparation: inferences from the lateralized readiness potential. J Exp Psychol Gen. 1996;125:307–323. doi: 10.1037//0096-3445.125.3.307. [DOI] [PubMed] [Google Scholar]
- Leuthold H, Sommer W, Ulrich R. Preparing for action: inferences from CNV and LRP. J Psychophysiol. 2004;18:77–88. [Google Scholar]
- Littell RC, Pendergast J, Natarajan R. Modelling covariance structure in the analysis of repeated measures data. Stat Med. 2000;19:1793–1819. doi: 10.1002/1097-0258(20000715)19:13<1793::aid-sim482>3.0.co;2-q. [DOI] [PubMed] [Google Scholar]
- MacKay WA, Mendonça AJ. Field potential oscillatory bursts in parietal cortex before and during reach. Brain Res. 1995;704:167–174. doi: 10.1016/0006-8993(95)01109-9. [DOI] [PubMed] [Google Scholar]
- Milligan GW, Cooper MC. An examination of procedures for determining the number of clusters in a data set. Psychometrika. 1985;50:159–179. [Google Scholar]
- Mima T, Simpkins N, Oluwatimilehin T, Hallett M. Force level modulates human cortical oscillatory activities. Neurosci Lett. 1999;275:77–80. doi: 10.1016/s0304-3940(99)00734-x. [DOI] [PubMed] [Google Scholar]
- Murthy VN, Fetz EE. Oscillatory activity in sensorimotor cortex of awake monkeys: synchronization of local field potentials and relation to behavior. J Neurophysiol. 1996;76:3949–3967. doi: 10.1152/jn.1996.76.6.3949. [DOI] [PubMed] [Google Scholar]
- Paradiso G, Cunic D, Saint-Cyr JA, Hoque T, Lozano AM, Lang AE, Chen R. Involvement of human thalamus in the preparation of self-paced movement. Brain. 2004;127:2717–2731. doi: 10.1093/brain/awh288. [DOI] [PubMed] [Google Scholar]
- Pellizzer G, Hedges JH. Motor planning: effect of directional uncertainty with discrete spatial cues. Exp Brain Res. 2003;150:276–289. doi: 10.1007/s00221-003-1453-1. [DOI] [PubMed] [Google Scholar]
- Pellizzer G, Hedges JH, Villanueva RR. Time-dependent effects of discrete spatial cues on the planning of directed movements. Exp Brain Res. 2006;172:22–34. doi: 10.1007/s00221-005-0317-2. [DOI] [PubMed] [Google Scholar]
- Pfurtscheller G, Berghold A. Patterns of cortical activation during planning of voluntary movement. Electroencephalogr Clin Neurophysiol. 1989;72:250–258. doi: 10.1016/0013-4694(89)90250-2. [DOI] [PubMed] [Google Scholar]
- Pfurtscheller G, Lopes da Silva FH. Event-related EEG/MEG synchronization and desynchronization: basic principles. Clin Neurophysiol. 1999;110:1842–1857. doi: 10.1016/s1388-2457(99)00141-8. [DOI] [PubMed] [Google Scholar]
- Pfurtscheller G, Neuper C. Motor imagery activates primary sensorimotor area in humans. Neurosci Lett. 1997;239:65–68. doi: 10.1016/s0304-3940(97)00889-6. [DOI] [PubMed] [Google Scholar]
- Praamstra P, Kourtis D, Nazarpour K. Simultaneous preparation of multiple potential movements: opposing effects of spatial proximity mediated by premotor and parietal cortex. J Neurophysiol. 2009;102:2084–2095. doi: 10.1152/jn.00413.2009. [DOI] [PMC free article] [PubMed] [Google Scholar]
- Robinson PA, Rennie CJ, Wright JJ, Bahramali H, Gordon E, Rowe DL. Prediction of electroencephalographic spectra from neurophysiology. Phys Rev E Stat Nonlin Soft Matter Phys. 2001;63 doi: 10.1103/PhysRevE.63.021903. 021903. [DOI] [PubMed] [Google Scholar]
- Rushworth MF, Behrens TE. Choice, uncertainty and value in prefrontal and cingulate cortex. Nat Neurosci. 2008;11:389–397. doi: 10.1038/nn2066. [DOI] [PubMed] [Google Scholar]
- Rutherford A. London: Sage; 2001. Introducing ANOVA and ANCOVA: a GLM approach. [Google Scholar]
- Sanes JN, Donoghue JP. Oscillations in local field potentials of the primate motor cortex during voluntary movement. Proc Natl Acad Sci U S A. 1993;90:4470–4474. doi: 10.1073/pnas.90.10.4470. [DOI] [PMC free article] [PubMed] [Google Scholar]
- Schnitzler A, Salenius S, Salmelin R, Jousmäki V, Hari R. Involvement of primary motor cortex in motor imagery: a neuromagnetic study. Neuroimage. 1997;6:201–208. doi: 10.1006/nimg.1997.0286. [DOI] [PubMed] [Google Scholar]
- Schultz W. Getting formal with dopamine and reward. Neuron. 2002;36:241–263. doi: 10.1016/s0896-6273(02)00967-4. [DOI] [PubMed] [Google Scholar]
- Schultz W, Preuschoff K, Camerer C, Hsu M, Fiorillo CD, Tobler PN, Bossaerts P. Explicit neural signals reflecting reward uncertainty. Philos Trans R Soc Lond B Biol Sci. 2008;363:3801–3811. doi: 10.1098/rstb.2008.0152. [DOI] [PMC free article] [PubMed] [Google Scholar]
- Senkowski D, Molholm S, Gomez-Ramirez M, Foxe JJ. Oscillatory beta activity predicts response speed during a multisensory audiovisual reaction time task: a high-density electrical mapping study. Cereb Cortex. 2006;16:1556–1565. doi: 10.1093/cercor/bhj091. [DOI] [PubMed] [Google Scholar]
- Spinks RL, Kraskov A, Brochier T, Umilta MA, Lemon RN. Selectivity for grasp in local field potential and single neuron activity recorded simultaneously from M1 and F5 in the awake macaque monkey. J Neurosci. 2008;28:10961–10971. doi: 10.1523/JNEUROSCI.1956-08.2008. [DOI] [PMC free article] [PubMed] [Google Scholar]
- Stancak A, Jr, Pfurtscheller G. Event-related desynchronisation of central beta-rhythms during brisk and slow self-paced finger movements of dominant and nondominant hand. Cogn Brain Res. 1996;4:171–183. doi: 10.1016/s0926-6410(96)00031-6. [DOI] [PubMed] [Google Scholar]
- Steriade M. Corticothalamic resonance, states of vigilance and mentation. Neuroscience. 2000;101:243–276. doi: 10.1016/s0306-4522(00)00353-5. [DOI] [PubMed] [Google Scholar]
- Tombini M, Zappasodi F, Zollo L, Pellegrino G, Cavallo G, Tecchio F, Guglielmelli E, Rossini PM. Brain activity preceding a 2D manual catching task. Neuroimage. 2009;47:1735–1746. doi: 10.1016/j.neuroimage.2009.04.046. [DOI] [PubMed] [Google Scholar]
- Waldert S, Preissl H, Demandt E, Braun C, Birbaumer N, Aertsen A, Mehring C. Hand movement direction decoded from MEG and EEG. J Neurosci. 2008;28:1000–1008. doi: 10.1523/JNEUROSCI.5171-07.2008. [DOI] [PMC free article] [PubMed] [Google Scholar]
- West BT, Welch KB, Gałecki AT. Boca Raton, FL: Chapman and Hall/CRC; 2007. Linear mixed models. [Google Scholar]
- Yamawaki N, Stanford IM, Hall SD, Woodhall GL. Pharmacologically induced and stimulus evoked rhythmic neuronal oscillatory activity in the primary motor cortex in vitro. Neuroscience. 2008;151:386–395. doi: 10.1016/j.neuroscience.2007.10.021. [DOI] [PubMed] [Google Scholar]
- Zhang Y, Chen Y, Bressler SL, Ding M. Response preparation and inhibition: the role of the cortical sensorimotor beta rhythm. Neuroscience. 2008a;156:238–246. doi: 10.1016/j.neuroscience.2008.06.061. [DOI] [PMC free article] [PubMed] [Google Scholar]
- Zhang Y, Wang X, Bressler SL, Chen Y, Ding M. Prestimulus cortical activity is correlated with speed of visuomotor processing. J Cogn Neurosci. 2008b;20:1915–1925. doi: 10.1162/jocn.2008.20132. [DOI] [PubMed] [Google Scholar]