

Abstract
Glioblastoma multiforme (GBM) is an aggressive brain tumor that is resistant to all known therapies. Within these tumors, a CD133-positive cancer-initiating neural stem cell (NSC) population was shown to be resistant to gamma radiation through preferential activation of the DNA double-strand break (DSB) response machinery, including the ataxia-telangiectasia-mutated (ATM) kinase. The polycomb group protein BMI1 is enriched in CD133-positive GBM cells and required for their self-renewal in an INK4A/ARF-independent manner through transcriptional repression of alternate tumor suppressor pathways. We report here that BMI1 copurifies with DNA DSB response and nonhomologous end joining (NHEJ) repair proteins in GBM cells. BMI1 was enriched at the chromatin after irradiation and colocalized and copurified with ATM and the histone γH2AX. BMI1 also preferentially copurified with NHEJ proteins DNA-PK, PARP-1, hnRNP U, and histone H1 in CD133-positive GBM cells. BMI1 deficiency in GBM cells severely impaired DNA DSB response, resulting in increased sensitivity to radiation. In turn, BMI1 overexpression in normal NSCs enhanced ATM recruitment to the chromatin, the rate of γH2AX foci resolution, and resistance to radiation. BMI1 thus displays a previously uncharacterized function in controlling DNA DSB response and repair. Pharmacological inhibition of BMI1 combined with radiation therapy may provide an effective mean to target GBM stem cells.
Introduction
Glioblastoma multiforme (GBM) is the most common and lethal primary brain tumor. Despite many advances made in cancer therapies, the median survival is <1 year after diagnosis (Holland, 2001; Maher et al., 2001). It was shown that CD133+ GBM cells share features with neural stem cells (NSCs), such as the expression of neuroepithelial markers and the ability to grow as floating neurospheres that can be differentiated into neuronal and glial cells. CD133+ cells can generate brain tumors resembling the tumor of origin in serial xenotransplantation experiments, thus supporting the cancer stem cell hypothesis (Reya et al., 2001; Hemmati et al., 2003; Singh et al., 2003, 2004; Galli et al., 2004). These data are in accordance with genetic experiments in mice suggesting that malignant astrocytomas originate from NSCs (Alcantara Llaguno et al., 2009; Wang et al., 2009). The CD133+ cell fraction is enriched after radiation and is responsible for the radioresistance of GBM tumors, possibly through preferential activation of the DNA damage response machinery (Bao et al., 2006, Tamura et al., 2010).
Gamma radiation induces a DNA double-strand break (DSB) that is recognized by two primary sensors: the auto-activated ataxia-telangiectasia-mutated (ATM) kinase and NBS1 (O'Driscoll and Jeggo, 2006). NBS1 forms a complex (MRN) with Mre11 and Rad50 and recruits the complex to the break. The MRN complex is required for efficient phosphorylation and recruitment of ATM to the break (Lavin, 2007). These sensor proteins will phosphorylate H2AX to generate γH2AX, which represents the first mark of DNA damage sensing. Following DNA damage recognition, mediator proteins such as BRCA1, MDC1, and 53BP1 amplify the signal, which is then transduced to downstream effectors (Lee and Paull, 2007; Iijima et al., 2008).
Polycomb group proteins form large multimeric complexes that repress gene expression through histones modification and chromatin compaction (Valk-Lingbeek et al., 2004). Bmi1 is essential for postnatal mouse development and stem cell maintenance (van der Lugt et al., 1994; Jacobs et al., 1999a; Lessard and Sauvageau, 2003; Molofsky et al., 2003; Park et al., 2003; Bruggeman et al., 2005; Molofsky et al., 2005; Zencak et al., 2005). Bmi1 is also a cooperating oncogene with c-myc and is overexpressed in leukemias and neurological cancers (Haupt et al., 1991; van Lohuizen et al., 1991; Jacobs et al., 1999b; Leung et al., 2004; Bruggeman et al., 2007). Importantly, most Bmi1 functions in development, stem cell maintenance, and cancer have been attributed to transcriptional repression of the Ink4a/Arf locus (Sherr, 2001; Sharpless et al., 2004; Valk-Lingbeek et al., 2004).
We report here on a new function for BMI1 in DNA damage response. After gamma irradiation (IR), BMI1 is redistributed on the chromatin, where it colocalizes and copurifies with ATM and γH2AX. BMI1 also preferentially copurifies with proteins of the nonhomologous end joining (NHEJ) repair pathway in CD133+ cells. BMI1 inactivation impairs recruitment of the DNA DSB response machinery to the chromatin and renders GBM cells more radiosensitive, while BMI1 overexpression in normal NSCs improves DNA DSB response and cellular resistance to radiation.
Materials and Methods
GBM cell cultures
Fresh GBM samples were processed for cell cultures within 1 h after reception. Tumor was washed and cut into small pieces before mechanical dissociation in oxygenated HBSS. Cell suspensions were passed over a 40 mm filter mesh. After centrifugation, cells were resuspended in DMEM/F12 medium (Invitrogen) containing 0.25% glucose, N2 and B27 supplements, heparin (2 mg/ml; Sigma), gentamicin (25 mg/ml; Invitrogen), human recombinant FGF2 (10 ng/ml; Peprotech), and human recombinant EGF (20 ng/ml; Sigma). Afterward, cultures were allowed to grow for 3 weeks to form spherical colonies (i.e., neurospheres). For passages, neurospheres were incubated in an enzyme-free solution (Millipore Bioscience Research Reagents) at 37°C for 20 min, and mechanically dissociated with a 20 ga needle. After trituration, the single-cell suspension was plated in the same culture medium as stated before.
MEF cultures
Cultures were established from day 14 embryos and maintained at 20% oxygen concentration in DMEM containing 10% FBS and gentamicin (50 μg/ml; Invitrogen). Cells were frozen after the first passage following establishment and were considered at population doubling zero (PD 0) at this point. Cell number was determined and population doubling calculated at each passage. Mouse embryonic fibroblasts (MEFs) were grown on chamber glass slides, treated with 3 Gy of IR with a 0 min, 30 min, and 6 h incubation after IR.
Lentivirus and infection procedure
Sequence-specific oligonucleotide stretch shRNA designed to target the BMI-1 ORF (accession #: BC011652) were synthesized as follows: oligo #1 (nucleotides 1061-1081) 5′-CCTAATACT TTCCAGATTGAT-3′, oligo #2 (nucleotides 500-518) 5′-GCAGAAATGCATCGAACAA-3′, oligo #3 (nucleotides 1051-1069) 5′-AATGGACATACCTAATACT-3′, oligoScramble (nucleotides 573-591) 5′-GGTACTTCATTGA TGCCAC-3′; loop sequence TTCAAGAGA. The double-stranded shRNA sequences were cloned downstream of the H1P promoter of the H1P-UbqC-HygroEGFP plasmid using Age1, Sma1, and Xba1 cloning sites. The shRNA-expressing lentiviral plasmids were cotransfected with plasmids pCMVdR8.9 and pHCMV-G into 293FT packaging cells using Lipofectamine (Invitrogen) according to the manufacturer's instructions. Virus-containing media were collected, filtered, and concentrated by ultracentrifugation. Viral titers were measured by serial dilution on 293T cells followed by microscopic analysis 48 h later. For viral transduction, lentiviral vectors were added to dissociated cells before plating. Hygromycin selection (150 μg/ml) was added 48 h later. P53 shRNA lentiviral construct were purchased from Sigma (TRCN0000003755).
Stereotactic intracranial cell transplantation
Animals were handled in strict accordance with the Animal Care Committee of the Maisonneuve-Rosemont Hospital Research Centre. Cells were resuspended in oxygenated HBSS and 3 μl aliquots were injected stereotactically into 60-d-old NOD-SCID mouse cortex, following administration of general anesthesia (Somnotol; 60 mg/kg). Mice were placed in the stereotactic frame using ear bars and a hole was bored in the skull. The injection coordinates were 3 mm to the right of the midline, 2 mm anterior to the coronal suture, and 3 mm deep. The scalp was closed with wound clips (Harvard). Animals were followed daily for development of neurological deficits.
Immunohistochemistry and immunofluorescence procedures
For immunohistochemistry, tissues were fixed by immersion in 10% buffered formalin and embedded in paraffin according to standard protocols. Five- to seven-micrometer-thick sections were mounted on Super-Frost glass slides (Fisher Scientific). Slices were labeled using the Vectastain ABC kit (Vector) according to the manufacturer's instructions. DAB (Sigma) was used as the peroxidase substrate. Observations were made under a fluorescence microscope (Leica DMRE, Leica Microsystems) and images were captured with a digital camera (Retiga EX; QIMAGING; with OpenLab, version 3.1.1 software; Open-Lab). Antibodies used were as follows: BMI1 (US Biological), GFAP (DakoCytomation), and PH3 and γH2AX (Millipore).
For immunofluorescence, neurospheres were first irradiated at 3 Gy and incubated for 50 min. They were cryopreserved in CRYOMATRIX embedding medium (CEM) (Thermo Shandon) and cut at 8-μm-thick sections. Otherwise, cells were cultured in chamber slides before immunofluorescence analyses. Slices mounted on Super-Frost glass slides (Fisher Scientific) or cells were fixed for 15 min in paraformaldehyde 4% and washed three times in PBS 1×. Sections were blocked for 1 h in PBS 1× + 1% BSA + 0.1% Tween, and incubated overnight with primary antibody solutions at 4°C in a humidified chamber. After three washes in PBS, sections were incubated with secondary antibodies for 1 h at room temperature. Slides were mounted on coverslips in DAPI-containing mounting medium (Vector Laboratories). The following antibodies were used: BMI1 (US Biological), ATM-pSer1981 and MDC1 (Novus Biologicals), Mre11, pChk2, H3K9Ac, and H3K27me3 (Cell Signaling Technology), RNF8 and RNF2 (Abcam), 53BP1 (Cederlane), γH2AX (Millipore), CD133-PE (Miltenyi Biotec), MAP2 (Millipore Bioscience Research Reagents), and GFAP (DakoCytomation).
Fluorescence-activated cell sorting
Single-cell suspensions were fixed and permeabilized by using the Cytofix/Cytoperm Kit (BD Biosciences) according to the manufacturer's instructions. Afterward, cells were incubated with mouse anti-BrdU (Sigma) and rabbit anti-Ki67 (Millipore Bioscience Research Reagents). For the detection of phosphorylated histone H3, cells were immunostained with rabbit anti-PH3 (Millipore), and nuclei stained with propidium iodide just before cell acquisition in the fluorescence-activated cell sorting (FACS). The primary antibodies were visualized by using FITC-conjugated goat anti-rabbit and PE-conjugated goat anti-mouse (Millipore Bioscience Research Reagents). For CD133 staining, dissociated cells were labeled with a mouse anti CD133-PE (AC133, Miltenyi Biotec). Cells were acquired in a FACScan flow cytometer (Becton-Dickinson) at a flow rate of 250 cells/s. Dead cells and cell debris were excluded from acquisition by gating with FCS and SSC biparametric plot. For the analysis of apoptosis, cells were resuspended in Annexin V binding buffer, and stained with Cy5-Annexin V (PharMingen). Just before cell acquisition in the FACS, 10 μl of 7-AAD was added. For CD133+ cell purification, dissociated cells were labeled with a mouse anti CD133-PE and sorting was done using a FACSVantage flow cytometer (Becton-Dickinson) at a flow rate <3000 cells/s. After sorting, an aliquot of sorted cells was always reanalyzed to check for purity, which was usually >95%.
RT-PCR
All primers were designed to flank individual exons and tested by PCR in RT+ and RT− control extracts. Total RNA was isolated using TRIzol reagent (Invitrogen). Reverse transcription (RT) was performed using 1 μg of total RNA and the MML-V reverse transcriptase (Invitrogen). Real-time PCR was performed using the Platinum SYBRGreen SuperMix (Invitrogen) and a Real-Time PCR apparatus (ABI Prism 7000). Primer sets used were as follows: BMI1 (F) 5′-AATCCCCACCTGATGTGTGT-3′, (R) 5′-GCTGGTCTCCAGGTA ACGAA-3′; EZH2 (F) 5′-AGGACGGCTCCTCTAACCAT-3′, (R) 5′-CTTGGTGTTGCACTGTGCTT-3′; SIX3 (F) 5′-CCCACACAAGTAGGCAACTG-3′, (R) 5′-GTTACC-GAGAGGATGGAGGTG-3′; PAX6 (F) 5′-GTGTCCAACGGATGTGTGAG-3′, (R) 5′-CTAGCCAGGTTGCGAAGAAC-3′; GAPDH (F) 5′-TCACCAGGGCTGCTTTTAAC-3′, (R) 5′-ATCCACAGTCTTCTGGGTGG-3′. GAPDH was used as an internal standard for data calibration. The 2−ΔΔCt formula was used for the calculation of differential gene expression.
Immunoprecipitation and LC-MS/MS
Cells were resuspended in the K solution [20 mm sodium phosphate, 150 mm KCl, 30 mm sodium pyrophosphate, 0.1% NP-40, 5 mm EDTA, 10 mm NaF, and 0.1 mm Na3VO4 into CompleteMini protease inhibitor cocktail solution (Roche Diagnostics)] and sonicated. Whole-cell extracts were immunoprecipitated with 2 μg of IgG, BMI1, and p-ATM antibodies following Catch and Release version 2.0 kit procedures (Millipore) and used in Western blot experiments. For BMI1/Myc immunoprecipitation experiments, 293T cells were transfected with EFv-CVM-GFP or EFv-BMI1/Myc-CVM-GFP plasmids using Lipofectamine according to the manufacturer's instructions. Forty-eight hours later, transfected cells were irradiated (3 Gy) or left untreated, and allowed to settle for 20 min. Whole-cell extracts were collected in immunoprecipitation (IP) buffer [100 mm Tris-HCl, pH 7.5; 150 mm NaCl; 0.1% Tween 20; protease inhibitors Complete (Roche Applied Science)]. Following the determination of protein concentration, lysates were subjected to immunoaffinity purification. Briefly, protein extracts (4 mg) were incubated with continues rotation for 3 h at 4°C with 50 μl of affinity matrix carrying mouse monoclonal anti-c-Myc IgG (clone 9E10; Covance). The matrix was washed four times with the wash buffer (50 mm Tris-HCl, pH 7.5; 150 mm NaCl; 0.1% Tween 20; protease inhibitors Complete). The bound proteins were eluted by treating the beads twice with 1 bead volume (∼50 μl) of c-Myc peptide solution (Covance) (400 μg/ml in 20 mm Tris-HCl, pH 7.5, 150 mm NaCl) for 15 min and used in Western blot experiments. Detection and identification of immunoprecipitated proteins were performed by Western blot (see below) and LC-MS/MS (liquid chromatography–tandem mass spectrometry). For LC-MS/MS analysis, proteins were revealed in silver-stained gels, according to standard protocol. Protein band cutting, trypsin-based in-gel protein digestions, and subsequent LC-MS/MS procedures were performed in the Innovation Centre at Génome Québec.
Chromatin-bound assays
Cells were first lysed in 1% Triton-100/PBS solution and incubated 10 min at room temperature. Cells were then centrifugated for 30 s at 13,000 rpm. Chromatin-free proteins are in the supernatant, while chromatin-bound proteins are in the pellet. Pellet is then resuspended in a NP-40 buffer (protease inhibitor solution, 50 mm Tris-HCl, pH 7.6, 0.5% NP-40, 150 mm NaCl, 5 mm EDTA, 1 mm DTT, 1 mm NaF, 0.5 mm Na3VO4) for subsequent analyses.
Western blot
The neurospheres were first irradiated at 3 Gy incubated for 50 min or within a time lapse (0, 30 min, 1 h, 3 h, 6 h, and 24 h). Total protein extracts were prepared in the CompleteMini protease inhibitor cocktail solution (Roche Diagnostics) and sonicated. Protein contents were quantified using the Bradford reagent. Proteins were resolved in Laemmli buffer by SDS-PAGE electrophoresis and transferred to a Nitrocellulose Blotting Membrane (Pall). Membranes were blocked for 1 h in 5% nonfat milk in TBS 1× containing 0.05% of Tween and incubated overnight with primary antibodies. The next day, membranes were washed three times in TBS 1× with 0.05% Tween and incubated for 1 h at room temperature with corresponding horseradish peroxidase-conjugated secondary antibodies (Sigma) and developed using the Immobilon Western (Millipore). The following antibodies were used: BMI1 (US Biological), β-actin, RNF8, RNF2, DNA-PKcs, NBS1, and Ku80 (Abcam), PARP1 and p53 (Santa Cruz Biotechnology), Histone H3 and γH2AX (Millipore), ATM-pSer1981, ATM, and MDC1 (Novus Biologicals), 53BP1 (Cederlane), MRE11 (Cell Signaling Technology), Myc (Covance), and α tubulin (Sigma).
Colony-forming unit assay
After infection with the respective viruses for 48 h, the selection was added. Two days later, cells were irradiated at different radiation doses (0, 1, 3, 5, 7, 10 Gy) and plated on a thin layer Matrigel substrate-treated 24-well plate (BD Bioscience) and allowed to grow to confluence. Cultures were fixed in PBS, 4% PFA, and stained with Cresyl Violet. After washing, phase-contrast micrographs were taken.
MTT test (Alamar Blue assay)
The Alamar Blue is a nontoxic analog of MTT. It is a growth indicator based on the detection of metabolic activity. Cells were irradiated at different doses and incubated 24 h at 37°C. Alamar Blue was added to the medium (100 ml/ml of medium) and incubated for 6 h. Fluorescence was monitored at 530–560 nm of excitation and 590 nm emission wavelength in a 96 wells plate using a fluorescence multiplate reader (Perspective Biosystems).
Neutral CometAssay
DNA damage was assessed by whole single-cell gel electrophoresis assay according to the manufacturer's protocol (TREVIGEN CometAssay).
ROS level measurement
For ROS detection in cell homogenates, cells were homogenized by sonication in PBS-containing the CompleteMini protease inhibitor cocktail (Roche Diagnostics). The dichlorodihydrofluorescein diacetate (DCF-DA; Sigma) staining method was used for the quantification of ROS generation. The dye was added to the homogenates to achieve a final concentration of 25 μm. Fluorescence intensity was monitored using a fluorescence multiwell plate reader (PerSeptive Biosystems), at excitation 485 nm and emission 530 nm. Data are normalized to the amounts of proteins per sample. For ROS detection in whole-cell preparations, cells were incubated for 15 min in HBSS/DCF-DA (50 μm). Cell acquisition was made in a FACScan flow cytometer (Becton-Dickinson) at a flow rate of 300 cells/s. Results are expressed as the percentage of positive cells, and the mean fluorescence intensity (MFI) of the FL-1 channel.
Population doubling
Cells were irradiated at different doses and incubated for 5 d, where the number of cells was quantified and normalized to nonirradiated controls.
ATM inhibition
DMSO, 10 μm ATM inhibitor (KU55933; KuDOS Pharmaceuticals), or 20 μm caffeine (Sigma) was added to the cell culture medium 60 min before cell irradiation.
BMI1 overexpression
Full-length human BMI1 cDNA (2611 bp) was cloned by RT-PCR from normal human retina RNA extracts. The DNA fragment was cloned into a lentiviral vector to generate the EF-1α-BMI1.CMV-GFP construct (Chatoo et al., 2009).
Statistical analysis
Statistical differences were analyzed using Student's t test for unpaired samples. An ANOVA followed by the Dunnett test was used for multiple comparisons with one control group. Survival curve statistics were made with the Prism 5 software. The criterion for significance (p value) was set as mentioned in figures.
Statistical analysis of colocalization level were performed by using Zeiss microscope and LSM software as follows.
Weighted colocalization coefficient.
The sum of intensities of colocalizing pixels in one channel as compared to the overall sum of pixel intensities above threshold and in this channel is given by the following:
 |
where GV is gray value, MV is mean value, and C is channel.
Overlap coefficient (Mander).
The overlap coefficient is insensitive to differences in signal intensity between the two channels and to bleaching:
 |
where C is channel.
Supplemental material
Supplemental material (available at www.jneurosci.org) include four supplemental figures and legends, and supplemental Experimental Procedures.
Results
CD133+ cells can generate brain tumors and are radioresistant
It has been reported that not all GBM cell lines express CD133/PROMININ (Beier et al., 2007; Pollard et al., 2009). In our hands, however, all six established GBM cell lines grown as neurospheres in neural stem cell media were positive for CD133 (using either real-time PCR or FACS analyses; see supplemental Fig. 1, available at www.jneurosci.org as supplemental material, for INK4A/ARF and P53 status). When injected in the cortex of mice, CD133+ cells generated intracranial GBM-like tumors within 6–10 weeks in all treated animals (Fig. 1A). These tumors expressed BMI1 and the astrocytic marker glial fibrillary acidic protein (GFAP). They were also positive for the cell proliferation markers phospho-histone H3 (PH3) and proliferating cell nuclear antigen (PCNA) (Fig. 1B and data not shown). In contrast, injection of >1 × 10⁵ CD133− cells did not result in tumor formation in any of the treated animals (Fig. 1A). Upon irradiation, CD133+ cells rapidly activate γH2AX, in contrast to CD133− cells (Fig. 1C). CD133+ cells were also enriched compared to CD133− cells 48 h after irradiation at 5 Gy (i.e., from ∼10% to ∼30% of the total cell population) (Fig. 1D). These results confirm previous work showing that CD133+ cells contains the tumor forming cell population in xenotransplant experiments, that CD133+ cells preferentially activate the DNA damage response, and that CD133+ cells are radioresistant compared to CD133− cells (Singh et al., 2004; Bao et al., 2006; Tamura et al., 2010).
Figure 1.

CD133+ GBM cells can generate brain tumors. A, Kaplan–Meyer representation of the survival curves of NOD/SCID mice injected with purified GBM CD133− and CD133+ cells. Mice were grafted at postnatal day 30 with 8,000, 15,000, or 50,000 CD133+ cells or 100,000 CD133− cells. All mice grafted with CD133− cells were still alive 20 weeks after transplantation. The cell line used was GBM0811. ¢, Cells. B, Representative image of NOD/SCID mouse brain bearing secondary tumors following engraftment of CD133+ GBM cells (top left panel). Formalin-fixed paraffin-embedded sections of NOD/SCID mouse brain injected with 15,000 CD133+ GBM cells were labeled with antibodies against BMI1, GFAP, and PH3. Slides were counterstained with hematoxylin. The cell line used was GBM0811. C, CD133+ and CD133− cells were sorted and irradiated at 3 Gy. One hour after IR, cells were fixed and stained for γH2AX. The total number of γH2AX-positive cells was scored. Results are expressed as the percentage of γH2AX-positive cells over total DAPI-stained nuclei. Data are mean ± SEM (n = 3, **p < 0.01). The cell lines used were GBM1202 and GBM0811. D, Untreated or 5 Gy-irradiated GBM neurospheres were dissociated and stained with an anti-CD133-PE antibody. Cultures were analyzed 48 h after IR. The R1 gate delineates the cell population analyzed. Values are the percentages of CD133+ cells in the respective culture conditions. The cell line used was GBM0811. Scale bars: 100 μm (B) and 10 μm (C).
BMI1 is a component of the DNA damage response machinery
We have previously showed that BMI1 is enriched in CD133+ GBM cells and required for their self-renewal in an INK4A/ARF-independent manner through transcriptional repression of alternate tumor suppressor pathways. Near complete inactivation of BMI1 in GBM cells resulted in massive depletion of the CD133+ cell population through induction of differentiation and apoptosis. Notably, this phenotype could be transiently overcome by culturing the cells at a density 10× higher than normally used (Abdouh et al., 2009). Because CD133+ GBM cells are radioresistant compared to CD133− cells, and because some polycomb group proteins have been associated with the DNA damage repair machinery (Rouleau et al., 2007; Hong et al., 2008), we hypothesized that BMI1 is the factor involved in GBM stem cell resistance to γ radiation. To test this, we irradiated GBM cells in which BMI1 activity was reduced by ∼95% using a small hairpin RNA-encoding lentivirus against BMI1 (shBMI1#1) (supplemental Fig. 2B, available at www.jneurosci.org as supplemental material) (Abdouh et al., 2009). One hour after irradiation at 3 Gy, we found that 80% of control virus- (shScramble) infected cells were strongly positive for γH2AX foci, while only 20% of shBMI1-infected cells were weakly positive for γH2AX foci (Fig. 2A). Similarly, activation of Chk2 (phospho-Chk2), a downstream target of the ATM kinase, was significantly impaired by BMI1 knockdown (Fig. 2A), thus suggesting defective DNA damage response. Since γ radiation leads to rapid activation and redistribution of DNA damage response proteins to the chromatin, this result prompted us to determine BMI1 localization following irradiation. In nonirradiated GBM cells, BMI1 signal was detected at discrete foci typical of polycomb bodies (Fig. 2B). Following irradiation, we observed robust BMI1 redistribution on the chromatin (Fig. 2B). Quantitative analysis of the total fluorescence intensity revealed a twofold increase in BMI1 fluorescence in irradiated cells (n = 15) compared to unexposed cells (n = 15). ATM is a central mediator of the DNA damage response following DNA DSBs. Quantitative confocal microscopy analyses revealed that BMI1 largely colocalizes with phosphorylated (p)-ATM (the activated form), MDC1 and γH2AX in irradiated GBM cells (Fig. 2C; supplemental Fig. 2A, available at www.jneurosci.org as supplemental material). Similar observations were made in human NSCs derived from human embryonic stem cells (Fig. 2C). To test whether the increased in BMI1 fluorescence intensity is the result of an increase in total BMI1 protein level or BMI1 redistribution on the chromatin, we performed Western blot analyses on total cellular extracts and on cellular extracts that have been separated into soluble and chromatin-bound fractions (Fig. 2D). These studies revealed that total BMI1 protein levels are not increased following radiation. Rather, BMI1 is enriched in the chromatin fraction following radiation, similarly as DNA-PK and PARP-1 (Fig. 2D) (Haince et al., 2008).
Figure 2.

BMI1 interacts with the DNA damage response machinery. A, BMI1 depletion alters DNA damage response. CD133+ GBM cells were sorted and infected with scramble or shBMI1#1 viruses 5 d before IR at 3 Gy. One hour after IR, cells were fixed and stained for γH2AX and pChk2. Total γH2AX- and pChk2-positive cells were scored. Results are expressed as the percentage of positive cells over DAPI-stained nuclei. Data are presented as the mean ± SEM (n = 3, **p < 0.01). The cell lines used were GBM2802 and GBM1202. B, BMI1 is redistributed on the chromatin after radiation. GBM neurospheres were irradiated (3 Gy) or left untreated (control). One hour after IR, the spheres were sectioned and labeled with a BMI1 antibody (n = 6 independent cultures). The cell lines used were GBM1202, GBM0410, GBM0811, GBM2802, GBM0611, and GBM2002. C, hNSC or GBM cells were irradiated (3 Gy, 20 min) and labeled with BMI1, MDC1, p-ATM, or γH2AX antibodies. Note that for cell permeabilization, we used Tween 20 for GBM cells and Triton-100 for hNSCs. BMI1 colocalizes with p-ATM, MDC1, and γH2AX. Quantitative confocal microscopy analyses were performed with a Zeiss microscope and LSM software. Data are presented as colocalization coefficients (Cc) and overlap coefficients (Over. coef). The cell lines used were GBM0811, GBM0611, and GBM2002. D, BMI1 relocalizes to the chromatin after irradiation. GBM cells were irradiated (3 Gy; +) or left untreated (control; −). Five minutes after IR, cell cultures were fractionated into chromatin-free and chromatin-bound protein fractions. These fractions were subjected to immunoblot with BMI1, DNA-PKc, PARP-1, histone H3, and β-actin antibodies. The cell lines used were GBM0811, GBM0611, and GBM2802. E, BMI1 and p-ATM coprecipitate. GBM cells were irradiated (3 Gy, +) or left untreated (−). One hour after IR, protein extracts were subjected to IP using anti-IgG, BMI1, and pATM antibodies. Immunoblot analysis using pATM, 53BP1, Mre11, RNF8, RNF2, BMI1, γH2AX antibodies were performed. IgG was used as control antibody for nonspecific interactions (n = 3). The bands appearing after IgG IP in RNF8 blot correspond to Ig heavy chain. The cell lines used were GBM0811, GBM2802, and GBM2002. F, 293FT cells were transfected with EFv-CVM-GFP (GFP) or EFv-BMI1/Myc-CVM-GFP (BMI1/Myc-GFP) plasmids. Transfected cells were irradiated (3 Gy) or left untreated. Twenty minutes after IR, whole-cell homogenates were immunoprecipitated with an anti-Myc antibody and subjected to immunoblot with p-ATM, Mre11, Myc, and BMI1 antibodies. Inputs represent 1/20 of cell homogenates. Note the presence of a possible hyperphosphorylated form of p-ATM (*).
To test the possibility that BMI1 associates with DNA damage response proteins, we performed IP experiments on irradiated and nonirradiated GBM cells. IP of endogenous BMI1 protein led to visible coprecipitation of endogenous p-ATM only following irradiation (Fig. 2E). While no coprecipitation was observed with Mre11 or RNF8 in either condition, BMI1 coprecipitated with 53BP1, RNF2, and γH2AX with or without irradiation. Conversely, p-ATM IP led to a significant enrichment for BMI1, but this was radiation independent (Fig. 2E). Notably, the relative enrichment for BMI1 was greater in the p-ATM IP than in the BMI1 IP. A possible interpretation of this result is that the p-ATM antibody has a greater affinity for its native target than the BMI1 antibody. Not surprisingly, ATM also coprecipitated with Mre11 and RNF8 following irradiation and with 53BP1, RNF2, and γH2AX with or without irradiation (Fig. 2E). We performed comparable experiments in 293FT cells transfected with a vector expressing GFP or the BMI1 protein fused to a small Myc epitope tag (BMI1/Myc). Affinity purification of anti-Myc immunoprecipitated lysates led to a significant enrichment for BMI1 only in BMI1/Myc transfected cells, as revealed with anti-BMI1 or anti-Myc antibodies (Fig. 2F). BMI1 did not copurified with Mre11, as observed with GBM cell extracts (Fig. 2F). Importantly, while p-ATM was not detected in the input, a robust signal was detected in the eluted fraction. Densitometry quantification revealed threefold enrichment after irradiation (Fig. 2F). A band of higher molecular weight, probably corresponding to a hyperphosphorylated form of ATM, was also detected. These data indicate that BMI1 copurifies with p-ATM, γH2AX, RNF2, and 53BP1 in GBM cell lines. They also reveal a robust copurification of BMI1 with p-ATM that is enhanced by radiation. The observed interaction between BMI1 or p-ATM and DNA damage response proteins in the absence of radiation possibly reflects the presence of endogenous DNA damages induced by replication errors, genomic instability, or oxidative stress.
ATM copurification with BMI1 is partially dependent on ATM phosphorylation
To further analyze the interaction between BMI1 and ATM, we assess whether inhibition of ATM kinase activity would interfere with its association to BMI1. For this, we used an antibody that recognizes both p-ATM and nonphosphorylated ATM (ATM “total”). The specific ATM inhibitor (ATMi) that prevents autophosphorylation through competitive inhibition with the ATP binding domain of ATM was also used (Goodarzi et al., 2008; White et al., 2008). 293FT cells were transfected with vectors expressing GFP or the BMI1/Myc fusion protein, exposed or not to ATMi, and irradiated. Using IP against the Myc epitope, we first observed that in basal conditions, ATM total copurified with BMI1 with the same efficiency, with or without irradiation. In contrast, the copurification of p-ATM with BMI1 increased significantly after irradiation (Fig. 3A). In second, we observed that ATMi interfered with the copurification of ATM total with BMI1 only after irradiation (Fig. 3A). This suggests the possibility that BMI1 interacts (directly or indirectly) with nonphosphorylated ATM in the soluble nuclear fraction and with p-ATM in the chromatin-bound fraction. After irradiation, the shuffling of BMI1 to the chromatin leads to its dissociation from nonphosphorylated ATM and preferential interaction with p-ATM.
Figure 3.

BMI1 copurifies with the NHEJ proteins. A, 293T cells were transfected with the EFv-CMV-GFP (GFP) or EFv-BMI1-Myc-CMV-GFP (BMI1-Myc) plasmids. Transfected cells were exposed to an ATM kinase inhibitor (ATMi; 10 μm) or DMSO for 1 h, and irradiated (3 Gy) or left untreated. Twenty minutes after IR, whole-cell homogenates were immunoprecipitated with an anti-Myc antibody and subjected to Western blot analyses. The asterisk marks a notable reduction in total ATM IP upon cells exposure to ATMi. The cell lines used were GBM0611 and GBM0811. B–D, GBM cells were infected with the EFv-CMV-GFP (GFP)- or EFv-BMI1-Myc-CMV-GFP (BMI1-Myc)-carrying lentiviruses. Infected cells were sorted into CD133− and CD133+ fractions and irradiated (3 Gy, 20 min). Protein extracts were subjected to IP using an anti-Myc antibody. B, Immunoprecipitates were resolved by SDS-PAGE and revealed by silver staining. Indicated protein bands were excised from the gel, digested with trypsin, and analyzed by LC-MS. C, List of proteins immunoprecipitated with BMI1-Myc as identified by LC-MS. D, Immunoprecipitates were resolved in SDS-PAGE and analyzed by Western blot. Note the preferential copurification of BMI1 with NHEJ proteins in CD133+ cells.
BMI1 preferentially copurifies with NHEJ proteins in CD133+ cells
To better understand the possible underlying molecular mechanism linking BMI1 to DNA DSB response/repair in brain cancer-initiating neural stem cells, we undertook an unbiased approach to identify proteins that preferentially interact with BMI1 in CD133+ cells after acute DNA damage. GBM cells were infected with a lentivirus expressing GFP or the BMI1/Myc fusion protein. Five days after infection, the CD133+/GFP+ and CD133−/GFP+ cell populations were isolated by FACS and irradiated at 3 Gy. With this system, both CD133+ and CD133− cells carried equal amount of the BMI1/Myc fusion protein. Cell extracts were immunoprecipitated with anti-Myc coupled beads and separated on a SDS-PAGE gel for silver staining. Four predominant bands present in the CD133+ fraction were excised and analyzed by mass spectrometry (Fig. 3B). After removal of contaminant cytoskeletal protein sequences, we found the presence of unique sequences (i.e., DNA-PK, PARP-1, hnRNP U (SAF-A), and histone H1 variants) in each of the four bands (Fig. 3B,C). Surprisingly, all identified proteins are part of the NHEJ repair machinery (Rosidi et al., 2008; Britton et al., 2009; Iliakis, 2009; Mitchell et al., 2009). To confirm these observations, we performed Western blot analyses on total (input), negative control (GFP-only virus), and experimental (GFP-BMI1/Myc virus) CD133− and CD133+ fractions using specific antibodies. As expected, total BMI1 protein was more abundant in the CD133+ cell fraction (Fig. 3D, input) (Abdouh et al., 2009). However, after immunoprecipitation with the anti-Myc antibody (which only precipitate the BMI1/Myc transgenic protein), equal amounts of BMI1/Myc were present in the CD133− and CD133+ fractions (Fig. 3D, IP fractions). Notably, although DNA-PK and PARP-1 were more abundant in the CD133+ fraction of the total input (compared to the CD133-negative fraction), this difference was even more striking after BMI1/Myc immunoprecipitation (Fig. 3D). Furthermore, although Ku80 (another component of the NHEJ repair complex) and γH2AX were equally abundant in the total input fraction, they were highly enriched (Guirouilh-Barbat et al. 2004) after immunoprecipitation of BMI1/Myc in the CD133+ fraction (Fig. 3D). From this we conclude that BMI1 preferentially associate with NHEJ repair proteins and the histone γH2AX in CD133+ GBM cells after DNA DSB induction.
BMI1 focal accumulation is independent of ATM, Mdc1, or NBS1
To test whether BMI1 focal accumulation is dependent or not on other DNA DSB response proteins, we assessed its localization in ATM-, Mdc1-, or NBS1-deficient cells. We found that focal accumulation of BMI1 20 min after irradiation was highly comparable between wild-type and genetically deficient ATM or Mdc1 fibroblasts or NBS1 lymphocytes (Fig. 4A–C). Likewise, inhibition of ATM activity using ATMi or the nonspecific inhibitor caffeine did not prevent BMI1 focal accumulation (supplemental Fig. 2C, available at www.jneurosci.org as supplemental material). To determine what is first recruited after DNA damage, we evaluated BMI1, MDC1, H2AX, ATM, and MRE11 focal accumulation kinetics. Time course experiments revealed that BMI1 focal accumulation is very rapid and occurs ∼2.5 min after irradiation, apparently before or at the same time as the earliest response factors (Fig. 4D). We concluded that BMI1 foci formed rapidly and this occurs very early after DNA damage induction and is independent of ATM, Mdc1, or NBS1 activity.
Figure 4.
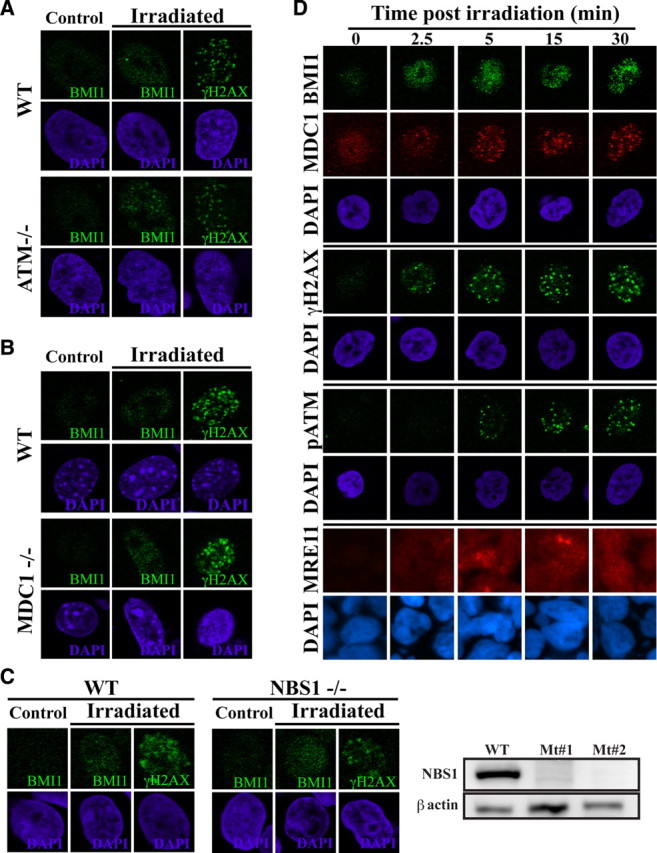
BMI1 focal accumulation is independent of ATM, NBS1, or Mdc1. A–C, Analysis of human fibroblasts deficient for ATM (A), MEFs deficient for Mdc1 (B), or immortalized human lymphocytes deficient for NBS1 (C). Wild-type or mutant cells were irradiated at 5 Gy and labeled with a BMI1 antibody. Focal accumulation of BMI1 was observed in ATM−/−, Mdc1−/−, and NBS1−/− cells. C, Western blot analysis confirmed NBS1 deficiency in NBS1-mutant cells. D, GBM cells irradiated at 3 Gy were fixed at different time point after IR and labeled with BMI1, p-ATM, MDC1, γH2AX, and Mre11 antibodies. Note that the recruitment of BMI1 precedes that of p-ATM, MDC1, or Mre11. The cell lines used were GBM0811 and GBM2002.
BMI1 knockdown impairs DNA damage recognition and repair in GBM cells
We tested the impact of BMI1 knockdown on the recruitment of the DNA damage response machinery in GBM cells. We found that focal accumulation of p-ATM was reduced in shBMI1 glioma cells after irradiation, and comparable or even more pronounced effects were observed for MRE11, RNF8, γH2AX, 53BP1, and MDC1 (Fig. 5A). Interestingly, we observed that the effect on DNA damage response proteins focal accumulation was proportional to BMI1 knockdown level in individual cells. Quantitative confocal microscopy analysis revealed that globally, BMI1 knockdown resulted in >50% reduction in p-ATM signal intensity (Fig. 5B). To evaluate the rate of DNA repair after BMI1 knockdown, we performed a time course experiment using a distinct construct that reduces BMI1 activity by ∼75% (shBMI1#2) (supplemental Fig. 2B, available at www.jneurosci.org as supplemental material). While most γH2AX foci were resolved 6 h after irradiation in control-virus (scramble) infected cells, numerous γH2AX foci were still present in shBMI1-infected cells (Fig. 5C). Also, the initiation of γH2AX foci appearance was delayed at 15 min in BMI1 knockdown cells, altogether suggesting delayed DNA damage recognition and repair. Furthermore, the basal level of γH2AX foci was higher in nonirradiated shBMI1-infected cells (5 d after infection), suggesting DNA damage accumulation or genomic instability (Fig. 5C). BMI1 has been shown to control reactive oxygen species (ROS) concentrations in mouse tissues and neurons (Chatoo et al., 2009; Liu et al., 2009). The persistence of DNA damages observed in shBMI1-infected GBM cells could thus be the consequence of increased ROS concentrations. We measured ROS concentrations, using either FACS analysis or total cellular extracts, in two distinct GBM cell lines infected with control or BMI1 knockdown lentiviruses. We did not observe changes in ROS concentrations after BMI1 knockdown in these cell lines (Fig. 5D).
Figure 5.

BMI1 deficiency impairs the DNA damage response. A, BMI1 depletion impairs recruitment of DNA damage response machinery. GBM cells were infected with scramble or shBMI1#1 viruses and irradiated at 3 Gy. One hour after IR, cells were fixed and colabeled with BMI1 and p-ATM, Mre11, RNF8, γH2AX, 53BP1, or MDC1 antibodies. Panel represents a deconvolution images acquired with a Leica DMRE fluorescence microscope and the OpenLab 3.1.1 software, with the exception of the MDC1 data, which was acquired with a Zeiss confocal microscope and the LSM software. The cell lines used were GBM0811, GBM2002, GBM2802, and GBM0611. B, BMI1 depletion impairs the recruitment of pATM. GBM cells were processed as in A, and pATM signal intensity was quantified using ImageJ software. Data are expressed as mean fluorescence intensity (MFI) ± SD. For each samples, 50 cells were analyzed. The cell line used was GBM2802. C, BMI1 depletion affects the kinetic of DNA repair. GBM cells infected with the scramble or shBMI1#2 virus were fixed at different time points after IR and labeled with the γH2AX antibody. The total number of γH2AX-positive cells was scored and presented as the percentage of γH2AX-positive cells over total DAPI-stained nuclei. Data are mean ± SEM (n = 3, *p < 0.05, **p < 0.01). The cell lines used were GBM0811 and GBM2802. D, GBM cells were infected with the scramble or shBMI1#1 virus, and ROS levels were determined (1) by using the DCF-DA tracer on cell homogenate (excitation and emission wavelength were 485 and 530 nm, respectively) or (2) on whole cells by FACS analysis, which gives the percentage of positive cells, and the respective MFI. Note that BMI1 knockdown had no effect on ROS levels.
Partial BMI1 knockdown impairs the radioresistance of GBM cells
In response to a DNA DSB, cells typically arrest in various phases of the cell cycle to repair their DNA, thus preventing the accumulation of mutations or the generation of chromosomal aberrations at mitosis. In contrast, cells deficient for genes involved in DNA damage response undergo mitosis independently of the presence of damages (Huen et al., 2007; Stewart et al., 2009). Because complete inactivation of BMI1 in glioma cells impairs CD133+ stem cell renewal and viability (Abdouh et al., 2009), we used a hypomorphic shBMI1 construct that reduces BMI1 activity by ∼50% (shBMI1#3) (supplemental Fig. 2B, available at www.jneurosci.org as supplemental material). With this construct, GBM cells proliferate at a close to normal rate and maintain CD133/PROMININ expression, although at reduced levels (data not shown). Scramble and shBMI1-infected GBM cells were analyzed for cell cycle arrest 1, 3, and 16 h after irradiation at 3 Gy. In normal growth conditions, both cell populations displayed comparable cell cycle kinetics (Fig. 6A,B). In response to radiation, control GBM cells arrested in G2/M, and then reestablished a normal cell cycle kinetic after 16 h (Fig. 6A). In contrast, most shBMI1#3-virus infected GBM cells did not reach the G2/M cell cycle phase (only 0.36%), even 16 h after irradiation (Fig. 6A). The same but less dramatic phenotype was observed in a second independent GBM cell line (data not shown). Although we observed a reduced number of progenitors in shBMI1#3-virus-treated cells 16 h after irradiation (as revealed by reduced Ki67 labeling), a comparable fraction of cells (∼10%) were BrdU positive in both cell populations. Because most shBMI1#3-virus-treated cells do not undergo mitosis 16 h after irradiation, the best interpretation of these results is that the cells remained blocked in S-phase. We also evaluated cell death rate. Consistently with the above observations, the proportion of AnnexinV-positive cells was higher in shBMI1-infected GBM cells before (scramble: 4.8%; shBMI1#3: 7.2%) and 1 h after irradiation (scramble: 6.2%; shBMI1#3: 12.1%). When normalized, this revealed a 29% increase in cell death for the scramble population and a 68% increase in cell death for the shBMI1#3 population. Thus, even partial BMI1 knockdown severely affects cell cycle progression and viability of GBM cells after irradiation.
Figure 6.

BMI1 is required for GBM cell radioresistance. A, B, Scramble or shBMI1#3 virus-infected GBM cells were irradiated (3 Gy) and analyzed by FACS 1, 3, or 16 h later. Single-cell suspensions were processed for PH3 labeling (A) or Ki67 labeling and BrdU incorporation (B). In A, PI was added just before FACS acquisition. Values are the percentages of PH3-positive cells. The cell lines used were GBM2802 and GBM0611. In B, BrdU was added to cell cultures 90 min before analysis. The cell line used was GBM2802. Values are the percentages of cells in the respective quadrants. Data are representative of two independent experiments. C–F, GBM cells infected with scramble or shBMI1#3 lentivirus were irradiated with five different radiation doses. BMI1 depleted GBM cells show increased radiation sensitivity as determined by MTT assay (cell lines used: GBM2802, GBM0410, and GBM0811) (C), population doubling (cell lines used: GBM2802 and GBM0811) (D), and CFU assay (E, F). In E (top middle panel), arrowheads indicate surviving colonies. Arrowheads in Eii indicate senescent cells. The EC50 of each cell line was determined using various radiation doses and represented in F when the number of colonies with more than five cells was equivalent to 50% of the total number of colonies in nonirradiated controls. Data are mean ± SEM (n = 3, *p < 0.05, **p < 0.01). Scale bars in E: 1 mm (left and middle panels); 50 μm (right panels).
To further characterize the impact of BMI1 deficiency, control and shBMI1-infected GBM cells from three independent primary cell lines were irradiated at various doses and analyzed for cell viability (MTT assay), population doubling, and colony-forming unit (CFU) capacity on Matrigel. Cells with reduced BMI1 activity were hypersensitive to radiation, where 1 Gy resulted in a similar metabolic effect as 7–10 Gy in control cells, as evaluated using the MTT assay (Fig. 6C). Population doubling analysis also revealed reduced cell survival and expansion capability (Fig. 6D). The CFU capacity of irradiated shBMI1 cells was also reduced compared to controls, and remaining colonies were composed of large cells with a flattened morphology, highly reminiscent of senescent cells (Fig. 6E,F). This reveals that a ∼50% reduction in BMI1 activity is sufficient to significantly impair GBM cell radioresistance.
BMI1 overexpression improves ATM recruitment, DNA repair, and radioresistance
If BMI1 is a critical factor in cancerous NSCs radioresistance, it is predicted that BMI1 overexpression alone would be sufficient to increase the radioresistance of normal NSCs. To test this, we derived NSCs from human embryonic stem cells (supplemental Fig. 3, available at www.jneurosci.org as supplemental material). These NSCs express BMI1 at approximately one-fourth the level found in GBM cells. They were also positive for EZH2, SIX3, and PAX6. When plated on a laminin substrate and exposed to serum, NSCs could be induced to differentiate into neurons and astrocytes (supplemental Fig. 3, available at www.jneurosci.org as supplemental material). NSCs were infected with a GFP-only or GFP/BMI1 lentivirus. Quantification analysis revealed a 2.5-fold increase in BMI1 levels in GFP/BMI1 infected NSCs (supplemental Fig. 4, available at www.jneurosci.org as supplemental material). We also observed focalization of BMI1 on the chromatin after irradiation in both control and BMI1-overexpressing NSCs (supplemental Fig. 4A, available at www.jneurosci.org as supplemental material). BMI1 overexpression resulted in condensation of the chromatin, as visualized with DAPI or H3K27me3, a mark of heterochromatin (supplemental Fig. 4C,D, available at www.jneurosci.org as supplemental material). In control cells, the heterochromatin was mostly located at the nuclear periphery (with a ring-like shape). In BMI1-overexpressing cells, the heterochromatin was redistributed in the central nuclear region (supplemental Fig. 4C,D, available at www.jneurosci.org as supplemental material), consistent with the reported ability of polycomb group proteins to compact nucleosomes (Francis et al., 2004). This variation was not due to an increased in H3K27me3 expression levels, as revealed by Western blot analysis (data not shown) and most likely reflects remodeling of the chromatin. Global histone acetylation was also less intense in BMI1-overexpressing cells, as revealed with an antibody against H3K9Ac (supplemental Fig. 4D, available at www.jneurosci.org as supplemental material).
After irradiation, we observed that while γH2AX foci were almost exclusively observed on the euchromatin in control cells, they were observed on both the heterochromatin and euchromatin in BMI1-overexpressing cells (Fig. 7A and data not shown), suggesting recruitment of the DNA damage response machinery to the heterochromatin. To test this, we analyzed the recruitment of p-ATM, which is critically required for repair of the heterochromatin but not of the euchromatin (Goodarzi et al., 2008). In BMI1-overexpressing but not in control cells, p-ATM colocalized with H3K27me3 (Fig. 7B). Notably, γH2AX and p-ATM signals were also consistently more intense in BMI1 overexpressing than in control cells (Fig. 7C). In contrast, normal focal accumulation of RNF8 was prevented, suggesting possible competitive inhibition (Fig. 7C) (Huen et al., 2007; Kolas et al., 2007; Stewart et al., 2009).
Figure 7.
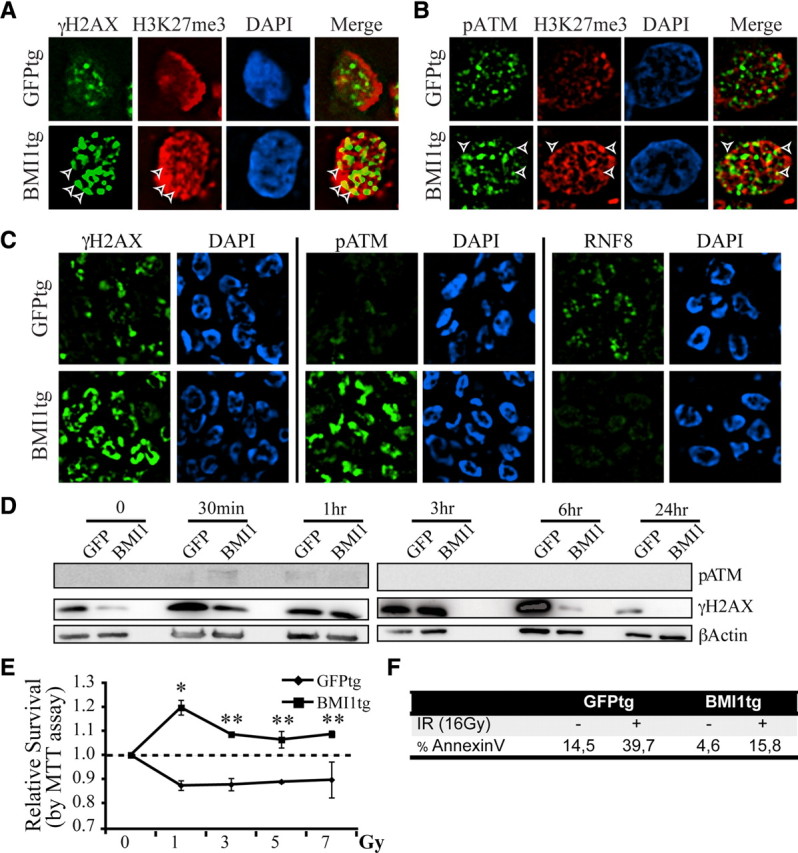
BMI1 overexpression improves DNA DSB response, DNA repair efficiency and radioresistance of human NSCs. A, B, Human NSCs overexpressing BMI1-GFP (BMI1tg) or GFP (GFPtg) were irradiated (3 Gy), fixed 1 h after IR, and costained with either γH2AX or pATM and H3K27me3 antibodies. γH2AX or p-ATM colocalized with H3K27me3 at discrete foci (arrowheads) only in BMI1tg cells. C, BMI1 overexpression enhances the DNA damage response and inhibits RNF8 focal accumulation. NSCs were treated as in A and B and labeled with γH2AX, pATM, and RNF8 antibodies. Deconvolution images were acquired with a Leica DMRE fluorescence microscope and the OpenLab 3.1.1 software. D, BMI1 overexpression accelerates the kinetic of DNA repair. Cells were isolated at different time points after IR (3 Gy) and protein extracts were immunoblotted with p-ATM, γH2AX, and β-actin antibodies. β-Actin was used as loading control. E, BMI1tg or GFPtg NSCs were irradiated at different doses and analyzed for metabolic activity using the MTT assay 24 h after IR. Data are mean ± SEM (n = 3, *p < 0.05, **p < 0.01). F, BMI1tg cells are radioresistant compared to GFPtg cells. Cell cultures were analyzed for the level of apoptosis using the AnnexinV/7-AAD labeling before and 16 h after IR.
To evaluate the kinetics of DNA repair, we measured the rate of γH2AX disappearance, as described previously (Ahnesorg et al., 2006; Goodarzi et al., 2008). In contrast to control cells where γH2AX signal peaked 6 h after irradiation, γH2AX signal peaked ∼3 h after irradiation in BMI overexpressing cells and disappeared at 6 h (Fig. 7D), suggesting improved DNA repair. In absence of radiation, the basal level of γH2AX signal was also less intense in BMI overexpressing cells, suggesting increased genomic stability (Fig. 7D).
We exposed NSCs to increasing doses of radiations to evaluate their viability. Using the MTT assay, we found that BMI1-overexpressing NSCs remained metabolically active even when exposed to high doses of radiation, in contrast to control NSCs (Fig. 7E). Using AnnexinV staining, we found that before treatment, BMI1-overexpressing NSCs presented lower basal levels of apoptosis than control NSCs. Sixteen hours after irradiation at 16 Gy, BMI1-overexpressing NSCs also displayed much lower apoptosis levels than control NSCs (Fig. 7F), revealing overall increased radioresistance.
BMI1 activity in DNA DSB response is independent of P53
BMI1 deficiency can result in P53 activation (Alajez et al., 2009; Chatoo et al., 2009). In nasopharyngeal cancer, BMI1 inactivation was shown to renders cells more sensitive to P53-dependent apoptosis after irradiation (Alajez et al., 2009). Because the status of P53 is highly variable among our different GBM cell lines, we evaluated this in normal human NSCs, which are wild type for P53. In these cells, P53 stabilization was observed after irradiation (Fig. 8B). In contrast, P53 stabilization after irradiation was observed in only one of the four GBM cell lines tested (supplemental Fig. 1, available at www.jneurosci.org as supplemental material). P53 inactivation in NSCs using shP53-puro did not affect DNA DSB response, as visualized by normal focal accumulation of BMI1, MDC1, H2AX, 53BP1, and p-ATM 20 min after irradiation (Fig. 8C). However, P53 inactivation completely prevented NSCs apoptosis induced by radiations (Fig. 8E). As previously observed in GBM cells, inactivation of BMI1 in NSCs using shBMI1#1 (95% knockdown) or shBMI1#3 (50% knockdown) impaired normal DNA DSB response and resulted in increased cellular apoptosis before and after irradiation (Fig. 8C,E). Evaluation of the DNA repair kinetics using the comet assay further revealed that BMI1 knockdown in NSCs delayed the normal DNA repair process (Fig. 8D). Finally, inactivation of P53 in BMI1-deficient NSCs (shP53-puro/shBMI1-hygro) did not improve or restore DNA DSB response and cell viability (Fig. 8C,E). This shows that abnormalities observed in DNA DSB response and cell viability after BMI1 inactivation in NSCs are P53-independent. We cannot exclude, however, that in GBM cells where P53 is functional, reduced cell viability observed after BMI1 knockdown is partially P53 dependent.
Figure 8.
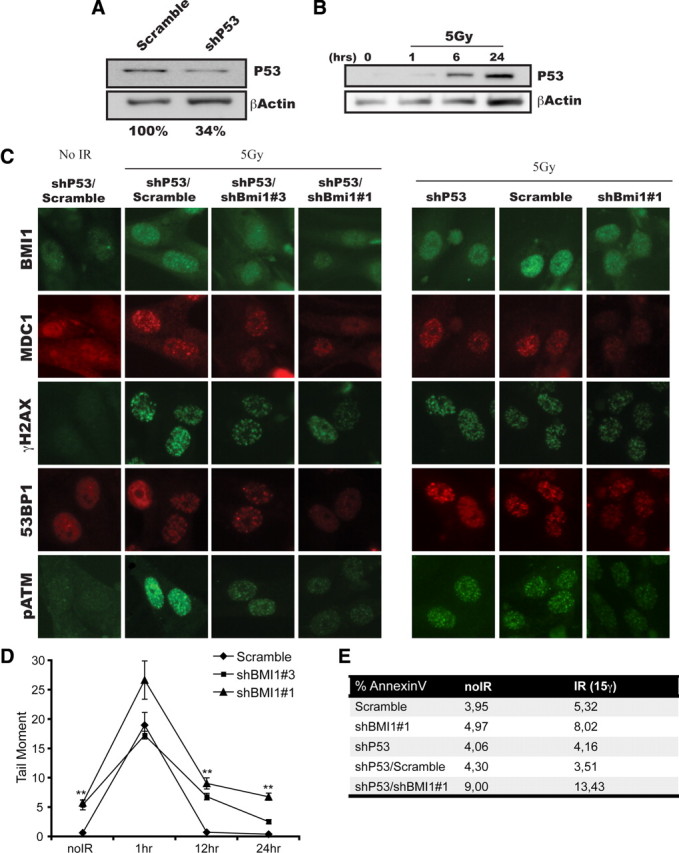
BMI1 function is independent of P53. A, NSCs cells were transfected with lentiviruses expressing shP53 or shScramble. Western blot analyses were performed using antibodies against P53 or β-actin. β-Actin was used as an internal standard to quantify P53 protein expression levels. B, P53 stabilization is observed 6–24 h after irradiation. NSCs were irradiated (5 Gy) or left untreated. One, six, and twenty-four hours after IR, whole-cell homogenates were subjected to Western blot analyses with P53 and β-actin antibodies. C–E, NSCs cells were sequentially infected with shP53 virus, and scramble or shBMI1 viruses. Infected cells were irradiated (5 Gy) or left untreated. C, Twenty minutes after IR, cells were fixed and stained for BMI1, MDC1, γH2AX, 53BP1, and p-ATM. BMI1 depletion affects the recruitment of DBS response proteins independently of P53 status. D, One, twelve, and twenty-four hours after IR, cells were analyzed for DNA damage by the Neutral Comet Assay. Data are presented as the tail moment index as analyzed by the Comet Assay IV program (Perceptive Instruments). E, Cell cultures were analyzed for the level of apoptosis using the AnnexinV/7-AAD labeling before and 16 h after IR.
Bmi1 is required for efficient DNA damage response/repair in mouse cells
To test whether our observations were verifiable in the context of a null mutation, we analyzed Bmi1 knock-out MEFs (Jacobs et al., 1999a; Chatoo et al., 2009). Bmi1 deficiency resulted in a DNA damage response that was less robust than in wild-type MEFs, as revealed by the reduced number of γH2AX foci 30 min after irradiation at 3 Gy (Fig. 9A). Notably, while γH2AX foci were almost resolved in wild-type MEFs 6 h after irradiation, they were still abundant in Bmi1−/− MEFs, suggesting delayed DNA repair (Fig. 9A). We also observed the presence of γH2AX foci in nonirradiated Bmi1−/− MEFs, suggesting increased DNA damage in basal conditions. We compared the number of p-ATM foci at 30 min, but no obvious difference were observed between wild-type and Bmi1−/− MEFs (data not shown). These results show that Bmi1 genetic deficiency also results in inefficient DNA damage response/repair in MEFs.
Figure 9.

Bmi1 deficiency results in defective DNA damage response. A, WT and Bmi1−/− MEFs were irradiated at 3 Gy and labeled at different time points (0 min, 30 min, 6 h) after IR with γH2AX antibody. Data are expressed as the percentage of γH2AX-positive cells over total hematoxylin-stained nuclei. Results are mean ± SEM (n = 3, *p < 0.05). B, A working model placing BMI1 as a component of the DNA DSB response machinery. C, BMI1 may be implicated in DNA DSB repair by preferentially interacting with NHEJ proteins in CD133+ GBM cells.
Discussion
Here we provided evidences that BMI1, a previously established transcriptional repressor, has additional activities in DNA DSB response and repair. BMI1 colocalized with p-ATM and γH2AX and was enriched on the chromatin after irradiation. This was found to be independent of ATM, Mdc1, or NBS1 function. BMI1 coprecipitated with DNA DSB response proteins in 293FT and GBM cells, and preferentially associated with NHEJ repair proteins in CD133+ GBM cells. BMI1 deficiency in GBM cells or NSCs impaired the DNA DSB response and decreased radioresistance. Bmi1 function in DNA damage response/repair was also required in mouse cells. Gain-of-function experiments revealed that BMI1 possesses chromatin-remodeling activities and is sufficient to increase NSCs radioresistance. This work uncovers a novel and evolutionarily conserved function for BMI1 in DNA DSB response and repair.
BMI1 inactivation impairs DNA DSB response
One may argue that our results are based on knockdown experiments, raising the possibility of unspecific off target effects. However, we observed a consistent alteration on the recruitment of the DNA damage response machinery using 3 shRNA directed against different regions of BMI1 cDNA sequence. These effects were also directly proportional to BMI1 knockdown levels. Results obtained are also consistent with the abnormalities we observed in Bmi1−/− MEFs, where the altered kinetics of DNA repair was nearly identical to the one obtained using the shRNA against BMI1 (compare Fig. 5C to Fig. 9A). Furthermore, the gain-of-function experiment resulted in the opposite effect, i.e., increased recruitment of DNA DSB response proteins and improved kinetics of DNA repair. One may also argue that the observed effects on GBM cells, human NSCs, or MEFs are due to a cell culture artifact linked to BMI1 function in repressing transcription at the INK4A/ARF locus or P53 activity. However, the impact of BMI1 knockdown on DNA DSB response and repair was not distinct between cell lines carrying or not a functional INK4A/ARF locus (supplemental Fig. 1, available at www.jneurosci.org as supplemental material). Furthermore, coinactivation of P53 in NSCs depleted of BMI1 did not improve DNA DSB response or cell viability.
What is the role of BMI1 in DNA DSB response?
Our loss- and gain-of-function experiments reveal a consistent dosage effect, where BMI1 levels apparently directly correlate with DNA DSB response efficiency and cell viability after irradiation. It is also noteworthy that cultured GBM cells express BMI1 at high levels (Abdouh et al., 2009). This suggests the possibility that BMI1 operates as a recruitment platform for the DNA DSB response machinery. In this context, differential BMI1 expression would explain the preferential activation of the DNA damage response machinery (i.e., p-ATM, p-Chk1, and p-Chk2) in CD133+ cells compared to CD133− cells, since total level of (nonactivated) ATM, Chk1, and Chk2 proteins is not different between CD133+ and CD133− (Bao et al., 2006). This is also supported by our gain-of-function experiments where BMI1 overexpression improves p-ATM recruitment to the chromatin. In our protein purification experiments, however, where we observed preferential association of BMI1 with NHEJ proteins in CD133+ cells, it is noteworthy that BMI1/Myc fusion protein levels are identical between CD133− and CD133+ cells. Hence, preferential copurification of Ku80 and γH2AX (which are equally abundant in both cell populations) cannot be attributed to differential BMI1/Myc levels. This suggests an additional possibility where the affinity of BMI1 for DNA repair proteins is distinct in stem cells, possibly through specific posttranslational modifications of BMI1. Other key proteins, such as DNA-PK and PARP-1, are also more abundant in CD133+ cells, showing that CD133+ cells are primed for efficient DNA damage response and repair (see model in Fig. 9). In the present study, the notion that BMI1 confers radioresistance to glioma cells was not demonstrated in gain-of-function experiments per se but rather extrapolated from results obtained in the loss-of-function experiments. Because CD133+ glioma cells already express BMI1 at high levels and are tumorigenic and radioresistant, in contrast to CD133− cells, it would be interesting to overexpress BMI1 in CD133− cells to test whether that would confer them radioresistance and cancer stem cell-like properties found in CD133+ cells.
BMI1 is part of the polycomb repressive complex 1 (PRC1), which can monoubiquitylate histone H2A through its E3 monoubiquitin ligase activity contained in RNF2/RING1A. Mono-ubiquitylation of γH2AX by the PRC1 is thus a possibility. We observed coprecipitation of BMI1 with γH2AX. We also observed “competitive inhibition” of BMI1 with RNF8 recruitment to DNA DSBs in BMI1 overexpressing NSCs. RNF8 is an E3 monoubiquitin ligase that can target γH2AX (Huen et al., 2007; Kolas et al., 2007; Stewart et al., 2009). BMI1 also displays chromatin-remodeling activity (Francis et al., 2004). Likewise, we observed global chromatin remodeling after BMI1 overexpression. Considering these observations, it is thus plausible that BMI1 requirement in DNA DSB response is primarily mediated through its action on the chromatin, locally and/or genomewide, rather than through its association with DNA DSB response proteins (Escargueil et al., 2008). Observed abnormalities in the recruitment of DNA DSB response proteins at the break site after BMI1 inactivation would be the consequence of an aberrant chromatin structure. It is also possible that BMI1 combines all these activities at once i.e., global chromatin remodeling, γH2AX ubiquitylation, and physical recruitment of DNA DSB response and repair proteins at break sites.
BMI1 may allow DNA repair at the heterochromatin
Early ATM activation is apparently normal in Bmi1−/− MEFs. This is in contrast with GBM cells and human NSCs, where it is reduced 20 min after irradiation. This may be explained by species differences. Alternatively, strong BMI1 dependency in DNA damage response may distinguish stem cells from other cell types. The high heterochromatin content of GBM cells may also affect the DNA damage response (Goodarzi et al., 2008). This suggests an interesting possibility where BMI1 recruits p-ATM to the heterochromatin. ATM will then phosphorylate the heterochromatin remodeling factor KAP-1, allowing for DNA relaxation and repair at otherwise uneasily accessible heterochromatin domains. This possibility is supported by the colocalization of BMI1 and p-ATM, their copurification, and by the “ectopic” localization of p-ATM (and γH2AX foci) on the heterochromatin of irradiated NSCs that overexpressed BMI1 (Fig. 7A,B). In normal conditions, ATM recruitment and DNA repair at the heterochromatin occurs later than at the euchromatin (Goodarzi et al., 2008). Repair of the heterochromatin is thus the limiting step of the process. We found that in NSCs overexpressing BMI1, the focal accumulation of p-ATM was more robust and DNA repair was faster than in control cells, thus indirectly supporting the above possibility. Finally, the chromatin remodeling activity of BMI1 may be coupled to its capacity to recruit ATM to the heterochromatin. Further studies will be required to address how exactly BMI1 is required for proper DNA DSB response, how BMI1 is recruited at DNA DSB sites, and what additional function it may play at the break site?
Cancer, aging, and DNA repair
The seemingly opposite biological processes of cancer and aging are a matter of intensive investigation. While cancer is linked to uncontrolled cellular proliferation, aging is accompanied by reduced organ regenerative capacities and degeneration, in part because of decreased stem cell capacities and cellular dysfunction (Maslov and Vijg, 2009). A common link to these biological processes may be DNA repair. Unrepaired mutations in DNA or genetic instability can lead to cancer. In turn, substantial evidence suggests that aging is driven by the accumulation of somatic mutations in genomic (and mitochondrial) DNA (Ruzankina and Brown, 2007). Notably, deficiency in DNA DSB repair results in NSC genetic instability, apoptosis, and exhaustion with aging (Sii-Felice et al., 2008a,b). Our results show that high BMI1 levels in normal or cancerous NSCs promote efficient DNA damage response/repair and radioresistance. Notably, Bmi1-null mice show a complex phenotype that includes reduced lifespan, cerebellar degeneration, stem cell senescence, abnormal reactive oxygen species metabolism, and premature CNS aging (van der Lugt et al., 1994; Lessard and Sauvageau, 2003; Molofsky et al., 2003; Park et al., 2003; Bruggeman et al., 2005; Molofsky et al., 2005; Zencak et al., 2005; Chatoo et al., 2009), as well as MEF radiosensitivity (this study). This phenotype shares multiple similarities with DNA damage recognition/repair syndromes ataxia-telangiectasia (ATM mutated) and ataxia-telangiectasia-like disorder (MRE11 mutated) (O'Driscoll and Jeggo, 2006; Lavin, 2007). Thus, high BMI1 activity is beneficial to promote longevity but at the possible cost of aggressive radioresistant tumors. Because BMI1 knockdown impairs only partially DNA damage recognition (where p-ATM still accumulates on the chromatin at 50% of normal levels in glioma cells), DNA damage recognition is only delayed, not abolished. Likewise, resolution of H2AX foci is only delayed, not abolished. This is consistent with the relative viability of Bmi1-null mice and with that of BMI1 being a player among others in this complex process.
In conclusion, the prototypical stem cell factor BMI1 encompasses at least two distinct functions that are required for normal and cancerous NSCs self-renewal. First, it prevents stem cell senescence, apoptosis, or differentiation by repressing the transcription and activation of tumor suppressor genes (Lessard and Sauvageau, 2003; Molofsky et al., 2003, 2005; Park et al., 2003; Bruggeman et al., 2005; Fasano et al., 2007; Abdouh et al., 2009). Second, it is required and sufficient to recruit the DNA damage response machinery to DNA DSB sites in response to radiation, thus promoting NSCs survival. Preferential copurification with NHEJ proteins in CD133+ cells also suggests that BMI1 may play a direct role in DNA repair. BMI1 may have a function in multiple organs and cell types. Nonetheless, cancerous cells, including glioma, are apparently more sensitive to BMI1 depletion than normal cells. This may be explained by an acquired dependency over BMI1 anti-apoptotic activity through transcriptional (i.e., tumor suppressor genes repression) and nontranscriptional (i.e., DNA repair) activities. This preferential sensitivity could be exploited to specifically target cancerous neural stem cells in radiation therapy.
Footnotes
This work was supported in part by grants from the Natural Science and Engineering Research Council of Canada and Canadian Institutes of Health Research. W.C. is a Scholar from the Fonds de Recherche en Ophtalmologie de l'Université de Montréal. G.B. is supported by the Fonds de Recherche en Santé du Québec.
References
- Abdouh M, Facchino S, Chatoo W, Balasingam V, Ferreira J, Bernier G. BMI1 sustains human glioblastoma multiforme stem cell renewal. J Neurosci. 2009;29:8884–8896. doi: 10.1523/JNEUROSCI.0968-09.2009. [DOI] [PMC free article] [PubMed] [Google Scholar]
- Ahnesorg P, Smith P, Jackson SP. XLF interacts with the XRCC4-DNA ligase IV complex to promote DNA nonhomologous end-joining. Cell. 2006;124:301–313. doi: 10.1016/j.cell.2005.12.031. [DOI] [PubMed] [Google Scholar]
- Alajez NM, Shi W, Hui AB, Yue S, Ng R, Lo KW, Bastianutto C, O'Sullivan B, Gullane P, Liu FF. Targeted depletion of BMI1 sensitizes tumor cells to P53-mediated apoptosis in response to radiation therapy. Cell Death Differ. 2009;16:1469–1479. doi: 10.1038/cdd.2009.85. [DOI] [PubMed] [Google Scholar]
- Alcantara Llaguno S, Chen J, Kwon CH, Jackson EL, Li Y, Burns DK, Alvarez-Buylla A, Parada LF. Malignant astrocytomas originate from neural stem/progenitor cells in a somatic tumor suppressor mouse model. Cancer Cell. 2009;15:45–56. doi: 10.1016/j.ccr.2008.12.006. [DOI] [PMC free article] [PubMed] [Google Scholar]
- Bao S, Wu Q, McLendon RE, Hao Y, Shi Q, Hjelmeland AB, Dewhirst MW, Bigner DD, Rich JN. Glioma stem cells promote radioresistance by preferential activation of the DNA damage response. Nature. 2006;444:756–760. doi: 10.1038/nature05236. [DOI] [PubMed] [Google Scholar]
- Beier D, Hau P, Proescholdt M, Lohmeier A, Wischhusen J, Oefner PJ, Aigner L, Brawanski A, Bogdahn U, Beier CP. CD133(+) and CD133(−) glioblastoma-derived cancer stem cells show differential growth characteristics and molecular profiles. Cancer Res. 2007;67:4010–4015. doi: 10.1158/0008-5472.CAN-06-4180. [DOI] [PubMed] [Google Scholar]
- Britton S, Froment C, Frit P, Monsarrat B, Salles B, Calsou P. Cell nonhomologous end joining capacity controls SAF-A phosphorylation by DNA-PK in response to DNA double-strand breaks inducers. Cell Cycle. 2009;8:3717–3722. doi: 10.4161/cc.8.22.10025. [DOI] [PubMed] [Google Scholar]
- Bruggeman SW, Valk-Lingbeek ME, van der Stoop PP, Jacobs JJ, Kieboom K, Tanger E, Hulsman D, Leung C, Arsenijevic Y, Marino S, van Lohuizen M. Ink4a and Arf differentially affect cell proliferation and neural stem cell self-renewal in Bmi1-deficient mice. Genes Dev. 2005;19:1438–1443. doi: 10.1101/gad.1299305. [DOI] [PMC free article] [PubMed] [Google Scholar]
- Bruggeman SW, Hulsman D, Tanger E, Buckle T, Blom M, Zevenhoven J, van Tellingen O, van Lohuizen M. Bmi1 controls tumor development in an Ink4a/Arf-independent manner in a mouse model for glioma. Cancer Cell. 2007;12:328–341. doi: 10.1016/j.ccr.2007.08.032. [DOI] [PubMed] [Google Scholar]
- Chatoo W, Abdouh M, David J, Champagne MP, Ferreira J, Rodier F, Bernier G. The polycomb group gene Bmi1 regulates antioxidant defenses in neurons by repressing p53 pro-oxidant activity. J Neurosci. 2009;29:529–542. doi: 10.1523/JNEUROSCI.5303-08.2009. [DOI] [PMC free article] [PubMed] [Google Scholar]
- Escargueil AE, Soares DG, Salvador M, Larsen AK, Henriques JA. What histone code for DNA repair? Mutat Res. 2008;658:259–270. doi: 10.1016/j.mrrev.2008.01.004. [DOI] [PubMed] [Google Scholar]
- Fasano CA, Dimos JT, Ivanova NB, Lowry N, Lemischka IR, Temple S. shRNA knockdown of Bmi-1 reveals a critical role for p21-Rb pathway in NSC self-renewal during development. Cell Stem Cell. 2007;1:87–99. doi: 10.1016/j.stem.2007.04.001. [DOI] [PubMed] [Google Scholar]
- Francis NJ, Kingston RE, Woodcock CL. Chromatin compaction by a polycomb group protein complex. Science. 2004;306:1574–1577. doi: 10.1126/science.1100576. [DOI] [PubMed] [Google Scholar]
- Galli R, Binda E, Orfanelli U, Cipelletti B, Gritti A, De Vitis S, Fiocco R, Foroni C, Dimeco F, Vescovi A. Isolation and characterization of tumorigenic, stem-like neural precursors from human glioblastoma. Cancer Res. 2004;64:7011–7021. doi: 10.1158/0008-5472.CAN-04-1364. [DOI] [PubMed] [Google Scholar]
- Goodarzi AA, Noon AT, Deckbar D, Ziv Y, Shiloh Y, Löbrich M, Jeggo PA. ATM signaling facilitates repair of DNA double-strand breaks associated with heterochromatin. Mol Cell. 2008;31:167–177. doi: 10.1016/j.molcel.2008.05.017. [DOI] [PubMed] [Google Scholar]
- Guirouilh-Barbat J, Huck S, Bertrand P, Pirzio L, Desmaze C, Sabatier L, Lopez BS. Impact of the KU80 pathway on NHEJ-induced genome rearrangements in mammalian cells. Mol Cell. 2004;14:611–623. doi: 10.1016/j.molcel.2004.05.008. [DOI] [PubMed] [Google Scholar]
- Haince JF, McDonald D, Rodrigue A, Déry U, Masson JY, Hendzel MJ, Poirier GG. PARP1-dependent kinetics of recruitment of MRE11 and NBS1 proteins to multiple DNA damage sites. J Biol Chem. 2008;283:1197–1208. doi: 10.1074/jbc.M706734200. [DOI] [PubMed] [Google Scholar]
- Haupt Y, Alexander WS, Barri G, Klinken SP, Adams JM. Novel zinc finger gene implicated as myc collaborator by retrovirally accelerated lymphomagenesis in E mu-myc transgenic mice. Cell. 1991;65:753–763. doi: 10.1016/0092-8674(91)90383-a. [DOI] [PubMed] [Google Scholar]
- Hemmati HD, Nakano I, Lazareff JA, Masterman-Smith M, Geschwind DH, Bronner-Fraser M, Kornblum HI. Cancerous stem cells can arise from pediatric brain tumors. Proc Natl Acad Sci U S A. 2003;100:15178–15183. doi: 10.1073/pnas.2036535100. [DOI] [PMC free article] [PubMed] [Google Scholar]
- Holland EC. Gliomagenesis: genetic alterations and mouse models. Nat Rev Genet. 2001;2:120–129. doi: 10.1038/35052535. [DOI] [PubMed] [Google Scholar]
- Hong Z, Jiang J, Lan L, Nakajima S, Kanno S, Koseki H, Yasui A. A polycomb group protein, PHF1, is involved in the response to DNA double-strand breaks in human cell. Nucleic Acids Res. 2008;36:2939–2947. doi: 10.1093/nar/gkn146. [DOI] [PMC free article] [PubMed] [Google Scholar]
- Huen MS, Grant R, Manke I, Minn K, Yu X, Yaffe MB, Chen J. RNF8 transduces the DNA-damage signal via histone ubiquitylation and checkpoint protein assembly. Cell. 2007;131:901–914. doi: 10.1016/j.cell.2007.09.041. [DOI] [PMC free article] [PubMed] [Google Scholar]
- Iijima K, Ohara M, Seki R, Tauchi H. Dancing on damaged chromatin: functions of ATM and the RAD50/MRE11/NBS1 complex in cellular responses to DNA damage. J Radiat Res (Tokyo) 2008;49:451–464. doi: 10.1269/jrr.08065. [DOI] [PubMed] [Google Scholar]
- Iliakis G. Backup pathways of NHEJ in cells of higher eukaryotes: cell cycle dependence. Radiother Oncol. 2009;92:310–315. doi: 10.1016/j.radonc.2009.06.024. [DOI] [PubMed] [Google Scholar]
- Jacobs JJ, Kieboom K, Marino S, DePinho RA, van Lohuizen M. The oncogene and Polycomb-group gene bmi-1 regulates cell proliferation and senescence through the ink4a locus. Nature. 1999a;397:164–168. doi: 10.1038/16476. [DOI] [PubMed] [Google Scholar]
- Jacobs JJ, Scheijen B, Voncken JW, Kieboom K, Berns A, van Lohuizen M. Bmi-1 collaborates with c-Myc in tumorigenesis by inhibiting c-Myc-induced apoptosis via INK4a/ARF. Genes Dev. 1999b;13:2678–2690. doi: 10.1101/gad.13.20.2678. [DOI] [PMC free article] [PubMed] [Google Scholar]
- Kolas NK, Chapman JR, Nakada S, Ylanko J, Chahwan R, Sweeney FD, Panier S, Mendez M, Wildenhain J, Thomson TM, Pelletier L, Jackson SP, Durocher D. Orchestration of the DNA-damage response by the RNF8 ubiquitin ligase. Science. 2007;318:1637–1640. doi: 10.1126/science.1150034. [DOI] [PMC free article] [PubMed] [Google Scholar]
- Lavin MF. ATM and the Mre11 complex combine to recognize and signal DNA double-strand breaks. Oncogene. 2007;26:7749–7758. doi: 10.1038/sj.onc.1210880. [DOI] [PubMed] [Google Scholar]
- Lee JH, Paull TT. Activation and regulation of ATM kinase activity in response to DNA double-strand breaks. Oncogene. 2007;26:7741–7748. doi: 10.1038/sj.onc.1210872. [DOI] [PubMed] [Google Scholar]
- Lessard J, Sauvageau G. Bmi-1 determines the proliferative capacity of normal and leukaemic stem cells. Nature. 2003;423:255–260. doi: 10.1038/nature01572. [DOI] [PubMed] [Google Scholar]
- Leung C, Lingbeek M, Shakhova O, Liu J, Tanger E, Saremaslani P, Van Lohuizen M, Marino S. Bmi1 is essential for cerebellar development and is overexpressed in human medulloblastomas. Nature. 2004;428:337–341. doi: 10.1038/nature02385. [DOI] [PubMed] [Google Scholar]
- Liu J, Cao L, Chen J, Song S, Lee IH, Quijano C, Liu H, Keyvanfar K, Chen H, Cao LY, Ahn BH, Kumar NG, Rovira II, Xu XL, van Lohuizen M, Motoyama N, Deng CX, Finkel T. Bmi1 regulates mitochondrial function and the DNA damage response pathway. Nature. 2009;459:387–392. doi: 10.1038/nature08040. [DOI] [PMC free article] [PubMed] [Google Scholar]
- Maher EA, Furnari FB, Bachoo RM, Rowitch DH, Louis DN, Cavenee WK, DePinho RA. Malignant glioma: genetics and biology of a grave matter. Genes Dev. 2001;15:1311–1333. doi: 10.1101/gad.891601. [DOI] [PubMed] [Google Scholar]
- Maslov AY, Vijg J. Genome instability, cancer and aging. Biochim Biophys Acta. 2009;1790:963–969. doi: 10.1016/j.bbagen.2009.03.020. [DOI] [PMC free article] [PubMed] [Google Scholar]
- Mitchell J, Smith GC, Curtin NJ. Poly(ADP-Ribose) polymerase-1 and DNA-dependent protein kinase have equivalent roles in double strand break repair following ionizing radiation. Int J Radiat Oncol Biol Phys. 2009;75:1520–1527. doi: 10.1016/j.ijrobp.2009.07.1722. [DOI] [PubMed] [Google Scholar]
- Molofsky AV, Pardal R, Iwashita T, Park IK, Clarke MF, Morrison SJ. Bmi-1 dependence distinguishes neural stem cell self-renewal from progenitor proliferation. Nature. 2003;425:962–967. doi: 10.1038/nature02060. [DOI] [PMC free article] [PubMed] [Google Scholar]
- Molofsky AV, He S, Bydon M, Morrison SJ, Pardal R. Bmi-1 promotes neural stem cell self-renewal and neural development but not mouse growth and survival by repressing the p16Ink4a and p19Arf senescence pathways. Genes Dev. 2005;19:1432–1437. doi: 10.1101/gad.1299505. [DOI] [PMC free article] [PubMed] [Google Scholar]
- O'Driscoll M, Jeggo PA. The role of double-strand break repair—insights from human genetics. Nat Rev Genet. 2006;7:45–54. doi: 10.1038/nrg1746. [DOI] [PubMed] [Google Scholar]
- Park IK, Qian D, Kiel M, Becker MW, Pihalja M, Weissman IL, Morrison SJ, Clarke MF. Bmi-1 is required for maintenance of adult self-renewing haematopoietic stem cells. Nature. 2003;423:302–305. doi: 10.1038/nature01587. [DOI] [PubMed] [Google Scholar]
- Pollard SM, Yoshikawa K, Clarke ID, Danovi D, Stricker S, Russell R, Bayani J, Head R, Lee M, Bernstein M, Squire JA, Smith A, Dirks P. Glioma stem cell lines expanded in adherent culture have tumor-specific phenotypes and are suitable for chemical and genetic screens. Cell Stem Cell. 2009;4:568–580. doi: 10.1016/j.stem.2009.03.014. [DOI] [PubMed] [Google Scholar]
- Reya T, Morrison SJ, Clarke MF, Weissman IL. Stem cells, cancer, and cancer stem cells. Nature. 2001;414:105–111. doi: 10.1038/35102167. [DOI] [PubMed] [Google Scholar]
- Rosidi B, Wang M, Wu W, Sharma A, Wang H, Iliakis G. Histone H1 functions as a stimulatory factor in backup pathways of NHEJ. Nucleic Acids Res. 2008;36:1610–1623. doi: 10.1093/nar/gkn013. [DOI] [PMC free article] [PubMed] [Google Scholar]
- Rouleau M, McDonald D, Gagné P, Ouellet ME, Droit A, Hunter JM, Dutertre S, Prigent C, Hendzel MJ, Poirier GG. PARP-3 associates with polycomb group bodies and with components of the DNA damage repair machinery. J Cell Biochem. 2007;100:385–401. doi: 10.1002/jcb.21051. [DOI] [PubMed] [Google Scholar]
- Ruzankina Y, Brown EJ. Relationships between stem cell exhaustion, tumour suppression and ageing. Br J Cancer. 2007;97:1189–1193. doi: 10.1038/sj.bjc.6604029. [DOI] [PMC free article] [PubMed] [Google Scholar]
- Sharpless NE, Ramsey MR, Balasubramanian P, Castrillon DH, DePinho RA. The differential impact of p16(INK4a) or p19(ARF) deficiency on cell growth and tumorigenesis. Oncogene. 2004;23:379–385. doi: 10.1038/sj.onc.1207074. [DOI] [PubMed] [Google Scholar]
- Sherr CJ. The INK4a/ARF network in tumour suppression. Nat Rev Mol Cell Biol. 2001;2:731–737. doi: 10.1038/35096061. [DOI] [PubMed] [Google Scholar]
- Sii-Felice K, Barroca V, Etienne O, Riou L, Hoffschir F, Fouchet P, Boussin FD, Mouthon MA. Role of Fanconi DNA repair pathway in neural stem cell homeostasis. Cell Cycle. 2008a;7:1911–1915. doi: 10.4161/cc.7.13.6235. [DOI] [PubMed] [Google Scholar]
- Sii-Felice K, Etienne O, Hoffschir F, Mathieu C, Riou L, Barroca V, Haton C, Arwert F, Fouchet P, Boussin FD, Mouthon MA. Fanconi DNA repair pathway is required for survival and long-term maintenance of neural progenitors. EMBO J. 2008b;27:770–781. doi: 10.1038/emboj.2008.14. [DOI] [PMC free article] [PubMed] [Google Scholar]
- Singh SK, Clarke ID, Terasaki M, Bonn VE, Hawkins C, Squire J, Dirks PB. Identification of a cancer stem cell in human brain tumors. Cancer Res. 2003;63:5821–5828. [PubMed] [Google Scholar]
- Singh SK, Hawkins C, Clarke ID, Squire JA, Bayani J, Hide T, Henkelman RM, Cusimano MD, Dirks PB. Identification of human brain tumour initiating cells. Nature. 2004;432:396–401. doi: 10.1038/nature03128. [DOI] [PubMed] [Google Scholar]
- Stewart GS, Panier S, Townsend K, Al-Hakim AK, Kolas NK, Miller ES, Nakada S, Ylanko J, Olivarius S, Mendez M, Oldreive C, Wildenhain J, Tagliaferro A, Pelletier L, Taubenheim N, Durandy A, Byrd PJ, Stankovic T, Taylor AM, Durocher D. The RIDDLE syndrome protein mediates a ubiquitin-dependent signaling cascade at sites of DNA damage. Cell. 2009;136:420–434. doi: 10.1016/j.cell.2008.12.042. [DOI] [PubMed] [Google Scholar]
- Tamura K, Aoyagi M, Wakimoto H, Ando N, Nariai T, Yamamoto M, Ohno K. Accumulation of CD133-positive glioma cells after high-dose irradiation by Gamma Knife surgery plus external beam radiation. J Neurosurg. 2010 doi: 10.3171/2010.2.JNS091607. [DOI] [PubMed] [Google Scholar]
- Valk-Lingbeek ME, Bruggeman SW, van Lohuizen M. Stem cells and cancer; the polycomb connection. Cell. 2004;118:409–418. doi: 10.1016/j.cell.2004.08.005. [DOI] [PubMed] [Google Scholar]
- van der Lugt NM, Domen J, Linders K, van Roon M, Robanus-Maandag E, te Riele H, van der Valk M, Deschamps J, Sofroniew M, van Lohuizen M, Berns A. Posterior transformation, neurological abnormalities, and severe hematopoietic defects in mice with a targeted deletion of the bmi-1 proto-oncogene. Genes Dev. 1994;8:757–769. doi: 10.1101/gad.8.7.757. [DOI] [PubMed] [Google Scholar]
- van Lohuizen M, Verbeek S, Scheijen B, Wientjens E, van der Gulden H, Berns A. Identification of cooperating oncogenes in E mu-myc transgenic mice by provirus tagging. Cell. 1991;65:737–752. doi: 10.1016/0092-8674(91)90382-9. [DOI] [PubMed] [Google Scholar]
- Wang Y, Yang J, Zheng H, Tomasek GJ, Zhang P, McKeever PE, Lee EY, Zhu Y. Expression of mutant p53 proteins implicates a lineage relationship between neural stem cells and malignant astrocytic glioma in a murine model. Cancer Cell. 2009;15:514–526. doi: 10.1016/j.ccr.2009.04.001. [DOI] [PMC free article] [PubMed] [Google Scholar]
- White JS, Choi S, Bakkenist CJ. Irreversible chromosome damage accumulates rapidly in the absence of ATM kinase activity. Cell Cycle. 2008;7:1277–1284. doi: 10.4161/cc.7.9.5961. [DOI] [PubMed] [Google Scholar]
- Zencak D, Lingbeek M, Kostic C, Tekaya M, Tanger E, Hornfeld D, Jaquet M, Munier FL, Schorderet DF, van Lohuizen M, Arsenijevic Y. Bmi1 loss produces an increase in astroglial cells and a decrease in neural stem cell population and proliferation. J Neurosci. 2005;25:5774–5783. doi: 10.1523/JNEUROSCI.3452-04.2005. [DOI] [PMC free article] [PubMed] [Google Scholar]