

Abstract
When we visualize scenes, either from our own past or invented, we impose a viewpoint for our “mind's eye” and we experience the resulting image as spatially coherent from that viewpoint. The hippocampus has been implicated in this process, but its precise contribution is unknown. We tested a specific hypothesis based on the spatial firing properties of neurons in the hippocampal formation of rats, that this region supports the construction of spatially coherent mental images by representing the locations of the environmental boundaries surrounding our viewpoint. Using functional magnetic resonance imaging, we show that hippocampal activation increases parametrically with the number of enclosing boundaries in the imagined scene. In contrast, hippocampal activity is not modulated by a nonspatial manipulation of scene complexity nor to increasing difficulty of imagining the scenes in general. Our findings identify a specific computational role for the hippocampus in mental imagery and episodic recollection.
Introduction
Humans can imagine being somewhere else, for example, when recollecting incidents, thinking about future events, or engaging in flights of fancy. Neuroimaging and neuropsychological research has revealed a core network involved in imagining events, whether past or future, real or fictitious (Okuda et al., 2003; Addis et al., 2007; Hassabis et al., 2007a,b). One region within this network, the hippocampus, has received particular attention. Hippocampal damage can result in descriptions of fictitious scenarios lacking in spatial coherence (Hassabis et al., 2007b). This points to a role for the hippocampus in imagination, in addition to its established role in episodic long-term memory (Kinsbourne and Wood, 1975; O'Keefe and Nadel, 1978; Squire, 1992; Eichenbaum and Cohen, 2001).
Burgess and colleagues have suggested that the same processes used to orient oneself in the real world are recruited when imagining being in an environment (Becker and Burgess, 2001; Burgess et al., 2001a; Byrne et al., 2007; Bird and Burgess, 2008). Electrophysiological studies of the spatial firing properties of neurons in the hippocampal formation of freely moving rodents have offered considerable insight into these processes. For example, “place cells” encode the animal's location within an environment (O'Keefe and Dostrovsky, 1971) by firing according to the configuration of distances and directions to extended boundaries surrounding the animals (O'Keefe and Burgess, 1996; Lever et al., 2002; Yoganarasimha and Knierim, 2005) but showing little response to more punctate landmarks (Cressant et al., 1997). Accordingly, the environmental input to place cells was proposed to be a population of “boundary vector cells” (BVCs) (Burgess et al., 2000; Hartley et al., 2000) in which each neuron is tuned to represent the presence of an environmental boundary at a specific distance and allocentric direction from the rat (for experimental evidence of such cells, see Savelli et al., 2008; Solstad et al., 2008; Lever et al., 2009).
The importance of environmental boundaries, as opposed to a single landmark, for hippocampally mediated location learning was highlighted by Doeller et al. (2008) in a functional magnetic resonance imaging (fMRI) study in humans. On the basis of their findings and the place cell literature, Doeller et al., (2008) suggested that the influence of a given object (a landmark or a boundary) on the hippocampal representation of location might be proportional to the horizontal angle subtended by it at the participant. Accordingly, increasing the number of enclosing environmental boundaries should boost the contribution of the hippocampus to orientation within that environment. A similar prediction can be made for orientation within an imagined environment. We aimed to test this hypothesis in the current experiment. Participants were shown aerial views of simple environments made of walls and towers and then required to imagine standing within the environments. We varied parametrically the number of enclosing walls in the imagined scenes, while keeping the overall number of structural elements constant. As a nonspatial, difficulty control, we also varied the colors of the structural elements.
Materials and Methods
Subjects
Sixteen male participants (aged 24.6 years, range of 20–31 years) gave written consent and were paid for participating, as approved by the local Research Ethics Committee. All were right-handed with normal or corrected-to-normal vision and reported to be in good health with no history of neurological disease. Data from two of the participants were unusable as a result of technical problems during acquisition.
Stimuli
We used UnrealEngine2 Runtime software (Epic Games) to create 60 unique environments (for examples, see Fig. 1) and 15 three-dimensional structures (supplemental Fig. 1, available at www.jneurosci.org as supplemental material). Environments comprised a gray, flat ground and a uniform blue sky and contained environmental features (walls and towers) built of colored (red or green) blocks. Each block had dimensions of 3 × 1.5 × 1.5 virtual meters; walls were 10 blocks long and two blocks high, and towers were two blocks wide and 10 blocks high. All environments contained a total of five environmental features made out of 100 blocks in total. The environments were designed to vary along two orthogonal dimensions while holding the number of scene elements and blocks constant: (1) “boundariness” (the number of walls around the observer) and (2) color complexity. Boundariness had five levels (Fig. 1): zero walls (five towers); one wall (four towers); two walls (three towers); three walls (two towers); four walls (one tower). Color complexity had four levels (Fig. 1): single color, mixed color 1 (walls and towers were different colors); mixed color 2 (walls were one color on the bottom and the other color on the top); and striped (alternate blocks in walls and towers were different colors). Screenshots of the environments used for the encoding phase (see below) were taken from eight equally separated aerial viewpoints and showed the layout of all walls and towers. Screenshots used for the test phase were taken from the point of view of an observer standing on the ground in the center of the environment facing eight equally separated directions. These latter screenshots had an 80° field of view and therefore only showed a subset of the environmental features. A final condition used complex three-dimensional structures comprising 100 blocks of mixed colors presented in front of a uniform gray background (supplemental Fig. 1, available at www.jneurosci.org as supplemental material). Screenshots of the structures were taken from eight equally spaced viewpoints facing toward its center of mass.
Figure 1.

Examples of stimuli used in different conditions. All environments had five structural elements (walls or towers). There were five levels of boundary, from zero to four walls. There were four levels of color, aimed to be of increasing complexity to imagine. No behavioral measures differentiated the levels mixed (1) and mixed (2) so these were combined for the imaging analyses. Subjects were asked to imagine standing on the central yellow dot and visualizing the environments from this location. After forming a clear mental image facing a self-selected direction, they were required to then imagine rotating through 360°.
Procedure
Prescan training.
First, the task was described in detail and participants were talked through four example trials. At the start of each example trial, the participant was shown an aerial screenshot of the environment (Fig. 2, encoding phase) and told that this showed the layout and the colors of the different walls and towers. They were told that their task would be to imagine being in such an environment. The experimenter then opened the environment in the virtual-reality program Unreal, which shows the environment from a moveable first-person perspective. The experimenter rotated the viewpoint by 360°, drawing attention to the environmental features as well as features that were no longer in view (e.g., when a tower was directly behind the observer). The experimenter also moved the viewpoint to one of the walls and to the bottom of one of the towers and panned the viewpoint upward to illustrate the scale of the walls and towers relative to the observer. It was stressed that, during the main task, participants should try to imagine the environments from the same perspective as shown in the demonstration, i.e., while standing on the ground in the middle of the environment with the walls and towers around.
Figure 2.

Task design. After a variable intertrial interval (ITI), subjects were shown an aerial view of the to-be-imagined scene. The start of the 10 s visualization period was prompted by the instruction to “close your eyes”. An auditory tone signaled the end of the visualization period, and subjects were asked to rate the vividness of their imaged scene using the keypad (rating question). After a response (or after 3.5 s if no response was made), subjects were shown an example screenshot of a ground-level view of a portion of a scene for 1 s and then asked whether it was consistent with their imagined scene (while the picture remained on screen; test question). They had 3.5 s to respond using a four-point confidence rating scale (1, sure it was consistent; 2, fairly sure it was consistent; 3, fairly sure it was inconsistent; 4, sure it was consistent).
After the four example trials in which the experimenter demonstrated how the environment would look if one was “really there,” participants practiced eight trials of the main task (see below).
Main task.
Each trial started with the presentation of a cue image (an aerial screenshot) for 3.5 s, followed by the instruction to “close your eyes” (Fig. 2). Participants closed their eyes and imagined standing in the middle of the cued environment and visualize as accurately as possible the locations and colors of the environmental features consistent with facing a particular direction (as chosen by the participant). Once the participant felt that they had formed a clear image of the environment, they pressed a button and then spent the remaining time available imagining rotating through 360° and visualizing the successive environmental features in turn. An audio tone signaled the end of the visualization period at which point the participant opened their eyes. Participants then rated the vividness of their imagined scene (rating question) on a four-point scale, with 1 corresponding to “most vivid” and 4 corresponding to “least vivid.” After responding, or after 3.5 s if no response was made, a ground-level screenshot of an environment was presented for 1 s, followed by the question “Is this a scene from your imagined environment?”, during which the screenshot remained visible (test question). The screenshot was either consistent with the imagined environment (but note that it would only show a subset of the environmental features from an arbitrary viewpoint) or it was inconsistent (either the colors of the features were wrong or their spatial configuration was wrong, but never both). Participants answered on a scale from 1 (sure “yes”) to 4 (sure “no”). The purpose of the test was to ensure that participants visualized the correct layout and colors of the environments and also to reinforce that they should imagine the environments from ground-level rather than from the aerial view shown in the cue phase. The trials with the “structures” followed the same format but the cue image was from the same perspective as the test image, and the participant was required to imagine the item rotating in front of them. The data from these trials will not be considered further (for more details, see supplemental Fig. 1, available at www.jneurosci.org as supplemental material).
After scanning, participants were shown examples of all of the environments and structures that had been used in the experiment (shown as aerial views) and were required to rate each one for how easy it had been to visualize during the task on a 10-point scale (1 for very easy, 10 for very difficult). The purpose of this rating was to obtain a subjective difficulty rating that was not affected by trial-by-trial fluctuations in attention and when the relative difficulty of each trial could be judged, after having experienced all of the environments.
Trial types.
There were 75 trials in total (60 environments and 15 structures). The test image was consistent with the imagined environment on 44 of 60 trials and with the imagined structure on 12 of 15 trials. Trials were presented in a pseudorandom order in two runs separated by a short break during which the participant remained within the scanner (the first run comprised 40 trials, the second comprised 35 trials). Trial order was identical for all participants.
MRI acquisition
Blood oxygenation level-dependent (BOLD)-sensitive T2*-weighted fMRI measurements were acquired on a 3 T Siemens Allegra scanner using a gradient-echo echo planar imaging (EPI) pulse sequence with the following parameters: repetition time, 2880 ms; echo time, 30 ms; flip angle, 90°; slice thickness, 2 mm; interslice gap, 1 mm; in-plane resolution, 3 × 3 mm; field of view, 192 mm2; 48 slices per volume. The sequence was optimized to minimize signal dropout in the medial temporal lobes (Weiskopf et al., 2006). In addition, a field map using a double-echo fast, low-angle shot sequence was recorded for distortion correction of the acquired echo planar images (Weiskopf et al., 2006). After the functional scans, a T1-weighted structural image (1 mm3 resolution) was acquired for coregistration and display of the functional data.
Image preprocessing
All preprocessing and statistical analyses were performed using SPM8 (www.fil.ion.ucl.ac.uk/spm). Each subject's structural scan was coregistered to a mean image of their realigned functional scans and then used to calculate transformation parameters for normalizing the functional images to the Montreal Neurological Institute (MNI) template brain. The first five EPI volumes were discarded to allow for T1 equilibration. Echo planar images were spatially realigned to the first image in the times series and were corrected for distortions based on the field map (Hutton et al., 2002) and the interaction of motion and distortion using the Unwarp routines in SPM (Andersson et al., 2001; Hutton et al., 2002). Then images were normalized to the standard EPI template (MNI reference brain). Finally, the normalized functional images were spatially smoothed with an isotropic 8 mm full-width at half-maximum Gaussian kernel. Structural scans were normalized and averaged using the DARTEL toolbox (Ashburner, 2007), and these mean images were used to display the data.
Data analysis
After preprocessing, statistical analysis was performed using a general linear model. Each trial had four “phases”: the cue phase, imagination phase, question phase, and intertrial interval. For most of the analyses, our interest was in the 10 s imagination phase, which was modeled as a boxcar function (10 s duration) and convolved with the canonical hemodynamic response function (HRF) to create regressors of interest. In several analyses, the imagination phase was parametrically modulated by a variable (see below) to create the regressors of interest. The cue phase and question phase were also modeled as boxcar functions (3.5 s duration and variable duration according to participant-specific reaction times, respectively) and convolved with the HRF to create regressors of no interest. Trials in which an incorrect response had been made using the highest confidence category were modeled separately and included as regressors of no interest. For each participant, each session was modeled separately. Within each model detailed below, the subject-specific parameter estimates for each regressor (β values) were calculated for each voxel. The parameter estimates were entered into a second-level random-effects analysis. That is, for each voxel in the brain, single-sample t tests were used to determine whether the estimated contrast of parameter estimates was significantly different from zero. Based on our strong a priori hypotheses with respect to the hippocampus, we have chosen an uncorrected statistical threshold of p < 0.001 (uncorrected for multiple comparisons), with an extent threshold of five or more contiguous voxels. For completeness, we also report activations that survive small volume correction (SVC) for an anatomically defined bilateral medial temporal lobe region of interest (ROI) that includes hippocampus (including subiculum), entorhinal cortex, and the parahippocampal gyrus (volume, ∼13,500 mm3). This procedure allows results to be corrected (p < 0.05) for multiple non-independent comparisons within a defined ROI.
Results
Behavioral results
The overall level of performance was high in terms of correct responses to the test images (mean ± SD correct, 87.0 ± 11.5%). Separate repeated-measures ANOVAs were performed on the behavioral data to investigate the independent effects of boundariness and color complexity on various performance measures. We will consider first the effect of boundariness, our manipulation of interest. There were five levels (zero walls to four walls). Accuracy in identifying whether the test image was consistent with the imagined scene was scored on a four-point scale in which correct and incorrect responses were weighted by confidence: 1, high confident correct response; 2, low confident correct response; 3, low confident incorrect response; 4, high confident incorrect response (Table 1). There was a significant main effect of boundariness (F(4,52) = 5.9, p = 0.001) on accuracy, with the relationship following an inverted U-shape in which responses were less accurate for intermediate numbers of boundaries and were most accurate for both high and low numbers of boundaries. Similar inverted U-shaped relationships were observed for trial-by-trial ratings of vividness (F(4,52) = 7.4, p < 0.001), reaction time to the test question (F(4,52) = 11.5, p < 0.001), and postscan ratings of difficulty to imagine (F(4,52) = 51.6, p < 0.001).
Table 1.
Behavioral results
| Color level | Boundary level |
|||||
|---|---|---|---|---|---|---|
| 0 | 1 | 2 | 3 | 4 | Combined | |
| Single | 1.13 (0.04) | 1.5 (0.11) | 1.51 (0.13) | 1.43 (0.14) | 1.3 (0.1) | 1.37 |
| Mixed | 1.36 (0.13) | 1.79 (0.17) | 1.57 (0.12) | 1.54 (0.17) | 1.2 (0.08) | 1.49 |
| Striped | 1.96 (0.24) | 1.71 (0.13) | 1.96 (0.23) | 1.57 (0.14) | 1.11 (0.11) | 1.66 |
| Combined | 1.48 | 1.67 | 1.68 | 1.51 | 1.2 | |
Mean accuracy scores for the different experimental conditions (SEMs are shown in parentheses). Accuracy scores are correct and incorrect responses weighted by confidence (see Results). Perfect score is 1, range of 1–4.
The other experimental manipulation was of the color complexity of the environmental features. There were four levels of color complexity (see Materials and Methods). However, preliminary analyses revealed that there were no behavioral measures that differentiated the middle two levels, which comprised either separately colored environmental elements or environmental elements with long strips of a single color (Fig. 1), so for simplicity here and in the fMRI analyses below, we collapsed these levels to form a single mixed color level of medium complexity. There was a main effect of color complexity on accuracy (F(2,26) = 5.9, p = 0.008), with the single color environments being easiest, mixed color environments being intermediate, and striped color environments being most difficult (Table 1). The same relationship was found for reaction time to the test question (F(2,26) = 12.9, p < 0.001) and postscan ratings of difficulty (F(2,26) = 8.5, p = 0.001). There was no effect of color complexity on trial-by-trial ratings of vividness (F(2,26) < 1).
There was a significant interaction between boundariness and color complexity in the accuracy data (F(8,104) = 3.1, p < 0.005), which appeared to be driven by disproportionately poorer performance in the zero-wall condition on the striped color trials. There was also a marginally significant interaction in the trial-by-trial vividness ratings (F(8,104) = 1.9, p = 0.06), reflecting disproportionately lower vividness ratings in the one-wall condition on the striped color trials. However, there were no significant interactions for measures of reaction time or ratings of difficulty (both F(8,104) < 1). The relationship between boundariness, color complexity, and postscan ratings of difficulty to imagine is shown in Figure 3.
Figure 3.

Behavioral results. The relationship between perceived difficulty of imagining the different scenes, the number of boundaries, and color condition.
In summary, the fact that the relationship between measures of task difficulty and the number of boundaries followed an inverted U-shape indicates that any observed parametric fMRI responses related to increased numbers of boundaries could not simply reflect task difficulty. The orthogonal manipulation of color complexity had a linear effect on most measures of task difficulty, and there were no systematic interactions between color complexity and the levels of boundariness on difficulty.
Imaging results
Parametric effect of increasing boundariness during imagination
Initial analyses identified a network of brain regions recruited during the imagination and encoding phases that are consistent with previous neuroimaging studies of spatial memory (Burgess et al., 2001b) and imagery (Addis et al., 2007; Hassabis et al., 2007a) (supplemental Tables 1, 2, available at www.jneurosci.org as supplemental material). Similar activations were found for the structures as for the scenes. Our main hypothesis was that the hippocampus will be more engaged when imagining scenes containing more enclosing boundaries. To test this, the critical analysis involved identifying brain regions in which the BOLD response varies parametrically with boundariness. The results are shown in Figure 4. The strongest correlation was found in a region lying within the left hippocampus (which survives SVC for a bilateral medial temporal lobe ROI, p < 0.05). There were also significant effects in medial parietal lobe, left angular gyrus/supramarginal gyrus (in the intraparietal sulcus), and the right posterior angular gyrus (Table 2, top). These regions all show positive correlations between the number of boundaries and BOLD response: the more boundaries there were in the imagined environment, the higher the activation.
Figure 4.
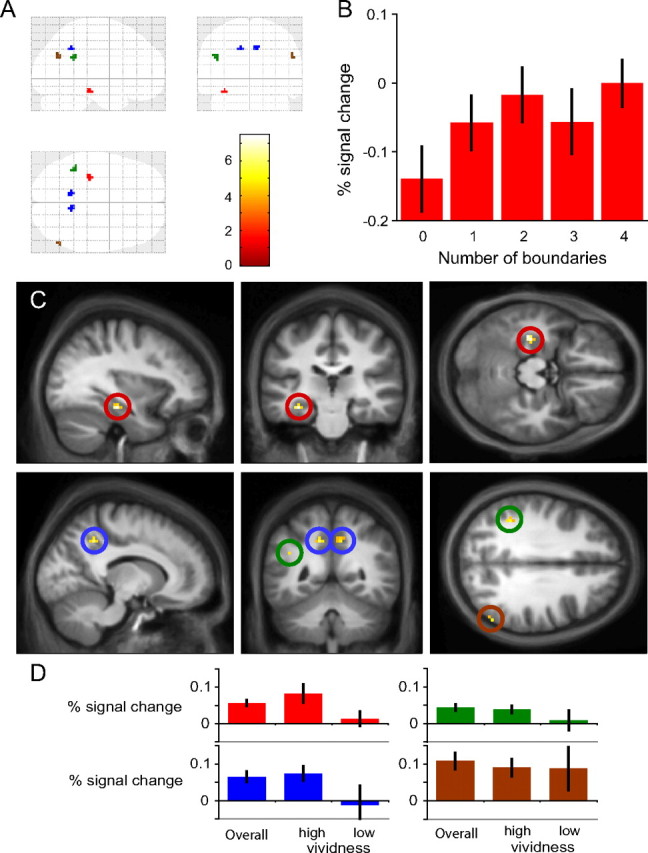
Boundary-related activation. There was a parametric modulation of BOLD response by the number of boundaries in four brain regions, including the middle of the left hippocampus. These are shown in the glass brain (A). The percentage signal change in the hippocampus for the five levels of boundary are shown in B. The hippocampal activation is shown projected on to the mean structural image in the top row of C, and the other activations are shown in the bottom row (color bar indicates t-statistic). D shows the percentage signal change associated with the parametric modulation of BOLD by the number of boundaries for the four regions (all trials and trials split by high and low vividness ratings).
Table 2.
Regions showing the imagination boundary effect
| Region | Cluster size | z-score | x | y | z |
|---|---|---|---|---|---|
| L hippocampus | 8 | 4.58 | −33 | −25 | −17 |
| L precuneus | 7 | 4.13 | −12 | −49 | 40 |
| R precuneus | 8 | 3.56 | 9 | −49 | 40 |
| L angular gyrus/supramarginal gyrus | 9 | 3.79 | −42 | −46 | 28 |
| R angular gyrus | 5 | 3.59 | 57 | −64 | 28 |
| L hippocampus/L amygdala | 12 | 4.22 | −24 | −4 | −23 |
| L insula | 9 | 3.96 | −30 | 11 | −11 |
| R precuneus/posterior cingulate | 23 | 3.94 | 9 | −49 | 37 |
| R superior frontal gyrus (medial) | 6 | 3.47 | 9 | 53 | 1 |
Brain regions showing a significant parametric modulation of BOLD response by the number of boundaries in the imagined environments. L, Left; R, right. Top, All trials; bottom, vividly imagined trials only.
Parametric effect of boundariness is stronger for vividly imagined environments
According to the model of Burgess and colleagues (Byrne et al, 2007), the hippocampus is necessary to generate imagery for spatially coherent scenes with respect to environmental boundaries. It follows that the boundary effect should be clearest during successful generation of internal images, i.e., when imagery is rated as vivid. The trial-by-trial vividness ratings were not evenly distributed (1, 55%; 2, 35%; 3, 8%; 4, 1%; missing, 1%, in which 1 indicates most vivid). For this reason, responses were classed as high vividness (response 1) or low vividness (responses 2–4). Accuracy on the test image was significantly higher for items that had been rated as most vivid (mean ± SD accuracy, 1.35 ± 0.88 vs 1.56 ± 0.87, t = −3.87, df = 1038, p < 0.001).
We first investigated the boundary effect in the four regions identified in the previous analysis. In all regions apart from the lateral parietal area on the right, the parametric boundary effect was stronger and less variable for more vividly imagined scenes (Fig. 4). In the lateral parietal region, the effect appeared to be as strong for less vivid scenes but far more variable across subjects. When considering only the high vividness trials alone, there was a significant parametric effect of boundariness in the left hippocampus (which survives SVC for a bilateral medial temporal lobe ROI, p < 0.05), slightly anterior to the peak identified in the main parametric analysis (Fig. 5). Additionally, there was again activation of the medial parietal lobe. There were also regions of activations in the left anterior insula and the frontal cortex (Table 2, bottom). In contrast, the parametric analysis of boundariness in the low vividness trials revealed no significant activations anywhere, including in the hippocampus (which showed no activation even at p < 0.005 uncorrected).
Figure 5.

Boundary-related activation during the high vividness trials (color bar indicates t-statistic). The region in the anterior hippocampus/amygdala (left and middle) and the precuneus (right) are shown projected on to the mean structural image.
Control analyses
Boundary effect is not a “carryover” from perception.
We looked for activations that showed significant correlations with boundariness during encoding. There were bilateral activations in frontal cortex as well as the insula bilaterally, left-sided middle temporal gyrus, posterior cingulate, and lateral parietal lobe (angular and supramarginal gyrus) (supplemental Table 3, available at www.jneurosci.org as supplemental material). However, the parametric boundary effect was not present in the hippocampus at encoding. Investigation of the parameter estimates at the location of the peak voxel identified in the main analysis revealed that the boundary effect during encoding was more variable across subjects than during imagination but did reach significance a reduced level of p = 0.004 uncorrected for multiple comparisons (activation does not survive SVC). At a reduced threshold, there were two activations in or near the left hippocampus [MNI coordinates (x, y, z): (−27, −37, 1), p < 0.005, three voxels; (−36, −28, −14), p < 0.005, nine voxels including the peak voxel activated during imagination). This analysis provides some evidence that the boundary effect was present in the hippocampus while encoding the to-be-imagined images, but the effect was considerably weaker than during the imagination phase itself.
Boundary effect is not attributable to “feature complexity.”
As a nonspatial control for the boundary analysis, we looked for activations showing a parametric effect of increasing color complexity. This manipulation had an effect on accuracy and ratings of difficulty to imagine (see above), indicating that it increased the complexity of the environmental features that had to be imagined.
During imagination, activations varying parametrically with increasing color complexity were found in the right hemisphere in the inferior and middle frontal gyri, the inferior temporal gyrus, and bilaterally in the cerebellum (supplemental Table 4, available at www.jneurosci.org as supplemental material). Importantly, there were no parametric effects of color complexity in the hippocampus, including the location that showed the boundary effect, even when the threshold was dropped to the more lenient level of p < 0.005 uncorrected for multiple comparisons. Additional analyses performed on the peak voxel activated by the boundary effect revealed that there were no differences in the percentage signal changes between any of the color conditions, although there was a weak, nonsignificant trend for increasing activation across the three color conditions (z = 1.66, p = 0.049 uncorrected for multiple comparisons) (for additional details, see supplemental Fig. 2, available at www.jneurosci.org as supplemental material). During encoding, there were extensive regions of occipital cortex in which activity correlated with increasing color complexity (supplemental Table 5, available at www.jneurosci.org as supplemental material). These included bilateral regions identified as the color-responsive region V4 (visual cortical area 4), particularly the anterior region V4α (Bartels and Zeki, 2000).
These results demonstrate that hippocampal activity is not always modulated by manipulation of aspects of the to-be-imagined scenes. Varying the color complexity of the elements in the scenes had an impact on behavioral measures of task difficulty but only a weak and nonsignificant impact on hippocampal activation.
Boundary effect is not attributable to boundary-related task difficulty.
Although the hippocampus was insensitive to a nonspatial manipulation of environmental complexity, it is possible that hippocampal activity might reflect the fact that some boundary conditions were more difficult to imagine than others. The relationship between the ability to match the test image with the imagined scene and number of boundaries was U-shaped, meaning that scenes that contained approximately equal numbers of walls and towers were most difficult to visualize (Table 1). In this analysis, we looked for activity that correlated with increasing boundary-related task difficulty. The accuracy scores were used to calculate difficulty parameters corresponding to the five boundary levels (Table 1, Combined). Robust correlations were found in superior lateral and medial parietal regions and premotor cortex (supplemental Table 6, available at www.jneurosci.org as supplemental material), but there were no significant activations in the hippocampus. At a reduced threshold, there was a region of activation that extended into the right parahippocampal gyrus from the inferior temporal gyrus in the lateral temporal lobe [MNI coordinates (30, −43, −5), p < 0.005, 57 voxels] but no significant hippocampal activations (z = 0.49, p = 0.313 at the peak voxel identified with the boundary effect). This analysis demonstrates that the boundary effect is not caused by how difficult the different layouts of boundaries were to imagine.
Boundary effect is not attributable to perceived difficulty of imagining the environments.
In a final analysis of task difficulty effects, we investigated which areas showed BOLD correlations with postscan ratings of how difficult the environments were to visualize. This analysis revealed a network of regions very similar to the one identified with boundary-related task difficulty (supplemental Table 7, available at www.jneurosci.org as supplemental material). When the threshold was dropped, there were small bilateral regions of activation in the middle and posterior portions of the parahippocampal gyri [MNI coordinates: middle part, (−33, −25, −23), p < 0.005, 15 voxels; (24, −25, −23), p < 0.005, six voxels; posterior part, (−18, −40, −2), p < 0.005, two voxels; (27, −46, −5), p < 0.005, seven voxels]. Importantly, there was no parametric effect of difficulty either in the location identified as showing the strongest boundary-related effect (z = 1.25, p = 0.107) (for more details, see supplemental Fig. 2, available at www.jneurosci.org as supplemental material) or elsewhere in the hippocampus. Once again, this shows that the boundary effect is not driven by task difficulty.
Discussion
Participants visualized standing in environments that contained varying proportions of colored walls (boundaries) and towers (nonboundaries). Hippocampal activity increased with increasing numbers of environmental boundaries in the scenes (the boundary effect), particularly those that were vividly imagined. In contrast, hippocampal activity was not significantly modulated by increasing color complexity of the environments or by levels of difficulty. These findings are consistent with the hippocampus playing a similar role when orienting oneself in an imagined space as place cells play when animals orient themselves in real space (O'Keefe and Burgess, 1996; Hartley et al., 2000; Burgess et al., 2001a; Byrne et al., 2007; Bird and Burgess, 2008), that is, computing one's current location with respect to environmental boundaries.
Our sense of location is likely supported by the firing of hippocampal place cells (O'Keefe and Nadel, 1978; Ekstrom et al., 2003), which specifically reflects location relative to environmental boundaries (O'Keefe and Burgess, 1996; Lever et al., 2002; Yoganarasimha and Knierim, 2005) rather than local landmarks (Cressant et al., 1997; Doeller et al., 2008). We have proposed that the same machinery required to orient oneself in the physical world also supports mental imagery of spatially coherent environments: reciprocal connections between place cells, BVCs, and representations of objects enable reactivation of the contents of a scene, consistent with perception from a single location within an environment (Becker and Burgess, 2001; Burgess et al., 2001a;Byrne et al., 2007; Bird and Burgess, 2008). Doeller et al. (2008) speculated that the influence of environmental boundaries on the hippocampal representation of location might be proportional to their horizontal extent about the observer. Consistent with this, increasing the number of boundaries (which is directly related to their horizontal extent) in an imagined scene parametrically increased BOLD response in a region of the left hippocampus (Fig. 4, Table 2).
Importantly, the boundary effect was only present in the hippocampus during vividly imagined trials, consistent with a dependence on what is actually visualized rather than the aim of visualization. Furthermore, the effect was only reliably found during imagination; merely attending to images of scenes containing more boundaries did not modulate hippocampal activation. We suggest that the subthreshold trend for a boundary-related effect while encoding scenes reflects participants starting to visualize the scene.
Distortions to the boundaries in a virtual-reality environment cause biases in human object location memory that mimic distortions in hippocampal place fields (Hartley et al., 2004). Based on the influence of environmental features on place cell firing, we have conceptualized anything that extends horizontally and impedes motion across it as a boundary [i.e., any extended objects, structures, or geographical features (Doeller et al., 2008; Lever et al., 2009)]. Nevertheless, through inspection of Figure 4, it appears that the largest increase in hippocampal activation corresponds to the change from no boundaries to one. Although the model predicts increasing hippocampal involvement with increasing numbers of enclosing boundaries, it may be that the addition of the first boundary relative to none increases activation more than subsequent additions. This may relate to the recent finding that imagining the first object in a scene increases activation in the left medial temporal lobe, whereas the addition of subsequent objects has a more variable effect (Summerfield et al., 2010).
A “core” network of brain regions is commonly activated during imagination tasks and also during autobiographical memory, navigation, prospection, and mentalizing (Spreng et al., 2009). Our study specifically investigated parametric boundary-related effects on BOLD activity during imagination rather than regions associated with imagination per se, and the regions identified with the boundary effect are only a subset of the core network. One, the precuneus, has been hypothesized to maintain an egocentric representation of the scene elements that are visible from a particular location (Becker and Burgess, 2001; Burgess et al., 2001a; Byrne et al., 2007). Consistent with this role, the precuneus is activated when participants are required to visualize a third-person perspective (Vogeley et al., 2004). The presence of the boundary effect in the precuneus suggests that neurons in this region can be driven by medial temporal lobe representations of environmental boundaries (supported by place cells and BVCs).
We did not find a parametric effect of boundaries in the parahippocampal gyrus, which is part of the core network described above and contains a region that responds selectively to “places” (Epstein and Kanwisher, 1998). This suggests that it responds to the spatial layout of scenes regardless of their structural elements. The BVC model predicted that cells responding to environmental boundaries would be found in regions inputting to the hippocampus, and such cells have been described recently in rodent subiculum and entorhinal cortex (Savelli et al., 2008; Solstad et al., 2008; Lever et al., 2009). Why then did these regions not show a boundary effect? According to the model, the relatively large number of place cells receive inputs from different combinations of a much smaller number of BVCs. Experimentally, the proportion of boundary-related cells ranges from <10 to 25% (Savelli et al., 2008; Solstad et al., 2008; Lever et al., 2009) compared with ∼85% of cells that are place cells in the main cell layer hippocampal region CA1 (Wills et al., 2010). Thus, it may be that the hippocampal place cells produce a stronger fMRI signal than the more sparse populations of BVCs themselves.
The left lateralization of the boundary effect is apparently at odds with neuropsychological evidence that visuospatial processing in the medial temporal lobe is right lateralized (Milner, 1971; Frisk and Milner, 1990). However, increasing correlations with detail in imagined or recollected episodes have been reported in the left hippocampus (Addis et al., 2004; Addis and Schacter, 2008; Weiler et al., 2010), and neuropsychological evidence also suggests a left-lateralized medial temporal lobe role in episodic memory (Frisk and Milner, 1990) even when not verbally mediated (Spiers et al., 2001; Burgess et al., 2002).
The hippocampus is necessary for remembering spatial and relational information over short delays (Hannula et al., 2006; Olson et al., 2006; Hartley et al., 2007). However, our nonspatial manipulation of the color complexity of the imagined environments did not modulate hippocampal activation, nor did scenes that were rated more difficult to imagine (supplemental Fig. 2, available at www.jneurosci.org as supplemental material) (Summerfield et al., 2010). Similarly, hippocampal activation did not reflect the difficulty of imaging the different spatial layouts used (as evidenced by performance on the memory task). In contrast, a network of parietal and frontal regions (supplemental Tables 6, 7, available at www.jneurosci.org as supplemental material) were responsive to task difficulty, consistent with fMRI activations found during conditions of high attentional or working memory demands (Naghavi and Nyberg, 2005; Dosenbach et al., 2006; Duncan, 2006).
We have specifically focused on the role of the hippocampus in representing environmental geometry, but the hippocampus will clearly also make other contributions to imagination more generally. Other imagination studies have described hippocampal activations modulated by the decreasing probability that an event will occur and by the increasing remoteness of a future event (Addis and Schacter, 2008; Weiler et al., 2010). Both of these studies proposed that less likely and more remote events require greater relational processing. Using a very different paradigm, Andrews-Hanna et al. (2010) described a parametric effect in a small network of brain regions, including the hippocampus related to the combined “mnemonic scene construction score” (use of memory, imagination, and spatial content) of imagined episodes. Another key component of these tasks is the linking together of a sequence of events that happens within the spatial context. Recent evidence has shown that, as well as encoding the current location, place cells are sometimes activated in sequences representing locations the rat has recently visited or might visit in future (Foster and Wilson, 2006; Diba and Buzsáki, 2007; Johnson and Redish, 2007), and the human hippocampus has been implicated in representing sequences (Kumaran and Maguire, 2006; Lehn et al., 2009; Ross et al., 2009). In addition, it has been suggested that grid cells (Hafting et al., 2005) may also contribute to the representation of context in autobiographical and episodic memory (Hasselmo, 2009; Doeller et al., 2010). These studies demonstrate the broad potential of mapping between neuronal representations in rodents to mechanisms of human episodic memory, imagination, and future thinking (Buckner, 2010) and illustrate the potential range of functional contributions that might be supported by the hippocampal formation.
Conclusions
We have identified a specific role for the hippocampus in mental imagery for scenes: constructing scenes so as to be spatially coherent with respect to environmental boundaries. In contrast, there was no evidence that hippocampal involvement in mental imagery is modulated by either nonspatial complexity of the scenes or increasingly complex configurations of environmental features. When navigating in the world, the hippocampus is involved in computing one's location with respect to environmental boundaries (both within and outside of the current field of view). We have suggested that, during mental navigation and imagination more generally (including during memory retrieval), the same machinery is required to generate spatially coherent scenes. The current study provides support for these proposals.
Footnotes
This work was funded by the United Kingdom Medical Research Council. We thank the Wellcome Trust Centre for Neuroimaging at University College London for providing help and scanning facilities and Eleanor Maguire for useful discussions.
References
- Addis DR, Schacter DL. Constructive episodic simulation: temporal distance and detail of past and future events modulate hippocampal engagement. Hippocampus. 2008;18:227–237. doi: 10.1002/hipo.20405. [DOI] [PubMed] [Google Scholar]
- Addis DR, Moscovitch M, Crawley AP, McAndrews MP. Recollective qualities modulate hippocampal activation during autobiographical memory retrieval. Hippocampus. 2004;14:752–762. doi: 10.1002/hipo.10215. [DOI] [PubMed] [Google Scholar]
- Addis DR, Wong AT, Schacter DL. Remembering the past and imagining the future: common and distinct neural substrates during event construction and elaboration. Neuropsychologia. 2007;45:1363–1377. doi: 10.1016/j.neuropsychologia.2006.10.016. [DOI] [PMC free article] [PubMed] [Google Scholar]
- Andersson JL, Hutton C, Ashburner J, Turner R, Friston K. Modeling geometric deformations in EPI time series. Neuroimage. 2001;13:903–919. doi: 10.1006/nimg.2001.0746. [DOI] [PubMed] [Google Scholar]
- Andrews-Hanna JR, Reidler JS, Sepulcre J, Poulin R, Buckner RL. Functional-anatomic fractionation of the brain's default network. Neuron. 2010;65:550–562. doi: 10.1016/j.neuron.2010.02.005. [DOI] [PMC free article] [PubMed] [Google Scholar]
- Ashburner J. A fast diffeomorphic image registration algorithm. Neuroimage. 2007;38:95–113. doi: 10.1016/j.neuroimage.2007.07.007. [DOI] [PubMed] [Google Scholar]
- Bartels A, Zeki S. The architecture of the colour centre in the human visual brain: new results and a review. Eur J Neurosci. 2000;12:172–193. doi: 10.1046/j.1460-9568.2000.00905.x. [DOI] [PubMed] [Google Scholar]
- Becker S, Burgess N. A model of spatial recall, mental imagery and neglect. Neural Inf Process Syst. 2001;13:96–102. [Google Scholar]
- Bird CM, Burgess N. The hippocampus and memory: insights from spatial processing. Nat Rev Neurosci. 2008;9:182–194. doi: 10.1038/nrn2335. [DOI] [PubMed] [Google Scholar]
- Buckner RL. The role of the hippocampus in prediction and imagination. Annu Rev Psychol. 2010;61:27–28. C1–C8. doi: 10.1146/annurev.psych.60.110707.163508. [DOI] [PubMed] [Google Scholar]
- Burgess N, Jackson A, Hartley T, O'Keefe J. Predictions derived from modelling the hippocampal role in navigation. Biol Cybern. 2000;83:301–312. doi: 10.1007/s004220000172. [DOI] [PubMed] [Google Scholar]
- Burgess N, Becker S, King JA, O'Keefe J. Memory for events and their spatial context: models and experiments. Philos Trans R Soc Lond B Biol Sci. 2001a;356:1493–1503. doi: 10.1098/rstb.2001.0948. [DOI] [PMC free article] [PubMed] [Google Scholar]
- Burgess N, Maguire EA, Spiers HJ, O'Keefe J. A temporoparietal and prefrontal network for retrieving the spatial context of lifelike events. Neuroimage. 2001b;14:439–453. doi: 10.1006/nimg.2001.0806. [DOI] [PubMed] [Google Scholar]
- Burgess N, Maguire EA, O'Keefe J. The human hippocampus and spatial and episodic memory. Neuron. 2002;35:625–641. doi: 10.1016/s0896-6273(02)00830-9. [DOI] [PubMed] [Google Scholar]
- Byrne P, Becker S, Burgess N. Remembering the past and imagining the future: a neural model of spatial memory and imagery. Psychol Rev. 2007;114:340–375. doi: 10.1037/0033-295X.114.2.340. [DOI] [PMC free article] [PubMed] [Google Scholar]
- Cressant A, Muller RU, Poucet B. Failure of centrally placed objects to control the firing fields of hippocampal place cells. J Neurosci. 1997;17:2531–2542. doi: 10.1523/JNEUROSCI.17-07-02531.1997. [DOI] [PMC free article] [PubMed] [Google Scholar]
- Diba K, Buzsáki G. Forward and reverse hippocampal place-cell sequences during ripples. Nat Neurosci. 2007;10:1241–1242. doi: 10.1038/nn1961. [DOI] [PMC free article] [PubMed] [Google Scholar]
- Doeller CF, King JA, Burgess N. Parallel striatal and hippocampal systems for landmarks and boundaries in spatial memory. Proc Natl Acad Sci U S A. 2008;105:5915–5920. doi: 10.1073/pnas.0801489105. [DOI] [PMC free article] [PubMed] [Google Scholar]
- Doeller CF, Barry C, Burgess N. Evidence for grid cells in a human memory network. Nature. 2010;463:657–661. doi: 10.1038/nature08704. [DOI] [PMC free article] [PubMed] [Google Scholar]
- Dosenbach NU, Visscher KM, Palmer ED, Miezin FM, Wenger KK, Kang HC, Burgund ED, Grimes AL, Schlaggar BL, Petersen SE. A core system for the implementation of task sets. Neuron. 2006;50:799–812. doi: 10.1016/j.neuron.2006.04.031. [DOI] [PMC free article] [PubMed] [Google Scholar]
- Duncan J. EPS Mid-Career Award 2004: brain mechanisms of attention. Q J Exp Psychol. 2006;59:2–27. doi: 10.1080/17470210500260674. [DOI] [PubMed] [Google Scholar]
- Eichenbaum H, Cohen NJ. Oxford: Oxford UP; 2001. From conditioning to conscious recollection: memory systems of the brain. [Google Scholar]
- Ekstrom AD, Kahana MJ, Caplan JB, Fields TA, Isham EA, Newman EL, Fried I. Cellular networks underlying human spatial navigation. Nature. 2003;425:184–188. doi: 10.1038/nature01964. [DOI] [PubMed] [Google Scholar]
- Epstein R, Kanwisher N. A cortical representation of the local visual environment. Nature. 1998;392:598–601. doi: 10.1038/33402. [DOI] [PubMed] [Google Scholar]
- Foster DJ, Wilson MA. Reverse replay of behavioural sequences in hippocampal place cells during the awake state. Nature. 2006;440:680–683. doi: 10.1038/nature04587. [DOI] [PubMed] [Google Scholar]
- Frisk V, Milner B. The role of the left hippocampal region in the acquisition and retention of story content. Neuropsychologia. 1990;28:349–359. doi: 10.1016/0028-3932(90)90061-r. [DOI] [PubMed] [Google Scholar]
- Hafting T, Fyhn M, Molden S, Moser MB, Moser EI. Microstructure of a spatial map in the entorhinal cortex. Nature. 2005;436:801–806. doi: 10.1038/nature03721. [DOI] [PubMed] [Google Scholar]
- Hannula DE, Tranel D, Cohen NJ. The long and the short of it: relational memory impairments in amnesia, even at short lags. J Neurosci. 2006;26:8352–8359. doi: 10.1523/JNEUROSCI.5222-05.2006. [DOI] [PMC free article] [PubMed] [Google Scholar]
- Hartley T, Burgess N, Lever C, Cacucci F, O'Keefe J. Modeling place fields in terms of the cortical inputs to the hippocampus. Hippocampus. 2000;10:369–379. doi: 10.1002/1098-1063(2000)10:4<369::AID-HIPO3>3.0.CO;2-0. [DOI] [PubMed] [Google Scholar]
- Hartley T, Trinkler I, Burgess N. Geometric determinants of human spatial memory. Cognition. 2004;94:39–75. doi: 10.1016/j.cognition.2003.12.001. [DOI] [PubMed] [Google Scholar]
- Hartley T, Bird CM, Chan D, Cipolotti L, Husain M, Vargha-Khadem F, Burgess N. The hippocampus is required for short-term topographical memory in humans. Hippocampus. 2007;17:34–48. doi: 10.1002/hipo.20240. [DOI] [PMC free article] [PubMed] [Google Scholar]
- Hassabis D, Kumaran D, Maguire EA. Using imagination to understand the neural basis of episodic memory. J Neurosci. 2007a;27:14365–14374. doi: 10.1523/JNEUROSCI.4549-07.2007. [DOI] [PMC free article] [PubMed] [Google Scholar]
- Hassabis D, Kumaran D, Vann SD, Maguire EA. Patients with hippocampal amnesia cannot imagine new experiences. Proc Natl Acad Sci U S A. 2007b;104:1726–1731. doi: 10.1073/pnas.0610561104. [DOI] [PMC free article] [PubMed] [Google Scholar]
- Hasselmo ME. A model of episodic memory: mental time travel along encoded trajectories using grid cells. Neurobiol Learn Mem. 2009;92:559–573. doi: 10.1016/j.nlm.2009.07.005. [DOI] [PMC free article] [PubMed] [Google Scholar]
- Hutton C, Bork A, Josephs O, Deichmann R, Ashburner J, Turner R. Image distortion correction in fMRI: a quantitative evaluation. Neuroimage. 2002;16:217–240. doi: 10.1006/nimg.2001.1054. [DOI] [PubMed] [Google Scholar]
- Johnson A, Redish AD. Neural ensembles in CA3 transiently encode paths forward of the animal at a decision point. J Neurosci. 2007;27:12176–12189. doi: 10.1523/JNEUROSCI.3761-07.2007. [DOI] [PMC free article] [PubMed] [Google Scholar]
- Kinsbourne M, Wood F. Short-term memory and the amnesic syndrome. In: Deutsch D, Deutsch JA, editors. Short term memory. New York: Academic; 1975. pp. 257–291. [Google Scholar]
- Kumaran D, Maguire EA. The dynamics of hippocampal activation during encoding of overlapping sequences. Neuron. 2006;49:617–629. doi: 10.1016/j.neuron.2005.12.024. [DOI] [PubMed] [Google Scholar]
- Lehn H, Steffenach HA, van Strien NM, Veltman DJ, Witter MP, Håberg AK. A specific role of the human hippocampus in recall of temporal sequences. J Neurosci. 2009;29:3475–3484. doi: 10.1523/JNEUROSCI.5370-08.2009. [DOI] [PMC free article] [PubMed] [Google Scholar]
- Lever C, Wills T, Cacucci F, Burgess N, O'Keefe J. Long-term plasticity in hippocampal place-cell representation of environmental geometry. Nature. 2002;416:90–94. doi: 10.1038/416090a. [DOI] [PubMed] [Google Scholar]
- Lever C, Burton S, Jeewajee A, O'Keefe J, Burgess N. Boundary vector cells in the subiculum of the hippocampal formation. J Neurosci. 2009;29:9771–9777. doi: 10.1523/JNEUROSCI.1319-09.2009. [DOI] [PMC free article] [PubMed] [Google Scholar]
- Milner B. Interhemispheric differences in the localization of psychological processes in man. Br Med Bull. 1971;27:272–277. doi: 10.1093/oxfordjournals.bmb.a070866. [DOI] [PubMed] [Google Scholar]
- Naghavi HR, Nyberg L. Common fronto-parietal activity in attention, memory, and consciousness: shared demands on integration? Conscious Cogn. 2005;14:390–425. doi: 10.1016/j.concog.2004.10.003. [DOI] [PubMed] [Google Scholar]
- O'Keefe J, Burgess N. Geometric determinants of the place fields of hippocampal neurons. Nature. 1996;381:425–428. doi: 10.1038/381425a0. [DOI] [PubMed] [Google Scholar]
- O'Keefe J, Dostrovsky J. The hippocampus as a spatial map. Preliminary evidence from unit activity in the freely-moving rat. Brain Res. 1971;34:171–175. doi: 10.1016/0006-8993(71)90358-1. [DOI] [PubMed] [Google Scholar]
- O'Keefe J, Nadel L. Oxford: Oxford UP; 1978. The hippocampus as a cognitive map. [Google Scholar]
- Okuda J, Fujii T, Ohtake H, Tsukiura T, Tanji K, Suzuki K, Kawashima R, Fukuda H, Itoh M, Yamadori A. Thinking of the future and past: the roles of the frontal pole and the medial temporal lobes. Neuroimage. 2003;19:1369–1380. doi: 10.1016/s1053-8119(03)00179-4. [DOI] [PubMed] [Google Scholar]
- Olson IR, Page K, Moore KS, Chatterjee A, Verfaellie M. Working memory for conjunctions relies on the medial temporal lobe. J Neurosci. 2006;26:4596–4601. doi: 10.1523/JNEUROSCI.1923-05.2006. [DOI] [PMC free article] [PubMed] [Google Scholar]
- Ross RS, Brown TI, Stern CE. The retrieval of learned sequences engages the hippocampus: evidence from fMRI. Hippocampus. 2009;19:790–799. doi: 10.1002/hipo.20558. [DOI] [PMC free article] [PubMed] [Google Scholar]
- Savelli F, Yoganarasimha D, Knierim JJ. Influence of boundary removal on the spatial representations of the medial entorhinal cortex. Hippocampus. 2008;18:1270–1282. doi: 10.1002/hipo.20511. [DOI] [PMC free article] [PubMed] [Google Scholar]
- Solstad T, Boccara CN, Kropff E, Moser MB, Moser EI. Representation of geometric borders in the entorhinal cortex. Science. 2008;322:1865–1868. doi: 10.1126/science.1166466. [DOI] [PubMed] [Google Scholar]
- Spiers HJ, Burgess N, Maguire EA, Baxendale SA, Hartley T, Thompson PJ, O'Keefe J. Unilateral temporal lobectomy patients show lateralised topographical and episodic memory deficits in a virtual town. Brain. 2001;124:2476–2489. doi: 10.1093/brain/124.12.2476. [DOI] [PubMed] [Google Scholar]
- Spreng RN, Mar RA, Kim AS. The common neural basis of autobiographical memory, prospection, navigation, theory of mind, and the default mode: a quantitative meta-analysis. J Cogn Neurosci. 2009;21:489–510. doi: 10.1162/jocn.2008.21029. [DOI] [PubMed] [Google Scholar]
- Squire LR. Memory and the hippocampus: a synthesis from findings with rats, monkeys, and humans. Psychol Rev. 1992;99:195–231. doi: 10.1037/0033-295x.99.2.195. [DOI] [PubMed] [Google Scholar]
- Summerfield JJ, Hassabis D, Maguire EA. Differential engagement of brain regions within a “core” network during scene construction. Neuropsychologia. 2010;48:1501–1509. doi: 10.1016/j.neuropsychologia.2010.01.022. [DOI] [PMC free article] [PubMed] [Google Scholar]
- Vogeley K, May M, Ritzl A, Falkai P, Zilles K, Fink GR. Neural correlates of first-person perspective as one constituent of human self-consciousness. J Cogn Neurosci. 2004;16:817–827. doi: 10.1162/089892904970799. [DOI] [PubMed] [Google Scholar]
- Weiler JA, Suchan B, Daum I. Foreseeing the future: occurrence probability of imagined future events modulates hippocampal activation. Hippocampus. 2010;20:685–690. doi: 10.1002/hipo.20695. [DOI] [PubMed] [Google Scholar]
- Weiskopf N, Hutton C, Josephs O, Deichmann R. Optimal EPI parameters for reduction of susceptibility-induced BOLD sensitivity losses: a whole-brain analysis at 3 T and 1.5 T. Neuroimage. 2006;33:493–504. doi: 10.1016/j.neuroimage.2006.07.029. [DOI] [PubMed] [Google Scholar]
- Wills TJ, Cacucci F, Burgess N, O'Keefe J. Development of the hippocampal cognitive map in pre-weanling rats. Science. 2010;328:1573–1576. doi: 10.1126/science.1188224. [DOI] [PMC free article] [PubMed] [Google Scholar]
- Yoganarasimha D, Knierim JJ. Coupling between place cells and head direction cells during relative translations and rotations of distal landmarks. Exp Brain Res. 2005;160:344–359. doi: 10.1007/s00221-004-2016-9. [DOI] [PubMed] [Google Scholar]