

Abstract
Aggregation of amyloid-β (Aβ) and Tau protein are hallmarks of Alzheimer's disease (AD), and according to the Aβ-cascade hypothesis, Aβ is considered toxic for neurons and Tau a downstream target of Aβ. We have investigated differentiated primary hippocampal neurons for early localized changes following exposure to Aβ oligomers. Initial events become evident by missorting of endogenous Tau into the somatodendritic compartment, in contrast to axonal sorting in normal neurons. In missorted dendritic regions there is a depletion of spines and local increase in Ca2+, and breakdown of microtubules. Tau in these regions shows elevated phosphorylation at certain sites diagnostic of AD-Tau (e.g., epitope of antibody 12E8, whose phosphorylation causes detachment of Tau from microtubules, and AT8 epitope), and local elevation of certain kinase activities (e.g., MARK/par-1, BRSK/SADK, p70S6K, cdk5, but not GSK3β, JNK, MAPK). These local effects occur without global changes in Tau, tubulin, or kinase levels. Somatodendritic missorting occurs not only with Tau, but also with other axonal proteins such as neurofilaments, and correlates with pronounced depletion of microtubules and mitochondria. The Aβ-induced effects on microtubule and mitochondria depletion, Tau missorting, and loss of spines are prevented by taxol, indicating that Aβ-induced microtubule destabilization and corresponding traffic defects are key factors in incipient degeneration. By contrast, the rise in Ca2+ levels, kinase activities, and Tau phosphorylation cannot be prevented by taxol. Incipient and local changes similar to those of Aβ oligomers can be evoked by cell stressors (e.g., H2O2, glutamate, serum deprivation), suggesting some common mechanism of signaling.
Introduction
Alzheimer's disease (AD) is a neurodegenerative disease defined by cognitive decline which correlates with histopathological changes in the brain. These include loss of synapses and neurons, deficiency in neurotransmitters and metabolism, aggregation of amyloid-β (Aβ)-peptides into extracellular “amyloid plaques” and Tau protein into intracellular “neurofibrillary tangles” (Selkoe, 2004; Binder et al., 2005; Ballatore et al., 2007). The neurofibrillary changes follow a typical pathway of spreading which corresponds to clinical symptoms, hence Tau pathology is considered as one of the culprits in the disease (Braak and Braak, 1991; Spires-Jones et al., 2009). However, early onset AD is caused by mutations in amyloid precursor protein (APP)-processing enzymes, which enhance Aβ production and trigger the formation of amyloid plaques and neurofibrillary tangles. The Aβ-cascade hypothesis holds that enhancement of Aβ triggers other pathological changes, including those of Tau. Aβ is thought to be directly toxic to neurons, as well as indirectly by causing other toxic reactions. Despite numerous studies on the pathway of APP misprocessing and its consequences for neurons the modes of Aβ toxicity have remained enigmatic (Haass and Selkoe, 2007; Small and Duff, 2008). They range from perturbation of membranes to inhibition of receptors and organelles (e.g., proteasome, mitochondria) and perturbation of calcium homeostasis (Mattson, 2007). Part of the problem is the definition of the toxic state of Aβ, which may be monomeric, oligomeric (currently favored), or fibrillar (formerly favored) (Klein, 2006; Glabe, 2008; Roychaudhuri et al., 2009). Since Aβ is a self-assembling protein, there is a continuous interconversion between different species which makes it difficult to single out a unique toxic agent (Wogulis et al., 2005). Second, differentiated neurons have a complex architecture with three compartments (axon, soma, dendrites) and distinct compositions. Thus, early effects of Aβ toxicity may become visible only locally but not in global biochemical parameters. Examples of local effects are the early loss of synapses and the appearance of Tau in somata and dendrites (Götz and Ittner, 2008).
Previous studies have focused primarily on global effects of Aβ on changes in Tau (e.g., phosphorylation, cleavage) and resulting cell death (Yankner et al., 1989; Mattson, 1990; Busciglio et al., 1995; Park and Ferreira, 2005; King et al., 2006), with less attention to the localized changes due to Tau redistribution. In this report we have used hippocampal cell cultures exposed to Aβ oligomers to identify early changes related to Tau and the neuronal cytoskeleton, in conditions where global changes are minimal. We find that a fraction of neurons shows a redistribution of endogenous Tau into the cell bodies and dendrites. These dendrites show a local elevation of Ca2+, local loss of spines, microtubules and mitochondria, redistribution of other cytoskeletal elements (e.g., neurofilaments), and local changes in the phosphorylation of Tau and activities of kinases. Similar changes can be induced by other types of cell stress (e.g., H2O2, glutamate), suggesting a common signaling cascade that culminates in local Tau pathology. Taxol prevented missorting of Tau, loss of microtubules, spines, and mitochondria, but did not reduce the elevation of Ca2+ and phosphorylation.
Materials and Methods
Western blotting.
For Western blot Analysis, cells were treated as indicated, washed once with ice-cold PBS, and scraped into lysis buffer (LB) (50 mm Tris-HCl, pH 7.4, 10% glycerol, 1% NP40, 5 mm DTT, 20 mm NaF, 50 mm Na orthovanadate, 150 mm NaCl, 5 mm CHAPS, 5 μm okadaic acid and protease inhibitor cocktail Complete (Roche). Cells were allowed to lyse for 20 min on ice or frozen at −20°C. Protein concentration was determined using the Micro-BCA method (Pierce). A total of 10–15 μg of total protein were loaded on 10% or 5–15% SDS polyacrylamide gels and transferred onto Immobilon-P transfer membranes (Millipore). To confirm equal loading and successful blotting membranes were routinely stained using the CPTS staining method (Bickar and Reid, 1992), followed by standard Western blot procedure. The following antibodies and dilutions were used: Tau:K9JA, polyclonal (A-0024, DAKO; 1:5000–1:20,000); 12E8 (phosphoTau pS262 or pS356, monoclonal; gift from P. Seubert, Elan Pharma; 1:1000); anti-Tau [pS214] (polyclonal, Biosource; 1:500); PHF1 (pS396+pS404, monoclonal; gift from P. Davies, Albert Einstein College, Bronx, NY; 1:500); AT8 (pS202+pT205, monoclonal, Pierce; 1:500); AT180 (pT231+pS235, monoclonal, Pierce; 1:100); inactive GSK3β (pS9; clone 5B3, Cell Signaling Technology; 1:1000); GSK3β (clone 7/GSK-3b, BD Transduction Laboratories; 1:3000); p44/42 MAPK (clone L34F12, Cell Signaling Technology; 1:1000); phospho-p44/42 MAPK (clone E10, Cell Signaling Technology; 1:1000); neuron-specific β3-tubulin (monoclonal TuJ-1, R&D Systems; 1:5000); actin (monoclonal AC-40, Sigma; 1:2000).
Blots were developed using ECL-Plus (GE Healthcare) or Supersignal West Femto (Pierce). Densitometry was done with NIH ImageJ software. Densitometry results were, in case of phosphorylation-dependent antibodies, normalized to the total protein and in case of phosphorylation independent antibodies normalized to tubulin or actin. For SDS-PAGE characterization of Aβ preparations, 1–5 μl of the preparation was mixed with 2× tricine sample buffer with or without SDS and β-mercaptoethanol, kept on ice for 10 min or denatured for 10 min at 95°C, loaded on SDS-free 10–20% gradient gels (Invitrogen) with 0.1% SDS only in the running buffer and transferred onto PVDF membranes and probed with monoclonal 6E10 antibody (Abcam; 1:5000) for total Aβ. For dot blot analysis, oligomers were dotted on nitrocellulose strips and exposed to A11 anti-oligomeric antibody (1:2000) (gift from C. Glabe, University of California, Irvine, CA), that shows high specificity to amyloid oligomers (Kayed et al., 2007).
Generation of Aβ oligomers.
Aβ oligomers, were generated according as published [Aβ-derived-diffusible-ligands (ADDLs)] (Lambert et al., 1998), with slight modifications. For initial characterization Aβ (1–42) obtained from Bachem was dissolved in ice-cold HFIP, thoroughly vortexed. Aliquots were taken, the HFIP was completely evaporated, and samples were frozen at −80°C until use. For oligomer preparations the dried Aβ was first dissolved in 100% DMSO to 5 mm Aβ, then further diluted 50-fold with neurobasal medium (Nb) (Invitrogen) or F12 medium (Invitrogen) supplemented with penicillin/streptomycin (PS) (PAA Laboratories GmbH) to obtain a 100 μm Aβ solution, and sonicated for 10 min. The 100 μm solution was then incubated for 24 h at 4°C and thoroughly vortexed before use. Thus, applying a 1 μm solution of Aβ oligomers to neurons (i.e., 100-fold dilution of stock solution) implies the addition of 1% medium (e.g., F12 or Nb) and 0.02% DMSO. In practice, for treatment of primary neurons, only Aβ oligomers dissolved in Neurobasal medium were used, since the F12/DMSO vehicle had a toxic effect on primary neurons on its own (see Results).
Cell culture.
Primary hippocampal neurons were isolated from embryonic E18 Sprague Dawley rats and plated on poly-d-lysine-coated glass coverslips (50 μg/ml) for immunofluorescence or on coated plastic dishes for protein biochemistry at a density of 50,000 cells per well in 24 well plates or at 100,000 cells per well in 12 well plates (Corning or Sarstedt). The plating medium was MEM supplemented with 10% horse serum, 1% glucose, 500 mm pyruvic acid and 1× penicillin/streptomycin (PS). The medium was changed to Neurobasal medium (Invitrogen) supplemented with PS and B27 (Invitrogen) and 2 mm glutamine (PAA Laboratories GmbH) after 2–4 h. The medium was doubled and at the same time cells were treated with 5 μg/ml AraC (Sigma) after 72 h d to reduce glial growth. For treatment, Aβ oligomers were applied at the indicated concentrations (0.1–5 μm) to hippocampal cells [20–30 days in vitro (DIV)] in conditioned medium for the indicated times. The concentration of the vehicle was kept constant in all experiments (5%). Other substances were dissolved in sterile PBS to generate stock solutions of at least 1 mm and further diluted in the conditioned medium of the cells to the indicated concentrations.
Lactate dehydrogenase toxicity assay.
Lactate dehydrogenase (LDH) release was measured with the Cytotoxicity Detection Kit (LDH) from Roche Diagnostics as recommended by the manufacturer. Signals were in the linear range as judged by dilutions of the positive control (1% Triton X-100 for 30 min in conditioned medium). Results are shown in relative OD change of the appropriate vehicle.
Proteasome assay.
Proteasome activity was determined following (Flood et al., 2005). Briefly, cells were washed with PBS, scraped into 30 μl of 0.38 mm EDTA, 50 mm Tris/Cl, pH 7.5, and transferred into a test tube. For cell lysis, the tube was sonicated for 2 min at 4°C. Protein concentrations were determined using the BCA-method. Protein (15 μg) was incubated with the substrate Suc-LLVY-AMC (Biomol) at 50 μm in a total volume of 50 μl of assay buffer (0.38 mm EDTA, 50 mm Tris/Cl, pH 7.5). Measurement was performed at 37°C after 30 min incubation at 37°C in a Tecan spectrofluorimeter (excitation, 380 nm; emission 460 nm). As negative control 15 μg of the protein sample was denatured by boiling for 10 min or the proteasome inhibitor MG132 at a concentration of 400 nm was added to the cell culture at the same time as Aβ or vehicle.
ATP assays.
ATP was determined by an ATP determination kit (Biaffin GmbH). Cell lysates in lysis buffer were instantly snap frozen in liquid nitrogen and transferred to −80°C. Before measurements frozen lysates were thawed on ice, diluted 1:1 up to 1:6 with reagent lysis buffer (RLB) depending on the ATP content. Diluted lysate (30 μl) was added to 30 μl of reagent. The ATP content was measured using a luminometer (Eppendorf) by quantifying the luminescence at 562 nm and integrating over 20 s. For each measurement a calibration curve using freshly dissolved ATP in doubly distilled H2O and diluted in RLB for ATP concentrations between 1 nm and 1 mm. ATP contents in lysates were normalized to protein concentrations.
Immunostaining.
Cells were fixed in 3.7% formaldehyde for 20 min, permeabilized for 6 min in 80% ice-cold methanol and incubated with the following antibodies (for details, see above): K9JA (DAKO Tau-A0024, 1:500); DA9 (mAb against Tau, gift from P. Davies, 1:200); mAb AP20 against MAP2 (Sigma; 1:100); polyclonal anti-neurofilament 200 (Sigma, 1:100) polyclonal amyloid-β (Cell Signaling Technology; 1:200); mAb 12E8 (1:500); mAb AT8 (1:100); polyclonal MARK phospho-T208 [prepared as described by Timm et al. (2008); 1:100]; phospho-p70S6Kinase (pT389, clone 108D2, Cell Signaling Technology; 1:50); polyclonal BRSK1 (Acris, 1:100); phospho-MAPK (Cell Signaling Technology; 1:50); polyclonal phospho-JNK1 + 2 (pT183+pY185, Abcam; 1:50); phospho-GSK3β (Cell Signaling Technology, 1:50); phospho-CDK5 (pS159, Eurogentec; 1:100); actin (Sigma, clone AC-40, 1:500). Fluorescently labeled secondary antibodies (Cy2, Cy3, Cy5) were from Dianova. Phalloidin labeled with rhodamine was used for actin staining (Cytoskeleton Inc., 1:100).
Fluorescence imaging.
Hippocampal neurons were observed with a 63× objective on a LSM510 Meta Confocal microscope (Zeiss) using lasers, beam splitters and filters according to the fluorophores. For calcium imaging, primary hippocampal neurons were labeled for 20 min with 2 μm Fluo-4 AM (Invitrogen) and 0.2% of F127 (Invitrogen) and transferred to a live imaging chamber. Cells were maintained at 37°C by air heating, supplied with 5% CO2 and observed with a Zeiss Axiovert 200M microscope equipped with a CoolSnap GQ CCD camera (Photometrics), a lambda shutter (Visitron Systems) and a 20× objective. Quantification of missorted dendrites was done using MetaMorph software scanslide application, scanning ∼50–150 fields with a 63× objective with highest resolution settings (Axiovert 200M) and counting the number of neurons displaying missorted Tau regions versus the total number of neurons. For spine quantification, 20- to 50-μm-long dendritic segments near the somata were either randomly chosen for control cells, or in the case of ADDL-treated cells, dendrites staining positively or negatively for Tau were selected and phalloidin-positive spines counted (MetaMorph or NIH ImageJ software). Mitochondrial density analysis was done by labeling cells with Mitotracker Deep Red (Invitrogen) for 30 min under growth conditions, and further processing for immunostaining as described above. Fluorescence intensities of missorted and non-missorted dendrites were measured and quantified using Zeiss LSM software. For calcium labeling in combination with immunostaining cells were labeled with 2 μm Rhod-2 AM and 0.2% F127 (Invitrogen) for 45 min under growth conditions. Dendritic compartments can easily be distinguished from axons in mature neurons by morphological characteristics such as length, width, branching, number etc. but also by immunostaining for dendritic markers such as MAP2 (antibodies AP20, chicken polyclonal anti MAP2) and tyrosinated tubulin (YL1/2), and by the presence of spines, all of which was used to identify dendrites in the current study.
Electron microscopy.
Primary hippocampal neurons were plated on polylysine-coated glass coverslips in 6 well plates at a density of 150.000 cells per well for 3–4 weeks and treated either with 5 μm ADDLs or vehicle. Cells were fixed in 2.5% glutaraldehyde for 1 h, washed with 0.15 m cacodylate, autofluorescence was quenched with 1 mg/ml borohydrate. Cells were then permeabilized by Triton X-100 for 30 min and processed for immunostaining with antibody K9JA to identify dendrites displaying missorted Tau by immunofluorescence. Neurons of interest were marked. Cells were then postfixed for 1 h with 1% osmium tetroxide and 1% uranyl acetate, dehydrated with increasing concentrations of ethanol, and embedded using an Epoxy Embedding Medium Kit (Fluka). After curing the resin, cells of interest were located by phase contrast microscopy, circled with a needle, sectioned at a thickness of 80 nm, mounted on formvar/carbon film copper slot grids (Science Services) and viewed with a Philips CM12 electron microscope. Quantification of microtubule spacing was done using NIH ImageJ software. For negative stain imaging of oligomers, the 100 μm ADDL solution was diluted to 5 μm in Neurobasal medium, and the solution was placed onto 600 mesh carbon-coated grids, stained with 2% uranyl acetate and viewed in the electron microscope.
Statistical analysis.
Error bars show means and SEM for multiple experiments or SD for multiple cells of a representative experiment as indicated. Statistical analysis was conducted using Student's t test or one-way ANOVA with post hoc Bonferroni for multiple comparisons with *p < 0.05, **p < 0.01, and ***p < 0.001 versus control treatments.
Results
Aβ oligomers, hippocampal neurons, and Tau reactions
Since abnormal changes in Aβ and Tau are two major hallmarks of AD we were interested in testing the link between the exposure of neurons to Aβ and the resulting changes in Tau protein. Such a link is implicit in the Aβ cascade hypothesis of AD and has been the subject of numerous studies whose outcomes have not always been consistent. This may be explained in part by the number of variables in the experimental systems, e.g., the nature of the effector (Aβ), the test object (different cell cultures), and the observed parameters (toxicity assays, signaling cascades, receptors etc). We chose to focus on Aβ oligomers as effectors, primary hippocampal neurons from E18 rats as test cells (differentiated for ∼20 DIV), and alterations in Tau protein as a readout.
Aβ preparations differ in terms of the protein species they contain (roughly distinguished as monomers, oligomers, and polymers or fibers), their structure (distinguished by spectroscopic methods or antibody reactivities), and other parameters (e.g., length of the peptide, amino acid modifications) (Glabe, 2008). Although most types of Aβ preparations have been reported to be toxic to some extent, the oligomers are currently receiving most attention because they are thought to be the most toxic species, and their diffusion in the brain could explain the spreading into different brain regions. We adopted the procedure of Klein and coworkers (Lambert et al., 1998; Klein et al., 2004) to generate “ADDLs” which contain a mixture of species enriched in oligomers. In this procedure, synthetic Aβ1–42 peptides were dissolved in 100% DMSO to 5 mm, then further diluted to 100 μm with culture medium (e.g., F12 or Nb), and applied to cells at concentrations around 0.1–5 μm.
The quality of the Aβ preparation was monitored by several methods (Fig. 1). On SDS gels they showed bands corresponding to monomers, low-n oligomers (∼15–20 kDa), and material at high molecular weight, which was strongly reduced when the protein was first denatured by heat and detergent treatment (Fig. 1a). On the SDS gels, the different media (F12 or Nb) yielded similar bands, with the caveat that these gels can obscure the coexistence of multiple oligomeric species (Glabe, 2008). Nevertheless, there were differences in structure because dot blots with antibody A11, which recognizes a more toxic generic amyloid conformation (Kayed et al., 2003), were more intense for F12 medium than for Nb (Fig. 1b), whereas the general Aβ antibody 6E10 (Pirttilä et al., 1994; Jung et al., 1999) reacted independently of the medium. Negative staining electron microscopy of the 100 μm ADDL solution revealed a mixture of globular protein aggregates (diameters in the range 5–20 nm) and some occasional fibers. Gentle centrifugation (10,000 × g, 10 min) removed the filaments completely but not the oligomers (data not shown). Dilution of the 100 μm stock solution in Nb to the applied concentration of 5 μm resulted in globular structures (Fig. 1c), comparable in size and morphology to previously published oligomeric forms of Aβ (Ono et al., 2009) (Fig. 1d). In either case, the globular particles represent high-n oligomers, superimposed on a background of low-n oligomers which are poorly resolved by EM. Comparison of protein concentrations confirmed that the filamentous and sedimentable material comprised only a minor fraction of the protein, leaving the majority in the low-n oligomeric or monomeric form (as judged by dynamic light scattering, data not shown). These data are compatible with those described for ADDLs previously. We note that, apart from its minor amount, the fiber component would be of lesser importance since its toxicity is lower than that of oligomers (Klein et al., 2004; Ono et al., 2009). We also note that in our preparations we did not consistently observe a band at 56 kDa, a species that has been reported to be toxic for transgenic mice (Lesné et al., 2006) but can be visualized in certain conditions (Walsh et al., 2005; Ashe, 2006; Bernstein et al., 2009).
Figure 1.

Oligomers of Aβ (ADDLs) dissolved in different cell culture media display various aggregated species. a, Depending on the gel conditions and the solvents used (DMSO and either F12 or Nb cell culture medium), ADDL preparations display Aβ monomers, different oligomers, and higher-molecular-weight aggregates. Denaturation was done by boiling the ADDL preparation in sample buffer (SB) containing SDS and β-mercaptoethanol (ME) for 10 min at 95°C. A total of 450 ng (100 pmol) were applied to 10–20% gradient gels. b, Immunoreactivity of Aβ oligomers with antibody A11 is stronger in F12 medium than in Nb medium. c, Negative stain electron microscopy of Aβ oligomer preparation of the same concentration used for cell experiments. ADDL stock solution (100 μm) was diluted to 5 μm in Nb medium. The prominent features are globular particles that are equivalent to higher n oligomers and aggregates thereof. d, Quantification of the relative distribution of oligomers depending on the diameter.
The next step was to test the toxicity of the ADDL preparation on primary hippocampal neurons. This can be done in a variety of ways, and there is a debate on which is most appropriate for assessing Aβ toxicity (Wogulis et al., 2005). We tested parameters such as LDH release, metabolic activity (intracellular ATP), Ca2+ influx, changes in protein levels and distribution, kinase activities, or synapse density. Figure 2a illustrates the ATP content after adding ADDLs in different media. There is a moderate decrease of ATP which is more apparent with F12 than with Nb medium, suggesting that F12, which was used in the original procedure (Lambert et al., 1998), could have some toxic effects on its own. This was confirmed in further tests, showing for example that F12 by itself decreased the spine density (Fig. 2b), and that F12 caused an influx of Ca2+ (Fig. 2c); both changes were absent when using Nb medium. The causes of the F12 effect are not known, but we note that this medium contains many additives including high concentrations of the neurotoxic amino acids glutamate (100 μm), glutamine (1 mm), and others that are active in signaling and excitotoxicity. We therefore decided to carry out the experiments with ADDLs only in Nb medium to avoid confounding cell culture medium artifacts caused by F12 medium.
Figure 2.

F12 vehicle is toxic to primary neurons. Primary hippocampal neurons were treated either with Ham's F12 (F12) or Nb cell culture medium supplemented with 2% DMSO. a, ATP content of neurons (a measure of cell viability) is reduced after 3 h treatment with ADDLs dissolved in 5% F12/0.1% DMSO, the vehicle commonly used to dissolve Aβ for ADDL preparations (e.g., (Lambert et al., 1998). Note that ATP is reduced for ADDLs dissolved in F12 medium, but not reduced for the case of ADDLs dissolved in Neurobasal/DMSO vehicle (5% Nb/0.1% DMSO). b, The number of spines is strongly reduced in F12/DMSO (5%/0.1%) after 24 h of treatment, compared with Nb/DMSO (5%/0.1%) or control neurons. c, Application of Nb/DMSO (1%/0.02%) (left arrow) causes no noticeable calcium influx into neurons. In contrast, F12/DMSO (1%/0.02%) (right arrow) results in a major and prolonged calcium influx, visualized fluorimetrically after labeling cells with Fluo-4/F127. The cells in insets represent low and high calcium states (left and right). Error bars: a, SEM from 3–5 experiments; b, SD from 10–20 dendrites c, SD from 10 neurons. Scale bar, 10 μm. *p < 0.05 and ***p < 0.001 versus control (one-way ANOVA with post hoc Bonferroni).
Aβ oligomers induce missorting of Tau
Having delineated the conditions under which the toxicity of Aβ oligomers can be observed, we applied them to monitor changes in Tau. In AD, the most conspicuous changes are the aggregation and hyperphosphorylation of Tau, however, the earliest visible changes include the loss of synapses and the missorting of endogenous Tau from mainly axonal to the somatodendritic compartment. We therefore asked which of these features could be reproduced in hippocampal neurons after exposure to Aβ oligomers. In young cell culture of primary neurons, Tau is initially localized in the cell body and neurites, while from day 4–7 onwards, during polarity development and elaboration of axons, it is sorted to the axon and disappears from the cell body and dendrites (Fig. 3a, top). MAP2 showed a complementary behavior and accumulated mainly in dendrites (Fig. 3a, middle). However, treatment of mature hippocampal neurons with Aβ oligomers (5 μm, 3 h) induced a clear redistribution of Tau into the somatodendritic compartment in a small fraction of cells where Tau is now colocalized with MAP2 (Fig. 3b; see Fig. 9c for quantification).
Figure 3.

Aβ oligomers induce missorting of Tau and neurofilaments into the somatodendritic compartment of primary hippocampal neurons. a, In vehicle-treated control cells (Nb/DMSO, 5%/0.1%), Tau is predominantly localized to the axonal compartment (top, Tau stained by antibody K9JA, green), while MAP2 is localized to the somatodendritic compartment (middle, MAP2 stained by antibody AP20, red). Merge, bottom. There is no colocalization of Tau and MAP2. b, In ADDL-treated cells (5 μm for 3 h) Tau is redistributed into soma and dendrites (top), where it colocalizes with MAP2 (middle; merged images shown in bottom). Arrows indicate colocalization of MAP2 and Tau. c, d, Same experiment as a, b, but green color represents neurofilament staining. Dendrites were identified by MAP2 antibody staining (red color). Cells: primary hippocampal neurons 22 DIV, treated either with vehicle or 5 μm ADDLs for 3 h. Scale bars, 20 μm.
Figure 9.
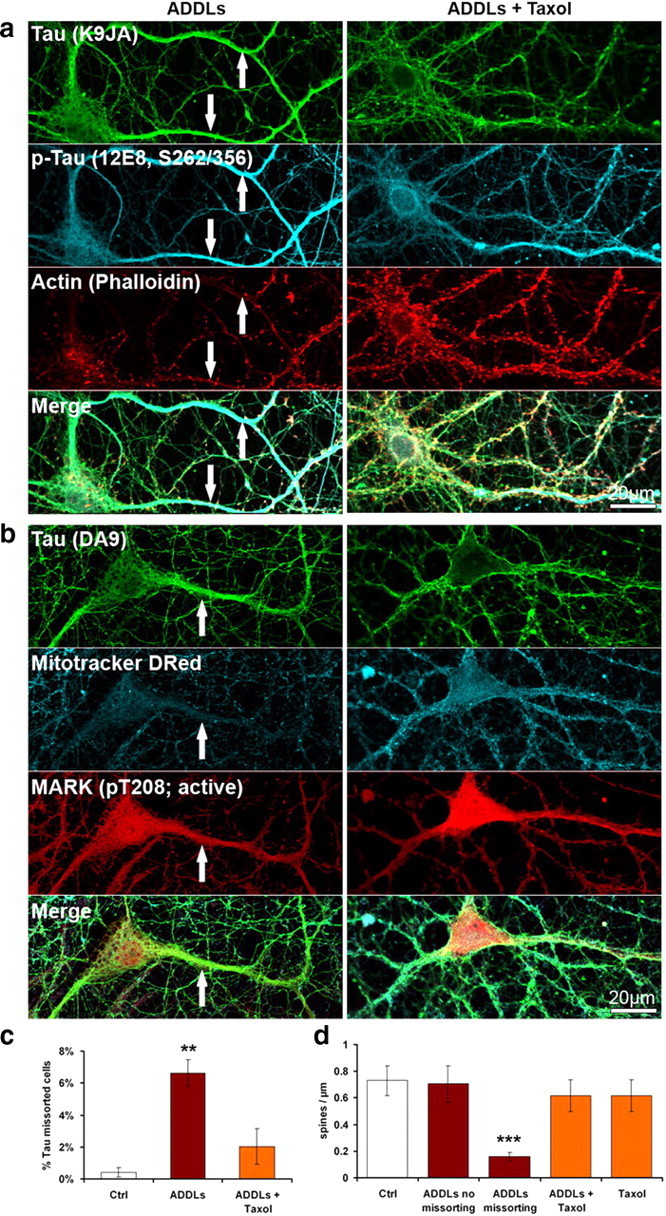
Taxol prevents ADDL-induced Tau missorting, loss of spines and loss of mitochondria. Primary hippocampal neurons 21DIV were treated with ADDLs (3 h, 5 μm) and 25 nm Taxol. a, Taxol prevents Tau missorting and spine loss, but not 12E8 staining in the dendrites of ADDL-treated neurons. b, Taxol prevents loss of mitochondria (stained with Mitotracker Deep Red). c, Quantification of fraction of missorted cells. Taxol reduces the number of cells displaying Tau missorting. Error bars, SEM from n = 3–4 experiments. **p < 0.01 versus control (one-way ANOVA with post hoc Bonferroni). d, Treatment of neurons with taxol does not affect the number of spines in these conditions. Error bars, SD from n = 10–20 cells per treatment condition. ***p < 0.001 versus control (one-way ANOVA with post hoc Bonferroni). Scale bars, 20 μm.
The increase of Tau in the affected dendrites is a local phenomenon because the overall levels of Tau remain unchanged (see below). We tested whether other cytoskeletal proteins showed a similar localized redistribution, notably neurofilaments which are normally sorted in the axons of mature neurons (Fig. 3c). Upon exposure to Aβ oligomers, there was a clear appearance of neurofilaments in the same dendrites that displayed Tau missorting (Fig. 3d; also see below). As with Tau, there was no global change in the level of neurofilament protein during the period of observation (up to 24 h, data not shown). Thus, we note that the two types of protein that are sorted axonally during neuronal differentiation (Tau and neurofilament protein) showed a concerted local elevation in dendrites, pointing to a malfunction of the sorting machinery.
Synapses disappear in regions of Tau missorting
What are the consequences of missorting of endogenous Tau into dendrites? Earlier experiments with overexpressed Tau had shown that dendritic Tau can cause traffic jams, resulting in transport inhibition of vesicles and organelles (e.g., mitochondria), loss of ATP supply, and decay of synaptic spines (Thies and Mandelkow, 2007). We therefore analyzed domains of dendrites containing missorted endogenous Tau and observed similar features: Whereas normal dendrites had a spine density of typically 0.7 per μm (Fig. 4a,c), they were reduced by >75% or disappeared completely along the Tau-containing dendrites, as judged by phalloidin-actin staining of spines (Fig. 4b,c). By contrast, the spine density was normal even in closely adjacent regions as long as they had no missorted Tau (Fig. 4d, arrowhead), arguing that the origin for the decay was intracellular and restricted to the domain affected by Tau (Fig. 4d, arrow).
Figure 4.
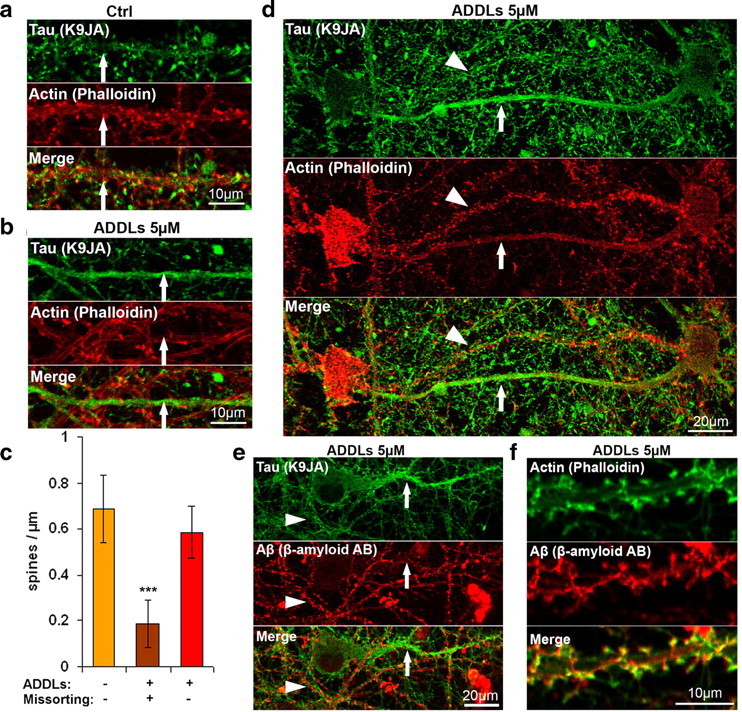
Redistribution of endogenous Tau into the somatodendritic compartment leads to reduced spine number. a, b, Primary hippocampal neurons (23 DIV) were treated with vehicle (Nb/DMSO, 5%/0.1%) (a), or with 5 μm ADDLs for 6 h (b) and stained for Tau by K9JA (green, top) and F-actin by phalloidin (red, middle). Merged images of a and b are shown in the bottom panel. In vehicle-treated cells (a), Tau is not present in dendrites, and the dendrites have a normal spine distribution (arrow). In ADDL-treated cells (b), Tau can be observed in dendrites, and in these cases the spine number is dramatically reduced (arrow). Dendrites were identified by morphometric characteristics and presence of spines. c, Quantification of spine density on dendrites. Left bar, Vehicle-treated cells that do not display Tau redistribution into the somatodendritic compartment. Middle bar, Aβ-treated cells demonstrating Tau-containing dendrites. Right bar, Aβ-treated cells showing normal spine density of dendrites without Tau in the same culture. Error bars, SD from n = 10–15 dendrites. ***p < 0.001 versus control (one-way ANOVA with post hoc Bonferroni). d, Example of two nearby dendrites after treatment with ADDLs (5 μm). The bottom shows Tau redistribution and loss of synapses (arrow), while the other is free of Tau and contains normal spines (arrowhead). e, Example of nearby dendrites after treatment with ADDLs (5 μm) and stained for Tau (top) and Aβ (bottom; merge at bottom). One dendrite (arrow) shows Tau redistribution and no staining for ADDLs, while others are free of Tau and are decorated with Aβ (arrowhead). f, Example of colocalization of Aβ and spines after 3 h of exposure to 5 μm ADDLs. Aβ oligomers localize to dendrites and particularly to spines, as indicated with phalloidin staining (top, green) and staining for Aβ (bottom, merge at bottom). Scale bars: a, b, f, 10 μm; d, e, 20 μm.
Several authors have reported that Aβ oligomers bind preferentially to synapses, notably to receptors in postsynaptic spines (Klein, 2006). We therefore investigated the distribution of Aβ oligomers along the cell processes by antibody labeling, confirmed their preferential targeting to dendrites and spines (Fig. 4f), but found a conspicuous absence of spines in the dendritic domains affected by Tau missorting (Fig. 4e, arrow), whereas dendrites without detectable Tau showed normal Aβ oligomer distribution (Fig. 4e, arrowhead). This is consistent with the disappearance of spines in these regions. The likely explanation is that synapses were originally present (since there were no bare regions in dendrites of control neurons), but gradually disappeared when Tau accumulated.
Tau is differentially phosphorylated in regions of Tau missorting
One of the major changes of Tau in AD is its hyperphosphorylation at multiple sites which can be detected by a range of phospho-specific antibodies. Normal Tau contains on average ∼2 Pi per molecule (distributed over several sites), but this rises up to ∼8 Pi in the case of Tau from AD brains, again distributed over >20 sites (Köpke et al., 1993). When probing the cells with phosphorylation-dependent antibodies we found increased reaction in dendritic regions of Tau missorting, such as the Ser/Thr-Pro motifs at residues pS202/pT205 (AT8 epitope) (Fig. 5c). The phosphorylation is particularly pronounced with antibody 12E8 that recognizes pS262/pS356 in the repeat domain of Tau (Fig. 5a). By contrast, the reaction with antibody PHF1 (pS396/pS404) is not enhanced and remains mainly axonal (Fig. 5b).
Figure 5.
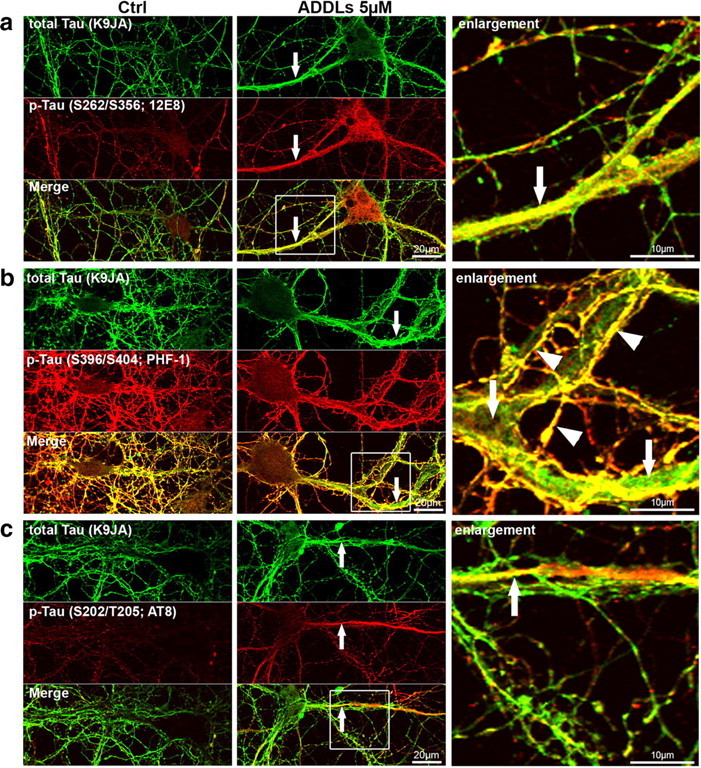
Aβ-induced Tau redistribution leads to local increase in Tau phosphorylation. Primary hippocampal neurons were treated for 3 h with vehicle (left, Nb/DMSO, 5%/0.1%) or 5 μm ADDLs (middle panels, magnification of merged images right panels). Cells were then stained with Tau phosphorylation-independent antibody (K9JA) or phosphorylation-dependent antibodies. Regions of missorted Tau (indicated by arrows) show elevated phosphorylation at some epitopes, e.g., 12E8 (a) or AT8 (c), while PHF-1 epitope is not present in dendrites containing Tau (b). Note that in b, colocalization of K9JA and PHF-1 epitope is only present in axons (overlay of axonal staining by K9JA (green) and PHF-1 (red); yellow color, indicated by arrowheads), while the dendrite, although filled with Tau (green color, indicated by arrows), does not contain the PHF-1 phosphorylation. Scale bars: left and middle, 20 μm; right, 10 μm.
To verify whether kinase activation might be a local phenomenon leading to phosphorylation of missorted Tau, we characterized kinase activities by activity-dependent antibodies. One can distinguish two major types of kinases affecting Tau, the proline-directed kinases (e.g., GSK3β, MAPK, JNK, cdk5) which phosphorylate the multiple SP or TP motifs on either side of the repeat domain and serve as diagnostic markers of AD-Tau (e.g., antibodies AT8, PHF1), and the kinases phosphorylating the KXGS motifs in the repeat domain of Tau (e.g., MARK, p70S6K, BRSK alias SADK). This type of phosphorylation causes the detachment of Tau from microtubules, makes them dynamic, and renders Tau highly diffusible and able to enter dendrites (Konzack et al., 2007). We tested MARK activity with an antibody against active MARK (pT208 in the regulatory loop) and found strong activation (Fig. 6a); the same was observed for p70S6K (Fig. 6b) with an antibody recognizing the activated kinase (pT389). The level of BRSK/SADK was also elevated in dendrites with Tau missorting (Fig. 6c); this kinase, like MARK, is involved in axonal differentiation (Kishi et al., 2005) and also belongs to the AMPK family of kinases. The results suggest that the type of phosphorylation that promotes the dissociation of Tau from microtubules (KXGS motifs in the repeats) and the corresponding kinases are locally enhanced in dendrites with Tau missorting.
Figure 6.

Aβ oligomer-induced Tau redistribution correlates with changes in kinase activities. Primary hippocampal neurons were treated for 3 h with vehicle (Ctrl; left, Nb/DMSO, 5%/0.1%) or 5 μm ADDLs (right). Cells were then stained for Tau with K9JA or DA9 to detect Tau redistribution and phosphorylation-dependent antibodies recognizing the regulating epitopes of kinases or in case of BRSK with an antibody recognizing total BRSK1. ADDL treatment had a differential effect on putative Tau kinases. Arrows indicate Tau missorting into dendrites, identifiable by morphometric characteristics such as width, length, and number. a, MARK activity is increased in ADDL-treated neurons with missorted Tau, as seen by antibody staining against active MARK (pT208). b, P70S6 kinase activity is increased in ADDL-treated neurons with missorted Tau, as seen by antibody staining against active P70S6 kinase (pT389). c, BRSK is elevated in dendrites containing missorted Tau, as seen by antibody staining against total BRSK1. d, MAPK activity is reduced in ADDL-treated neurons with missorted Tau, as seen by antibody staining against active ERK-1/2 (pT202+pY204). e, There is no difference in ADDL-induced missorted neurons and control neurons recognizable by antibody staining against active c-Jun N-terminal kinase (JNK1 + 2; pT183+pY185). f, Staining of inactive GSK3β (pS9) is unchanged in neurons displaying ADDL-induced missorting. g, cdk5 kinase activity is increased after ADDL treatment as judged by enhanced immunoreactivity with a phosphorylation-dependent antibody against active cdk5 (pS159). Scale bars, 20 μm.
With regard to proline-directed kinases we tested MAPK, JNK, cdk5, and GSK3b, all considered to be involved in the pathological phosphorylation of Tau (Johnson, 2006). Most of these kinases showed no sign of local elevation in dendrites with Tau missorting, i.e., MAPK activity was decreased, while GSK3b and JNK remained unchanged (Fig. 6d–f); the only exception was cdk5 which was activated (Fig. 6g). Thus cdk5 might be responsible for the phosphorylation of Tau at the AT8 epitope in dendrites.
Ca2+ elevation, breakdown of microtubules, and disappearance of mitochondria in missorted dendrites
Finally, we tested the distribution of the cytoskeleton in the missorted regions by correlative light and electron microscopy (Fig. 7). Regions of interest were selected by immunofluorescence of missorted Tau in dendrites, then cells were processed for thin section electron microscopy. Normal dendrites showed the typical distribution of microtubules (Fig. 7a right, 7d, arrows) but no neurofilaments, whereas regions with missorted Tau showed a dramatic reduction of microtubules by >75% (Fig. 7b right, 7e, arrows; quantified in Fig. 7c) and prominent neurofilaments (Fig. 7b right, 7e, arrowheads). This illustrates that the failure of proper axonal sorting affects not only Tau but other proteins as well. Given this localized loss of microtubules, we hypothesized that this might lead to an impairment of mitochondrial trafficking with local dendritic energy deprivation (Yan et al., 2010). Using Mitotracker staining, we found that in regions of Tau missorting, there is a clear decrease of mitochondria, while in control neurons and in dendrites without Tau, mitochondria were evenly distributed (Fig. 8a,b). The absence of mitochondria also correlates with the absence of spines.
Figure 7.
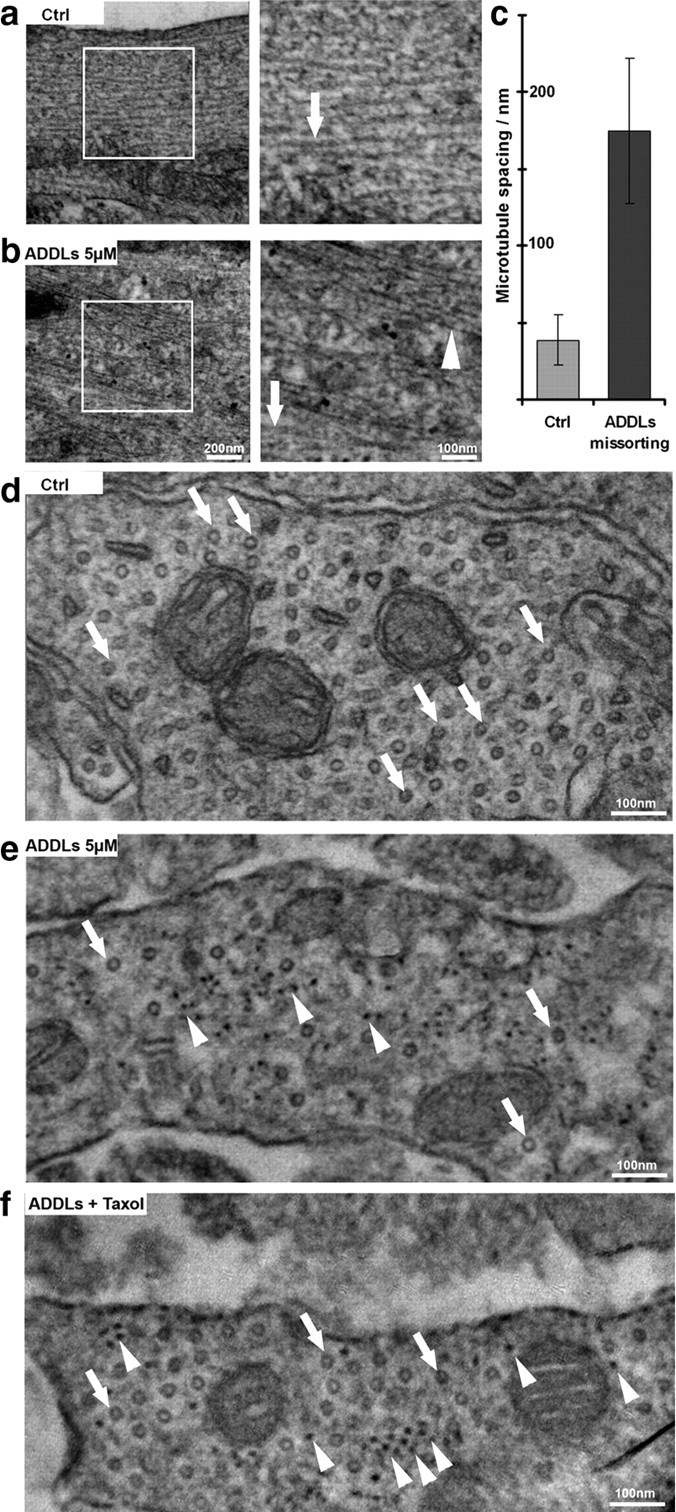
Aβ oligomers induce changes in the cytoskeleton organization. Thin section electron microscopy of dendritic regions of hippocampal neurons (21 DIV) without or with ADDL treatment (5 μm, 3 h). a, Normal cells showing widely spaced microtubules (∼2 diameters apart, arrow) and no neurofilaments. Boxed area on left is shown enlarged on right. b, After ADDL treatment, regions of missorted endogenous Tau (identified by light microscopy after labeling of Tau) contain bundles of neurofilaments (arrowhead) and reduced number of microtubules (arrow). c, Histogram of spacing without or with ADDLs. Error bars: SEM from 4 to 5 cells from 3 independent cultures. d, e, Cross sections of dendrites (d) and dendrites with missorting (e) reveal microtubules as circular shapes (arrows) and dot-like neurofilaments (arrowheads in e). Note the strong decrease in microtubule content in ADDL-induced Tau missorted hippocampal neurons, and the appearance of neurofilaments in e. f, Cross sectioned dendrites after cotreatment with ADDLs and taxol show rescue of microtubules (arrows) and the presence of neurofilaments (arrowheads). Scale bars: a, b left, 200 nm; a, b right; d–f, 100 nm.
Figure 8.
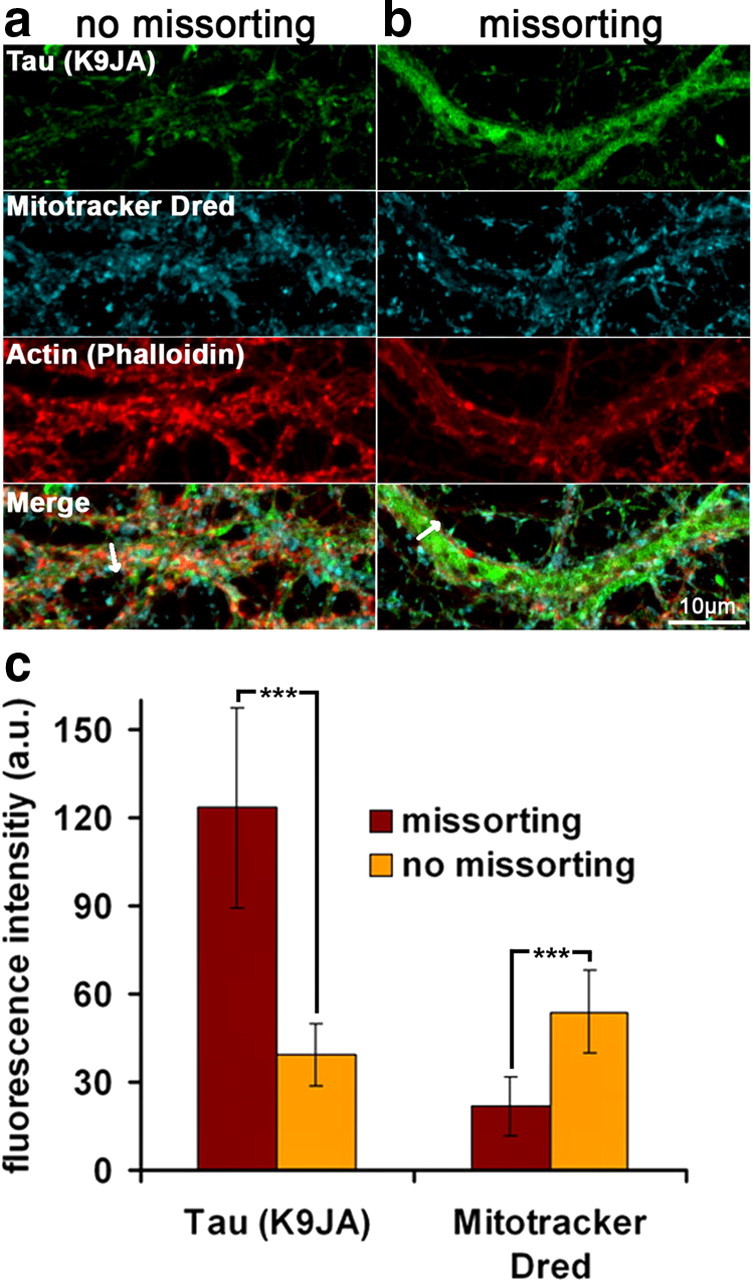
Aβ oligomer treatment results in decreased mitochondria number in Tau missorted dendrites. Primary hippocampal neurons were treated with ADDLs (3 h, 5 μm) and labeled with Mitotracker Deep Red, fixed, and stained with antibody K9JA and phalloidin to visualize Tau and F-actin. Dendrites were identified by presence of spines and morphometric characteristics. a, Dendrites of ADDL-treated neurons containing no Tau and with normal spine density show a homogeneous distribution of mitochondria throughout the dendrite, similar to control neurons. b, Dendrites with missorted Tau display a lack of spines and strongly reduced mitochondria numbers (middle). c, Quantification of the mitochondrial density over the whole width of the dendrite reveal a net decrease in labeling intensity in missorted dendrites. Fluorescence intensities of missorted and non-missorted dendrites of equal width (mean: 2.5 μm) were measured over the whole width of the dendrite (arrows in a, b). Averaging of several dendrites reveals a negative correlation of Tau and mitochondria fluorescence intensities. Error bars, SD from n = 5–10 cells. ***p < 0.001 using Student's t test.
Since cellular microtubules are known to be sensitive to increased Ca2+ levels (Schliwa et al., 1981) we checked whether microtubule disassembly was related to an elevation of Ca2+ in regions of Tau missorting, using the Ca2+ indicator Rhod2AM/F127. Figure 10 (see below) shows that this is indeed the case after ADDL treatment. This suggests a local rise of cytosolic Ca2+ from intra- or extracellular stores which could prompt microtubule disassembly. The rise in Ca2+ could also contribute to the inhibition of mitochondria transport because Ca2+ disengages the mitochondrial motor system from tracks (Wang and Schwarz, 2009).
Figure 10.

Aβ-oligomers induce elevation of intracellular calcium. Primary hippocampal neurons 21DIV were treated with ADDLs (3 h, 5 μm) or with the appropriate vehicle (Nb/DMSO 5%/0.1%). Calcium was visualized by labeling with the calcium indicator Rhod2AM/F-127. Note that calcium levels are increased in cells with Tau missorting (arrows). Missorting of Tau was identified by atypical presence of Tau in multiple processes of the same cell with dendritic morphometric characteristics. Scale bars, 20 μm.
Microtubules are important for the maintenance of dendrites, spines, and intracellular transport, and therefore we aimed at preventing the loss of microtubules by the stabilizer taxol. We found that low doses of taxol (25 nm), applied simultaneously with ADDLs, rescued microtubules (Fig. 7f), reduced the missorting of Tau, prevented the loss of spines and loss of mitochondria (Fig. 9a,b, quantified in 9c,d; Fig. 10). However, missorting of neurofilaments was still observed (Fig. 7f). The activities of kinases MARK, p70S6K, cdk5 were still upregulated, with concomitant phosphorylation of Tau at the 12E8 and AT8 epitopes, as in the case of ADDL exposure alone (see above). This suggests that one effect of ADDLs could be the local activation of MARK and other kinases, which then cause the detachment of Tau, microtubule breakdown, and rapid diffusion of Tau throughout the somatodendritic compartment, independent of a transport bias.
Tau missorting in response to stress-inducing treatments
Next we asked whether the local missorting of Tau is specific for Aβ oligomers, or whether it can be evoked by other treatments. We tested a number of cell stressors, applied in relatively mild conditions. Figure 11 illustrates the effects of oxidative stress (H2O2, 125 μm, 3 h), serum deprivation (3 h), and excitotoxicity (glutamate, 10 μm, 3 h). We also tested extracellular ATP (100 μm, 3 h), which functions as a stress signal and induces Ca2+ influx via P2 receptors and has been implicated in neurodegenerative disease (Burnstock, 2007). Missorting of Tau into dendrites is seen in all the above cases (Fig. 11a–f, quantification Fig. 11g). Spines disappear selectively from missorted regions after application of the stressors (supplemental Fig. S1, available at www.jneurosci.org as supplemental material). In the example of the stressor H2O2 (supplemental Fig. S2, available at www.jneurosci.org as supplemental material) neurofilaments become missorted along with Tau, the phosphorylation of Tau at the 12E8 sites (262/356) and at the AT8 site (202/205) increase in missorted dendritic regions, the activities of MARK, p70S6K, cdk5 increase, whereas the activities of MAPK decreases and GSK3β and JNK remain unchanged. Thus, missorting of Tau occurs as a response to diverse types of stress, and conversely, exposure to Aβ appears to be equivalent to stressing the cells.
Figure 11.
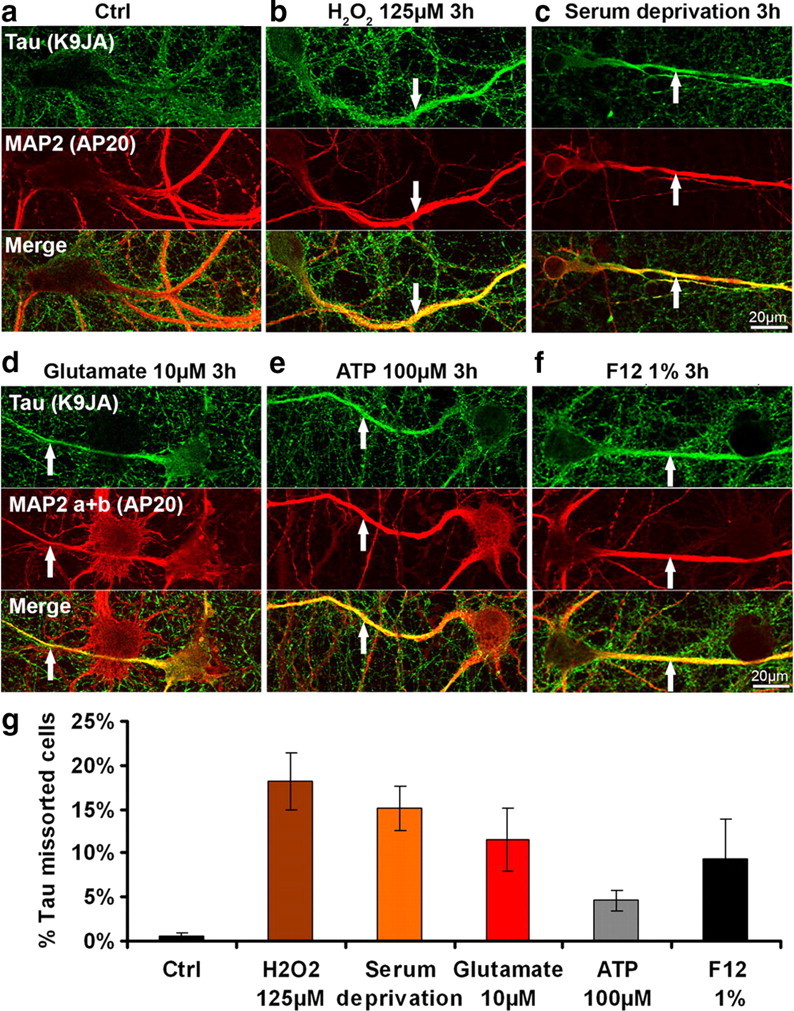
Tau missorting can be induced by several types of stressors. a, Control cells (primary hippocampal neurons aged 3–4 weeks). b–f, Treatment with H2O2, 125 μm, 3 h (b), serum deprivation, 3 h (c); glutamate, 10 μm, 3 h (d); ATP, 100 μm, 3 h (e); F12, 1%, 3 h (f). In addition to Aβ, a variety of stressors can trigger Tau redistribution, phosphorylation, and loss of dendritic spines. Top, Tau staining; middle, MAP2; bottom, merged images. MAP2 antibody staining was used to identify dendritic processes. Scale bars, 20 μm. g, Quantification of the percentage of missorted neurons with different stress inducing agents as depicted. Error bars, SEM from n = 3–4 experiments.
Global changes induced by Aβ oligomers
The local changes in Tau phosphorylation in missorted regions begs the question whether they correspond to global changes in proteins or activities. We checked global protein levels by Western blotting of cell extracts without or with ADDL treatment and found only minor changes (e.g., in Tau, tubulin, actin, neurofilament protein, GSK3β, MAPK, supplemental Fig. S3a, available at www.jneurosci.org as supplemental material). The same was true for the proteasome activity which did not decrease in our conditions (data not shown). On the other hand, there was a trend to slightly increased phosphorylation levels of global Tau, assayed by blotting with different phospho-dependent antibodies after extended exposure to Aβ oligomers (up to 24 h) (e.g., AT8, 12E8, pS214, PHF1, AT180, supplemental Fig. S3a, available at www.jneurosci.org as supplemental material). Since the total level of Tau did not change, this indicates that the increase in phosphorylation levels is indeed due to an increase in the activity of kinases versus phosphatases. We also tested the global changes of several kinases via antibodies against activity-dependent phosphorylation sites, but found no major effects by Western blotting (e.g., GSK3β, JNK, MAPK; supplemental Fig. S3a, available at www.jneurosci.org as supplemental material).
Discussion
Aβ and Tau are the two major aggregating proteins in AD. Toxic effects of Aβ are upstream of changes in Tau, but conversely Tau is considered necessary for the progression of neurodegeneration, as seen in cell and animal models (Rapoport et al., 2002; King et al., 2006; Roberson et al., 2007), and indeed the Tau pathology correlates well with clinical symptoms (Braak and Braak, 1991; Clavaguera et al., 2009). Therefore, the aim of this study was to characterize the earliest Tau-related changes in neurons following their exposure to Aβ. As experimental system we chose rat hippocampal neurons because the hippocampus is affected early in AD. Neurons were differentiated for ∼20 DIV (to generate stable synapses) and were not transfected with exogenous Tau so that they contained only endogenous adult Tau isoforms. Aβ oligomers (ADDLs) were prepared from Aβ1–42 (Lambert et al., 1998). This preparation contains a mixture of Aβ oligomers, plus some monomers and larger aggregates, but the toxicity resides in the oligomer fraction (Klein et al., 2004).
Summarizing the results, (1) the earliest visible effect of Aβ oligomers on Tau is the missorting in cell bodies and dendrites, in contrast to its normal axonal sorting (Fig. 3a). (2) In the missorted dendrites the spines disappear, as seen by loss of synaptic markers and loss of decoration by Aβ oligomers (Fig. 4f). (3) Tau in missorted dendrites shows a different phosphorylation pattern at Alzheimer diagnostic sites, e.g., an increase at KXGS motifs in the repeat domain (which negatively regulate Tau-microtubule interactions, 12E8 epitope, pS262/pS356), or at Ser-Pro motifs in the upstream flanking domain (AT8 site, pS202+pT205), but no increase at the PHF1 site (pS396+pS404) (Fig. 5). (4) There is a local increase in activities of kinases known to target Tau, e.g., MARK, p70S6K, BRSK/SADK (which target Tau's repeat domain), and cdk5 (a proline-directed kinase targeting the AT8 epitope), whereas other proline-directed kinases are decreased (MAPK) or unchanged (GSK3β, JNK) (Fig. 6a). (5) Missorted dendrites reveal an increase in cytosolic Ca2+ (Fig. 10), (6) a dramatic decrease in microtubules (Fig. 7b), (7) and an increase in neurofilaments which also become missorted from their normal axonal distribution (Fig. 3b). (8) Finally, the density of mitochondria decreases strongly (Fig. 8). (9) All of this occurs without changes in global levels of proteins (Tau, tubulin, actin, kinases) or global phosphorylation patterns of Tau, and no cytotoxicity is detectable in the neuronal culture as a whole (supplemental Fig. S3, available at www.jneurosci.org as supplemental material). Thus, early Tau-related changes represent a localized incipient deviation from the normal behavior of Tau and associated cytoskeletal elements. (10) Taxol suppresses the loss of microtubules, mitochondria, spines, and missorting of Tau, indicating that these features are linked via microtubule stability (Fig. 7f, Fig. 9). By contrast, the increase in Ca2+, kinase activities, and Tau phosphorylation cannot be prevented by taxol, showing that they are linked by a reaction cascade independent of microtubule integrity. (11) Other stress treatments (e.g., H2O2, glutamate, serum deprivation) lead to similar consequences for Tau and microtubules as Aβ oligomers.
One of the key features of Aβ-induced incipient neuronal degeneration is that Tau changes not only its molecular properties, but also its location. These two features are tightly linked, so that changes in phosphorylation are detected on missorted Tau, but not on normal axonal Tau. What reactions might be responsible for these events? The data suggest the following scenario: Although Aβ is present throughout the medium, the preferential interactions are at the synapses, particularly dendritic spines (Fig. 4e,f), and involving NMDA receptors and others (De Felice et al., 2007; Shankar et al., 2007). This triggers a Ca2+ influx, and indeed elevated Ca2+ occurs reproducibly together with missorted Tau (Fig. 10). Two consequences of Ca2+ influx are noteworthy: One is a change in the phosphorylation balance, mediated for example by Ca2+/CaM binding to the phosphatase calcineurin or to CaM kinases which signal to other kinases and thus may affect many proteins, including MAPs and motor proteins. This could explain the increase in activity of MARK, cdk5 and others; for example, CaMK-I activates MARK2 and this pathway contributes to neuronal differentiation (Biernat et al., 2002; Uboha et al., 2007; He et al., 2008; Wu et al., 2010). The second consequence is the destabilization of microtubules, again mediated by Ca2+/CaM which binds to MAPs, prevents their binding to microtubules and promotes their disassembly (Schliwa et al., 1981); this mechanism operates in addition to the Ca2+-CaM-dependent pathways of Tau phosphorylation and detachment from microtubules. The breakdown of microtubules can be prevented by taxol, but this does not prevent the elevation of Ca2+, kinase activities and Tau phosphorylation, arguing that Ca2+ dysregulation is upstream of microtubule loss.
Microtubule destabilization has several negative consequences for the traffic of mitochondria and other cargoes: Direct loss of MT removes tracks of intracellular transport. In addition a change in MT dynamics alters their posttranslational modifications and thus perturbs polarized trafficking of cargo (Li and Gundersen, 2008; Conde and Cáceres, 2009; Konishi and Setou, 2009). Thirdly, Ca2+ uncouples mitochondrial motors from microtubule tracks (Wang and Schwarz, 2009). All of these factors could contribute to the observed disappearance of mitochondria from missorted dendritic domains; but the ability to rescue by taxol argues that MT loss is the dominant event. As shown previously (Stamer et al., 2002; Hollenbeck and Saxton, 2005; Thies and Mandelkow, 2007), such mitochondrial traffic jams cause a local drop of energy (ATP) and consequently spine destruction through the perturbation of the actin network and loss of synaptic components (Whiteman et al., 2009). The perturbed polarization of the tracks would also explain the redirection of Tau and neurofilaments from axon-only to bidirectional, allowing them to enter dendrites. This mechanism would operate in addition to the rapid diffusion of phosphorylated Tau detached from microtubules (Konzack et al., 2007). An additional function of microtubules is to subtend cellular networks such as the ER and intermediate filament network, so that these networks collapse when microtubules or motors are inactivated or reversed in direction (Stamer et al., 2002; Eriksson et al., 2009).
Another feature of missorted dendritic domains is the altered balance in kinase/phosphatase activity and increased Tau phosphorylation. The local increase in kinases MARK/par-1, BRSK/SADK, and p70S6K can account for the phosphorylation of KXGS motifs in the repeat domains of Tau or MAP2, thus causing detachment and MT destabilization (Fig. 6). Since unbound Tau diffuses rapidly this provides a mechanism for Tau missorting (Konzack et al., 2007). Among proline-directed Tau kinases, we observed only an increase in cdk5 activity, but not in MAPK, JNK, or GSK3β (Fig. 6d–g). These kinases can phosphorylate Ser/Thr-Pro motifs characteristic of Alzheimer Tau; however, we observed locally only an increase at the AT8 epitope (pS202+pT205, target of cdk5), but not at the PHF-1 epitope (pS396+pS404, target of GSK3β) which remained mostly axonal. The change in kinase activities correlated with the increase in Ca2+, but was not reversible by taxol and therefore does not depend on microtubule stability. The local signaling cascade likely involves Ca2+-dependent phosphatases (calcineurin) and kinases (CaM kinases) within spines and dendritic shafts, which could in turn modify a network of other signaling components (Shankar and Walsh, 2009).
It is remarkable that most of the Aβ-induced changes are also observed by chemical stress such as glutamate, H2O2, serum deprivation, extracellular ATP, or F12 medium (containing glutamate). These treatments cause local Tau missorting, elevation of Ca2+, disappearance of spines, and even a similar change in Tau phosphorylation and kinases. Stress-induced changes in Tau have been studied by various authors, usually focusing on global changes of Tau phosphorylation. The results have not been uniform; increases in Tau phosphorylation have been observed in some cases, not in others (Davis et al., 1997; Lovell et al., 2004; Su et al., 2010). This is not surprising, considering the different experimental conditions. In our case, the similarity of the results with Aβ oligomers and other stressors points to a comparable chain of reactions, most likely converging on the point of increased Ca2+ (for example, glutamate elevates cytosolic Ca2+ through NMDA receptors, ATP through P2X receptors, and F12 medium contains glutamate).
Finally, reported effects were observed in young differentiated hippocampal cultures, 3 h after exposure to Aβ oligomers. This is far from the situation of decades-old neurons in AD, and yet there are intriguing parallels: Missorting of Tau in a subset of neurons, local loss of microtubules, mitochondria and spines, elevation of Ca2+, of kinase activities, and Tau phosphorylation. Thus many aspects are similar, except that Tau aggregates are absent from neuronal cultures (Whiteman et al., 2009). What conclusions can one draw for therapeutic approaches? First, Aβ evokes several abnormal responses of neurons: Apart from Tau missorting, the most prominent secondary changes are the increase in Ca2+ and microtubule breakdown. Lowering cytosolic Ca2+ would appear as prime target for intervention, but the decay of microtubules seems more targetable through microtubule-stabilizing drugs (Mattson, 1992; Michaelis et al., 2005; Zhang et al., 2005). By comparison, strategies to reduce the kinase/phosphatase disequilibrium or Tau aggregation seem less important in the experimental setting discussed here. How these principles apply to the real disease remains to be seen.
Footnotes
This work was supported by grants from the Deutsche Forschungsgemeinschaft, the Breuer Foundation, the European Union [FP7, MEMOSAD (Memory Loss in Alzheimer's Disease)], and Bundesministerium für Bildung und Forschung (Kompetenznetz Degenerative Demenzen). We thank Julia Lüdtke and Annika Bülow for excellent technical assistance.
References
- Ashe KH. In search of the molecular basis of memory loss in Alzheimer disease. Alzheimer Dis Assoc Disord. 2006;20:200–201. doi: 10.1097/01.wad.0000213847.66742.d9. [DOI] [PubMed] [Google Scholar]
- Ballatore C, Lee VM, Trojanowski JQ. Tau-mediated neurodegeneration in Alzheimer's disease and related disorders. Nat Rev Neurosci. 2007;8:663–672. doi: 10.1038/nrn2194. [DOI] [PubMed] [Google Scholar]
- Bernstein SL, Dupuis NF, Lazo ND, Wyttenbach T, Condron MM, Bitan G, Teplow DB, Shea JE, Ruotolo BT, Robinson CV, Bowers MT. Amyloid-Î2 protein oligomerization and the importance of tetramers and dodecamers in the aetiology of Alzheimer's disease. Nat Chem. 2009;1:326–331. doi: 10.1038/nchem.247. [DOI] [PMC free article] [PubMed] [Google Scholar]
- Bickar D, Reid PD. A high-affinity protein stain for Western blots, tissue prints, and electrophoretic gels. Anal Biochem. 1992;203:109–115. doi: 10.1016/0003-2697(92)90049-d. [DOI] [PubMed] [Google Scholar]
- Biernat J, Wu YZ, Timm T, Zheng-Fischhöfer Q, Mandelkow E, Meijer L, Mandelkow EM. Protein kinase MARK/PAR-1 is required for neurite outgrowth and establishment of neuronal polarity. Mol Biol Cell. 2002;13:4013–4028. doi: 10.1091/mbc.02-03-0046. [DOI] [PMC free article] [PubMed] [Google Scholar]
- Binder LI, Guillozet-Bongaarts AL, Garcia-Sierra F, Berry RW. Tau, tangles, and Alzheimer's disease. Biochim Biophys Acta. 2005;1739:216–223. doi: 10.1016/j.bbadis.2004.08.014. [DOI] [PubMed] [Google Scholar]
- Braak H, Braak E. Demonstration of amyloid deposits and neurofibrillary changes in whole brain sections. Brain Pathol. 1991;1:213–216. doi: 10.1111/j.1750-3639.1991.tb00661.x. [DOI] [PubMed] [Google Scholar]
- Burnstock G. Physiology and pathophysiology of purinergic neurotransmission. Physiol Rev. 2007;87:659–797. doi: 10.1152/physrev.00043.2006. [DOI] [PubMed] [Google Scholar]
- Busciglio J, Lorenzo A, Yeh J, Yankner BA. beta-amyloid fibrils induce tau phosphorylation and loss of microtubule binding. Neuron. 1995;14:879–888. doi: 10.1016/0896-6273(95)90232-5. [DOI] [PubMed] [Google Scholar]
- Clavaguera F, Bolmont T, Crowther RA, Abramowski D, Frank S, Probst A, Fraser G, Stalder AK, Beibel M, Staufenbiel M, Jucker M, Goedert M, Tolnay M. Transmission and spreading of tauopathy in transgenic mouse brain. Nat Cell Biol. 2009;11:909–913. doi: 10.1038/ncb1901. [DOI] [PMC free article] [PubMed] [Google Scholar]
- Conde C, Cáceres A. Microtubule assembly, organization and dynamics in axons and dendrites. Nat Rev Neurosci. 2009;10:319–332. doi: 10.1038/nrn2631. [DOI] [PubMed] [Google Scholar]
- Davis DR, Anderton BH, Brion JP, Reynolds CH, Hanger DP. Oxidative stress induces dephosphorylation of tau in rat brain primary neuronal cultures. J Neurochem. 1997;68:1590–1597. doi: 10.1046/j.1471-4159.1997.68041590.x. [DOI] [PubMed] [Google Scholar]
- De Felice FG, Velasco PT, Lambert MP, Viola K, Fernandez SJ, Ferreira ST, Klein WL. Abeta oligomers induce neuronal oxidative stress through an N-methyl-d-aspartate receptor-dependent mechanism that is blocked by the Alzheimer drug memantine. J Biol Chem. 2007;282:11590–11601. doi: 10.1074/jbc.M607483200. [DOI] [PubMed] [Google Scholar]
- Eriksson JE, Dechat T, Grin B, Helfand B, Mendez M, Pallari HM, Goldman RD. Introducing intermediate filaments: from discovery to disease. J Clin Invest. 2009;119:1763–1771. doi: 10.1172/JCI38339. [DOI] [PMC free article] [PubMed] [Google Scholar]
- Flood F, Murphy S, Cowburn RF, Lannfelt L, Walker B, Johnston JA. Proteasome-mediated effects on amyloid precursor protein processing at the gamma-secretase site. Biochem J. 2005;385:545–550. doi: 10.1042/BJ20041145. [DOI] [PMC free article] [PubMed] [Google Scholar]
- Glabe CG. Structural classification of toxic amyloid oligomers. J Biol Chem. 2008;283:29639–29643. doi: 10.1074/jbc.R800016200. [DOI] [PMC free article] [PubMed] [Google Scholar]
- Götz J, Ittner LM. Animal models of Alzheimer's disease and frontotemporal dementia. Nat Rev Neurosci. 2008;9:532–544. doi: 10.1038/nrn2420. [DOI] [PubMed] [Google Scholar]
- Haass C, Selkoe DJ. Soluble protein oligomers in neurodegeneration: lessons from the Alzheimer's amyloid beta-peptide. Nat Rev Mol Cell Biol. 2007;8:101–112. doi: 10.1038/nrm2101. [DOI] [PubMed] [Google Scholar]
- He L, Hou Z, Qi RZ. Calmodulin binding and Cdk5 phosphorylation of p35 regulate its effect on microtubules. J Biol Chem. 2008;283:13252–13260. doi: 10.1074/jbc.M706937200. [DOI] [PubMed] [Google Scholar]
- Hollenbeck PJ, Saxton WM. The axonal transport of mitochondria. J Cell Sci. 2005;118:5411–5419. doi: 10.1242/jcs.02745. [DOI] [PMC free article] [PubMed] [Google Scholar]
- Johnson GV. Tau phosphorylation and proteolysis: insights and perspectives. J Alzheimers Dis. 2006;9:243–250. doi: 10.3233/jad-2006-9s326. [DOI] [PubMed] [Google Scholar]
- Jung SS, Gauthier S, Cashman NR. Beta-amyloid precursor protein is detectable on monocytes and is increased in Alzheimer's disease. Neurobiol Aging. 1999;20:249–257. doi: 10.1016/s0197-4580(99)00051-2. [DOI] [PubMed] [Google Scholar]
- Kayed R, Head E, Thompson JL, McIntire TM, Milton SC, Cotman CW, Glabe CG. Common structure of soluble amyloid oligomers implies common mechanism of pathogenesis. Science. 2003;300:486–489. doi: 10.1126/science.1079469. [DOI] [PubMed] [Google Scholar]
- Kayed R, Head E, Sarsoza F, Saing T, Cotman CW, Necula M, Margol L, Wu J, Breydo L, Thompson JL, Rasool S, Gurlo T, Butler P, Glabe CG. Fibril specific, conformation dependent antibodies recognize a generic epitope common to amyloid fibrils and fibrillar oligomers that is absent in prefibrillar oligomers. Mol Neurodegener. 2007;2:18. doi: 10.1186/1750-1326-2-18. [DOI] [PMC free article] [PubMed] [Google Scholar]
- King ME, Kan HM, Baas PW, Erisir A, Glabe CG, Bloom GS. Tau-dependent microtubule disassembly initiated by prefibrillar beta-amyloid. J Cell Biol. 2006;175:541–546. doi: 10.1083/jcb.200605187. [DOI] [PMC free article] [PubMed] [Google Scholar]
- Kishi M, Pan YA, Crump JG, Sanes JR. Mammalian SAD kinases are required for neuronal polarization. Science. 2005;307:929–932. doi: 10.1126/science.1107403. [DOI] [PubMed] [Google Scholar]
- Klein WL. Synaptic targeting by Abeta oligomers (ADDLS) as a basis for memory loss in early Alzheimer's disease. Alzheimers Dement. 2006;2:43–55. doi: 10.1016/j.jalz.2005.11.003. [DOI] [PubMed] [Google Scholar]
- Klein WL, Stine WB, Jr, Teplow DB. Small assemblies of unmodified amyloid beta-protein are the proximate neurotoxin in Alzheimer's disease. Neurobiol Aging. 2004;25:569–580. doi: 10.1016/j.neurobiolaging.2004.02.010. [DOI] [PubMed] [Google Scholar]
- Konishi Y, Setou M. Tubulin tyrosination navigates the kinesin-1 motor domain to axons. Nat Neurosci. 2009;12:559–567. doi: 10.1038/nn.2314. [DOI] [PubMed] [Google Scholar]
- Konzack S, Thies E, Marx A, Mandelkow EM, Mandelkow E. Swimming against the tide: mobility of the microtubule-associated protein tau in neurons. J Neurosci. 2007;27:9916–9927. doi: 10.1523/JNEUROSCI.0927-07.2007. [DOI] [PMC free article] [PubMed] [Google Scholar]
- Köpke E, Tung YC, Shaikh S, Alonso AC, Iqbal K, Grundke-Iqbal I. Microtubule-associated protein tau. Abnormal phosphorylation of a non-paired helical filament pool in Alzheimer disease. J Biol Chem. 1993;268:24374–24384. [PubMed] [Google Scholar]
- Lambert MP, Barlow AK, Chromy BA, Edwards C, Freed R, Liosatos M, Morgan TE, Rozovsky I, Trommer B, Viola KL, Wals P, Zhang C, Finch CE, Krafft GA, Klein WL. Diffusible, nonfibrillar ligands derived from Abeta1–42 are potent central nervous system neurotoxins. Proc Natl Acad Sci U S A. 1998;95:6448–6453. doi: 10.1073/pnas.95.11.6448. [DOI] [PMC free article] [PubMed] [Google Scholar]
- Lesné S, Koh MT, Kotilinek L, Kayed R, Glabe CG, Yang A, Gallagher M, Ashe KH. A specific amyloid-beta protein assembly in the brain impairs memory. Nature. 2006;440:352–357. doi: 10.1038/nature04533. [DOI] [PubMed] [Google Scholar]
- Li R, Gundersen GG. Beyond polymer polarity: how the cytoskeleton builds a polarized cell. Nat Rev Mol Cell Biol. 2008;9:860–873. doi: 10.1038/nrm2522. [DOI] [PubMed] [Google Scholar]
- Lovell MA, Xiong S, Xie C, Davies P, Markesbery WR. Induction of hyperphosphorylated tau in primary rat cortical neuron cultures mediated by oxidative stress and glycogen synthase kinase-3. J Alzheimers Dis. 2004;6:659–671. doi: 10.3233/jad-2004-6610. [DOI] [PubMed] [Google Scholar]
- Mattson MP. Antigenic changes similar to those seen in neurofibrillary tangles are elicited by glutamate and Ca2+ influx in cultured hippocampal neurons. Neuron. 1990;4:105–117. doi: 10.1016/0896-6273(90)90447-n. [DOI] [PubMed] [Google Scholar]
- Mattson MP. Effects of microtubule stabilization and destabilization on tau immunoreactivity in cultured hippocampal neurons. Brain Res. 1992;582:107–118. doi: 10.1016/0006-8993(92)90323-2. [DOI] [PubMed] [Google Scholar]
- Mattson MP. Calcium and neurodegeneration. Aging Cell. 2007;6:337–350. doi: 10.1111/j.1474-9726.2007.00275.x. [DOI] [PubMed] [Google Scholar]
- Michaelis ML, Ansar S, Chen Y, Reiff ER, Seyb KI, Himes RH, Audus KL, Georg GI. {beta}-Amyloid-induced neurodegeneration and protection by structurally diverse microtubule-stabilizing agents. J Pharmacol Exp Ther. 2005;312:659–668. doi: 10.1124/jpet.104.074450. [DOI] [PubMed] [Google Scholar]
- Ono K, Condron MM, Teplow DB. Structure-neurotoxicity relationships of amyloid beta-protein oligomers. Proc Natl Acad Sci U S A. 2009;106:14745–14750. doi: 10.1073/pnas.0905127106. [DOI] [PMC free article] [PubMed] [Google Scholar]
- Park SY, Ferreira A. The generation of a 17 kDa neurotoxic fragment: an alternative mechanism by which tau mediates beta-amyloid-induced neurodegeneration. J Neurosci. 2005;25:5365–5375. doi: 10.1523/JNEUROSCI.1125-05.2005. [DOI] [PMC free article] [PubMed] [Google Scholar]
- Pirttilä T, Kim KS, Mehta PD, Frey H, Wisniewski HM. Soluble amyloid beta-protein in the cerebrospinal fluid from patients with Alzheimer's disease, vascular dementia and controls. J Neurol Sci. 1994;127:90–95. doi: 10.1016/0022-510x(94)90140-6. [DOI] [PubMed] [Google Scholar]
- Rapoport M, Dawson HN, Binder LI, Vitek MP, Ferreira A. Tau is essential to beta-amyloid-induced neurotoxicity. Proc Natl Acad Sci U S A. 2002;99:6364–6369. doi: 10.1073/pnas.092136199. [DOI] [PMC free article] [PubMed] [Google Scholar]
- Roberson ED, Scearce-Levie K, Palop JJ, Yan F, Cheng IH, Wu T, Gerstein H, Yu GQ, Mucke L. Reducing endogenous tau ameliorates amyloid beta-induced deficits in an Alzheimer's disease mouse model. Science. 2007;316:750–754. doi: 10.1126/science.1141736. [DOI] [PubMed] [Google Scholar]
- Roychaudhuri R, Yang M, Hoshi MM, Teplow DB. Amyloid beta-protein assembly and Alzheimer disease. J Biol Chem. 2009;284:4749–4753. doi: 10.1074/jbc.R800036200. [DOI] [PMC free article] [PubMed] [Google Scholar]
- Schliwa M, Euteneuer U, Bulinski JC, Izant JG. Calcium lability of cytoplasmic microtubules and its modulation by microtubule-associated proteins. Proc Natl Acad Sci U S A. 1981;78:1037–1041. doi: 10.1073/pnas.78.2.1037. [DOI] [PMC free article] [PubMed] [Google Scholar]
- Selkoe DJ. Alzheimer disease: mechanistic understanding predicts novel therapies. Ann Intern Med. 2004;140:627–638. doi: 10.7326/0003-4819-140-8-200404200-00047. [DOI] [PubMed] [Google Scholar]
- Shankar GM, Walsh DM. Alzheimer's disease: synaptic dysfunction and Abeta. Mol Neurodegener. 2009;4:48. doi: 10.1186/1750-1326-4-48. [DOI] [PMC free article] [PubMed] [Google Scholar]
- Shankar GM, Bloodgood BL, Townsend M, Walsh DM, Selkoe DJ, Sabatini BL. Natural oligomers of the Alzheimer amyloid-beta protein induce reversible synapse loss by modulating an NMDA-type glutamate receptor-dependent signaling pathway. J Neurosci. 2007;27:2866–2875. doi: 10.1523/JNEUROSCI.4970-06.2007. [DOI] [PMC free article] [PubMed] [Google Scholar]
- Small SA, Duff K. Linking Abeta and tau in late-onset Alzheimer's disease: a dual pathway hypothesis. Neuron. 2008;60:534–542. doi: 10.1016/j.neuron.2008.11.007. [DOI] [PMC free article] [PubMed] [Google Scholar]
- Spires-Jones TL, Stoothoff WH, de Calignon A, Jones PB, Hyman BT. Tau pathophysiology in neurodegeneration: a tangled issue. Trends Neurosci. 2009;32:150–159. doi: 10.1016/j.tins.2008.11.007. [DOI] [PubMed] [Google Scholar]
- Stamer K, Vogel R, Thies E, Mandelkow E, Mandelkow EM. Tau blocks traffic of organelles, neurofilaments, and APP vesicles in neurons and enhances oxidative stress. J Cell Biol. 2002;156:1051–1063. doi: 10.1083/jcb.200108057. [DOI] [PMC free article] [PubMed] [Google Scholar]
- Su B, Wang X, Lee HG, Tabaton M, Perry G, Smith MA, Zhu X. Chronic oxidative stress causes increased tau phosphorylation in M17 neuroblastoma cells. Neurosci Lett. 2010;468:267–271. doi: 10.1016/j.neulet.2009.11.010. [DOI] [PubMed] [Google Scholar]
- Thies E, Mandelkow EM. Missorting of tau in neurons causes degeneration of synapses that can be rescued by the kinase MARK2/Par-1. J Neurosci. 2007;27:2896–2907. doi: 10.1523/JNEUROSCI.4674-06.2007. [DOI] [PMC free article] [PubMed] [Google Scholar]
- Timm T, Balusamy K, Li X, Biernat J, Mandelkow E, Mandelkow EM. Glycogen synthase kinase (GSK) 3beta directly phosphorylates Serine 212 in the regulatory loop and inhibits microtubule affinity-regulating kinase (MARK) 2. J Biol Chem. 2008;283:18873–18882. doi: 10.1074/jbc.M706596200. [DOI] [PubMed] [Google Scholar]
- Uboha NV, Flajolet M, Nairn AC, Picciotto MR. A calcium- and calmodulin-dependent kinase Ialpha/microtubule affinity regulating kinase 2 signaling cascade mediates calcium-dependent neurite outgrowth. J Neurosci. 2007;27:4413–4423. doi: 10.1523/JNEUROSCI.0725-07.2007. [DOI] [PMC free article] [PubMed] [Google Scholar]
- Walsh DM, Klyubin I, Shankar GM, Townsend M, Fadeeva JV, Betts V, Podlisny MB, Cleary JP, Ashe KH, Rowan MJ, Selkoe DJ. The role of cell-derived oligomers of Abeta in Alzheimer's disease and avenues for therapeutic intervention. Biochem Soc Trans. 2005;33:1087–1090. doi: 10.1042/BST20051087. [DOI] [PubMed] [Google Scholar]
- Wang X, Schwarz TL. The mechanism of Ca2+-dependent regulation of kinesin-mediated mitochondrial motility. Cell. 2009;136:163–174. doi: 10.1016/j.cell.2008.11.046. [DOI] [PMC free article] [PubMed] [Google Scholar]
- Whiteman IT, Gervasio OL, Cullen KM, Guillemin GJ, Jeong EV, Witting PK, Antao ST, Minamide LS, Bamburg JR, Goldsbury C. Activated actin-depolymerizing factor/cofilin sequesters phosphorylated microtubule-associated protein during the assembly of alzheimer-like neuritic cytoskeletal striations. J Neurosci. 2009;29:12994–13005. doi: 10.1523/JNEUROSCI.3531-09.2009. [DOI] [PMC free article] [PubMed] [Google Scholar]
- Wogulis M, Wright S, Cunningham D, Chilcote T, Powell K, Rydel RE. Nucleation-dependent polymerization is an essential component of amyloid-mediated neuronal cell death. J Neurosci. 2005;25:1071–1080. doi: 10.1523/JNEUROSCI.2381-04.2005. [DOI] [PMC free article] [PubMed] [Google Scholar]
- Wu HY, Hudry E, Hashimoto T, Kuchibhotla K, Rozkalne A, Fan Z, Spires-Jones T, Xie H, Arbel-Ornath M, Grosskreutz CL, Bacskai BJ, Hyman BT. Amyloid beta induces the morphological neurodegenerative triad of spine loss, dendritic simplification, and neuritic dystrophies through calcineurin activation. J Neurosci. 2010;30:2636–2649. doi: 10.1523/JNEUROSCI.4456-09.2010. [DOI] [PMC free article] [PubMed] [Google Scholar]
- Yan T, Feng Y, Zhai Q. Axon degeneration: Mechanisms and implications of a distinct program from cell death. Neurochem Int. 2010;56:529–534. doi: 10.1016/j.neuint.2010.01.013. [DOI] [PubMed] [Google Scholar]
- Yankner BA, Dawes LR, Fisher S, Villa-Komaroff L, Oster-Granite ML, Neve RL. Neurotoxicity of a fragment of the amyloid precursor associated with Alzheimer's disease. Science. 1989;245:417–420. doi: 10.1126/science.2474201. [DOI] [PubMed] [Google Scholar]
- Zhang B, Maiti A, Shively S, Lakhani F, McDonald-Jones G, Bruce J, Lee EB, Xie SX, Joyce S, Li C, Toleikis PM, Lee VM, Trojanowski JQ. Microtubule-binding drugs offset tau sequestration by stabilizing microtubules and reversing fast axonal transport deficits in a tauopathy model. Proc Natl Acad Sci U S A. 2005;102:227–231. doi: 10.1073/pnas.0406361102. [DOI] [PMC free article] [PubMed] [Google Scholar]