

Abstract
mRNA transport and local translation in dendrites play key roles in use-dependent synaptic modification and in higher-order brain functions. RNG105, an RNA-binding protein, has previously been identified as a component of RNA granules that mediate dendritic mRNA localization and local translation. Here, we demonstrate that RNG105 knock-out in mice reduces the dendritic localization of mRNAs for Na+/K+ ATPase (NKA) subunit isoforms (i.e., α3, FXYD1, FXYD6, and FXYD7). The loss of dendritic mRNA localization is accompanied by the loss of function of NKA in dendrites without affecting the NKA function in the soma. Furthermore, we show that RNG105 deficiency affects the formation and maintenance of synapses and neuronal networks. These phenotypes are partly explained by an inhibition of NKA, which is known to influence synaptic functions as well as susceptibility to neurotoxicity. The present study first demonstrates the in vivo role of RNG105 in the dendritic localization of mRNAs and uncovers a novel link between dendritic mRNA localization and the development and maintenance of functional networks.
Introduction
Transport of mRNAs and local control of translation in neuronal dendrites are important cellular mechanisms of long-lasting synaptic plasticity and memory (Martin et al., 2000; Sutton and Schuman, 2006; Bramham and Wells, 2007), and the loss of these control mechanisms is implicated in neuronal disorders (Bassell and Kelic, 2004; Wang et al., 2007). Several mechanisms control local translation, using eIF4E-binding proteins, eEF2, the fragile X mental retardation protein (FMRP), and micro-RNAs (Jin et al., 2004; Kelleher et al., 2004; Klann and Dever, 2004; Kindler et al., 2005). In addition, RNA granules play central roles in the transport of mRNAs to dendrites and also in the control of local translation in a synaptic stimulation-dependent manner (Krichevsky and Kosik, 2001; Kiebler and Bassell, 2006; Sossin and DesGroseillers, 2006). These granules are densely packed structures and translationally dormant, but they become less compact during conversion into translating polysomes after synaptic stimulation (Krichevsky and Kosik, 2001; Shiina et al., 2005).
RNA granules consist of ribosomes, mRNA, translation factors, and RNA-binding proteins (Krichevsky and Kosik, 2001; Kanai et al., 2004; Elvira et al., 2006) including RNG105 (Shiina et al., 2005). RNG105 dissociates from RNA granules after synaptic stimulation, which is accompanied by the induction of mRNA reporter translation near the granules, suggesting its involvement in local translation (Shiina et al., 2005). RNG105 is most abundantly expressed in the brain, but is also expressed in actively proliferating cells, so it is also known as cytoplasmic activation/proliferation-associated protein-1 (Caprin-1) (Grill et al., 2004). RNG105 represses translation in vitro or when overexpressed in cells, but removal of RNG105 does not increase the translation rates (Shiina et al., 2005; Solomon et al., 2007). To understand the precise role of RNG105, it is required to analyze in vivo functions of RNG105.
Na+/K+ ATPase (NKA) is a membrane-bound Na+/K+ pump that maintains uneven distribution of Na+ and K+ across the cell membrane. Three isoforms of the catalytic α subunit, α1–3 (McGrail et al., 1991), and among seven isoforms (FXYD1–7) of the γ subunit that modulate NKA activity, FXYD1, 6, and 7, are highly expressed in the brain (Geering, 2006), whereas other members of FXYD proteins are expressed in other tissues in a tissue-specific way. Some of the brain-expressed NKA subunits are implicated in neuronal disorders (De Fusco et al., 2003; de Carvalho Aguiar et al., 2004; Deng et al., 2007), which are attributable to the role of NKA [e.g., its role in the propagation of action potentials, defensive roles against excitotoxicity that induces elevation of intracellular concentrations of Na+ and Ca2+ ions (Brines and Robbins, 1992; Mark et al., 1995; Kiedrowski et al., 2004), and its roles in postsynaptic functions (Reich et al., 2004; Zhang et al., 2009)].
In the present study, a range of RNG105-bound mRNAs including NKA α3 and FXYD1 and 7 was identified using microarray analysis. RNG105-deficient mice demonstrated that dendritic localization of the mRNAs was reduced, and also that networks of cultured neurons as well as synapse formation in the network were impaired, which are reminiscent of the inhibition of NKA. These results suggest an essential role of RNG105 in the dendritic localization of mRNAs, particularly the NKA subunit isoform mRNAs, to maintain dendritic properties for the development and maintenance of functional networks.
Materials and Methods
Microarray analysis.
RNG105-bound RNA was immunoprecipitated using the polyclonal anti-RNG105 antibody (Shiina et al., 2005) from extracts of mouse cerebral cortex as described previously (Shiina et al., 2005). Control RNA was immunoprecipitated using a purified rabbit IgG (Jackson ImmunoResearch). RNG105-bound RNA (∼400 ng) and control RNA (∼200 ng) were subjected to reverse transcription, amplification, labeling, and microarray analyses using whole mouse genome oligo DNA, which was done in cooperation with Agilent Technologies and KURABO Industries using microarray devices from Agilent Technologies and Affymetrix, respectively. Genes whose ratios of RNG105-bound/control RNA were >1.8 in both analyses were picked up, and the means between the two analyses were calculated.
Gene ontology analysis was performed using the functional annotation tool at the DAVID website (http://niaid.abcc.ncifcrf.gov/home.jsp) (Huang et al., 2009).
Generation of RNG105 knock-out mice.
The gene-targeting construct was generated from an Rng105 gene cloned from a 129Sv genomic library. The targeting vector contained a neomycin resistance gene flanked by two Rng105 genomic fragments: a 7.7 kb AvrII–NotI and a 1.2 kb fragment amplified by PCR using primers 1 and 2 (supplemental Table 3, available at www.jneurosci.org as supplemental material), which produced MluI restriction sites at both ends of the fragment. The targeted allele contained a deletion of the Rng105 exon 1 (see Fig. 1).
Figure 1.

Generation of RNG105-deficient mice. A, Gene structure of the Rng105 locus (R, Rng105 exon 1 including the start codon), targeting construct and after homologous recombination. PCR products for genotyping (arrows) are indicated. H, HindIII; A, AvrII; B, BamHI; M, MluI; N, NotI. B, PCR genotyping and Western blotting of one E17.5 litter. Cerebral cortex extracts (30 μg) were loaded in each lane and probed with an anti-RNG105 antibody. C, Littermates at E17.5. The weight (mean ± SEM) of the litter was as follows: Rng105+/+, 1.09 ± 0.03 g (n = 5); Rng105+/−, 1.09 ± 0.05 g (n = 3); and Rng105−/−, 0.85 ± 0.05 g (n = 2).
IT2 embryonic stem cells were transfected with the targeting vector and selected for G418 resistance. Surviving colonies were analyzed by Southern blotting and PCR to identify homologous recombinants. Two correctly targeted embryonic stem cell clones were microinjected into C57BL/6J host blastocysts to generate chimeric mice, which were bred with C57BL/6J mice to obtain heterozygous offspring. Heterozygotes derived from both clones had transmitted the disrupted Rng105 gene locus. Homozygous knock-out fetuses were obtained by mating heterozygotes. Both lines of knock-out fetuses from the two clones showed the same phenotype. Genotyping was performed using primers 3 and 4 (supplemental Table 3, available at www.jneurosci.org as supplemental material), which amplified a 578 bp product from the wild-type allele, and primers 5 and 6 (supplemental Table 3, available at www.jneurosci.org as supplemental material), which amplified an 837 bp product from the recombined allele (see Fig. 1).
Neuronal culture.
Dissociated cerebral cortical neurons obtained from individual littermates were plated at a density of 1.6 × 10⁵ cells/cm2 onto poly-l-lysine-coated coverslips or glass-bottom culture dishes (MatTek) in Neurobasal medium (Invitrogen) containing B27 supplement (Invitrogen). In Figures 3–5 and 6, A and B, neurons were cultured at low cell density to separate neurites from each other. For transfection experiments, cortical neurons from embryonic day 15.5 (E15.5) mice were cultured in MEM (Sigma-Aldrich) containing N2 supplement (Invitrogen) and 2% fetal bovine serum. The neurons were transfected with vectors at 7–9 d in vitro (DIV) using the conventional calcium-phosphate precipitation method. Alternatively, in Figure 6C and supplemental Figure 5C (available at www.jneurosci.org as supplemental material), transfection was performed using a Nucleofector II system (Lonza Walkersville) before the neurons were plated.
Figure 3.

RNA granule proteins except G3BP are localized normally to dendrites of Rng105−/− neurons. A, Immunostaining for staufen 1 and RPS6 in cultured neurons (10 DIV) from wild-type and Rng105−/− E17.5 cortexes. The insets show magnified images of the boxed areas. B, Immunostaining for G3BP in cultured neurons (10 DIV) from wild-type and Rng105−/− E17.5 cortexes. The arrowheads denote a dendrite emanating from the soma located on the left side in each panel. Scale bars, 10 μm. C, Distribution patterns of staufen 1, RPS6, CPEB1, FMRP, Pur α, and G3BP in dendrites of wild-type and Rng105−/− neurons. Mean fluorescence intensity in the dendrite is normalized to that in the soma. n = 5; *p < 0.05, t test at each distance from the soma. Error bars are SEM.
Figure 4.
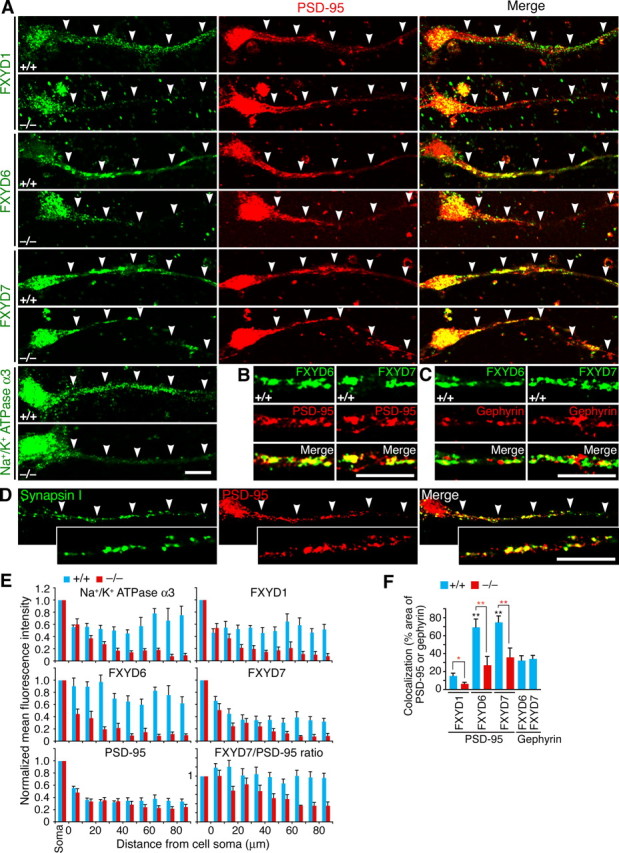
Dendritic localization of NKA subunit isoforms is decreased in Rng105−/− neurons. A, Immunostaining for NKA isoforms and PSD-95 in cultured neurons (10 DIV) from E17.5 wild-type and Rng105−/− cortexes. A cell soma is located on the left side in each panel. The arrowheads denote a dendrite that emanates from the cell soma. B, C, Magnified images of dendritic areas in wild-type cultured neurons. FXYD6 and FXYD7 show significant colocalization with PSD-95 (B) but little colocalization with gephyrin (C). D, Immunostaining for synapsin I and PSD-95 in cultured neurons (10 DIV) from E17.5 wild-type cortex. The insets show magnified images of a dendritic area. PSD-95 shows significant colocalization with synapsin I. In A–D, neurons were cultured at low density to separate neurites from each other. Scale bars, 10 μm. E, Distribution patterns of NKA isoforms and PSD-95 in the dendrites of wild-type and Rng105−/− neurons in A. Mean fluorescence intensity in the dendrite is normalized to that in the soma. The bottom right panel shows the ratio of FXYD7/PSD-95 mean fluorescence intensity. F, Quantification of colocalization of FXYD proteins with PSD-95 or gephyrin in dendrites in A–C. Shown are percentages of PSD-95 or gephyrin cluster areas that overlap with the FXYD proteins. n = 10 neurons. Black asterisks, Tukey–Kramer test among wild-type neurons; red asterisks, t test between wild-type and Rng105−/− neurons. *p < 0.05, **p < 0.01. Error bars are SEM.
Figure 5.

K+-induced Na+ efflux is decreased in Rng105−/− neuronal dendrites and by RNAi of NKA subunit isoforms. A, Fluorescence images of Sodium Green in cultured neurons (10 DIV) from wild-type and Rng105−/− E17.5 cortexes. Neurons were cultured at low density to separate neurites from each other. Scale bar, 10 μm. B, Time courses of Sodium Green fluorescence intensity in the cell soma and dendrites (>30 μm from the cell soma) of wild-type and Rng105−/− neurons during time-lapse experiments. KCl (50 mm) was added at time 0. The same experiments were also performed in the continuous presence of 50 μm ouabain. Mean fluorescence intensity is normalized to that at t = −25 s (F0). Shown are the mean ± SEM (top panels) and the mean (bottom panels). C, Mean duration of K+-induced Na+ efflux in the cell soma and dendrites of wild-type and Rng105−/− neurons (left panels). The same experiments were performed on neurons cotransfected with a red fluorescent protein (DsRed2) reporter and siRNA for the indicated NKA subunit isoforms (middle panels). The right panels show rescue experiments: gray bars, only siRNAs were introduced; white bars, both siRNAs and target genes that were mutated at the siRNA target sequences were introduced. n = 4 independent experiments per group. *p < 0.05, **p < 0.01, significant difference compared with +/+ or control siRNA, Tukey-Kramer test. Error bars are SEM.
Figure 6.
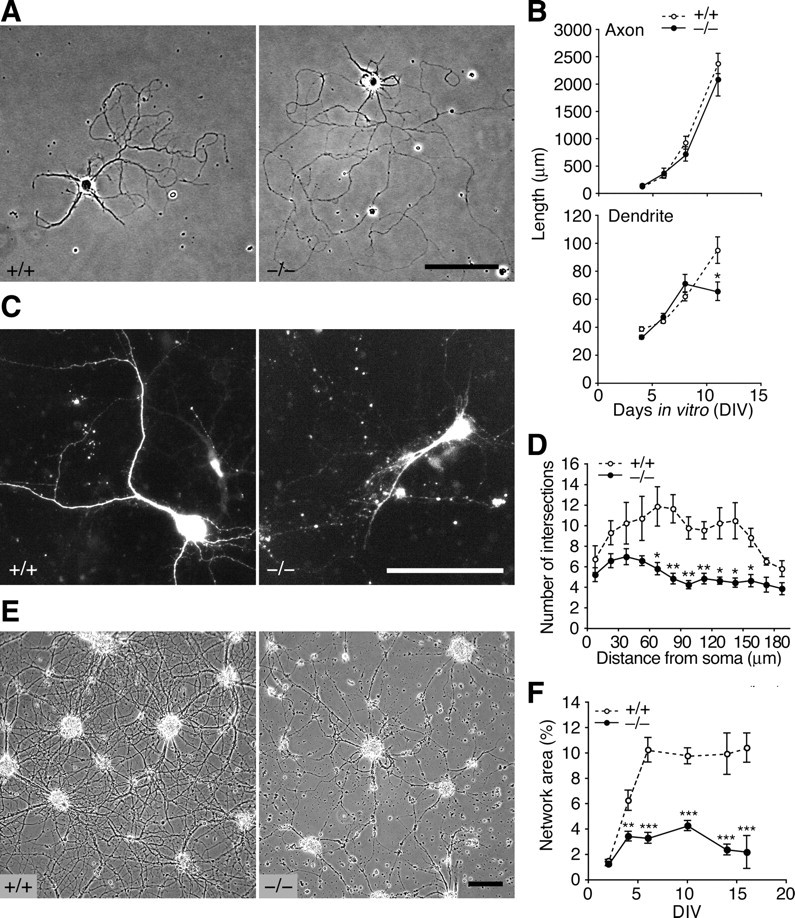
RNG105-deficient neurons form poor dendrites and networks. A, Neurons from E16.5 cortexes were cultured at low density so that they did not come into contact with each other. Shown are phase contrast images of primary cultures (11 DIV) from wild-type and Rng105−/− cortexes. B, The axons and dendrites in A were traced and their lengths were measured at 4, 6, 8, and 11 DIV. There was no significant difference in the length of axons or dendrites between wild-type and Rng105−/− neurons except that dendrites of Rng105−/− neurons were significantly shorter than those of wild-type neurons at 11 DIV. n = 20 for axon lengths; n = 179, 59, 64, and 26 (wild type) and 142, 79, 47, and 35 (Rng105−/−) for dendrite lengths at 4, 6, 8, and 11 DIV, respectively. C, Neurons from wild-type and Rng105−/− cerebral cortexes were transfected with a GFP reporter to visualize the neuronal morphology and cultured for 9 d. GFP images of the transfectants at 9 DIV are shown. D, Dendrites in C were quantified using Sholl analysis, which counts the number of dendrites crossing circles of various radiuses from the soma. n = 10. E, Phase contrast images of primary cultured neurons (22 DIV) from wild-type and Rng105−/− E17.5 cortexes. Scale bars: A, C, E, 100 μm. F, Quantification of neuronal networks in E. n = 8 fields (2.0 mm2 each), four independent cultures from two littermates per group. In B, D, and F, *p < 0.05, **p < 0.01, ***p < 0.001, t test at each DIV or each distance from the soma. Error bars are SEM.
Cloning of mRNA 3′-untranslated regions into pKaede.
3′-Untranslated regions (3′-UTRs) of NKA α1, α2, and α3, and FXYD1, 3, 5, 6, and 7 mRNAs were amplified by reverse transcription (RT)-PCR from mouse cortex RNA using primers listed in supplemental Table 3 (available at www.jneurosci.org as supplemental material) (primers 7–12) and cloned into the KpnI/NotI sites or the NotI site of the pKaede-MC1 vector (MBL). Primary cultured neurons were cotransfected with each plasmid and pDsRed2-N1 (Clontech), and Kaede fluorescence in DsRed2-positive neurons was measured (supplemental Fig. 9, available at www.jneurosci.org as supplemental material).
mRNA imaging.
Plasmids for mRNAs containing 24 tandemly repeated MS2-binding sites were constructed by modifying the above Kaede plasmids as follows: BamHI/BglII fragments from pSL-MS2-24X (a generous gift from Dr. R. H. Singer, Albert Einstein College of Medicine of Yeshiva University, Bronx, NY) were cloned into the BamHI site of Kaede plasmids. The plasmids were digested with EcoRV, and then self-ligated to delete approximately one-half of the Kaede. The original pKaede-MC1 was used to construct the control mRNA plasmid. Primary cultured neurons were cotransfected with each plasmid and pMS2-GFP (a generous gift from Dr. R. H. Singer) to visualize the mRNA localization. RNG105-mRFP1 (Shiina et al., 2005) was cotransfected to visualize RNG105-containing RNA granules. Neurons were imaged using an Olympus IX71 inverted fluorescence microscope with a PlanApo 60× oil objective lens and a cooled CCD camera (ORCA-ER; Hamamatsu) or a Delta Vision optical sectioning microscope (Applied Precision) equipped with an IX70 microscope (Olympus) with a PlanApo 60× oil objective lens.
Immunocytochemistry.
Cultured neurons and fetal brain slices were immunostained as described previously (Shiina et al., 2005). E17.5 cortexes (ventral side) from wild-type and Rng105−/− littermates were coronally sliced and used. The antibodies are listed in supplemental Table 4 (available at www.jneurosci.org as supplemental material). For double staining with primary antibodies produced in the same animal species, a Zenon IgG Labeling kit (Invitrogen) was used in accordance with the manufacturer's instructions. Images were acquired using an Olympus FV500 confocal laser-scanning microscope with a PlanApo 60× oil objective lens or the Delta Vision optical sectioning microscope with a PlanApo 60× oil objective lens.
The images were converted into binary images to quantify the mean number and area of the clusters using NIH ImageJ software. To analyze the fluorescence intensity of the clusters, the original images were multiplied by the binary images, and the mean pixel intensity in individual clusters was measured using Photoshop software. This was then multiplied by the area for individual clusters and presented as fluorescence intensity. For colocalization analysis, the mean pixel intensity of one marker in individual clusters [=region of interest (ROI)] is represented on the x-axis, and that of the other marker in the same ROI on the y-axis (supplemental Fig. 6, available at www.jneurosci.org as supplemental material). Original images were used for measurement of the y-axis pixel intensity. Alternatively, the ratio of the area of the other marker in the ROI to the ROI area was represented as colocalization (see Fig. 4F). Clusters in cell bodies were omitted from the above quantification. To quantify the overlap between GluR1 and postsynaptic density-95 (PSD-95) in the network area (see Fig. 7E,F), the overlap area was extracted from the merged image of the original images multiplied by the binary images, and the cumulative fluorescence intensity in the network and cell body areas was measured using Photoshop software.
Figure 7.
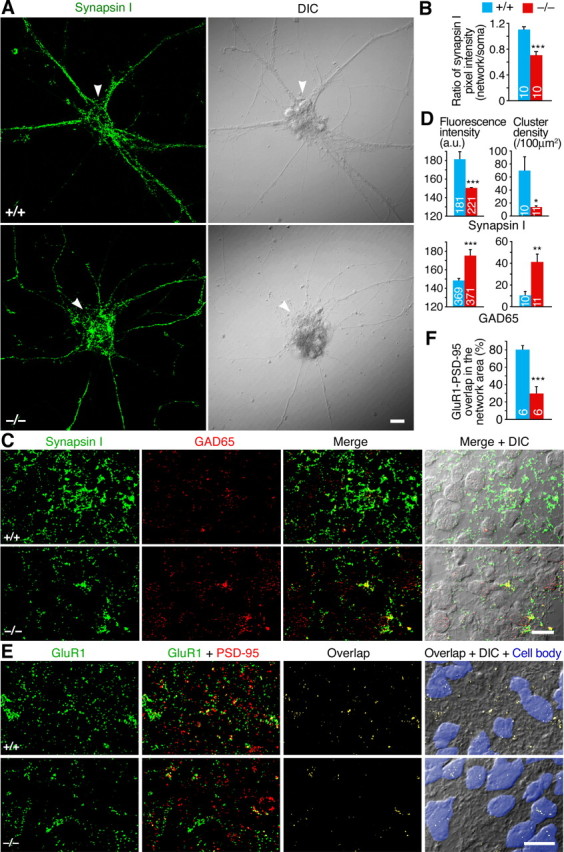
RNG105 deficiency affects the distribution pattern of synaptic proteins. A, Primary cultured neurons (10 DIV) from wild-type and Rng105−/− E17.5 cortexes were immunostained for synapsin I. The arrowheads denote clusters of neuronal somata. In wild-type neurons, synapsin I-positive clusters are mainly distributed along neuronal networks. In contrast, in Rng105−/− neurons, synapsin I-positive clusters are preferentially localized to the somata. B, Quantification of the immunostaining for synapsin I in A. Shown are the ratio of the mean pixel intensity of synapsin I clusters in the network area to that in the soma. C, Immunostaining for synapsin I and GAD65 in coronal slices of wild-type and Rng105−/− E17.5 cortexes. Synapsin I clusters were decreased in the network area of Rng105−/− brains. Synapsin I clusters were barely detected on the soma in both wild-type and Rng105−/− brains, which was different from the results obtained in cultured neurons, although the reasons are not known. D, Quantification of the immunostaining for synapsin I and GAD65 clusters in C. Mean fluorescence intensity and cluster density are shown. a.u., Arbitrary units. E, Immunostaining for an AMPAR subunit (GluR1) and PSD-95 in slices of wild-type and Rng105−/− E17.5 cortexes. Cell somata are masked with blue in the right panels. Unmasked regions are network areas. Scale bars: A, C, E, 10 μm. F, The ratio of the overlap between GluR1 and PSD-95 in the network area to that in total area in E. In B, D, and F, numbers inside the bars are the number of fluorescent clusters or the number of fields (4.5 × 104 μm2 each) analyzed. *p < 0.05, **p < 0.01, ***p < 0.001. Error bars are SEM.
G3BP antibody and G3BP-GFP construct.
cDNA encoding full-length of G3BP was obtained by RT-PCR from rat brain RNA. The fragment was cloned into pGEX-5X-3 vector (GE Healthcare) to produce fusion proteins with glutathione S-transferase (GST). The GST fusion protein was expressed in Escherichia coli (BL21) and purified using glutathione Sepharose 4B columns (GE Healthcare). The GST tag was removed by factor Xa cleavage, and then G3BP protein was purified in accordance with the manufacturer's protocol. The purified protein was used as an antigen to generate a polyclonal antibody in rabbits. The antibody was affinity-purified on Affi-Gel 10 Gel (Bio-Rad), which had been conjugated with the antigen.
To construct an expression vector for G3BP-GFP, G3BP mRNA from rat brains was amplified by RT-PCR with primers 5′-CGAGCTCATGGTTATGGAGAAGCCCAGT-3′ and 5′-GCGTCGACCCACCGCCACCTCCACGACGCTGTCCTGTGAAGC-3′. The product was cloned into SacI/SalI sites of pEGFP-N1 vector (Clontech).
Western blotting.
Fetal cortex extracts were prepared by homogenization in 150 mm NaCl, 1% Nonidet P-40, 50 mm Tris, pH 8.0, 1 mm DTT, and protease inhibitors (10 μg/ml leupeptin, 10 μg/ml pepstatin, 100 μg/ml aprotinin, and 1 mm PMSF). After centrifugation for 10 min at 10,000 × g at 4°C, protein extracts were loaded onto polyacrylamide gels (30 μg per lane), transferred to polyvinylidene fluoride membranes after electrophoresis, and probed with the polyclonal antibody generated against RNG105 previously (Shiina et al., 2005) or antibodies to other proteins (supplemental Table 4, available at www.jneurosci.org as supplemental material). Biotinylated secondary antibodies (supplemental Table 4, available at www.jneurosci.org as supplemental material) and alkaline phosphatase-conjugated streptavidin (GE Healthcare) were used for detection with bromochloroindolyl phosphate/nitroblue tetrazolium solution.
Preparation of synaptosomal fractions.
Mouse cortex was homogenized in 20 vol of 0.32 m sucrose, 1 mm MgCl2, and protease inhibitors with 12 strokes at 800 rpm using a motor-driven Potter Dounce homogenizer (2 ml). The extract was subjected to preparation of the synaptosomal fraction according to the method described previously (Dosemeci et al., 2006).
Na+ imaging.
Neurons cultured on glass-bottom dishes were washed twice with recording buffer (135 mm NaCl, 5 mm KCl, 1.5 mm CaCl2, 1.5 mm MgCl2, 10 mm glucose, and 20 mm HEPES, pH 7.4). They were then incubated at 37°C for 30 min with 5 μm Sodium Green tetra-acetate (Invitrogen) in recording buffer containing 0.1% pluronic F127 (Invitrogen). After two additional washes, Sodium Green was imaged at 35°C in recording buffer containing 1 μm tetrodotoxin (TTX) using the Olympus IX71 inverted fluorescence microscope with a UplanFL 40× objective lens or the Delta Vision optical sectioning microscope with a UApo 40× oil objective lens. Images were taken every 1 s for 6 min. Fluorescence intensity was quantified using NIH ImageJ software.
RNA interference.
Mixtures of short interfering RNAs (siRNAs) for FXYD1, 6, 7, NKA α1, α3, RNG105, and control were purchased from Dharmacon [siGENOME SMART pool M-044360-00-0005 (mixture of GaUGcAAAUUcAACCAACAUU, UAUcAUcCUuAGCAAGAGAUU, GCuGGgAUCCUCUUcAUCUUU, and gGAaCCgGAUCCAUUCACCUU for sense sequences), M-044442-00-0005 (mixture of GcAAgUGCAGuUUCAAUCAUU, UAcCAgACCCUgAGGAUUGUU, GUGGUcCUcUUCUCCGUuGUU, and ACGAaGAGGCcCAgGUGGAUU for sense sequences), M-044396-00-0005 (mixture of GGAUGACcCUgGCcACUAUUU, AAAcGUuCCUGAaGAAACAUU, GCAAaUCcUGUAAgUCGGAUU, and UGAGcAAgAAGGUgAAGUGUU for sense sequences), M-052829-00-0005 (mixture of AGAGGAaGGuCGUCUgAUUUU, GAUUUgAGcCGAGGaUUAAUU, GAGGUgCGgAAGCUcAUUAUU, and GCUCUUaAAgUGcAUUGAAUU for sense sequences), M-051357-00-0005 (mixture of GACAAgAGcUCgCCCAAGAUU, CCGUaAAgCUgAUGCGAGAUU, UCAGGgACcUCuUUCGACAUU, and CAAcUGGGAuGAUCGcACUUU for sense sequences), M-056618-00-0005 (mixture of GAACAUGCCUCAAUUCACUUU, CAAACGGUGUUCAAUAUGAUU, GAGGCUUGAUGAAUGGAUAUU, and ACAGAGGGAUGCCGCAAAUUU for sense sequences), and D-001206-13-05 (sequences are not available), respectively; the lowercase letters in the sequences indicate mutated nucleotides in rescue constructs]. Cultured cortical neurons from E15.5 mice were cotransfected with the siRNAs (0.5 μg each for 7.1 cm2) and pEGFP-N1 or pDsRed2-N1 vector (0.5 μg for 7.1 cm2) at 7–9 DIV as described above. Three days later, the neurons were subjected to Na+ imaging or to immunofluorescence studies. To generate rescue constructs for FXYD1, 6, 7, NKA α1, and α3, their cDNAs including both coding sequence (CDS) and 3′-UTR were amplified by RT-PCR from mouse brains using primers listed in supplemental Table 3 (available at www.jneurosci.org as supplemental material) (primers 23–32) and cloned into HindIII/SacII sites of pEGFP-N1 vector whose green fluorescent protein (GFP) CDS was deleted by BamHI/NotI digestion. The siRNA target sequences in the cDNAs were mutated at the positions indicated above in lowercase letters without changes in amino acid sequences using QuikChange Lightning Multi Site-Directed Mutagenesis kit (Agilent Technologies). The constructed vectors were introduced to cultured neurons (1.0 μg each for 7.1 cm2) with siRNAs and reporters in rescue experiments.
Quantification of cultured neuronal networks.
Phase contrast images of cultured neurons were acquired using an Olympus CK40 microscope with an A10PL 10× objective lens and a Nikon COOLPIX5000 compact digital camera. The length of axons and dendrites was measured by tracing them using the pencil tool in Photoshop software. For the measurement of network area, images were converted into binary images, neurites lost in the binary operation were restored using the pencil tool, and cell bodies and debris were deleted using Photoshop software. The modified images were subjected to calculation of the ratio of the network area to the total area.
Electrophysiology.
Neurons from E17.5 cortex were cultured for 11–12 d in the presence of 25% Neuron Culture Medium (Sumitomo Bakelite). Miniature EPSCs (mEPSCs), passing through AMPA-type glutamate receptor (AMPAR) channels, and miniature IPSCs (mIPSCs) were recorded using a whole-cell patch-clamp method, with a patch-clamp amplifier (EPC-7; List Electronics), low-pass filtered at 3 kHz, and digitally sampled at 1 kHz (Yamaguchi et al., 2002). The bath solution consisted of 137 mm NaCl, 4 mm KCl, 2 mm CaCl2, 1 mm MgCl2, 17 mm glucose, and 10 mm HEPES-NaOH, pH 7.4. TTX (1 μm) and 2-amino-5-phosphonopentanoic acid (dl-AP5) (50 μm) were added during recording. mEPSCs or mIPSCs were recorded in the presence of picrotoxin (100 μm) or 1,2,3,4-tetrahydro-6-nitro-2,3-dioxo-benzo[f]quinoxaline-7-sulfonamide (NBQX) (20 μm), respectively. The interpipette solution consisted of 129 mm K-gluconate, 30 mm KCl, 2 mm MgCl2, 1 mm EGTA, 0.25 mm CaCl2, 3 mm Na2ATP, 0.3 mm GTP, and 5 mm HEPES, pH 7.2. Patch electrodes had resistances of 3–5 MΩ. Neurons were voltage clamped at −70 mV. All experiments were performed at room temperature (25–27°C). Most salts and chemicals used were obtained from Wako Biochemicals. EGTA and HEPES were obtained from Dojindo Laboratories. K-gluconate and NBQX was obtained from Sigma-Aldrich, TTX was from Wako, and dl-AP5 was from Tocris Bioscience.
Histological analysis.
E16.5 embryos were fixed in Bouin's solution. They were dehydrated in ethanol and acetone and then embedded in paraffin. Sagittal sections of 6–8 μm were stained with hematoxylin and eosin.
Statistical analysis.
Nonpaired Student's t test or Welch's t test was used to compare the means of two datasets. Error bars indicate the SEM. To compare the ratio of green and red pixel intensity in the colocalization analyses of two immunostained proteins, F test for the interaction between the two factors in two-way ANOVA was used.
Results
Association of mRNAs for NKA α3, and FXYD1, 6, and 7 with RNG105
For microarray analysis of RNG105-bound mRNAs, we performed immunoprecipitation using an anti-RNG105 antibody (Shiina et al., 2005) or a control IgG on extracts prepared from fetal mouse cerebral cortex. The precipitated mRNAs were subjected to microarray analysis and further to ontological analysis. These analyses identified a variety of RNG105-bound mRNAs, several of which were annotated to be related to “cellular cation homeostasis” (Table 1; supplemental Table 1, available at www.jneurosci.org as supplemental material), and notably included three NKA subunit isoforms, namely α3 and FXYD1 and 7 (supplemental Tables 1, 2, available at www.jneurosci.org as supplemental material).
Table 1.
Significant enriched categories (p < 0.05) found in the RNG105-bound mRNAs (mean ratio, >2.0)

The p values of the categories appearing at the termini of the hierarchy are shadowed.
Next, we examined whether the NKA mRNAs were recruited into RNA granules where RNG105 was localized. Because the 3′-UTR is responsible for mRNA localization in most cases, we used an MS2-GFP system (Bertrand et al., 1998) to label 3′-UTRs of NKA isoforms (α1–3 and FXYD1, 3, 5, 6, and 7) in primary cultured neurons where RNG105-mRFP1 (Shiina et al., 2005) was coexpressed. Of the isoforms labeled, α3 and FXYD1, 6, and 7 3′-UTRs were colocalized with RNG105 in granules in dendrites (see Fig. 2A). Time-lapse observation showed that the translocation of the 3′-UTR-MS2-GFP in dendrites coincided with that of RNG105-mRFP1 (see Fig. 2B; supplemental Movies 1–3, available at www.jneurosci.org as supplemental material), which formed granular complexes with ribosomes (see Fig. 2C). These results suggested that the NKA mRNAs were likely candidates for the components of RNG105-localizing RNA granules.
Figure 2.
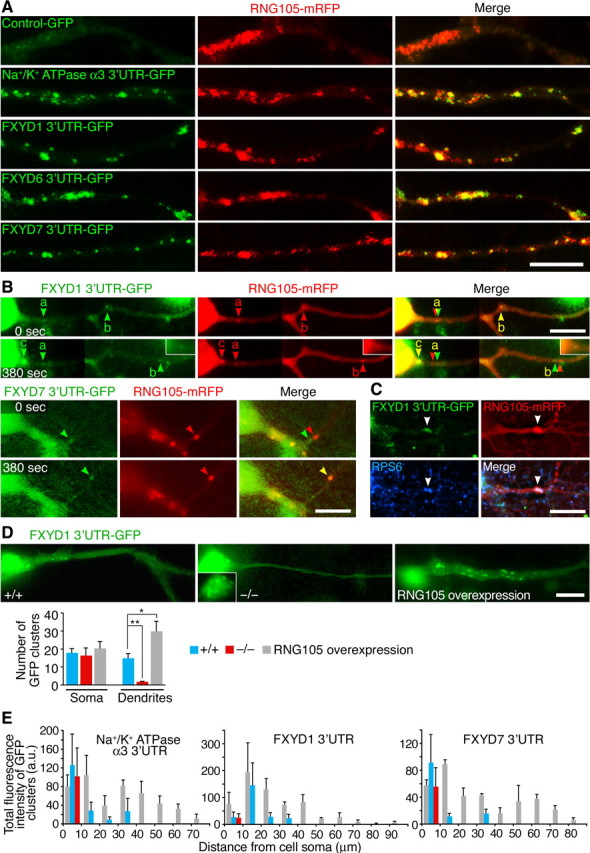
RNG105-dependent dendritic localization of mRNAs for NKA subunit isoforms α3 and FXYD1, 6, and 7. A, Visualization of mRNAs with MS2-GFP (green) and of RNG105-mRFP1 (red) in dendrites of primary cultured neurons from E17.5 mouse cerebral cortex. 3′-UTRs of NKA α3 and FXYD1, 6, and 7 mRNAs are recruited to RNG105-localizing RNA granules. A magnified image of a dendrite is shown in each panel. B, Live imaging of RNG105-mRFP1 with FXYD1 (top panels) or FXYD7 (bottom panels) 3′-UTR-MS2-GFP in dendrites of primary cultured neurons. A cell soma is located on the left side in each panel. Images were taken at time points 0 and 380 s. Between the two time points, time-lapse imaging of RNG105-mRFP1 was performed (30–320 s) (supplemental Movies 1–3, available at www.jneurosci.org as supplemental material). The arrowheads denote individual granules. Arrowheads “c” indicate a granule transported from the soma to dendrite during the time-lapse imaging. The granule denoted by arrowheads “b” moved distally after the end of the time-lapse imaging (320–380 s). The GFP-tagged 3′-UTRs were colocalized with RNG105-mRFP1, but sometimes slightly shifted because there was a time lag of 3 s between mRFP1 and GFP data acquisition. The insets are nonenhanced images of the granule “c” at the same size, which show that the granule is relatively small one (see also supplemental Movie 2, available at www.jneurosci.org as supplemental material). C, Cultured neurons transfected with both RNG105-mRFP1 and FXYD1 3′-UTR-MS2-GFP were immunostained with anti-ribosomal protein S6 (RPS6) antibody. The arrowheads denote an RNG105-localizing RNA granule. Scale bars, 10 μm. D, Distribution of FXYD1 3′-UTR-MS2-GFP in wild-type (+/+), Rng105−/− (−/−), and RNG105-mRFP1-overexpressing cultured neurons. The inset shows a nonenhanced image of the cell soma where small clusters of FXYD1 3′-UTR-MS2-GFP are observed. Scale bar, 10 μm. The bottom graph shows number of GFP clusters in the soma and dendrites (>20 μm from the soma). n = 8; *p < 0.05, **p < 0.01; error bars are SEM. E, Distribution pattern of mRNA-localizing clusters in the dendrites of wild-type, Rng105−/−, and RNG105-mRFP1-overexpressing neurons in D. a.u., Arbitrary units. Error bars are SEM.
Reduced dendritic localization of NKA mRNAs and proteins in Rng105−/− neurons
To examine changes in NKA mRNAs in RNG105-deficient neurons, we generated RNG105-deficient mice (Fig. 1). Rng105+/− mice were fertile with the gross morphology indistinguishable from wild-type littermates. Fetuses [embryonic day 17.5 (E17.5)] were recovered in the expected Mendelian ratio (+/+:+/−:−/− = 0.251:0.493:0.256; n = 203), and, at this stage, Rng105−/− fetuses were characterized by their abnormally bent shape and smaller size of body (Fig. 1C). Rng105−/− fetal organs were reduced in size but were all developed and histologically normal (supplemental Fig. 1, available at www.jneurosci.org as supplemental material). Rng105−/− neonates were born normally but failed to breathe, developed cyanosis, and died within 20 min after birth.
Primary cultures of cerebral cortical neurons were prepared from wild-type and Rng105−/− E17.5 mice. The neurons were transfected with the 3′-UTR-MS2-GFP constructs for α3 and FXYD1, 6, and 7 mRNAs as in Figure 2A–C without RNG105-mRFP1. α3 and FXYD1 and 7 3′-UTR clusters were transported into dendrites and moved bidirectionally in wild-type neurons (Fig. 2D,E; supplemental Movie 4, available at www.jneurosci.org as supplemental material). In contrast, their localization was limited to the cell soma and proximal dendrites and their motility was reduced in Rng105−/− neurons (Fig. 2D,E; supplemental Movie 5, available at www.jneurosci.org as supplemental material). The percentage of motile granules was 50.3 ± 8.8% in wild-type neurons, whereas it was only 8.2 ± 0.9% in Rng105−/− neurons, which may result in the reduced dendritic delivery of the granules in Rng105−/− neurons: 45.5 ± 5.1% of granules were localized to dendrites in wild-type neurons, whereas only 10.1 ± 2.2% of granules were localized to dendrites in Rng105−/− neurons. Velocity and directionality of the motile granules were not significantly different between wild-type and Rng105−/− neurons: anterograde and retrograde movement was 0.18 ± 0.03 and 0.21 ± 0.05 μm/s, respectively, in wild-type neurons and 0.13 ± 0.03 and 0.14 ± 0.02 μm/s, respectively, in Rng105−/− neurons. Approximately one-half of the granules moved in the anterograde direction and one-half in the retrograde direction both in wild-type and Rng105−/− neurons. Clusters of FXYD6 3′-UTR were not clearly detected in these experiments. Overexpression of RNG105-mRFP1 in wild-type neurons resulted in localization of the 3′-UTRs with RNG105-mRFP1 granules to more distal parts of the dendrites (Fig. 2D,E). These results indicate that RNG105 is involved in the dendritic localization of mRNAs for the NKA α3 and FXYD1 and 7 and possibly also FXYD6.
In Rng105−/− neurons, RNA granules that contain ribosomes and their marker proteins, e.g., staufen 1, cytoplasmic polyadenylation element-binding protein 1 (CPEB1), FMRP, and Pur α were formed and localized normally to dendrites (Fig. 3A,C). In contrast, Ras-GTPase-activating protein SH3 domain-binding protein (G3BP), which is colocalized with RNG105 in RNA granules (Angenstein et al., 2002; Solomon et al., 2007) and forms a heterodimer with RNG105 (Katsafanas and Moss, 2004), was reduced in distal dendrites of Rng105−/− neurons (Fig. 3B,C; supplemental Fig. 2, available at www.jneurosci.org as supplemental material). These results suggested a specific deficit in dendritic localization of RNG105-associated proteins, as well as RNG105-associated mRNAs, in Rng105−/− neurons.
The distribution of NKA α3 and FXYD1, 6, and 7 proteins in wild-type cultured neurons was examined by immunostaining, which revealed that the proteins were distributed throughout the soma and dendrites in a punctate pattern (Fig. 4A). FXYD6 and 7 were particularly colocalized with PSD-95, an excitatory postsynaptic marker (Fig. 4B,F), and localized in synaptosome fractions (supplemental Fig. 3, available at www.jneurosci.org as supplemental material), suggesting their postsynaptic functions. In contrast, little colocalization was observed between gephyrin, an inhibitory postsynaptic marker, and FXYD6 or 7 (Fig. 4C,F). In Rng105−/− neurons, the localization of α3 and FXYD1, 6, and 7 proteins to dendrites or to synaptosome fractions was greatly reduced, although their localization to the soma was unaltered (Fig. 4A,E; supplemental Fig. 3, available at www.jneurosci.org as supplemental material). The amount of each NKA subunit protein was almost the same between wild type and Rng105−/− as judged by Western blotting (supplemental Fig. 4, available at www.jneurosci.org as supplemental material), supporting the notion that the localization of the proteins was altered in Rng105−/− neurons. Localization of PSD-95 to dendrites was also decreased in Rng105−/− neurons, but the decrease was not as great as that of the NKA subunit isoforms (Fig. 4E; supplemental Fig. 3, available at www.jneurosci.org as supplemental material).
Reduced NKA activity in dendrites of Rng105−/− neurons
NKA activity in wild-type and Rng105−/− neurons was estimated by Na+ imaging (Fig. 5). Cultured neurons were labeled with Sodium Green fluorescence indicator and time-lapse recording was performed. When K+ was added to the culture medium, K+-dependent NKA was activated and Na+ was pumped out of the neuron (Fig. 5B). Application of ouabain, a blocker of NKA, decreased the duration of Na+ efflux, supporting the finding that Na+ efflux was, at least in part, attributable to the activation of NKA (Fig. 5B,C). In Rng105−/− neurons, the duration of Na+ efflux was decreased in dendrites but not in the cell soma (Fig. 5B,C). These results suggest that NKA activity was decreased in dendrites but not in the cell soma of Rng105−/− neurons, which is consistent with the decreased localization of the NKA subunit isoforms in dendrites.
The effect of RNA interference (RNAi) of the NKA isoforms on K+-dependent Na+ efflux was also examined. Cultured neurons were cotransfected with siRNAs for the isoforms and a red fluorescent protein (DsRed2) reporter to trace the affected cells. Expression of the isoforms was suppressed in neurons expressing the reporter (supplemental Fig. 5, available at www.jneurosci.org as supplemental material). The duration of Na+ efflux was decreased in neurons transfected with siRNAs for α3 or FXYD1 (Fig. 5C). The effect of RNAi was rescued by expression of target genes (Fig. 5C). Of note, the effect of RNAi occurred in both dendrites and cell soma in the RNAi neurons. These results suggested that a deficit in α3 or FXYD1 reduced NKA activity. In contrast, FXYD6- or FXYD7-knockdown had little effect on Na+ efflux (Fig. 5C). FXYD6 and FXYD7 may have lesser degrees of contribution to NKA activity than those of α3 and FXYD1, or their loss may be compensated by other subunits.
Poor development of neuronal networks in Rng105−/− neurons
Next, we examined the effect of the loss of RNG105 on the development of dendrites in primary cultured neurons. In low-density cultured neurons from Rng105−/− cortex, axons elongated fairly normally, but dendrites were shorter than those of wild type at 11 DIV, suggesting disorder in dendrites of Rng105−/− neurons (Fig. 6A,B). To analyze the effect of the loss of RNG105 on dendrites, including dendritic arborization, in more detail, neurons from wild-type and Rng105−/− cortexes were transfected with GFP as a marker to visualize neuronal morphology and cultured at high cell density (Fig. 6C,D). Sholl analysis revealed that the number of dendrites was significantly reduced in Rng105−/− neurons compared with wild-type neurons (Fig. 6D), indicating that dendritic arborization was affected by RNG105 knock-out. Consistent with the deficiency in dendritic length and branching, high-density cultured neurons from Rng105−/− cortex formed poor networks compared with those from wild type (Fig. 6E,F). The deficit in the network formation was likely to be attributable to the deficit in dendritic development, but also be attributable to other reasons [e.g., some alteration in the interaction of neurons with each other because the networks of high-density Rng105−/− neurons were already poor at early DIV (Fig. 6F, 4–6 DIV), when dendrites of low-density Rng105−/− neurons elongated fairly normally (Fig. 6B)].
RNG105 deficiency affects the distribution pattern of synaptic proteins
Concomitantly with the reduction in the network formation, clusters of synapsin I, a marker for presynapses, were decreased in number in the network area of Rng105−/− neurons (Fig. 7A). In contrast, synapsin I clusters were increased in number and size on the soma of Rng105−/− neurons. Although synapsin I clusters were still localized along the neurites of Rng105−/− neurons, the ratio of the pixel intensity of synapsin I clusters in the network versus in the soma was decreased in Rng105−/− neurons (Fig. 7A,B). Because ∼80–90% of these synapsin I clusters were colocalized with PSD-95 (compare Fig. 4D), axons were likely to terminate preferentially near the soma in Rng105−/− neurons.
Immunostaining of fetal cerebral cortical slices also showed that synapsin I clusters were decreased in the network area of Rng105−/− brains (Fig. 7C,D). In contrast, staining for glutamic acid decarboxylase 65 (GAD65), an inhibitory presynaptic marker, was increased in Rng105−/− brains compared with wild-type brains (Fig. 7C,D). Merging of the images for synapsin I and GAD65 showed that synapsin I-positive clusters were excessively colocalized with GAD65 in Rng105−/− brains (Fig. 7C; supplemental Fig. 6A,B, available at www.jneurosci.org as supplemental material). Thus, distribution of synapsin I clusters, but not of GAD65 clusters, was decreased in the network area of Rng105−/− brains.
It is known that AMPARs, but not NMDA-type glutamate receptors, cycle into and out of the postsynaptic membrane at a rapid rate, and that AMPARs are delivered to the synapse in an activity-dependent manner (Lüscher et al., 1999; Derkach et al., 2007). We then coimmunostained cortical slices for GluR1, an AMPAR subunit, and PSD-95 (Fig. 7E). The amount of GluR1 was significantly decreased at PSD-95-positive excitatory postsynapses in Rng105−/− cortex (Fig. 7E; supplemental Fig. 6C, available at www.jneurosci.org as supplemental material). Furthermore, GluR1-PSD-95 overlaps distributed broadly in wild-type cortex was markedly reduced in the network area and was limited to the cell soma in Rng105−/− cortex (Fig. 7E,F). These results suggested that the distribution pattern of functional excitatory postsynapses was altered in Rng105−/− brains.
To analyze the alteration in synaptic function in Rng105−/− neurons, we performed electrophysiological recordings of mEPSCs and mIPSCs in cultured neurons. The frequency or amplitude of mEPSCs was not altered, but the half-width of mEPSCs was significantly decreased in Rng105−/− neurons compared with wild-type neurons (Fig. 8). No significant change in frequency, amplitude, or half-width of mIPSCs was detected (Fig. 8). The specific change in mEPSC half-width may be associated with the alteration in the distribution pattern of excitatory synapses and/or with the decreased colocalization of GluR1 with PSD-95 in Rng105−/− neurons.
Figure 8.

Half-width of mEPSCs is decreased in Rng105−/− cultured neurons. A, B, Representative sample traces of mEPSCs, passing through AMPAR channels, from wild-type and Rng105−/− neurons. B shows expanded mEPSCs. C, Representative sample traces of mIPSCs from wild-type and Rng105−/− neurons. D, Cumulative amplitude and half-width histograms of mEPSCs and mIPSCs. mEPSC half-width is significantly decreased in Rng105−/− neurons. **p < 0.01 using Kolmogorov–Smirnov test. E, Average frequency, amplitude, and half-width of mEPSCs and mIPSCs from wild-type and Rng105−/− neurons. **p < 0.01 using t test. Error bars are SEM.
Some of Rng105−/− cultured neurons led to cell death (supplemental Fig. 7A, available at www.jneurosci.org as supplemental material). Cell death was also enhanced in Rng105−/− brains (supplemental Fig. 7B,C, available at www.jneurosci.org as supplemental material), although not enhanced in other organs (data not shown). The enhanced cell death is likely to be associated with the deficit in the synapses and networks in Rng105−/− neurons. Although some Rng105−/− cultured neurons led to cell death, the other Rng105−/− neurons survived, which indicated that RNG105 itself was not an absolute requirement for survival for neurons.
NKA suppression reduces networks and affects the termination pattern of axons from normal neurons
Next, we examined the effect of NKA inhibition on the formation of networks and synapses in cultured cortical neurons. Continuous application of low concentration of ouabain (10 μm) to cultured neurons reduced the formation of neuronal networks without affecting cell survival (Fig. 9A,B; supplemental Fig. 8, available at www.jneurosci.org as supplemental material), although high concentrations of ouabain enhanced cell death (data not shown). Immunostaining of the cultured neurons revealed that synapsin I clusters, but not GAD65 clusters, were decreased in the ouabain-treated neurons (Fig. 9C,D). In contrast to the result that synapsin I clusters were increased, rather than decreased, in the soma of Rng105−/− neurons (Fig. 7A,B), synapsin I clusters were decreased in the soma of the ouabain-treated neurons (Fig. 9C), which may possibly be attributable to NKA activity in the soma not being decreased in Rng105−/− neurons but was decreased in ouabain-treated neurons (Fig. 5B,C). Thus, inhibition of NKA impaired the formation of neuronal networks and synapses, which was reminiscent of the phenotype of Rng105−/− neurons. It should be noted, however, that the effect on synapses in Rng105−/− neurons was restricted to dendrites.
Figure 9.

Inhibition of NKA reduces neuronal networks and synapsin I staining. A, Phase contrast images of primary neurons (10 DIV) from E17.5 cortex cultured in the absence or presence of ouabain (10 μm). Scale bar, 100 μm. B, Quantification of the neuronal networks in A. n = 6 fields (2.0 mm2 each) per group. *p < 0.05, **p < 0.01, t test at each DIV. Error bars are SEM. C, Immunostaining for synapsin I and GAD65 in primary neurons (11 DIV) cultured in the absence or presence of ouabain (10 μm). A cluster of cell somata is located on the left side, and neurites elongate toward the right side. Scale bar, 10 μm. D, Quantification of synapsin I and GAD65 fluorescence intensity in C.
To examine the contribution of NKA in postsynaptic neurons to synapse formation, RNAi of NKA subunit isoforms was also performed (Fig. 10). Postsynaptic spines are usually innervated by excitatory presynapses, whereas inhibitory presynapses occur primarily on cell bodies and dendritic shafts, as shown in the control RNAi neurons (Fig. 10A). RNAi of isoforms α1, α3, and FXYD1 in postsynaptic neurons resulted in the decrease of synapsin I attachment to spines (Fig. 10C, left panel; D). RNAi of FXYD6 and 7 also reduced the synapsin I attachment to spines, but had additional contrasting effects that increased the attachment of GAD65 to spines (Fig. 10C, middle panel; D). The effects of FXYD6 and 7 RNAi were also distinct from other RNAi in terms of changes in spine size (Fig. 10B). Attachment of synapsin I and GAD65 on dendritic shafts was not significantly altered in each RNAi experiment. The effects of the siRNAs on spine size and presynaptic attachment to spines were rescued by expression of the target genes that were mutated at the siRNA target sequences, suggesting that the RNAi effects were attributable to knocking down of the proteins (Fig. 10B,D). Triple RNAi of FXYD1, 6, and 7 resulted in the decrease of synapsin I attachment and the increase of GAD65 attachment to spines, which appeared to be the sum of each RNAi phenotype (Fig. 10C, right panel, green; D). However, addition of α3 siRNA to the triple RNAi canceled the increased attachment of GAD65 to spines (Fig. 10C, right panel, red; D). These results suggest the involvement of NKA subunit isoforms in presynaptic attachment to spines: α3 is required for the attachment of both excitatory and inhibitory presynapses to spines. FXYD1 positively regulates the attachment of excitatory presynapses to spines, whereas FXYD6 and 7 have additional roles that negatively regulate the attachment of inhibitory presynapses to spines.
Figure 10.
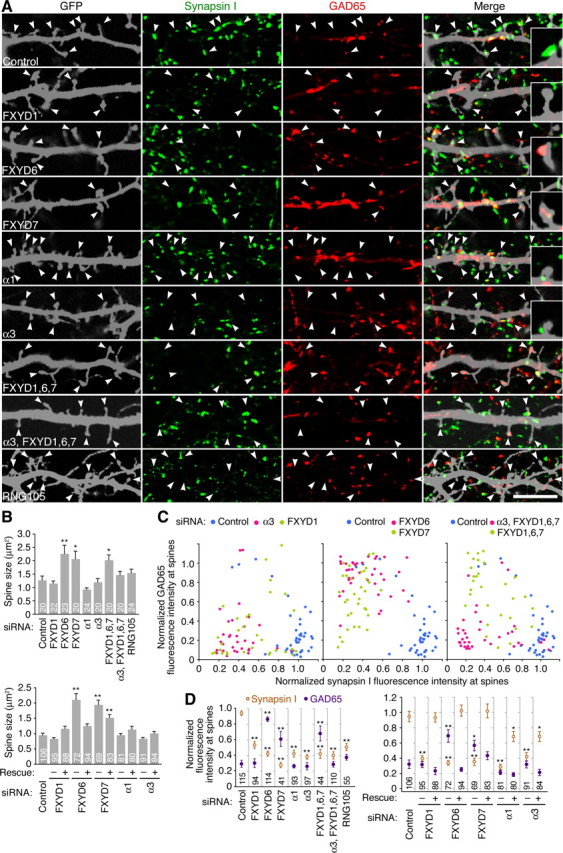
RNAi of NKA affects the termination pattern of axons from normal neurons. A, Immunostaining for synapsin I and GAD65 in cultured neurons (10 DIV) cotransfected with a GFP reporter and siRNA for the indicated NKA isoform or for RNG105. Magnified image of a GFP-positive dendritic area is shown in each panel. Synapsin I and GAD65 clusters correspond to axon terminals from other GFP-negative neurons. The arrowheads denote spines. The insets show magnified images of representative spines. Scale bar, 10 μm. B, Spine size in the RNAi neurons in A. The bottom panel shows rescue experiments: −, only siRNAs were introduced into neurons; +, both siRNAs and target genes that were mutated at the siRNA target sequences were introduced. C, Fluorescence intensity of synapsin I and GAD65 clusters on the GFP-positive spines in A. The fluorescence intensity on spines is normalized to that in GFP-negative areas in the same field and plotted. Each dot in the graph shows fluorescence intensity on each spine. D, Mean fluorescence intensity of synapsin I and GAD65 in C. The right panel shows rescue experiments. In B and D, expression of rescue constructs significantly suppressed the effects of siRNAs except that the suppression of the effect of FXYD7 siRNA on spine size was partial. The numbers indicate the number of spines analyzed. *p < 0.05, **p < 0.01, significant difference compared with control, Tukey–Kramer test. Error bars are SEM.
RNG105 RNAi experiments also resulted in the decrease of synapsin I attachment to spines (Fig. 10A,D). RNG105 RNAi did not significantly increase the attachment of GAD65 to spines, which was reminiscent of the RNAi of α3, FXYD1, and quadruple RNAi of α3 and FXYD1, 6, and 7. The change in synapses in RNG105 RNAi neurons is likely to be a cause for the decreased synapsin I clusters in the network of Rng105−/− cultured neurons and cortex. Together, RNAi of NKA subunit isoforms and RNG105 in postsynaptic neurons altered the termination patterns of axons from normal neurons. These results suggest that reduced localization of NKA subunit isoforms to dendrites underlies a part of the altered synapse formation in Rng105−/− neuronal networks.
Discussion
We identified mRNAs for NKA subunit isoforms α3 and FXYD1, 6, and 7 as RNG105-associated mRNAs, which were localized to dendrites in an RNG105-dependent manner in neurons. The loss of RNG105 resulted in reduced localization of the NKA subunit isoform proteins to dendrites, which was accompanied by the reduction in K+-induced Na+ efflux activity in dendrites but not in the soma, leading to the aberrant synapse formation and degeneration of neuronal networks.
Possible roles of RNG105-assocoated mRNAs
Microarray and localization analyses in cultured neurons showed that mRNAs for α3, FXYD1, 6, and 7 NKA subunit isoforms were associated with RNG105 in the RNA granule. FXYD1 and 6 mRNAs were also reportedly identified as dendritically localized mRNAs by microarray analysis (Zhong et al., 2006), which may be consistent with our results.
It is reported that inhibition of NKA activity by low concentrations of ouabain leads to increased susceptibility to glutamate excitotoxicity that induces the elevation of intracellular Na+ and Ca2+ ions (Brines and Robbins, 1992; Kiedrowski et al., 2004). These observations support our finding that the augmented cell death in Rng105−/− neurons is attributable to the reduced NKA subunit isoforms in dendrites of Rng105−/− neurons. It has also been reported that partial inhibition of NKA suppresses EPSPs (Reich et al., 2004), and that inhibition of NKA reduces the cell surface expression and turnover of AMPARs (Zhang et al., 2009), which appear to be consistent with our results that colocalization of AMPARs and PSD-95 was reduced in the network area and restricted to the soma in Rng105−/− cortex.
An important result in the present study is that the loss of NKA was in dendrites, but not in the soma. In wild-type neurons, because the majority of excitatory synapses are located on dendrites, cations such as Na+ and Ca2+ should frequently flow into dendrites, followed by generation of reactive oxygen species (ROS). To defend neurons from such changes, localization to dendrites of factors responsible for defense against the changes should be required. Ion homeostasis is one of these defensive mechanisms. NKA is well known to be involved in Na+/K+ ion homeostasis and indirectly in Ca2+ homeostasis through Na+/Ca2+ exchangers. In fact, microarray analysis identified mRNAs for NKA subunit isoforms and also for other factors involved in ion homeostasis (supplemental Table 2, available at www.jneurosci.org as supplemental material). In addition, the analysis identified mRNAs for metal-binding proteins such as selenoprotein W and metallothionein 2, which are involved in defense against ROS (supplemental Tables 1, 2, available at www.jneurosci.org as supplemental material). mRNAs for amyloid-β precursor protein (APP)-related factors were also identified: amyloid-β precursor-like protein 1 (aplp1), aplp2, and sorting nexin 17 (supplemental Tables 1, 2, available at www.jneurosci.org as supplemental material). Although the precise involvement of APP-related factors in defensive roles against neurotoxicity is not well known, APP reportedly promotes a loss of neuronal Ca2+ homeostasis and cell death through reduction in NKA activity (Mark et al., 1995). Thus, our microarray analyses identified a battery of mRNAs whose translated products are potentially responsible for defensive roles against neurotoxicity, which led us to propose novel roles for dendritic local translation in the maintenance of dendritic properties.
Roles of RNG105 in neurons
We and other researchers have reported previously that RNG105 inhibits translation in vitro and that overexpression of RNG105 inhibits translation in vivo (Shiina et al., 2005; Solomon et al., 2007). However, neither α3, FXYD1, 6, nor 7 proteins were increased in the dendrites of Rng105−/− neurons (Fig. 4), or increased in Western blotting analyses (supplemental Fig. 4, available at www.jneurosci.org as supplemental material), which was similar to the results of knock-out of RNG105 (=caprin-1) in chicken DT40 cells, which resulted in no significant effect on global rates of protein synthesis (Solomon et al., 2007). These results suggested the possibility that RNG105 may not play the primary role in translational inhibition, although RNG105 affected translation when expressed at nonphysiological levels in cells.
In addition, because translation of a Kaede reporter fused to the 3′-UTRs of RNG105-targeted mRNAs (except for α3 3′-UTR) was suppressed not only in wild-type neurons but also in Rng105−/− neurons (supplemental Fig. 9, available at www.jneurosci.org as supplemental material), translational repressor(s) other than (or in addition to) RNG105 may exist in the neurons. Analyses of the effect of RNG105 on translation in the background of a null mutation in the translation repressor(s) could elucidate whether RNG105 acts as a translation repressor in dendritic RNA granules. Analysis of other parts of the α3 mRNA may also be required to clarify this.
In Rng105−/− neurons, the localization of α3 and FXYD1 and 7 3′-UTRs to dendrites was reduced, which was accompanied by the reduction in the dendritic localization of α3 and FXYD1, 6, and 7 proteins. However, RNA granules still formed in the absence of RNG105. These results suggested that rather than granule assembly, RNG105 plays important roles in dendritic mRNA localization, for example, by regulating the loading and unloading of mRNAs into and from RNA granules (supplemental Fig. 10, available at www.jneurosci.org as supplemental material), which may be coupled to activity-dependent control of local translation.
Similarity between RNG105- and G3BP-deficient mice
Rng105−/− mice phenotypes are very similar to those of G3BP-deficient mice (Zekri et al., 2005). G3BP deficiency also results in fetal growth retardation, the CNS cell death, and neonatal lethality with respiratory failure. RNG105 and G3BP are colocalized to RNA granules in neurons and in cultured cells (Angenstein et al., 2002; Solomon et al., 2007), and form a heterodimer in their recombinant forms (Katsafanas and Moss, 2004). In the present study, we showed that the localization of G3BP to dendrites was reduced in Rng105−/− neurons, which supported the association of RNG105 and G3BP. The association of RNG105 and G3BP, together with the phenotypic similarity between Rng105−/− and G3BP−/− mice, suggested a physical and functional interaction between RNG105 and G3BP.
G3BP is reportedly responsible for many unrelated functions in proliferating cells and in neurons (Irvine et al., 2004). RNG105, although most abundantly expressed in the brain, is also expressed in actively proliferating cells (Grill et al., 2004). Knock-out of RNG105 in DT40 cells results in a slowing of the proliferation rate (Wang et al., 2005), which is consistent with our finding that Rng105−/− fetuses showed growth retardation. Thus, RNG105, interacting with G3BP, may play roles both in proliferating cells and in neurons.
Poor neuronal networks in RNG105-deficient neurons
RNG105 knock-out in neurons caused abnormal distribution of synapses and poor neuronal networks. RNG105 knock-out also led to significant cell death, which suggests that poor networks in Rng105−/− neurons are caused not only by loss of NKA subunit isoforms but also by cell death. The present results that RNG105 is associated with mRNAs whose translated products are potentially responsible for defensive roles against neurotoxicity support the possibility. However, this does not exclude the notion that deficiencies of NKA subunit isoforms as well as RNG105 affect synapse patterning and neuronal networks without cell death, as shown by RNAi experiments. RNAi of the NKA subunit isoforms and RNG105 did not lead to neuronal cell death, which may be because the knockdown effect of the siRNAs did not last for a long period (the effect of siRNA used in the present study is reported to be decreased after day 4). Even without cell death, RNAi of NKA subunit isoforms and RNG105 resulted in abnormal distribution of synapses and poor development of dendrites (Fig. 10). Furthermore, ouabain treatment of cultured neurons reduced the development of networks and synapses without affecting cell survival (Fig. 9; supplemental Fig. 8, available at www.jneurosci.org as supplemental material). Thus, deficiencies of RNG105 and NKA subunit isoforms affect neuronal networks and synapses without cell death, which underlies, at least in part, the abnormal distribution of synapses and poor neuronal networks in Rng105−/− neurons.
Alteration in synapses in Rng105−/− neurons
Electrophysiological measurements revealed that the half-width of mEPSCs in Rng105−/− neurons was significantly decreased. These results could be explicable by the following possibilities: (1) considering the effect of dendritic cable filtering that shapes the amplitude and width of EPSCs to a degree that is dependent on synapse location, excitatory synapses may be decreased in the distal dendritic area but increased in the proximal dendritic area in Rng105−/− neurons; (2) the property of postsynapses may change [e.g., changes in synaptic AMPAR subunit composition, changes in PSD size and location, or changes in interaction between AMPARs and postsynaptic proteins such as stargazin, which affects desensitization of AMPARs (Lawrence and Trussell, 2000; Cathala et al., 2005; Tomita et al., 2005)]. Possibility (1) appears to be consistent with the present result that synapsin I-positive clusters were decreased in the network but increased in the soma of Rng105−/− cultured neurons. However, because changes in the localization of synapses to the soma could also increase the amplitude of mEPSCs, other mechanisms that decrease the amplitude of mEPSCs may be required to explain this possibility. Possibility (2) may be consistent with the reduction in the colocalization of GluR1 with PSD-95 in Rng105−/− neurons. To examine possibility (2), we need to perform additional experiments to test whether mRNAs for AMPARs and AMPAR-associated proteins are regulated by local translation (Ju et al., 2004) through RNG105-including mechanisms.
In conclusion, we demonstrated that RNG105 is required for the localization of mRNAs such as NKA subunit isoform mRNAs to dendrites, highlighting the in vivo importance of RNG105 in the maintenance of dendritic properties such as ion homeostasis against neurotoxicity, and therefore for the proper networking of the neurons. However, additional studies of other mRNAs implicated in the defense against cell death and in the regulation of AMPAR activity could fully elucidate the mechanism of the RNG105-deficient phenotype. In addition to the well known roles of local translation in synapse formation and plasticity, the present study suggests novel defensive roles of local translation. These findings raise an interesting issue of whether RNA-binding proteins in the RNA granules or particular kinds of RNA granules regulate distinct biological processes through binding to distinct sets of mRNAs.
Footnotes
This work was supported by Grants-in-Aid from Ministry of Education, Culture, Sports, Science and Technology (MEXT) (N.S., M.T.), the Advanced and Innovational Research Program of MEXT (M.T.), and the Dynamic Biology Project of New Energy and Industrial Technology Development Organization (M.T.). We thank M. Arii and Dr. T. Koide for animal husbandry; K. Shinkura, K. Takada, and C. Matsuda for assistance; Dr. N. Ueno, Dr. S. Takada, and Dr. E. Nishida for critical reading of this manuscript; Dr. R. H. Singer, Dr. H. Garty, and Dr. K. Geering for reagents; M. Tamura for histological analyses; Dr. O. Ohara for microarray analysis; Dr. T. Hirata for discussions; and Agilent Technologies and KURABO Industries, Ltd.
References
- Angenstein F, Evans AM, Settlage RE, Moran ST, Ling SC, Klintsova AY, Shabanowitz J, Hunt DF, Greenough WT. A receptor for activated C kinase is part of messenger ribonucleoprotein complexes associated with polyA-mRNAs in neurons. J Neurosci. 2002;22:8827–8837. doi: 10.1523/JNEUROSCI.22-20-08827.2002. [DOI] [PMC free article] [PubMed] [Google Scholar]
- Bassell GJ, Kelic S. Binding proteins for mRNA localization and local translation, and their dysfunction in genetic neurological disease. Curr Opin Neurobiol. 2004;14:574–581. doi: 10.1016/j.conb.2004.08.010. [DOI] [PubMed] [Google Scholar]
- Bertrand E, Chartrand P, Schaefer M, Shenoy SM, Singer RH, Long RM. Localization of ASH1 mRNA particles in living yeast. Mol Cell. 1998;2:437–445. doi: 10.1016/s1097-2765(00)80143-4. [DOI] [PubMed] [Google Scholar]
- Bramham CR, Wells DG. Dendritic mRNA: transport, translation and function. Nat Rev Neurosci. 2007;8:776–789. doi: 10.1038/nrn2150. [DOI] [PubMed] [Google Scholar]
- Brines ML, Robbins RJ. Inhibition of α2/α3 sodium pump isoforms potentiates glutamate neurotoxicity. Brain Res. 1992;591:94–102. doi: 10.1016/0006-8993(92)90982-f. [DOI] [PubMed] [Google Scholar]
- Cathala L, Holderith NB, Nusser Z, DiGregorio DA, Cull-Candy SG. Changes in synaptic structure underlie the developmental speeding of AMPA receptor-mediated EPSCs. Nat Neurosci. 2005;8:1310–1318. doi: 10.1038/nn1534. [DOI] [PubMed] [Google Scholar]
- de Carvalho Aguiar P, Sweadner KJ, Penniston JT, Zaremba J, Liu L, Caton M, Linazasoro G, Borg M, Tijssen MA, Bressman SB, Dobyns WB, Brashear A, Ozelius LJ. Mutations in the NKA α3 gene ATP1A3 are associated with rapid-onset dystonia parkinsonism. Neuron. 2004;43:169–175. doi: 10.1016/j.neuron.2004.06.028. [DOI] [PubMed] [Google Scholar]
- De Fusco M, Marconi R, Silvestri L, Atorino L, Rampoldi L, Morgante L, Ballabio A, Aridon P, Casari G. Haploin-sufficiency of ATP1A2 encoding the Na+/K+ pump α2 subunit associated with familial hemiplegic migraine type 2. Nat Genet. 2003;33:192–196. doi: 10.1038/ng1081. [DOI] [PubMed] [Google Scholar]
- Deng V, Matagne V, Banine F, Frerking M, Ohliger P, Budden S, Pevsner J, Dissen GA, Sherman LS, Ojeda SR. FXYD1 is an MeCP2 target gene overexpressed in the brains of Rett syndrome patients and Mecp2-null mice. Hum Mol Genet. 2007;16:640–650. doi: 10.1093/hmg/ddm007. [DOI] [PubMed] [Google Scholar]
- Derkach VA, Oh MC, Guire ES, Soderling TR. Regulatory mechanisms of AMPA receptors in synaptic plasticity. Nat Rev Neurosci. 2007;8:101–113. doi: 10.1038/nrn2055. [DOI] [PubMed] [Google Scholar]
- Dosemeci A, Tao-Cheng JH, Vinade L, Jaffe H. Preparation of postsynaptic density fraction from hippocampal slices and proteomic analysis. Biochem Biophys Res Commun. 2006;339:687–694. doi: 10.1016/j.bbrc.2005.11.069. [DOI] [PubMed] [Google Scholar]
- Elvira G, Wasiak S, Blandford V, Tong XK, Serrano A, Fan X, del Rayo Sánchez-Carbente M, Servant F, Bell AW, Boismenu D, Lacaille JC, McPherson PS, DesGroseillers L, Sossin WS. Characterization of an RNA granule from developing brain. Mol Cell Proteomics. 2006;5:635–651. doi: 10.1074/mcp.M500255-MCP200. [DOI] [PubMed] [Google Scholar]
- Geering K. FXYD proteins: new regulators of Na-K-ATPase. Am J Physiol Renal Physiol. 2006;290:F241–F250. doi: 10.1152/ajprenal.00126.2005. [DOI] [PubMed] [Google Scholar]
- Grill B, Wilson GM, Zhang KX, Wang B, Doyonnas R, Quadroni M, Schrader JW. Activation/division of lymphocytes results in increased levels of cytoplasmic activation/proliferation-associated protein-1: prototype of a new family of proteins. J Immunol. 2004;172:2389–2400. doi: 10.4049/jimmunol.172.4.2389. [DOI] [PubMed] [Google Scholar]
- Huang DW, Sherman BT, Lempicki RA. Systematic and integrative analysis of large gene lists using DAVID Bioinformatics Resources. Nat Protoc. 2009;4:44–57. doi: 10.1038/nprot.2008.211. [DOI] [PubMed] [Google Scholar]
- Irvine K, Stirling R, Hume D, Kennedy D. Rasputin, more promiscuous than ever: a review of G3BP. Int J Dev Biol. 2004;48:1065–1077. doi: 10.1387/ijdb.041893ki. [DOI] [PubMed] [Google Scholar]
- Jin P, Zarnescu DC, Ceman S, Nakamoto M, Mowrey J, Jongens TA, Nelson DL, Moses K, Warren ST. Biochemical and genetic interaction between the fragile X mental retardation protein and the microRNA pathway. Nat Neurosci. 2004;7:113–117. doi: 10.1038/nn1174. [DOI] [PubMed] [Google Scholar]
- Ju W, Morishita W, Tsui J, Gaietta G, Deerinck TJ, Adams SR, Garner CC, Tsien RY, Ellisman MH, Malenka RC. Activity-dependent regulation of dendritic synthesis and trafficking of AMPA receptors. Nat Neurosci. 2004;7:244–253. doi: 10.1038/nn1189. [DOI] [PubMed] [Google Scholar]
- Kanai Y, Dohmae N, Hirokawa N. Kinesin transports RNA: isolation and characterization of an RNA-transporting granule. Neuron. 2004;43:513–525. doi: 10.1016/j.neuron.2004.07.022. [DOI] [PubMed] [Google Scholar]
- Katsafanas GC, Moss B. Vaccinia virus intermediate stage transcription is complemented by Ras-GTPase-activating protein SH3 domain-binding protein (G3BP) and cytoplasmic activation/proliferation-associated protein (p137) individually or as a heterodimer. J Biol Chem. 2004;279:52210–52217. doi: 10.1074/jbc.M411033200. [DOI] [PubMed] [Google Scholar]
- Kelleher RJ, 3rd, Govindarajan A, Tonegawa S. Translational regulatory mechanisms in persistent forms of synaptic plasticity. Neuron. 2004;44:59–73. doi: 10.1016/j.neuron.2004.09.013. [DOI] [PubMed] [Google Scholar]
- Kiebler MA, Bassell GJ. Neuronal RNA granules: movers and makers. Neuron. 2006;51:685–690. doi: 10.1016/j.neuron.2006.08.021. [DOI] [PubMed] [Google Scholar]
- Kiedrowski L, Czyz A, Baranauskas G, Li XF, Lytton J. Differential contribution of plasmalemmal Na+/Ca2+ exchange isoforms to sodium-dependent calcium influx and NMDA excitotoxicity in depolarized neurons. J Neurochem. 2004;90:117–128. doi: 10.1111/j.1471-4159.2004.02462.x. [DOI] [PubMed] [Google Scholar]
- Kindler S, Wang H, Richter D, Tiedge H. RNA transport and local control of translation. Annu Rev Cell Dev Biol. 2005;21:223–245. doi: 10.1146/annurev.cellbio.21.122303.120653. [DOI] [PMC free article] [PubMed] [Google Scholar]
- Klann E, Dever TE. Biochemical mechanisms for translational regulation in synaptic plasticity. Nat Rev Neurosci. 2004;5:931–942. doi: 10.1038/nrn1557. [DOI] [PubMed] [Google Scholar]
- Krichevsky AM, Kosik KS. Neuronal RNA granules: a link between RNA localization and stimulation-dependent translation. Neuron. 2001;32:683–696. doi: 10.1016/s0896-6273(01)00508-6. [DOI] [PubMed] [Google Scholar]
- Lawrence JJ, Trussell LO. Long-term specification of AMPA receptor properties after synapse formation. J Neurosci. 2000;20:4864–4870. doi: 10.1523/JNEUROSCI.20-13-04864.2000. [DOI] [PMC free article] [PubMed] [Google Scholar]
- Lüscher C, Xia H, Beattie EC, Carroll RC, von Zastrow M, Malenka RC, Nicoll RA. Role of AMPA receptor cycling in synaptic transmission and plasticity. Neuron. 1999;24:649–658. doi: 10.1016/s0896-6273(00)81119-8. [DOI] [PubMed] [Google Scholar]
- Mark RJ, Hensley K, Butterfield DA, Mattson MP. Amyloid β-peptide impairs ion-motive ATPase activities: evidence for a role in loss of neuronal Ca2+ homeostasis and cell death. J Neurosci. 1995;15:6239–6249. doi: 10.1523/JNEUROSCI.15-09-06239.1995. [DOI] [PMC free article] [PubMed] [Google Scholar]
- Martin KC, Barad M, Kandel ER. Local protein synthesis and its role in synapse-specific plasticity. Curr Opin Neurobiol. 2000;10:587–592. doi: 10.1016/s0959-4388(00)00128-8. [DOI] [PubMed] [Google Scholar]
- McGrail KM, Phillips JM, Sweadner KJ. Immunofluorescent localization of three Na, K-ATPase isozymes in the rat central nervous system: both neurons and glia can express more than one Na, K-ATPase. J Neurosci. 1991;11:381–391. doi: 10.1523/JNEUROSCI.11-02-00381.1991. [DOI] [PMC free article] [PubMed] [Google Scholar]
- Reich CG, Mason SE, Alger BE. Novel form of LTD induced by transient, partial inhibition of the Na,K-pump in rat hippocampal CA1 cells. J Neurophysiol. 2004;91:239–247. doi: 10.1152/jn.00722.2003. [DOI] [PubMed] [Google Scholar]
- Shiina N, Shinkura K, Tokunaga M. A novel RNA-binding protein in neuronal RNA granules: regulatory machinery for local translation. J Neurosci. 2005;25:4420–4434. doi: 10.1523/JNEUROSCI.0382-05.2005. [DOI] [PMC free article] [PubMed] [Google Scholar]
- Solomon S, Xu Y, Wang B, David MD, Schubert P, Kennedy D, Schrader JW. Distinct structural features of Caprin-1 mediate its interaction with G3BP-1 and its induction of phosphorylation of eukaryotic translation initiation factor 2, entry to cytoplasmic stress granules, and selective interaction with a subset of mRNAs. Mol Cell Biol. 2007;27:2324–2342. doi: 10.1128/MCB.02300-06. [DOI] [PMC free article] [PubMed] [Google Scholar]
- Sossin WS, DesGroseillers L. Intracellular trafficking of RNA in neurons. Traffic. 2006;7:1581–1589. doi: 10.1111/j.1600-0854.2006.00500.x. [DOI] [PubMed] [Google Scholar]
- Sutton MA, Schuman EM. Dendritic protein synthesis, synaptic plasticity, and memory. Cell. 2006;127:49–58. doi: 10.1016/j.cell.2006.09.014. [DOI] [PubMed] [Google Scholar]
- Tomita S, Adesnik H, Sekiguchi M, Zhang W, Wada K, Howe JR, Nicoll RA, Bredt DS. Stargazin modulates AMPA receptor gating and trafficking by distinct domains. Nature. 2005;435:1052–1058. doi: 10.1038/nature03624. [DOI] [PubMed] [Google Scholar]
- Wang B, David MD, Schrader JW. Absence of Caprin-1 results in defects in cellular proliferation. J Immunol. 2005;175:4274–4282. doi: 10.4049/jimmunol.175.7.4274. [DOI] [PubMed] [Google Scholar]
- Wang W, van Niekerk E, Willis DE, Twiss JL. RNA transport and localized protein synthesis in neurological disorders and neural repair. Dev Neurobiol. 2007;67:1166–1182. doi: 10.1002/dneu.20511. [DOI] [PubMed] [Google Scholar]
- Yamaguchi K, Tanaka M, Mizoguchi A, Hirata Y, Ishizaki H, Kaneko K, Miyoshi J, Takai Y. A GDP/GTP exchange protein for the Rab3 small G protein family up-regulates a postdocking step of synaptic exocytosis in central synapses. Proc Natl Acad Sci U S A. 2002;99:14536–14541. doi: 10.1073/pnas.212511399. [DOI] [PMC free article] [PubMed] [Google Scholar]
- Zekri L, Chebli K, Tourrière H, Nielsen FC, Hansen TV, Rami A, Tazi J. Control of fetal growth and neonatal survival by the RasGAP-associated endonuclease G3BP. Mol Cell Biol. 2005;25:8703–8716. doi: 10.1128/MCB.25.19.8703-8716.2005. [DOI] [PMC free article] [PubMed] [Google Scholar]
- Zhang D, Hou Q, Wang M, Lin A, Jarzylo L, Navis A, Raissi A, Liu F, Man HY. Na,K-ATPase activity regulates AMPA receptor turnover through proteasome-mediated proteolysis. J Neurosci. 2009;29:4498–4511. doi: 10.1523/JNEUROSCI.6094-08.2009. [DOI] [PMC free article] [PubMed] [Google Scholar]
- Zhong J, Zhang T, Bloch LM. Dendritic mRNAs encode diversified functionalities in hippocampal pyramidal neurons. BMC Neurosci. 2006;7:17. doi: 10.1186/1471-2202-7-17. [DOI] [PMC free article] [PubMed] [Google Scholar]