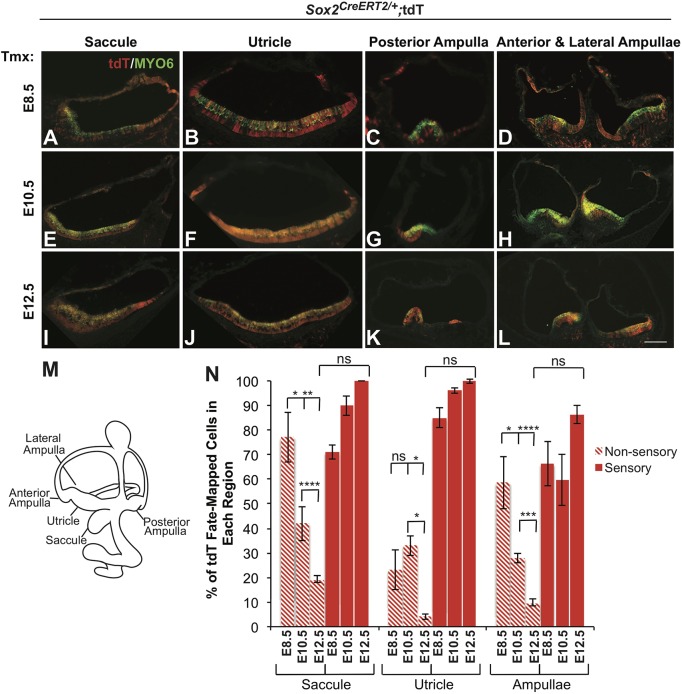
Fig. 2.
SOX2-expressing cells contribute initially to both sensory and nonsensory regions in the vestibule, but later are specific to the sensory regions. (A-L) Cross-sections through the E18.5 vestibular regions showing tdT/SOX2 expression and hair cell labeling (MYO6). (A-D) E8.5 tdT/SOX2-expressing cells (red) contributed widely to both nonsensory tissue and sensory regions (marked by MYO6, green). (E-H) The extent of E10.5 tdT/SOX2-expressing cells marking nonsensory tissue was reduced, and more cells contributed to the sensory regions. (I-L) E12.5 tdT/SOX2 fate-mapped cells almost exclusively contributed to the sensory regions in the vestibule. (M) Illustration of the vestibular regions shown in cross-section. (N) Quantification of the area of tdT/SOX2 expression in nonsensory and sensory regions over time showed a substantial contribution of SOX2 to vestibular nonsensory regions that decreased over time; by contrast, labeling in the sensory regions increased over time and became specific to these regions. No significant difference was detected in sensory tdT/SOX2 in the vestibule over time. Comparison of nonsensory tdT/SOX2 in the saccule: E8.5-E10.5, *P<0.05; E8.5-E12.5, **P<0.001; E10.5-E12.5, ****P<0.0001. Comparison of nonsensory tdT/SOX2 in the utricle: E8.5-E10.5, ns; E8.5-E12.5, *P<0.05; E10.5-E12.5, *P<0.05. Comparison of nonsensory tdT/SOX2 in the ampullae: E8.5-E10.5, **P<0.001; E8.5-E12.5, ****P<0.0001; E10.5-E12.5, ***P<0.001. Significance determined using a two-tailed Student's t-test. Data are mean±s.e.m. ns, not significant. Scale bar: 100 µm.

