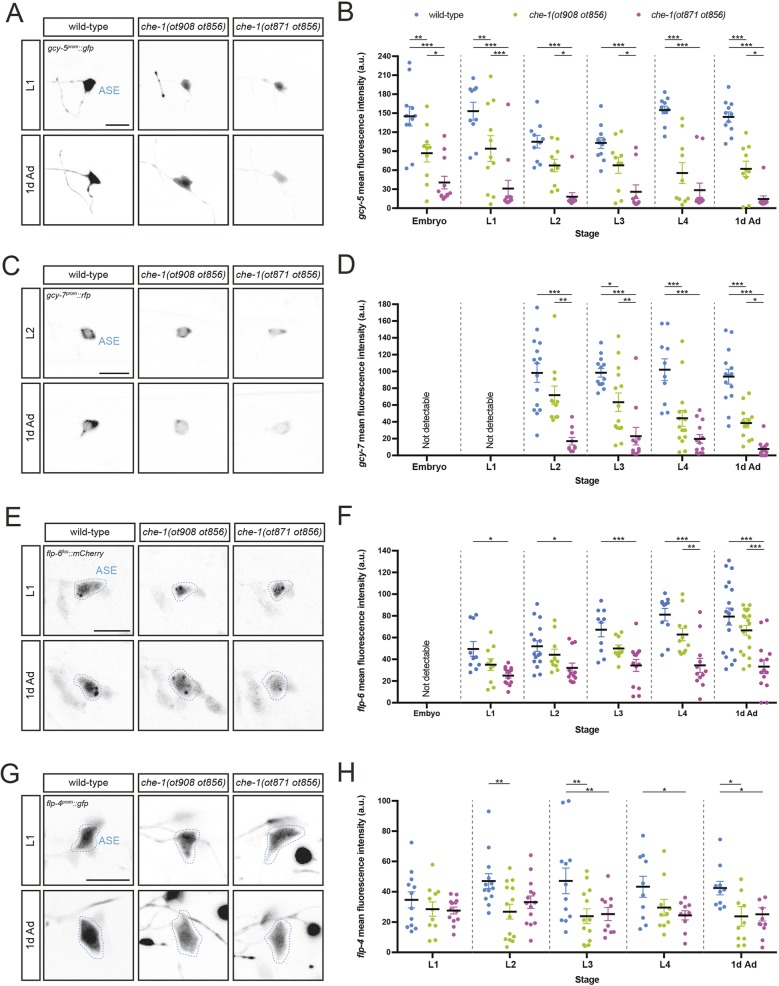
Fig. 2.
che-1 autoregulation is required to adopt and to maintain the differentiated state, as determined by marker gene analysis. (A,C,E,G) Expression of reporters gcy-5prom::gfp [ntIs1] (A), gcy-7prom::rfp [otIs131] (C) flp-6fos::mCherry [otIs494] (E) and flp-4prom::gfp [ynIs30] (G) in wild-type (left), che-1(ot908 ot856) (middle column) or che-1(ot871 ot856) (right) at the L1 or L2 larval stage (for gcy-7prom::rfp, L2 images are shown as expression is not consistently detected at L1) (top) and 1-day-old adult stage (1d Ad) worms (bottom). Lateral views of the head are shown. Scale bars: 10 µm. (B,D,F,H) Quantification of gcy-5prom::gfp (B), gcy-7prom::rfp (D), flp-6fos::mCherry (F) and flp-4prom::gfp (H) fluorescence intensity in wild type, che-1(ot908 ot856) and che-1(ot871 ot856) mutants. Fluorescence intensity was analyzed at different embryonic, larval and adult stages: threefold embryos (embryo); worm larvae at the first (L1), second (L2), third (L3) and fourth (L4) larval stages; and 1-day-old adult (1d Ad) worms. The data in B,D,F,H are presented as individual values with each dot representing the expression level of one neuron with the mean±s.e.m. indicated. Two-way ANOVA followed by Tukey's multiple comparisons test; *P<0.05, **P<0.01, ***P<0.001. n≥10 for all genotypes. a.u., arbitrary units.

