

Abstract
Dicer-dependent noncoding RNAs, including microRNAs (miRNAs), play an important role in a modulation of translation of mRNA transcripts necessary for differentiation in many cell types. In vivo experiments using cell type-specific Dicer1 gene inactivation in neurons showed its essential role for neuronal development and survival. However, little is known about the consequences of a loss of miRNAs in adult, fully differentiated neurons. To address this question, we used an inducible variant of the Cre recombinase (tamoxifen-inducible CreERT2) under control of Camk2a gene regulatory elements. After induction of Dicer1 gene deletion in adult mouse forebrain, we observed a progressive loss of a whole set of brain-specific miRNAs. Animals were tested in a battery of both aversively and appetitively motivated cognitive tasks, such as Morris water maze, IntelliCage system, or trace fear conditioning. Compatible with rather long half-life of miRNAs in hippocampal neurons, we observed an enhancement of memory strength of mutant mice 12 weeks after the Dicer1 gene mutation, before the onset of neurodegenerative process. In acute brain slices, immediately after high-frequency stimulation of the Schaffer collaterals, the efficacy at CA3-to-CA1 synapses was higher in mutant than in control mice, whereas long-term potentiation was comparable between genotypes. This phenotype was reflected at the subcellular and molecular level by the elongated filopodia-like shaped dendritic spines and an increased translation of synaptic plasticity-related proteins, such as BDNF and MMP-9 in mutant animals. The presented work shows miRNAs as key players in the learning and memory process of mammals.
Introduction
The function of neurons is achieved via their high number of connections with other neurons in the network. The average number of synapses formed by a single neuron in the mouse cortex reaches several thousands. This extremely elaborated neuronal connectivity is capable of generating different patterns of network activity, e.g., by enhancing or weakening a single or multiple synapses. These phenomena are believed to underlie memory formation.
Synaptic plasticity relies on functional and structural modifications of synapses in response to a variety of stimuli. It requires new substrates, i.e., proteins to be produced at different stages of memory formation (Davis and Squire, 1984). The local protein translation in dendrites allows neurons to selectively rebuild only those synapses that have been activated (Martin et al., 2000; Sutton and Schuman, 2006). Components of the protein synthesis machinery such as polyribosomes have been found in dendrites, close to synaptic sites (Steward and Levy, 1982; Ostroff et al., 2002). Moreover, a whole spectrum of mRNAs is transported to dendrites (Bramham and Wells, 2007), and neurons contain specialized ribonucleoprotein P-body-like particles that contain translationally silenced mRNAs (Cougot et al., 2008). However, the mechanism for regulation of activity-dependent mRNA release and translation remains incompletely understood, particularly in the brain.
MicroRNAs (miRNAs) are a class of short noncoding RNAs (Bartel, 2004) that are capable of regulating mRNA translation by various mechanisms (Filipowicz et al., 2008). Therefore, they can be used as elements for the regulation of plasticity-related mRNAs by neurons (Kosik, 2006; Schratt, 2009). A crucial role of miRNAs for neuronal differentiation and survival has been proved by removal of Dicer (Kim et al., 2007; Schaefer et al., 2007; Cuellar et al., 2008; Davis et al., 2008), a RNaseIII enzyme responsible for producing the mature form of miRNAs. However, all these studies were performed with a constitutive Cre/loxP system, in which Cre expression and subsequent Dicer mutations occur relatively early during neuronal differentiation processes.
Here we present a mouse model with an inducible disruption of the Dicer1 gene in the adult forebrain. We used this mutation to study in vivo the impact of Dicer-dependent noncoding RNAs on neuronal plasticity and memory formation, with a special focus on miRNAs. We addressed the question whether the removal of regulation of local protein synthesis increases the translation of plasticity-related mRNAs and makes synapses more prone for modulation of activity.
Materials and Methods
Animals
Mice with disruption of the Dicer1 gene in forebrain neurons of Dicer1CaMKCreERT2 (mutant mice) were used. As a control, we used littermates negative for the CreERT2 transgene (Dicerfl/fl, control mice). An induction of the Dicer1 gene mutation was obtained by injection of 1 mg of tamoxifen twice per day for 5 consecutive days in 8- to 10-week-old animals.
miRNA profiling and TaqMan analysis
We performed miRNA profiling (518 miRNAs in total) using the TaqMan MicroRNA Array version 2.0 method in the hippocampus isolated RNA (mirVana miRNA Isolation kit; Ambion) of mice 4 and 9 weeks after induction of mutation according to the protocol of the manufacturer. For Dicer mRNA detection, TaqMan probe (Mm00521730_m1; Applied Biosystems) was used, recognizing exons deleted in the Dicer1 gene mutants.
Behavioral tests
Behavioral tests were performed on 9 mutants and 14 control littermate females on a C57BL background in two independent groups. Five weeks after tamoxifen treatment, mice were subjected to the Morris water maze procedure lasting 1 week. Next, the main battery of behavioral tasks was performed from 10 to 12 weeks after tamoxifen treatment in the following sequence: rotarod, open field, elevated plus maze, Morris water maze (second time), IntelliCage, and trace fear conditioning.
Rotarod test.
After 2 d adaptation to immobile and turning with constant-speed rotarod (27 cm above a floor; TSE Systems), motor coordination and balance were tested on the third day. Each mouse was given three trials on the rod rotating with increasing speed from 4 to 40 rpm, and their latencies to fall (seconds) were measured by software supplied by TSE Systems.
Open-field test.
Mice were exposed for 5 min to a gray round arena (60 cm in diameter) surrounded by high walls (30 cm high). The floor of the apparatus was divided to 12 outer zones and four inner zones, and the number of squares crossed and the time spent in the center of the apparatus were measured by the automated tracking system EthoVision (Noldus Information Technology).
Elevated plus maze.
The apparatus consisted of four arms (30 × 5.5 cm), two opposing open arms (surrounded by a 5 mm tape), an open area in the center (5.5 cm), and two closed arms (17-cm-high wall), elevated 63 cm above the floor. Mice were placed in the center of the elevated plus maze, and the time spent in each zone was recorded in a 5 min test by the EthoVision system.
Morris water maze.
In a 1.4-m-diameter circular white pool, mice were at first subjected to the cued-navigation task to the platform (15 cm high, 11.5 × 11.5 cm) marked by a high black indicator. Then, the animals were trained to locate the platform submerged 1.5 cm beneath the surface of water (24–27°C), with maximum trial duration of 60 and 60 s on the platform at the end of trials. Mice received four trials per day for 4 consecutive days and the probe trial on the day 5. During the test, the platform was removed, and the memory of platform position was evaluated by putting a mouse to opposite quadrant to platform quadrant. Swim paths were monitored by the EthoVision system.
IntelliCage system.
The behavior of mice living in social groups (11–12 animals per cage) was automatically recorded for 10 d in the IntelliCage system (NewBehavior Inc.). An individual mouse was recognized by implanted transponder (microchip of 11.5 mm length, 2.2 mm diameter; Trovan) when entering one of four corners. Each computer-controlled corner contained two bottles (Knapska et al., 2006). The experiments started from an adaptation period with ad libitum access to plain water in all the corners. For the next 3 d, mice were exposed to sweetened water (10% sucrose in water) to measure water intake and to develop a preference for sugar water. For each mouse, the least preferred corner was chosen, and, for the next 4 d, the mouse could obtain access to sugar water only in the corner (“correct corner”). Place learning was assessed as a ratio of number of visits in correct corner to all corners. Plain water was accessible ad libitum from the top of a cage.
Trace fear conditioning.
A modified (Crestani et al., 2002) procedure was used. Mice were exposed for a 3 min adaptation to the experimental chamber (25 cm width × 25 cm depth × 25 cm height; Med Associates Inc.) where they received three consecutive pairs of tone and shock with an empty trace interval of 1 s and a break between each pair of 3 min (tone, 80 dB, 1 kHz, 10 s; footshock, 0.5 mA, 1 s). Forty-eight hours later, freezing was recorded in a new context with the same sound but without shock (“trace fear conditioning”). Five days after training, the level of freezing was measured in the training context (“context conditioning”).
Electrophysiology
Extracellular field EPSPs (fEPSPs) were monitored in the stratum radiatum of hippocampal slices. Synaptic stimulation, adjustment of stimulation strength, tetanization, and assessment of synaptic efficacy were done as described previously (Köhr et al., 2003).
Morphological and molecular studies
For classification of dendritic spines in CA1 hippocampal neurons, a random dendrite labeling with the gene-gun-propelled lipophilic fluorescent dye (DiI)-coated tungsten particles (DiOlistic method) was performed. To reveal the morphology of CA1 neurons, biocytin (Fluka) was dialyzed into the cell via the patch pipette in 300-μm-thick sections. Next, slices were fixed overnight with 4% paraformaldehyde and stained with streptavidin Alexa Fluor 555 conjugate (1:50; Invitrogen) and with the presynaptic marker anti-bassoon antibody (1:100; Synaptic System) according to Wilczynski et al. (2008). For spine analysis, two-channel image stacks of the whole dendritic segments were acquired by sequential scanning at the resolution of 70 nm, using a 63× (1.4 numerical aperture) objective at the Leica TCS SP5 confocal system. Images were deconvolved using maximum-likelihood algorithm of the Huygens software and subjected to three-dimensional reconstruction using Imaris. Sholl analysis was performed using NIH ImageJ with NeuronJ and Sholl plugin. The statistical analysis was performed by repeated-measures ANOVA, using Statistica software (StatSoft).
The following antibodies were used: anti-Dicer (D-349 Rb, 1:1000; provided by Dr. W. Filipowicz, Friedrich Miescher Institute, Basel, Switzerland), anti-BDNF (sc-546, 1:500; Santa Cruz Biotechnology), anti-PSD95 (ab18258, 1:1000; Abcam), anti-GluR1 (1:1000; Millipore Corporation), anti-GluR2 (Ms), anti-β-dystroglycan (β-DG) (NCL-b-DG, 1:500; Novocastra), anti-glyceraldehyde-3-phosphate dehydrogenase (MAB374, 1:2000; Millipore Bioscience Research Reagents), and anti-neuronal-specific nuclear protein (NeuN) (MAB377, 1:1000; Millipore Bioscience Research Reagents) to detect protein levels in the hippocampus of mutant and control mice by a standard Western blot analysis. Additionally, the MMP-9 activity was checked by the gel zymography technique (Michaluk et al., 2007).
In situ hybridization, fluorescent in situ hybridization, immunofluorescence, and terminal deoxynucleotidyl transferase-mediated biotinylated UTP nick end labeling staining
For in situ hybridization with colorimetric substrate, a modified protocol was used (Pena et al., 2009). For fluorescent in situ hybridization and immunofluorescence antigen retrieval, crosslinking and acetylation was omitted. Hybridization conditions for the Dicer1 locked nucleic acid probe were adjusted to 60 nm concentration at 51°C overnight. Dendrites were stained by antibody against MAP-2 (1:200; Millipore Corporation). Images were taken in the Application Centre of Carl Zeiss in the German Cancer Research Center using the Axio Observer.Z1 confocal microscopy system. Terminal deoxynucleotidyl transferase-mediated biotinylated UTP nick end labeling (TUNEL) staining was performed according to the instructions of the manufacturer (in situ cell-death detection kit, POD; Roche). To quantify a neurodegeneration level in mutant animals, paraffin sections of brains collected at different time points after induction of recombination were stained with an antibody against the neuronal marker NeuN (MAB377, 1:400; Millipore Corporation) and the nuclear dye 4′,6′-diamidino-2-phenylindole (DAPI). Corresponding sections were selected, and neuronal nuclei in defined areas of a constant size and position in either CA1 or cortex were counted (blind to genotype). Three to eight animals were analyzed per genotype and time point after induction of mutation.
Prediction of miRNAs targeting plasticity-related genes
To predict miRNAs targeting the 3′ untranslated region (UTR) of the target gene with maximal sensitivity, we used a union of multiple prediction algorithms, namely TargetScan, PITA, and RNA22. We included a miRNA if one of the tools predicted at least one target in a set of plasticity-related mRNAs. Finally, a list of predicted miRNAs was filtered based on results from miRNA profiling (TaqMan MicroRNA Array version 2.0). The number of miRNA binding sites in target mRNA was predicted by PITA.
Statistical analysis
All behavioral evaluations were made with Statistica 6.0 (StatSoft). One-way ANOVA was used for the Morris water maze test, rotarod, elevated plus maze, and sweet-water intake in IntelliCage. For multiple comparisons (IntelliCage, fear conditioning) both one-way ANOVAs and two-way repeated measures ANOVAs were performed. Significant group effects were further analyzed using post hoc Bonferroni's test. In all group comparisons, p < 0.05 was used as significance threshold, and all results were illustrated in GraphPad Prism (GraphPad Software) and were expressed in bars, and line graphs represent the mean ± SEM. For statistical analysis of biochemical, morphological, and electrophysiological results, the following tests were applied: one-way ANOVA, unpaired one-sided t test, and two-tailed, unpaired Student's t test.
Results
Loss of Dicer1 gene and miRNAs in Dicer1CaMKCreERT2 mutant mice
We crossbred the CaMKCreERT2 BAC mouse line (Erdmann et al., 2007; Parlato et al., 2008) expressing the tamoxifen-inducible form of Cre recombinase with the Dicerfl/fl mouse line (Cobb et al., 2005) to obtain mutant mice (abbreviated here as DicerCaMKCreERT2 or mutant mice) lacking the Dicer1 gene exclusively in adult forebrain neurons. The Dicer1 gene remained intact during mouse development, and its deletion was initiated by tamoxifen administration in 8- to 10-week-old adult animals. In this way, we avoided the lethality of mice that occurs when the Dicer1 gene is deleted in these neurons during development (Davis et al., 2008).
A 60% decrease in Dicer mRNA in the hippocampus of mutant compared with control mice 9 weeks after induction of Dicer ablation has been observed. This was followed by the same level of Dicer protein loss as shown by Western blot analysis (Fig. 1A). In mutants, a Dicer mRNA signal was still observed in dendritic layers, e.g., stratum radiatum of the hippocampus. This signal did not colocalize with the dendritic marker MAP-2, thus indicating non-neuronal characteristics of these cells (Fig. 1B).
Figure 1.
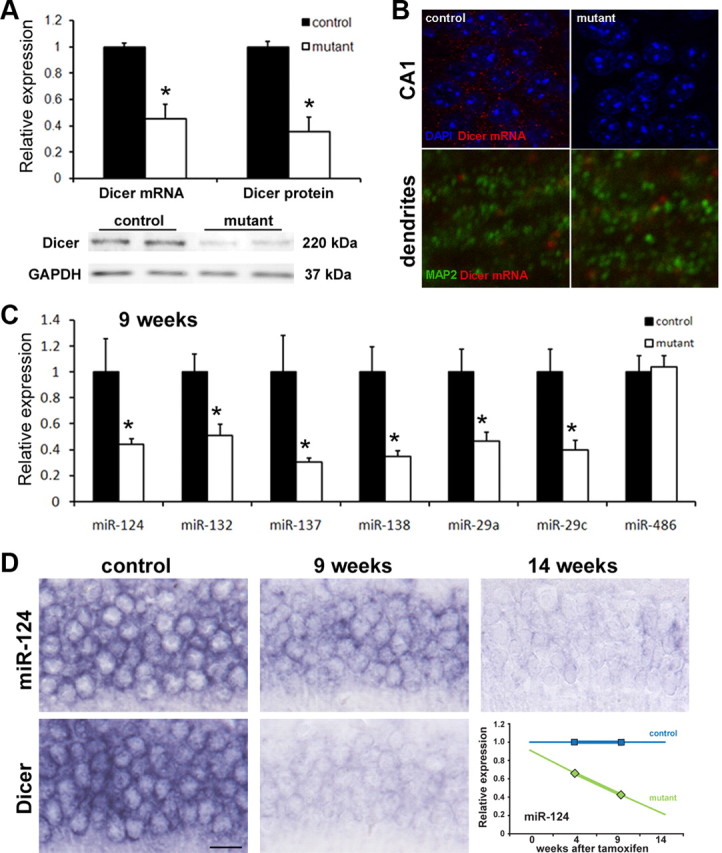
Loss of Dicer1 gene and miRNAs in Dicer1CaMKCreERT2 mutant mice. A, Levels of Dicer mRNA and protein in the hippocampus of mutant mice 9 weeks after induction of the Dicer1 gene mutation with tamoxifen (n = 4, *p < 0.05). B, Fluorescent in situ hybridization for Dicer mRNA in CA1 pyramidal cell layer (top) and dendritic layer of CA1–stratum radiatum (bottom) 9 weeks after tamoxifen treatment. C, Relative levels of selected mature miRNAs by qRT-PCR (TaqMan MicroRNA Array version 2.0) 9 weeks after induction of the Dicer1 gene mutation. D, In situ hybridization for Dicer mRNA and miR-124 with locked nucleic acid probes done 9 and 14 weeks after induction of mutation. A chart shows measured (4 and 9 weeks after tamoxifen) and postulated decrease in miRNA levels (as an example, miR-124 is shown) after induction on the Dicer1 gene mutation. Data are shown as mean ± SEM. GAPDH, Glyceraldehyde-3-phosphate dehydrogenase.
To examine abundance of the mature form of miRNAs, we performed quantitative reverse transcription (qRT)-PCR analysis (TaqMan arrays, 518 mouse-specific miRNAs in total) on hippocampal samples at two different time points, 4 and 9 weeks after the Dicer1 gene inactivation. A total of 212 miRNAs showed expression value above negative control miRNA (from Arabidopsis thaliana, ath-miR-159). Supplemental Table 1 (available at www.jneurosci.org as supplemental material) shows 84 miRNAs that were downregulated progressively in mutant animals between 4 and 9 weeks. miRNAs such as miR-124, miR-132, miR-137, miR-138, miR-29a, and miR-29c, known to be expressed in neurons, showed a statistically significant decrease at 9 weeks of the expression level compared with the control (Fig. 1C). Others, like miR-486, did not differ between the two genotypes. In situ hybridization detection of miR-124 confirmed its only partial loss at 9 weeks after setting the Dicer mutation (Fig. 1D).
In the previously described constitutive Dicer1CaMKCre line, Davis et al. (2008) reported massive apoptosis in the brain shortly after birth. In our inducible Dicer1CaMKCreERT2 line, we did not observe neuronal death sooner than 14 weeks after Dicer1 gene loss (Fig. 2). A cumulative neuronal cells loss between 14 and 20 weeks after induction of Dicer1 gene deletion was 63 and 26% for the CA1 area of hippocampus and cortex, respectively (Fig. 2B).
Figure 2.
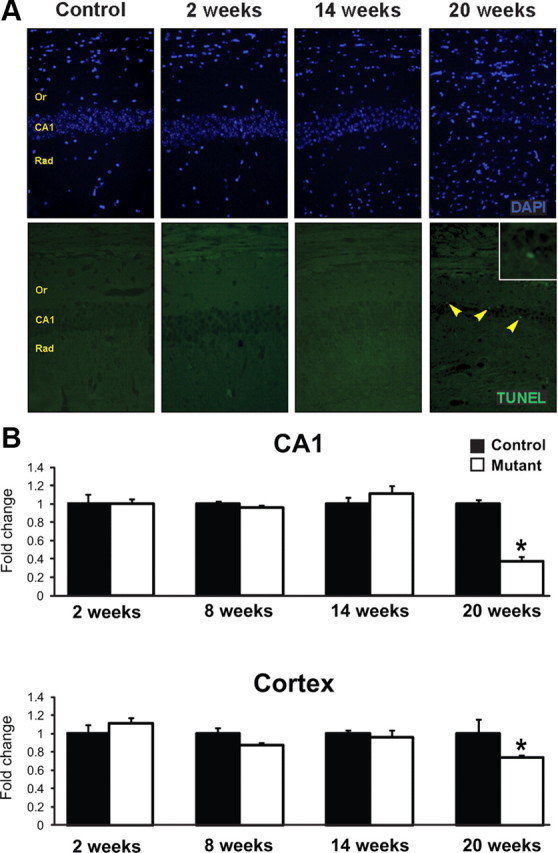
Neuronal death in the hippocampus and cortex in Dicer1CaMKCreERT2 mutant mice. A, Detection of neuronal cell death (TUNEL staining; bottom row) in the CA1 area of the hippocampus of control and mutant mice 2, 14, and 20 weeks after induction of Dicer1 gene mutation. Arrowheads indicate dying cells (in green). Morphology of nuclei is shown by DAPI staining (top row). CA1, Pyramidal cell layer; Or, stratum oriens; Rad, stratum radiatum. B, Quantification of cell number in CA1 region of the hippocampus and the cortex. Number of cell nuclei in defined area were counted and expressed as fold change to control (n = 3–8, *p < 0.05). Data are shown as mean ± SEM.
miRNAs loss in the forebrain of adult mice results in improved learning and memory
The Dicer1 gene mutation in neurons had no effect on overall motor activity and coordination as tested by the rotarod test, circadian activity, reaction to a new environment, exploration in the open-field test, and level of anxiety (tested by elevated plus maze) (Fig. 3). All behavioral procedures were performed on females.
Figure 3.

Normal motor activity, exploration, and anxiety in new environment in Dicer1CaMKCreERT2 mutant mice. A, Time to fall off rod rotating with increasing speed. The rotarod test revealed similar motor coordination and balance of mutant mice and their control littermates (F(1,22) = 0.482; p = 0.495). B, Number of squares crossed in the open-field test. Five minutes of activity did not differ between genotypes because both groups moved comparable distance (data not shown) and crossed similar number of squares (F(1,22) = 0.534; p = 0.473). C, Relative time (percentage) spent in zones of the elevated plus maze. Mutant and control mice explored the open arms of apparatus for most of the time (F(1,22) = 0.307; p = 0.585). Time in center zone (F(1,22) = 2.007; p = 0.171) and in closed arms (F(1,22) = 0.022; p = 0.883) showed no difference in anxiety level. D, During adaptation to sweetened water in IntelliCage, mice of both genotypes spent similar time drinking water (F(1,21) = 0.073; p = 0.789). E, Basal home cage circadian activity measured as an average number of visits from 7 d in each hour showed normal higher activity in active phase and lower activity in inactive phase in mice of both genotypes (F(1,21) = 0.632; p = 0.436). Data are shown as mean ± SEM.
We tested hippocampus-dependent spatial memory in the Morris water maze test (Morris et al., 1982) in the same mice at 5 and 12 weeks after induction of the Dicer1 gene mutation. Interestingly, a genotype-related enhancement of memory of the target quadrant location was observed in mutant animals at 12 weeks (Fig. 4A). This observation indicated that the remaining miRNAs levels 5 weeks after Dicer1 gene mutation (Fig. 1) were sufficient to sustain their function in the mutated cells. Therefore, the following behavioral experiments were performed with mice 12 or more weeks after setting the mutation.
Figure 4.

miRNAs loss in the forebrain of adult mice enhances learning and memory. A, Spatial learning task in the Morris water maze 5 and 12 weeks after the Dicer1 gene disruption. Relative time spent in the target quadrant (TQ) containing a hidden platform and an average of other quadrants is shown. Memory test, 24 h after the last training day, showed an enhanced memory for platform location in mutant compared with control mice (F(1,22) = 8.355; **p < 0.01) only in tests performed 12 weeks after induction of mutation. Randomness level (25%) is indicated by dotted line. B, Place learning with appetitive reinforcement in IntelliCage. Ratio (percentage) of visits in correct corner to visits in all other corners in the IntelliCage. Before the task, the least preferred corner was chosen for every individual mouse (24 h before, F(1,20) = 1.003; p = 0.328). In the subsequent days, mutant mice developed much higher preference to correct corner (days 1–4, F(1,20) = 4.925; *p < 0.05; **p < 0.01). C, Trace fear conditioning memory test. At 48 h after training, mutant mice displayed a higher freezing response compared with control animals (F(1,21) = 4.775; *p < 0.05; ***p < 0.001) in new context; trace, 1 min interval including 10 s CS (tone) and freezing was measured for the next 50 s corresponding to a trace and US (shock) in training; ITI, 3 min intertrial interval between CS presentations. D, Context memory test. The level of freezing (percentage) was assessed in re-exposition to the training context 5 d after training. Mutant mice showed no decline in freezing behavior across 6 min of exposure to the same context (F(1,21) = 7.674; *p < 0.05). Data are shown as mean ± SEM.
We continued memory tests in the IntelliCage system that allows for automated monitoring of mouse behavior in a social context. Mice were adapted to a new environment of the apparatus and to drinking sweet water. For each mouse, the least preferred corner was determined, and subsequently only this corner was available while the access to the other corners was blocked (Knapska et al., 2006). Initially, control and mutant mice developed a preference for the corner with sweet water at similar level. However, during the following days, mutant mice achieved significantly higher number of visits in the corner with appetitive reinforcement compared with control mice (Fig. 4B). Thus, mutant mice performed better in place learning tasks in both the IntelliCage system and in the Morris water maze.
Next we subjected the mice to the hippocampus-dependent fear conditioning tests, namely trace fear conditioning, to discrete auditory cues in a specific context (Crestani et al., 2002). The memory test for trace conditioning was conducted 48 h after the training session. A comparison of the freezing scores revealed that mutants remembered the conditioned stimulus (CS) (tone) predicting an unconditioned stimulus after the trace interval (US) (mild electric shock) significantly better than controls (Fig. 4C). Similarly, mutant mice exhibited robust, significantly higher freezing in response to the training context as revealed by the test performed 5 d after training in the same learning chamber (Fig. 4D). In mutant mice, freezing remained at a similar level during 6 min of the test, whereas control mice showed a tendency to diminish their response over time. The results of the aforementioned tests clearly indicate that mutant mice develop much stronger CS–US association compared with controls.
Synaptic transmission and plasticity in the hippocampus
In acute hippocampal slices of control and mutant mice, stimulation of the Schaffer collaterals with increasing intensities evoked increasing negative fEPSPs in the stratum radiatum of area CA1. These experiments indicated that basal synaptic transmission at CA3-to-CA1 synapses is comparable between control and mutant mice (Fig. 5A).
Figure 5.

Synaptic transmission and plasticity in hippocampal slices. A, Left, Representative fEPSPs recorded in area CA1 of both genotypes when stimulating Schaffer collaterals with increasing stimulation intensities. Right, Input/output relationships 12–15 weeks after induction of the Dicer mutation (each n = 3). B, At 5–6 weeks after induction of mutation, tetanic stimulation [i.e., high-frequency stimulation (HFS)] induced PTP (control, 1.88 ± 0.08, n = 8 slices from 4 mice; mutant, 1.94 ± 0.11, n = 8 slices from 4 mice; p = 0.59) and LTP (control, 1.29 ± 0.05, n = 8 slices from 4 mice; mutant, 1.34 ± 0.08, n = 8 slices from 4 mice; p = 0.62). Bottom, Expanded time course. C, At 12–15 weeks after induction of mutation, PTP was higher in the mutant than in control (PTP: control, 1.76 ± 0.10, n = 8 slices from 3 mice; mutant, 2.39 ± 0.14, n = 8 slices from 3 mice; p < 0.01; LTP: control, 1.34 ± 0.05, n = 8 slices from 3 mice; mutant, 1.39 ± 0.08, n = 8 slices from 3 mice; p = 0.6). D, At 12–15 weeks after induction of mutation, repeated HFS induced higher PTP each time after HFS, but LTP remained comparable in both genotypes (control, 1.84 ± 0.1, n = 9 slices from 3 mice; mutant, 1.98 ± 0.13, n = slices from 3 mice; p = 0.41). In both genotypes, four times HFS induced higher LTP than single HFS (p < 0.05). The traces show the mean of 45 and 30 consecutive fEPSPs before and 40–50 min after single HFS in both genotypes, respectively. TAM, Tamoxifen.
Next, we tested the synaptic plasticity after tetanic stimulation (100 Hz, 1 s) of the Schaffer collaterals. In mice killed 5–6 weeks after tamoxifen treatment, tetanic stimulation potentiated fEPSPs in both genotypes with a comparable time course and to a similar extent, immediately after tetanization [first 3 min, i.e., posttetanic potentiation (PTP)] and 40–50 min after tetanization [i.e., long-term potentiation (LTP)] (Fig. 5B). In mice killed 12–15 weeks after tamoxifen treatment, PTP was enhanced in the mutant, whereas LTP was comparable between genotypes (Fig. 5C). Furthermore, we wondered whether repeated tetanization would lead to enhanced LTP in addition to enhanced PTP in the mutant. Four tetanic stimulations were delivered at 5 min intervals, and PTP after each tetanization was higher in the mutant than in the control (Fig. 5D). Forty to 50 min after the last of four tetanizations, LTP was similarly enhanced in both genotypes compared with single tetanization. Thus, lack of the Dicer1 gene for 12–15 weeks increases PTP without changing LTP.
Altered miRNA production leads to changes in morphology of dendritic spines and levels of synaptic proteins
The overall morphology of the dendritic tree was not changed in DicerCaMKCreERT2 mutant animals. Nevertheless, there is an interaction between the genotype and the distance from the soma, indicating that there is a shift in the neuronal arborization toward the more distal dendrites in mutant animals (Fig. 6C,D). Moreover, we observed a significantly higher number of longer, filopodia-shaped dendritic spines in mutants compared with the controls (Fig. 6A,B). These elongated spines possessed “heads” in the termini and preserved the functionality as shown by presynaptic marker Bassoon staining (Fig. 6A).
Figure 6.

Altered morphology of dendritic spines and the expression level of synaptic proteins in mutant animals. A, Three-dimensional reconstruction of dendrites from control and mutant animals 12 weeks after induction of the Dicer1 gene mutation. A visualization of synaptic connections by the presynaptic marker Bassoon (in blue). B, An increase in the length of dendritic spines in CA1 hippocampal neurons of Dicer1CaMKCreERT2 mutant mice compared with controls (control, n = 5; mutant, n = 6; average total length of analyzed dendrites per animal was 140 μm). C, Representative pictures showing morphology of control and mutant CA1 area neuron (filled with biocytin) 15 weeks after induction of the Dicer1 gene mutation. D, Sholl analysis of dendritic tree of CA1 neurons performed 15 weeks after induction. For analysis, all dendrites of individual neurons were traced, and statistical analysis was performed by repeated-measures ANOVA. There is no significant difference in dendritic tree arborization between control and mutant mice (p = 0.4; F(1,172) = 0.78). An interaction between the genotype and the distance from the soma (dependent variable categorical predictor, p < 0.01; F(1,172) = 1.53) indicates a shift in the neuronal arborization toward the more distal dendrites in mutants.
Modulation of the size of dendritic spines may result from changed translation of synaptic proteins. Hence, we determined, by Western blot analysis, the levels of several dendritically translated proteins, such as the neurotrophic factor BDNF, the synaptic plasticity-involved metalloproteinase MMP-9, the subunits of the AMPA receptor GluR1 and GluR2, and the PSD95 protein. All the protein levels were related to the neuronal marker NeuN. We observed an eightfold increase in the proBDNF level and twofold change in the mature form of this protein. Moreover, we detected a higher level of MMP-9 enzymatic activity and its cleavage product β-dystroglycan (30 kDa). Additionally, levels of synaptic proteins such as PSD95 and the ratio of GluR2 to GluR1 subunits were increased as well (Fig. 7A–C).
Figure 7.

Expression level of synaptic proteins in mutant animals. A, C, Relative protein levels of synaptic plasticity-related genes: proBDNF, BDNF, PSD95, GluR1, and GluR2 (control, n = 8; mutant, n = 5; *p < 0.05, ***p < 0.001). All values are presented in relation to the neuronal marker NeuN. B, Gel zymography for MMP-9 showing a level of the enzyme activity; Western blot showing representative samples for β-DG (MMP-9 substrate) cleavage. Quantification of a product of cleavage β-DG30 (control, n = 8; mutant, n = 5; *** p < 0.001). D, A table shows potential interacting pairs of miRNA–mRNA in synaptic plasticity-related genes. Colors represent number of predicted miRNA binding sites in target mRNA. Data are shown as mean ± SEM.
To identify miRNAs targeting the synaptic plasticity genes BDNF, MMP-9, PSD95, GluR1, and GluR2, we used multiple miRNA prediction algorithms. The list of predicted miRNAs was intersected with miRNA Taqman Array profiling data. We thus identified many potentially interacting pairs of miRNA–mRNA. Particularly in BDNF mRNA, we were able to predict many targeting miRNA, such as miR-138 and miR-384–5p, having more than one binding sites in the 3′ UTR (Fig. 7D). We also filtered miRNA Taqman Array profiling data based on their decrease in the relative expression between 4 and 9 weeks after the Dicer1 gene mutation (see miRNAs list in supplemental Table 1, available at www.jneurosci.org as supplemental material).
Discussion
In our study, we demonstrated an enhancement of cognition of adult Dicer1 mutant mice, lacking miRNAs in mature neurons in the adult brain compared with their control littermates, in a battery of both aversively and appetitively motivated cognitive tasks (Fig. 4) in a specific time window, i.e., 12 weeks after induction of the Dicer1 gene mutation. LTP at hippocampal CA1 synapses was comparable between genotypes, whereas PTP was enhanced in mutants (Fig. 5B–D). Moreover, a higher number of long filopodia-like spines in dendrites of mutant neurons may indicate that active remodeling of synapses in these animals could serve as a mechanism responsible for the improvement of memory (Fig. 6A,B), a notion that was postulated previously (Tada and Sheng, 2006; Bourne and Harris, 2008). Additionally, in these spines, we could observe head-like structures that colocalize with synaptic marker, which morphologically distinguishes them from immature filopodia and indicates that they are active ones. The same structure of spines was observed before and after Dicer1 gene deletion in neurons (Davis et al., 2008).
We demonstrate that, unexpectedly, miRNAs in mature neurons have a very slow turnover rate and are able to survive for several weeks. This conclusion is based on the time course of a whole set of miRNAs decreasing their levels, detected in miRNAs profiling experiments, at 4 and 9 weeks after Dicer1 gene deletion (supplemental Table 1, available at www.jneurosci.org as supplemental material). Our observation is in agreement with previously reported high miRNA stability in neurons, in which a delayed and progressive neurodegeneration process was explained by this phenomenon (Schaefer et al., 2007; Damiani et al., 2008). In the recent study (Krol et al., 2010), the authors were able to identify that, whereas approximately half of mature miRNA undergo fast turnover in neurons, the remaining miRNA pool is stable. In our experiments, compatible with the rather long half-life of miRNAs, we observed an improvement of learning displayed by mutant mice only at the later time point (12 weeks) after induction of the mutation (Fig. 4). It was shown previously that LTP is able to modulate expression level of specific miRNAs (Park and Tang, 2009). However, in our system, LTP level was not enhanced. Interestingly, the detection of increased cognitive function in the Dicer mutants coincided with the enhanced PTP in brain slices of the mutant mice. Thus, our mouse model may allow the search for a role of PTP in learning and memory.
There are a few thousand miRNA molecules per neuron (Kye et al., 2007), and it was shown in vitro that some of them, such as miR-138, regulate dendritic spine morphology by inhibiting translation of the synaptic protein acyl protein thioesterase APT1 in mouse hippocampal neurons (Siegel et al., 2009). Moreover, miR-124 was found to act as a negative regulator of sensorimotor synapses in Aplysia californica (Rajasethupathy et al., 2009). Furthermore, it has been postulated that miRNAs may inhibit dendritic translation of selective mRNAs (Kosik, 2006). Thus, removal of mature miRNAs should lead to facilitation of translation of targeted synaptic genes. In our studies, we indeed noticed increased levels of proteins known to be translated in dendrites such as BDNF and MMP-9. Interestingly, higher levels of proBDNF compared with mature BDNF indicate that, during miRNA removal, translation of proBDNF is facilitated rather than proteolytic conversion of proBDNF to BDNF (Fig. 7A). It is also of note that there is an intimate link between BDNF and MMP-9, because the latter was shown to be one of the metalloproteinases responsible for proBDNF cleavage in neuromuscular synapses (Yang et al., 2009). In Dicer1 mutant mice, MMP-9 activity, as measured by gel zymography and cleavage of its substrate β-dystroglycan (Michaluk et al., 2007), was also enhanced. Notably, MMP-9 mRNA was localized to the dendritic/synaptic compartment (Konopacki et al., 2007), and the pivotal role in synaptic plasticity and learning and memory was demonstrated (Nagy et al., 2006). Most importantly, both BDNF and MMP-9 have been shown to be able to shape synaptic morphology (An et al., 2008; Wang et al., 2008).
In the present study, we applied a global approach for interference with miRNA production (all Dicer-dependent miRNAs were removed) and have shown that, in a defined time window, they exert an influence on various components of synaptic plasticity. The complexity of the phenotype suggests that many miRNAs might be involved in the observed phenotype. As a future goal, we will define identification and verification of specific miRNA–mRNA interactions in vivo in the adult brain and their influence on neuronal circuits functioning.
Footnotes
This work was supported by the Deutsche Forschungsgemeinschaft through Collaborative Research Centres Sonderforschungsbereich 488 and 636, the European Union through Grant LSHM-CT-2005-018652 (CRESCENDO), the Bundesministerium für Bildung und Forschung through NGFNplus Grants FZK 01GS08153 and 01GS08142 and Project Number 0313074C (HepatoSys), the Helmholtz Gemeinschaft Deutscher Forschungszentren through Initiative CoReNe (Network II, E2) and Alliance HelMA (HA-215), and the Deutsche Krebshilfe through Project 108567 (all to G.S.). This work was also supported through European Union 7 FP PLASTICISE (L.K.). We thank Dr. Witold Filipowicz (Friedrich Miescher Institute, Basel, Switzerland) for providing the D349 Dicer antibody. We thank also Dr. Jacek Jaworski for providing access to Imaris software and Dr. Evgeni Nikolaev for his help in a statistical analysis.
References
- An JJ, Gharami K, Liao GY, Woo NH, Lau AG, Vanevski F, Torre ER, Jones KR, Feng Y, Lu B, Xu B. Distinct role of long 3′ UTR BDNF mRNA in spine morphology and synaptic plasticity in hippocampal neurons. Cell. 2008;134:175–187. doi: 10.1016/j.cell.2008.05.045. [DOI] [PMC free article] [PubMed] [Google Scholar]
- Bartel DP. MicroRNAs: genomics, biogenesis, mechanism, and function. Cell. 2004;116:281–297. doi: 10.1016/s0092-8674(04)00045-5. [DOI] [PubMed] [Google Scholar]
- Bourne JN, Harris KM. Balancing structure and function at hippocampal dendritic spines. Annu Rev Neurosci. 2008;31:47–67. doi: 10.1146/annurev.neuro.31.060407.125646. [DOI] [PMC free article] [PubMed] [Google Scholar]
- Bramham CR, Wells DG. Dendritic mRNA: transport, translation and function. Nat Rev Neurosci. 2007;8:776–789. doi: 10.1038/nrn2150. [DOI] [PubMed] [Google Scholar]
- Cobb BS, Nesterova TB, Thompson E, Hertweck A, O'Connor E, Godwin J, Wilson CB, Brockdorff N, Fisher AG, Smale ST, Merkenschlager M. T cell lineage choice and differentiation in the absence of the RNase III enzyme Dicer. J Exp Med. 2005;201:1367–1373. doi: 10.1084/jem.20050572. [DOI] [PMC free article] [PubMed] [Google Scholar]
- Cougot N, Bhattacharyya SN, Tapia-Arancibia L, Bordonné R, Filipowicz W, Bertrand E, Rage F. Dendrites of mammalian neurons contain specialized P-body-like structures that respond to neuronal activation. J Neurosci. 2008;28:13793–13804. doi: 10.1523/JNEUROSCI.4155-08.2008. [DOI] [PMC free article] [PubMed] [Google Scholar]
- Crestani F, Keist R, Fritschy JM, Benke D, Vogt K, Prut L, Blüthmann H, Möhler H, Rudolph U. Trace fear conditioning involves hippocampal alpha5 GABA(A) receptors. Proc Natl Acad Sci U S A. 2002;99:8980–8985. doi: 10.1073/pnas.142288699. [DOI] [PMC free article] [PubMed] [Google Scholar]
- Cuellar TL, Davis TH, Nelson PT, Loeb GB, Harfe BD, Ullian E, McManus MT. Dicer loss in striatal neurons produces behavioral and neuroanatomical phenotypes in the absence of neurodegeneration. Proc Natl Acad Sci U S A. 2008;105:5614–5619. doi: 10.1073/pnas.0801689105. [DOI] [PMC free article] [PubMed] [Google Scholar]
- Damiani D, Alexander JJ, O'Rourke JR, McManus M, Jadhav AP, Cepko CL, Hauswirth WW, Harfe BD, Strettoi E. Dicer inactivation leads to progressive functional and structural degeneration of the mouse retina. J Neurosci. 2008;28:4878–4887. doi: 10.1523/JNEUROSCI.0828-08.2008. [DOI] [PMC free article] [PubMed] [Google Scholar]
- Davis HP, Squire LR. Protein synthesis and memory: a review. Psychol Bull. 1984;96:518–559. [PubMed] [Google Scholar]
- Davis TH, Cuellar TL, Koch SM, Barker AJ, Harfe BD, McManus MT, Ullian EM. Conditional loss of Dicer disrupts cellular and tissue morphogenesis in the cortex and hippocampus. J Neurosci. 2008;28:4322–4330. doi: 10.1523/JNEUROSCI.4815-07.2008. [DOI] [PMC free article] [PubMed] [Google Scholar]
- Erdmann G, Schütz G, Berger S. Inducible gene inactivation in neurons of the adult mouse forebrain. BMC Neurosci. 2007;8:63. doi: 10.1186/1471-2202-8-63. [DOI] [PMC free article] [PubMed] [Google Scholar]
- Filipowicz W, Bhattacharyya SN, Sonenberg N. Mechanisms of post-transcriptional regulation by microRNAs: are the answers in sight? Nat Rev Genet. 2008;9:102–114. doi: 10.1038/nrg2290. [DOI] [PubMed] [Google Scholar]
- Kim J, Inoue K, Ishii J, Vanti WB, Voronov SV, Murchison E, Hannon G, Abeliovich A. A MicroRNA feedback circuit in midbrain dopamine neurons. Science. 2007;317:1220–1224. doi: 10.1126/science.1140481. [DOI] [PMC free article] [PubMed] [Google Scholar]
- Knapska E, Walasek G, Nikolaev E, Neuhäusser-Wespy F, Lipp HP, Kaczmarek L, Werka T. Differential involvement of the central amygdala in appetitive versus aversive learning. Learn Mem. 2006;13:192–200. doi: 10.1101/lm.54706. [DOI] [PMC free article] [PubMed] [Google Scholar]
- Köhr G, Jensen V, Koester HJ, Mihaljevic AL, Utvik JK, Kvello A, Ottersen OP, Seeburg PH, Sprengel R, Hvalby Ø. Intracellular domains of NMDA receptor subtypes are determinants for long-term potentiation induction. J Neurosci. 2003;23:10791–10799. doi: 10.1523/JNEUROSCI.23-34-10791.2003. [DOI] [PMC free article] [PubMed] [Google Scholar]
- Konopacki FA, Rylski M, Wilczek E, Amborska R, Detka D, Kaczmarek L, Wilczynski GM. Synaptic localization of seizure-induced matrix metalloproteinase-9 mRNA. Neuroscience. 2007;150:31–39. doi: 10.1016/j.neuroscience.2007.08.026. [DOI] [PubMed] [Google Scholar]
- Kosik KS. The neuronal microRNA system. Nat Rev Neurosci. 2006;7:911–920. doi: 10.1038/nrn2037. [DOI] [PubMed] [Google Scholar]
- Krol J, Busskamp V, Markiewicz I, Stadler MB, Ribi S, Richter J, Duebel J, Bicker S, Fehling HJ, Schübeler D, Oertner TG, Schratt G, Bibel M, Roska B, Filipowicz W. Characterizing light-regulated retinal microRNAs reveals rapid turnover as a common property of neuronal microRNAs. Cell. 2010;141:618–631. doi: 10.1016/j.cell.2010.03.039. [DOI] [PubMed] [Google Scholar]
- Kye MJ, Liu T, Levy SF, Xu NL, Groves BB, Bonneau R, Lao K, Kosik KS. Somatodendritic microRNAs identified by laser capture and multiplex RT-PCR. RNA. 2007;13:1224–1234. doi: 10.1261/rna.480407. [DOI] [PMC free article] [PubMed] [Google Scholar]
- Martin KC, Barad M, Kandel ER. Local protein synthesis and its role in synapse-specific plasticity. Curr Opin Neurobiol. 2000;10:587–592. doi: 10.1016/s0959-4388(00)00128-8. [DOI] [PubMed] [Google Scholar]
- Michaluk P, Kolodziej L, Mioduszewska B, Wilczynski GM, Dzwonek J, Jaworski J, Gorecki DC, Ottersen OP, Kaczmarek L. Beta-dystroglycan as a target for MMP-9, in response to enhanced neuronal activity. J Biol Chem. 2007;282:16036–16041. doi: 10.1074/jbc.M700641200. [DOI] [PubMed] [Google Scholar]
- Morris RG, Garrud P, Rawlins JN, O'Keefe J. Place navigation impaired in rats with hippocampal lesions. Nature. 1982;297:681–683. doi: 10.1038/297681a0. [DOI] [PubMed] [Google Scholar]
- Nagy V, Bozdagi O, Matynia A, Balcerzyk M, Okulski P, Dzwonek J, Costa RM, Silva AJ, Kaczmarek L, Huntley GW. Matrix metalloproteinase-9 is required for hippocampal late-phase long-term potentiation and memory. J Neurosci. 2006;26:1923–1934. doi: 10.1523/JNEUROSCI.4359-05.2006. [DOI] [PMC free article] [PubMed] [Google Scholar]
- Ostroff LE, Fiala JC, Allwardt B, Harris KM. Polyribosomes redistribute from dendritic shafts into spines with enlarged synapses during LTP in developing rat hippocampal slices. Neuron. 2002;35:535–545. doi: 10.1016/s0896-6273(02)00785-7. [DOI] [PubMed] [Google Scholar]
- Park CS, Tang SJ. Regulation of microRNA expression by induction of bidirectional synaptic plasticity. J Mol Neurosci. 2009;38:50–56. doi: 10.1007/s12031-008-9158-3. [DOI] [PubMed] [Google Scholar]
- Parlato R, Kreiner G, Erdmann G, Rieker C, Stotz S, Savenkova E, Berger S, Grummt I, Schütz G. Activation of an endogenous suicide response after perturbation of rRNA synthesis leads to neurodegeneration in mice. J Neurosci. 2008;28:12759–12764. doi: 10.1523/JNEUROSCI.2439-08.2008. [DOI] [PMC free article] [PubMed] [Google Scholar]
- Pena JT, Sohn-Lee C, Rouhanifard SH, Ludwig J, Hafner M, Mihailovic A, Lim C, Holoch D, Berninger P, Zavolan M, Tuschl T. miRNA in situ hybridization in formaldehyde and EDC-fixed tissues. Nat Methods. 2009;6:139–141. doi: 10.1038/nmeth.1294. [DOI] [PMC free article] [PubMed] [Google Scholar]
- Rajasethupathy P, Fiumara F, Sheridan R, Betel D, Puthanveettil SV, Russo JJ, Sander C, Tuschl T, Kandel E. Characterization of small RNAs in Aplysia reveals a role for miR-124 in constraining synaptic plasticity through CREB. Neuron. 2009;63:803–817. doi: 10.1016/j.neuron.2009.05.029. [DOI] [PMC free article] [PubMed] [Google Scholar]
- Schaefer A, O'Carroll D, Tan CL, Hillman D, Sugimori M, Llinas R, Greengard P. Cerebellar neurodegeneration in the absence of microRNAs. J Exp Med. 2007;204:1553–1558. doi: 10.1084/jem.20070823. [DOI] [PMC free article] [PubMed] [Google Scholar]
- Schratt G. Fine-tuning neural gene expression with microRNAs. Curr Opin Neurobiol. 2009;19:213–219. doi: 10.1016/j.conb.2009.05.015. [DOI] [PubMed] [Google Scholar]
- Siegel G, Obernosterer G, Fiore R, Oehmen M, Bicker S, Christensen M, Khudayberdiev S, Leuschner PF, Busch CJ, Kane C, Hübel K, Dekker F, Hedberg C, Rengarajan B, Drepper C, Waldmann H, Kauppinen S, Greenberg ME, Draguhn A, Rehmsmeier M, Martinez J, Schratt GM. A functional screen implicates microRNA-138-dependent regulation of the depalmitoylation enzyme APT1 in dendritic spine morphogenesis. Nat Cell Biol. 2009;11:705–716. doi: 10.1038/ncb1876. [DOI] [PMC free article] [PubMed] [Google Scholar]
- Steward O, Levy WB. Preferential localization of polyribosomes under the base of dendritic spines in granule cells of the dentate gyrus. J Neurosci. 1982;2:284–291. doi: 10.1523/JNEUROSCI.02-03-00284.1982. [DOI] [PMC free article] [PubMed] [Google Scholar]
- Sutton MA, Schuman EM. Dendritic protein synthesis, synaptic plasticity, and memory. Cell. 2006;127:49–58. doi: 10.1016/j.cell.2006.09.014. [DOI] [PubMed] [Google Scholar]
- Tada T, Sheng M. Molecular mechanisms of dendritic spine morphogenesis. Curr Opin Neurobiol. 2006;16:95–101. doi: 10.1016/j.conb.2005.12.001. [DOI] [PubMed] [Google Scholar]
- Wang XB, Bozdagi O, Nikitczuk JS, Zhai ZW, Zhou Q, Huntley GW. Extracellular proteolysis by matrix metalloproteinase-9 drives dendritic spine enlargement and long-term potentiation coordinately. Proc Natl Acad Sci U S A. 2008;105:19520–19525. doi: 10.1073/pnas.0807248105. [DOI] [PMC free article] [PubMed] [Google Scholar]
- Wilczynski GM, Konopacki FA, Wilczek E, Lasiecka Z, Gorlewicz A, Michaluk P, Wawrzyniak M, Malinowska M, Okulski P, Kolodziej LR, Konopka W, Duniec K, Mioduszewska B, Nikolaev E, Walczak A, Owczarek D, Gorecki DC, Zuschratter W, Ottersen OP, Kaczmarek L. Important role of matrix metalloproteinase 9 in epileptogenesis. J Cell Biol. 2008;180:1021–1035. doi: 10.1083/jcb.200708213. [DOI] [PMC free article] [PubMed] [Google Scholar]
- Yang F, Je HS, Ji Y, Nagappan G, Hempstead B, Lu B. Pro-BDNF-induced synaptic depression and retraction at developing neuromuscular synapses. J Cell Biol. 2009;185:727–741. doi: 10.1083/jcb.200811147. [DOI] [PMC free article] [PubMed] [Google Scholar]