

Abstract
Sensory information acquired via the large facial whiskers is processed and relayed in the whisker-to-barrel pathway, which shows multiple somatotopic maps of the receptor periphery. These maps consist of individual structural modules, the development of which may require intact cortical lamination. In the present study we examined the whisker-to-barrel pathway in the reeler mouse and thus used a model with disturbed cortical organization. A combination of histological (fluorescent Nissl and cytochrome oxidase staining) as well as molecular methods (c-Fos and laminar markers Rgs8, RORB, and ER81 expression) revealed wild type-equivalent modules in reeler. At the neocortical level, however, we found extensive alterations in the layout of the individual modules of the map. Nevertheless, they showed a columnar organization that included compartments equivalent to those of their wild-type counterparts. Moreover, all examined modules showed distinct activation as a consequence of behavioral whisker stimulation. Analysis of the magnitude of the cortical lamination defect surprisingly revealed an extensive disorganization, rather than an inversion, as assumed previously. Striking developmental plasticity of thalamic innervation, as suggested by vGluT2 immunohistochemistry, seems to ensure the proper formation of columnar modules and topological maps even under highly disorganized conditions.
Introduction
Using their whiskers, rodents are able to screen their habitat and perform complex orientation and discrimination tasks (Hutson and Masterton, 1986; Guić-Robles et al., 1989; Brecht et al., 1997; Diamond et al., 2008). Tactile information is relayed to primary somatosensory cortex via defined pathways after being processed in brainstem and thalamus. This somatotopically ordered whisker-to-barrel pathway is well characterized (Waite, 2004; Petersen, 2007; Schubert et al., 2007). It contains maps of the sensory periphery at all processing stations consisting of individual modules: (1) “barrelettes” in the trigeminal brainstem nuclei (Belford and Killackey, 1979; Ma, 1991); (2) “barreloids” in the ventral posteromedial thalamic nucleus (VPM) (Van der Loos, 1976); and (3) “barrels” in the somatosensory cortex (Woolsey and Van der Loos, 1970). Each barrel structurally and functionally represents one contralateral whisker and its receptor array (Welker, 1971; Simons, 1978).
Barrel development depends on the interaction of genetically determined molecular signals as well as activity-dependent mechanisms (Erzurumlu and Kind, 2001; Lopez-Bendito and Molnar, 2003). Not readily explained by these molecular developmental insights is another fundamental neurobiological question: is there a necessity for cortical lamination in the process of map formation and functional utilization? The mouse mutant reeler provides a suitable model to approach this question.
Reeler mice show an ataxic phenotype. Structural correlates are disturbed laminated structures such as the cerebellar and cerebral cortices (Falconer, 1951; Hamburgh, 1963; Caviness et al., 1988). The defect is based on a homozygous loss-of-function of the reelin gene. In the embryonic cortex, Cajal–Retzius cells secrete reelin as a key regulator of cortical development (D'Arcangelo et al., 1995; Frotscher, 1997; Hack et al., 2007; Cooper, 2008). In the reeler brain, all anatomical structures are present and in correct spatial positions (Caviness and Rakic, 1978; Goffinet, 1984). At the neocortical level, however, a disturbance in the normal inside-out patterning has been observed, described as inversion of cortical layering (Caviness and Sidman, 1973).
Previous studies on the reeler brain also included the whisker-to-barrel pathway (Cragg, 1975; Caviness et al., 1976; Welt and Steindler, 1977). However, the possible formation of barrels and barrel-related columns, somatotopic order, or functional aspects of such modules in the reeler cortex remained controversial.
Laminar markers are novel tools that allow us to determine the degree of laminar defects in the reeler cortex (Hevner et al., 2003; Lein et al., 2007; Molyneaux et al., 2007). Immediate early genes are established molecular tools for structural and functional examination of activated neuronal networks (Sagar et al., 1988; Staiger et al., 2000; Barth, 2007).
The goal of the present study was to determine whether the development of columnar modules and their organization into somatotopic maps requires intact cortical lamination. We suggest that an intact thalamic input enables the formation of functional columnar modules in a disorganized cortex and that these modules are able to reproduce an orderly somatotopic map. Moreover, behavioral activation of distinct neuronal ensembles is possible inside these maps. Interestingly, the examination of the reeler layering defect revealed that the mutant cortex is not “inverted” but rather “extensively disorganized.”
Materials and Methods
Animals and stimulation procedure.
Forty-seven male and female mice (24 B6C3Fe wild-type and 23 B6C3Fe rl−/− mice (reeler); minimal age, 3 months) from the breeding facility of the University of Freiburg (Freiburg, Germany) were used in the present study. All experimental protocols were in accordance with the German law on animal research.
Animals were transferred to our laboratory in the evening and anesthetized by intraperitoneal injection of ketamine (0.1 mg/g bodyweight) to clip certain sets of whiskers. Regularly, the whiskers C1–3 remained intact on the right, whereas B1–3 and D1–3 remained intact on the left side of the snout. Furthermore, we performed several experiments to show the specificity of the c-Fos induction being related to the exploration of the novel environment with the unclipped whiskers, in agreement with previous studies in rats (Staiger et al., 2000). In the morning, single animals were placed in a large box (60 × 40 × 40 cm) containing an enriched environment of various natural and non-natural materials. Water and food were freely accessible. The mice explored the enriched environment for 2 h in the dark. Thereafter, the animals were reanesthetized and perfused.
Fixation and tissue processing.
The perfusion was done transcardially with 15 ml of physiological saline, followed by 150 ml of 4% paraformaldehyde in 0.1 m phosphate buffer (PB), pH 7.4. The brain was dissected out of the skull and postfixed for 2 h.
Forebrain blocks for immunostaining were sectioned on a vibratome (Microm) at 50 μm thickness. They were cut either in the coronal plane or flattened between glass slides and cut in the tangential plane (Welker and Woolsey, 1974). Brains for in situ hybridization or the combination of immunostaining and in situ hybridization underwent cryoprotection and were coronally sectioned with a cryostat (Leica) at 40 μm thickness.
To visualize the barreloids in the thalamus, brains were cut in a special plane perpendicular to the long axis of the barreloids (Woolsey et al., 1979; Haidarliu and Ahissar, 2001). The forebrain blocks of these brains were sectioned with a vibratome at 50 μm thickness. All hindbrain blocks containing the trigeminal nuclei underwent cryoprotection and were sectioned in the coronal plane with a cryostat at 50 μm thickness.
Immunohistochemistry and cytochrome oxidase staining.
The sections were rinsed in PB, 0.05 m Tris-buffered saline, pH 7.6 (TBS), TBS containing 0.4% Triton X-100 (TBST; 20 min each), pH 7.6, and blocked with 10% normal goat serum (in TBST) for 45 min.
Between the first three steps, sections were rinsed in TBST (4×, 15 min each). Step 1 consisted of incubation for 60 h at 6°C in a polyclonal antiserum against c-Fos (raised in rabbit; Santa Cruz Biotechnology), diluted 1:5000 in TBST. In step 2 incubation was conducted for 2 h at room temperature in a biotinylated goat anti-rabbit serum (Vector Laboratories), diluted 1:200 in TBST. Step 3 involved incubation for 2 h at room temperature in a solution that contained peroxidase coupled to an avidin-biotin complex (Vector Laboratories), diluted 1:200 in TBST. After that, the rinsing was done with TBST (1× 15 min; pH 7.6), TBS (1×, 15 min; pH 7.6), and 0.05 m Tris buffer (TB; 2×, 15 min each; pH 8.2). In step 4, chromogen solution consisting of 0.015% 3,3′-diaminobenzidine (DAB; Sigma) and 0.4% ammonium nickel sulfate (Fluka) was added to the tissue. The staining reaction was started by adding hydrogen peroxide to a final concentration of 0.006%, controlled by microscopic inspection and stopped by rinsing with TB, pH 8.2.
The immunostaining was followed by cytochrome oxidase (CO) enzyme histochemistry as described by Wong-Riley and Welt (1980).
Single immunofluorescence combined with fluorescent Nissl-staining and double immunofluorescence.
The immunofluorescence was performed first. The c-Fos antibody was diluted 1:1000 in TBST. Incubation and rinsing were as described above. The c-Fos antibody was detected using an Alexa 488-conjugated secondary antibody (Invitrogen) diluted 1:400 in TBST for 2 h at room temperature. After rinsing in TBS, TB and PB, the NeuroTrace (530/615) staining was performed according to the manufacturer's protocol (Invitrogen).
To map the distribution of thalamic boutons across layers, double immunofluorescence was performed with a mixture of antibodies against vGluT2 (guinea pig, 1:10.000; Millipore) and c-Fos (as above). They were visualized by simultaneous incubation with donkey anti-guinea pig-Alexa 488 and donkey anti-rabbit-Alexa 594 (both 1:500; Invitrogen).
In situ hybridization.
In situ hybridization (ISH) for the layer-specific markers Rgs8, RORB (also known as ROR-BETA), and ER81 (also known as Etv1) was performed with digoxigenin (DIG)-labeled cRNA probes. The cRNA probes were generated from appropriate plasmids (German Resource Center for Genome Research primary database) containing cDNA inserts specific for the respective laminar marker: Rgs8 (Entrez Gene identifier 67792), RORB (Entrez Gene identifier 6096), and ER81 (Entrez Gene identifier 14009).
The sections were rinsed three times with 2× standard saline citrate (1× SSC = 0.15 m NaCl, 0.015 m sodium citrate, pH 7.0) and pretreated for 15 min in hybridization buffer (HB; 50% formamide, 4× SSC, 250 μg/ml denaturated salmon sperm DNA, 100 μg/ml tRNA, 5% dextransulfate and 1% Denhardt‘s solution) diluted 1:1 in 2× SSC. One hour of prehybridization at 55°C in pure HB followed. DIG-labeled probes (50 ng/ml) for Rgs8 or ER81 or a probe (100 ng/ml) for RORB were hybridized overnight at 55°C. Afterward, the tissue was rinsed in 2× SSC (2×, 15 min each, at room temperature), 2× SSC containing 50% formamide (15 min, at 65°C), 0.1× SSC containing 50% formamide (15 min, at 65°C), and finally with 0.1× SSC (2×, 15 min, at 65°C). The probes were detected by anti-DIG Fab fragments conjugated to alkaline phosphatase (raised in sheep; Roche) diluted 1:1500 in blocking agent containing 0.01 m TBS, pH 7.5, overnight. The Fab fragments were visualized by staining with nitroblue tetrazolium and 5-bromo-4-chloro-3-indolylphosphate (Roche).
Immunohistochemistry combined with in situ hybridization.
The immunostaining was performed as described above using RNase-free buffers. The pH of all solutions was 7.4 and the chromogen solution consisted of DAB only. The subsequent ISH was performed as described above.
Analysis, quantification, and statistics.
Reconstructions at each level of the whisker-to-barrel pathway were done in five wild-type and five reeler brains (see Table 1), laminar marker analysis (see Fig. 3C,D) and colocalization analysis of laminar markers with c-Fos (see Fig. 4) were performed in six brains of each genotype, and quantification of thalamic innervation of activated columns (see Fig. 6C,D) was carried out in three brains of each genotype. All data were acquired in at least two independent sections of each brain, the numbers of which were averaged before statistical testing. All quantitative data from Neurolucida were exported via Neuroexplorer (both from MBF Biosciences) and processed with Excel 2007 (Microsoft) and MyStat (Systat). The data are presented as mean ± SD, unless otherwise noted.
Table 1.
Quantification of different modules or groups of modules in the components of the whisker-to-barrel pathway in wild-type and reeler mice
| Wild type |
Reeler |
Two-sided t test | |||
|---|---|---|---|---|---|
| Mean | SD | Mean | SD | ||
| Brainstem (bregma −5.30) (μm2) | |||||
| Pr5 | 448,498 | 17,666 | 461,351 | 46,968 | n.s. |
| B row barrelette (mean of B1–3) | 2419 | 252 | 2320 | 713 | n.s. |
| D row barrelette (mean of B1–3) | 2534 | 311 | 2622 | 356 | n.s. |
| Barrelette form factor | 0.77 | 0.02 | 0.76 | 0.04 | n.s. |
| Thalamus (μm2) | |||||
| VPM (rows B–D, arcs 1–3) | 100,739 | 15,656 | 110,834 | 8303 | n.s. |
| B row barreloid (mean of B1–3) | 9199 | 2028 | 10,404 | 562 | n.s. |
| D row barreloid (mean of D1–3) | 10,218 | 928 | 11,047 | 643 | n.s. |
| Barreloid form factor | 0.71 | 0.03 | 0.68 | 0.05 | n.s. |
| Cortex (μm2) | |||||
| PMBSF (rows A–E, arcs 1–3) | 906,889 | 40,092 | 1,237,480 | 151,540 | *p < 0.001 |
| B row barrel (mean of B 1–3) | 55,473 | 7478 | 52,059 | 6625 | n.s. |
| D row barrel (mean of B 1–3) | 62,390 | 8652 | 65,677 | 17,629 | n.s. |
| Barrel (mean of rows A–E and arcs 1–4) | 51,774 | 3731 | 53,373 | 8023 | n.s. |
| Septum area, one barrel (mean of rows A–E and arcs 1–3) | 8609 | 828 | 30,453 | 10,184 | *p < 0.001 |
| Barrel form factor | 0.83 | 0.02 | 0.78 | 0.04 | *p < 0.05 |
PMBSF, Posteromedial barrel subfield; n.s., not significant.
Figure 3.
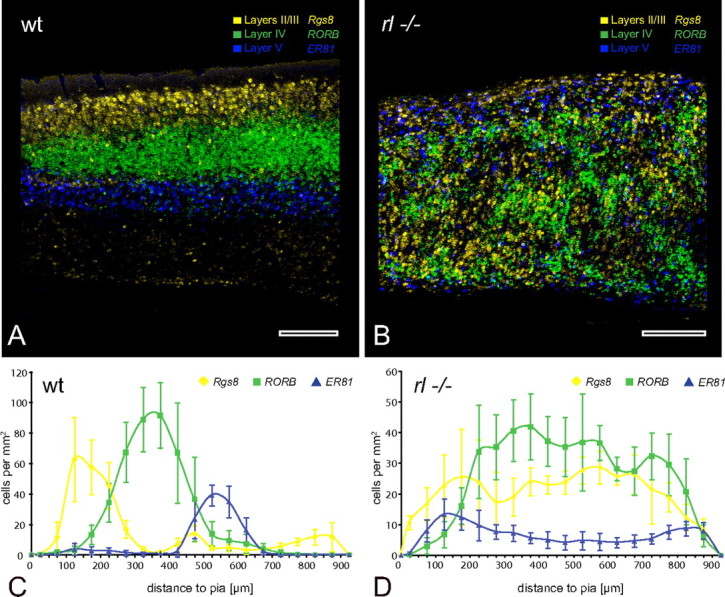
Layering of the adult primary somatosensory cortex. Higher magnification of the area indicated by the frame in supplemental Figure 4. A, B, Wild-type (wt) cortex (A) shows an obvious layering of the laminar markers in accordance with their assumed position, whereas the reeler (rl−/−) cortex (B) obviously does not possess any comparable layering. Note the clustering of some of the RORB cells in the reeler cortex that are likely to be barrel equivalents. C, D, The diagrams display the quantified distribution of the laminar markers in the wild-type cortex (C) and the reeler cortex (D). Contrary to previous assumptions, the curves from the reeler cortex do not indicate an inversion of relative neuron positions. Scale bars, 250 μm.
Figure 4.
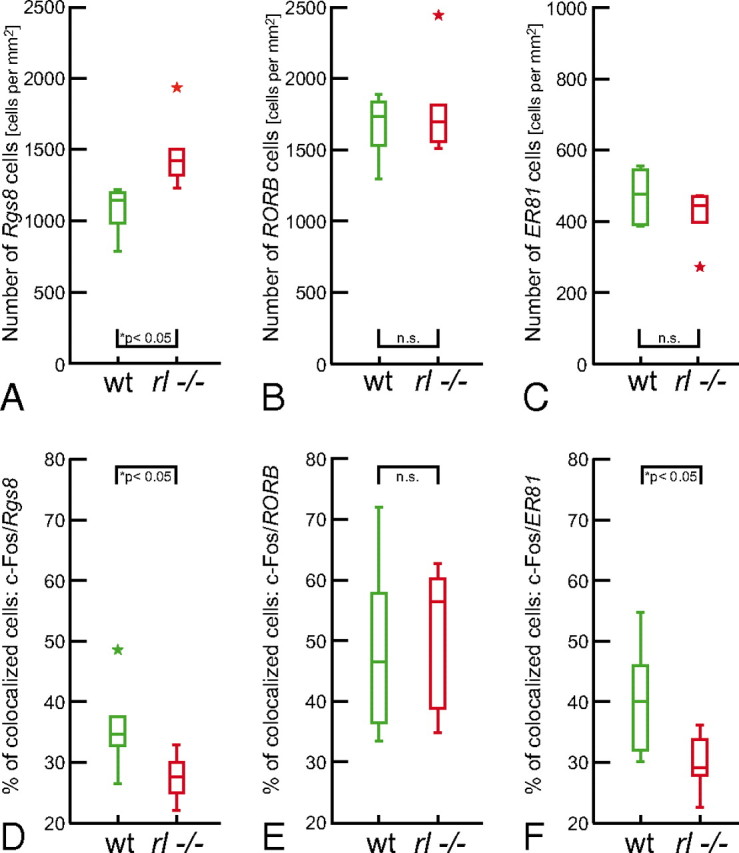
Laminar marker cell group sizes and colocalization of the markers with c-Fos [comparison of wild type (wt) and reeler (rl−/−)]. A–C, Density of Rgs8-, RORB-, and Er81-expressing cells, shown as box plots. The late generated layer II/III cell population exclusively showed statistically significant differences between the genotypes. The different y-axis scaling in C is necessary because of a relatively smaller laminar V marker cell population. D–F Percentage of activated (i.e., c-Fos expressing) cells in the different laminar fate marker cell populations. Bottom and top of the boxes are the 25th and 75th percentiles, respectively; the bar in the box is the median. The ends of the whiskers represent the minimum or maximum respectively. Colored asterisks symbolize suspected outliers.
Figure 6.

Mapping of thalamic bouton distribution across layers. A, In wild-type (wt) animals vGluT2 immunoreactivity faithfully reflected the distribution of terminal fields of lemniscal thalamic projections to the barrel cortex. A highly dense, modular termination pattern in layer IV and two other dense but band-like termination patterns in layer I and VI could be appreciated. B, In reeler (rl−/−) a completely different mode of termination became obvious. Here, bands of terminal boutons, which merged and separated again, spanned much of the cortical thickness. At several depths some larger patches were included in these bands. C, D, Quantification of the optical density of thalamic boutons immunoreactive for vGluT2. Note that the two curves are very different from each other and bear a high similarity in shape to the respective RORB ones (Fig. 3C,D). Roman numerals indicate cortical layers. Scale bars, 250 μm.
Reconstruction of individual modules of the whisker-to-barrel pathway.
To achieve comparability of structures reconstructed with Neurolucida in the wild-type and the hypotrophic reeler brains, we first compared the respective size of the whisker-to-barrel pathway components in coronal sections of four wild type and three reeler brains. Because the neocortex of reeler animals was significantly smaller, its correction factor was calculated to be 1.33. As an indicator of the symmetry of these structures, we chose the form factor (4π × area/perimeter2; Neuroexplorer). It considers the relationship between an area and its perimeter as well as the complexity of an object.
Quantification of cortical layering.
The distribution of individual cells, labeled for laminar markers, was analyzed by marking their position within the activated column reconstructed with Neurolucida. After normalization of cortical thickness, the data were analyzed with respect to the distance of each marker to the pia mater and binned in groups, each spanning 50 μm.
Layer-compartmental analysis of activated columns and columnar equivalents.
The data concerning c-Fos induction, the numeric comparison of the laminar markers, and the colocalization analyses were obtained from Neurolucida-reconstructed, activated columns. Statistical significance was tested either with t tests or Bonferroni corrected t tests as appropriate. Data are presented as box plots.
For measuring c-Fos expression, we distinguished between granular (GR), supragranular (SG) and infragranular (IG) compartments based on cytoarchitectonical features. Also, the specificity of the laminar markers for their native compartment was tested in wild-type columns; 71% of Rgs8-labeled cells were found in SG, 78% of RORB-labeled cells in GR, and 87% of ER81-labeled cells in IG. Nevertheless, including all cells labeled for each laminar marker into our colocalization analysis (which we had to do to achieve comparability with reeler data) did not influence statistical significances in the wild-type column. Comparison of the colocalization rates of all cells labeled with one of the laminar markers to the colocalization rates of just the cells of the marker in its native compartment showed no significant differences (data not shown).
Quantification of vGluT2-immunoreactive bouton distribution.
Stimulated columns were identified by c-Fos immunocytochemistry. The vGluT2 boutons of these columns were photographed, processed, and analyzed as 8-bit gray scale images in NIH ImageJ. Fifty micrometer-large gapless regions of interest (ROI) were selected, and the overall number was adjusted to the width of the cortical column. After normalization of the cortical thickness, the integrated density of each ROI was measured. The intensity differences between sections were also normalized (0, darkest pixel; 1, brightest pixel).
Results
Trigeminal nuclei barrelettes show precise somatotopic activation in wild type and reeler
In wild-type brains, CO staining of coronal sections revealed a clear-cut barrelette pattern in the principal trigeminal nucleus, Pr5 (Fig. 1A) (for nomenclature in this article, see Paxinos and Franklin, 2001). Individual barrelettes became visible by pronounced CO activity. They were separated by narrow but distinct septa and displayed an oval to rectangular shape. The entire set of barrelettes formed a complete somatotopic map of the sensory receptor periphery.
Figure 1.
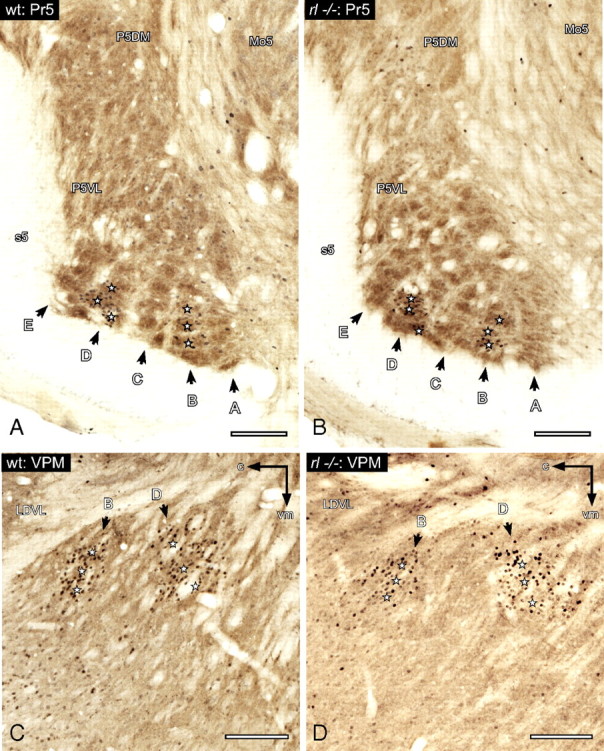
Subcortical components of the whisker-to-barrel pathway. Anatomy and induction of c-Fos after exploration of an enriched environment (spared whiskers, B1–3 and D1–3). A, B, Wild-type (wt) (A) and reeler (rl−/−) (B) nucleus principalis nervi trigemini (Pr5). Coronal section through the left brainstem (−5.30 mm from bregma). The topography of the barrelettes is revealed by CO (brown; rows lettered according to standard nomenclature). Stimulated barrelettes are visualized by c-Fos staining (black) and are marked by stars. Other structures identified for orientation are as follows: P5DM, principal sensory trigeminal nucleus (P5) dorsomedial part; P5VL, P5 ventrolateral part; Mo5, motor trigeminal nucleus, s5, sensory root of the trigeminal nerve. C, D, Wild-type (C) and reeler (D) VPM of the thalamus. Oblique section through the left VPM (30° and 50° counterclockwise to the sagittal plane when viewed dorsally and caudally, respectively) stained for CO and c-Fos. Activated barreloids are marked by stars. Other identified structures: LDVL, laterodorsal thalamic nucleus, ventrolateral part; c, caudal; vm, ventromedial. All scale bars, 250 μm.
In reeler brains, CO staining of this region revealed a somatotopic map consisting of barrelettes that were similar in shape and size to their wild-type counterparts (Fig. 1B). This finding was supported by quantitative reconstructions of the entire Pr5 and individual barrelettes (Table 1).
We also examined functional aspects of behavioral whisker experience and chose c-Fos as a marker of experience-dependent neuronal activity. To reach distinct activation of circumscribed modules in the whisker-to-barrel pathway, we used an acute clipping paradigm that was mirrored in the activation of barrelettes B1–3 and D1–3 in the Pr5 (Fig. 1A). These barrelettes corresponded to the ipsilateral spared whiskers that were used during exploration. There was little or no c-Fos induction in the barrelettes of deprived whiskers. Thus, the c-Fos staining correlates with the physiological activation of stimulated whisker-specific neuronal networks in wild-type mice. Compared to those, reeler mutants showed similar levels and patterns of c-Fos induction in activated barrelettes (Fig. 1B). They seemed to activate physiologically comparable neuronal networks.
In summary, the reeler Pr5 did not show any obvious difference in the structural organization or immediate early gene expression in response to behavioral stimulation as compared to wild type. This was also true for the spinal trigeminal nucleus (supplemental Fig. 1).
Activated thalamic barreloids show no differences between wild type and reeler
The visualization of barreloids in the VPM needed application of special sectioning planes to obtain a visible modular pattern. In wild types, the barreloids were clearly distinguishable by consecutive c-Fos and CO staining (Fig. 1C). Barreloid rows mainly became visible by the c-Fos signal of the activated modules, whereas CO visualized the whole barreloid-containing part of the VPM. The complete pattern in the VPM resulted in the formation of a somatotopic map of the receptor periphery, as read out by activated barreloids.
The reeler VPM presented the same orderly spatial organization (Fig. 1D). The rows revealed an equivalent somatotopic arrangement. Shape and size of the VPM as well as individual barreloids were indistinguishable from those of wild type. This impression was confirmed by Neurolucida reconstructions to determine the area sizes delineated by the different structures (Table 1).
In both genotypes the restriction of the c-Fos signal to activated barreloids suggests the recruitment of distinct thalamic networks in response to behavioral stimulation (Fig. 1C,D). A normal structural organization of the VPM in reeler, together with the finding of a comparable functional activation, led us to conclude that an intact lemniscal thalamic input into the reeler barrel cortex can be assumed.
Despite a severe neocortical lamination defect, reeler shows activated columns and precise somatotopy in the barrel cortex
Structure and activation of the wild-type neocortex
In coronal sections of the primary somatosensory cortex (S1BF) from wild-type animals, barrels were visualized as neuronal aggregates in layer IV by both fluorescent Nissl-staining (NeuroTrace) and CO (Fig. 2A; supplemental Fig. 2A). Tangential sections through layer IV revealed that these aggregates represented a correct somatotopic map of the sensory periphery (Fig. 2C; supplemental Fig. 2C). Columns corresponding to unclipped whiskers showed considerable de novo induction of c-Fos, especially in layer IV but also in the supragranular and infragranular layers. The increase in c-Fos-immunoreactive nuclei was statistically significant when compared to deprived neighboring columns (supplemental Fig. 3). Home cage controls of both wild type and reeler showed no statistically significant difference to deprived columns (data not shown). The c-Fos pattern in tangential sections strictly conformed to the applied clipping and stimulation paradigm (Fig. 2C; supplemental Fig. 2C).
Figure 2.
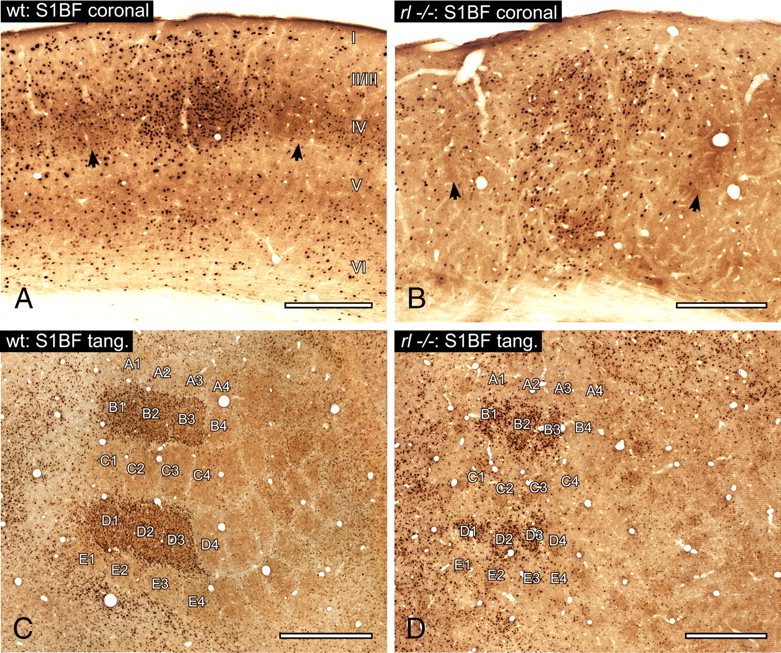
Whisker representation in the primary somatosensory barrel cortex, S1BF. The micrographs demonstrate the induction of c-Fos as well as its topography after exploration of an enriched environment (spared whiskers, B1-3 and D1-3; brown staining, CO; black staining, c-Fos). A, Micrograph of three barrel-related columns in the coronally sectioned wild-type (wt) brain. Barrels are revealed by CO (marked by arrows at the layer IV/Va border), and the stimulated B row column is revealed by c-Fos. B, The corresponding area in reeler (rl−/−). CO patches reveal column-like structures consisting of several barrel equivalents that are smeared through the whole cortex (arrows point at single barrel equivalents). The stimulation-induced expression of c-Fos visualizes the module of a barrel equivalent-containing column corresponding to a B row whisker. C, Tangential (tang.) section through layer IV in the wild-type barrel cortex. The topography of the barrel field (labeled according to standard nomenclature) is revealed by CO. The c-Fos staining shows the activated barrels corresponding to the spared and stimulated contralateral vibrissae (B1–3 and D1–3). D, Tangential section through the reeler barrel cortex. The section has the same distance to pia as the wild-type section. Note that the barrel equivalents of different columns are less regular in shape and are separated by bigger septa compared to wild-type barrels. c-Fos visualizes activated barrel equivalents (B1–3 and D1–3). Roman numerals indicate cortical layers. Scale bars: A, B, 250 μm; C, D, 500 μm.
Structure and activation of the reeler neocortex
Fluorescent Nissl staining of coronal sections revealed a patchy cellular distribution that replicated the disturbed layering of the cortex without, however, any clear barrels at any depth of the cortex (supplemental Fig. 2B). Also in tangential sections, NeuroTrace did not delineate barrel-like structures (supplemental Fig. 2D). CO staining procedures alone resulted in reproducible patterns of patches, although their organization and symmetry was not comparable to those of the barrels of wild-type animals (Fig. 2B,D). In coronal sections, the CO patches of different shape, size and location were broadly distributed over large parts of the cortical depth (Fig. 2B). About 2–4 of these diffuse CO patches together were reminiscent of a columnar module. In tangential sections they vaguely resembled wild-type barrels and formed a somatotopic map of the sensory periphery (Fig. 2D). Thus, they revealed a barrel field-like structure at its accustomed place within S1.
In contrast to both the obvious lack of structural modules in NeuroTrace-stained reeler cortices and the indistinct pattern of CO-stained reeler sections, costaining with c-Fos visualized activated modules. In coronal sections these modules consisted of columnarly arranged c-Fos stained nuclei (Fig. 2B; supplemental Fig. 2B) that formed several distinct c-Fos clusters, which were largely congruent with the CO patches (Fig. 2B). c-Fos staining of tangential sections also revealed activated modules that largely corresponded to the shape of CO spots (Fig. 2D). Since the strongest c-Fos and CO colocalization in stimulated wild-type columns was found in layer IV barrels, the entirety of the respective clusters within individual reeler modules should be considered as one barrel equivalent.
Reconstruction of barrels or barrel equivalents in tangential slices, visualized by c-Fos and/or CO, enabled us to compare their structural features. Because of the known hypotrophy of the reeler brain, we calculated a correction factor for the reeler data (see Material and Methods). In the corrected data, single-barrel equivalents occupied an area that was not statistically different in size to that of wild-type barrels (Table 1). Nevertheless, the quantification of the barrel-like pattern in reeler showed obvious differences to its wild-type counterpart. The form factor confirmed significantly less symmetry in reeler barrel equivalents. Moreover, the distances between the barrel equivalent-containing columns, and thus a putative septum-equivalent area, were significantly larger. As a consequence of larger septum and comparable barrel sizes, the whole barrel field-equivalent in reeler was significantly larger than the wild-type barrel field. However, this was a relative increase in size after correction for brain size differences.
We also compared the activation of columns and column equivalents by measuring the strength of the c-Fos induction as stained nuclei per square millimeter (mm2). Despite of the described structural differences, the two genotypes did not show any difference in their activation in consequence to behavioral whisker stimulation (supplemental Fig. 3A).
The detection of barrel-equivalent and column-equivalent structures in the disorganized reeler cortex, their preserved somatotopic organization, and their behavioral activation led us to assume that comparable cortical neuronal networks were activated as a consequence of sensory stimulation. However, this had to be confirmed at the individual cellular level.
Laminar marker analysis
The degree of cellular or laminar disorganization in the adult reeler cortex is a controversial issue. Initial birth-dating experiments suggested an inversion of laminar positions (Caviness and Sidman, 1973). However, the broad vertical distortion of the barrel equivalents was not in accordance with a simple inversion, even when considering strong additional smearing of laminar borders. The discovery of laminar markers (cf. Lein et al., 2007) allows us to clarify the actual cellular composition of reeler S1BF by defining “laminar fates” of cells.
We performed in situ hybridization for appropriate laminar markers, namely Rgs8 for the supragranular layers II/III (Gold et al., 1997), RORB for the granular layer (Schaeren-Wiemers et al., 1997), and ER81 for the infragranular layer V (Yoneshima et al., 2006; Watakabe et al., 2007). The labeling revealed the well ordered lamination and the areal composition of wild-type cortex (Fig. 3A; supplemental Fig. 4A). By contrast, an inversion of the reeler cortex was not found. Here, across the entire S1 and the neighboring areas, the neocortex appeared as a randomly distributed collection of marker-labeled cells (Fig. 3B; supplemental Fig. 4B).
To test for a more subtle laminar organization in the reeler S1BF, we quantified the location of the laminar marker-labeled cells in this area in terms of their distance to the pia. The cytoarchitectonically established lamination pattern of the wild-type cortex was reproduced with the laminar markers (Fig. 3C), whereas no inversion of the reeler cortex could be established (Fig. 3D). In reeler brains, in situ hybridization for Rgs8 as a layer II/III marker showed the most random distribution of all tested molecular markers. Rgs8-expressing cells were distributed through the entire mutant cortex. RORB-expressing cells, representing lamina IV, displayed several shallow peaks from 200 to 800 μm below the pia, whereas they were found in relatively low numbers above and below this zone. ER81-expressing neurons, representing a layer V subpopulation, showed two peaks of increased density, one close to the pia and the other close to the subcortical white matter, which thus flanked the zone of high RORB expression. We conclude that in the adult reeler cortex neurons with normally clearly restricted laminar positions can be found throughout the entire thickness of the cortex.
Because rates of neuron production and migration are closely related developmental processes, it became important to examine the numeral equivalence of cell populations with identified ”laminar fates“ in the two genotypes. RORB and ER81 each visualized similar numbers of cells in wild-type and reeler brains (Fig. 4B,C). Thus, the generation of correct cell numbers within these populations did not seem to be affected. In contrast, the later generated layer II/III cell population, marked by Rgs8, showed significantly higher cell numbers in reeler than in wild-type animals (Fig. 4A). This finding is in agreement with previous results from birth-dating experiments that also showed an increase in the number of late generated cells (Polleux et al., 1998). The total number of cells within a radial column, however, has been shown to be statistically similar in the two genotypes (Goffinet, 1984; Polleux et al., 1998).
Colocalization of c-Fos and laminar markers
We determined the actual “laminar fates” of cells that showed c-Fos induction. Sections containing activated columns were stained for c-Fos followed by in situ hybridization for one of the laminar markers (Fig. 5). Layer IV cells of sensory areas receive the densest lemniscal thalamic input (see Fig. 6). This input is thought to induce c-Fos expression; thus, a comparison of layer IV wild-type and layer IV-fated reeler cells was a reasonable first step (Fig. 5B,E vs H,K). Surprisingly, compared to layer IV-located and RORB-expressing wild-type cells, no significant difference in colocalization rates of c-Fos in reeler RORB-expressing cells was found (Fig. 4E). The wild-type layer IV and layer IV-fated reeler cells showed similar proportions of de novo c-Fos expression. Thus, in both genotypes this cell population seemed to comparably contribute to the assembly of functional columnar networks. Because of their frequent colocalization, the reeler column showed an extensive spatial overlap of RORB and c-Fos cell clusters, as in wild-type barrels. This finding further supports the hypothesis that dense c-Fos spots, at least partly, represent barrel equivalents. Conclusions about the reeler columnar equivalent, as a whole, are possible despite the absence of layers as a readout of compartmentalization. Forty-five percent of the c-Fos cells in an activated wild-type column were located in the granular compartment, with the remaining 55% in the supragranular and infragranular compartments (supplemental Fig. 3B). RORB-labeled cells belonging to the granular compartment showed comparable c-Fos induction in wild-type and reeler animals (Fig. 5E). Taking into account that the total c-Fos induction in wild-type and reeler columns did not differ significantly (supplemental Fig. 3A), we assume that columnar activation takes place in granular as well as in supragranular and infragranular compartments or their respective equivalents.
Figure 5.
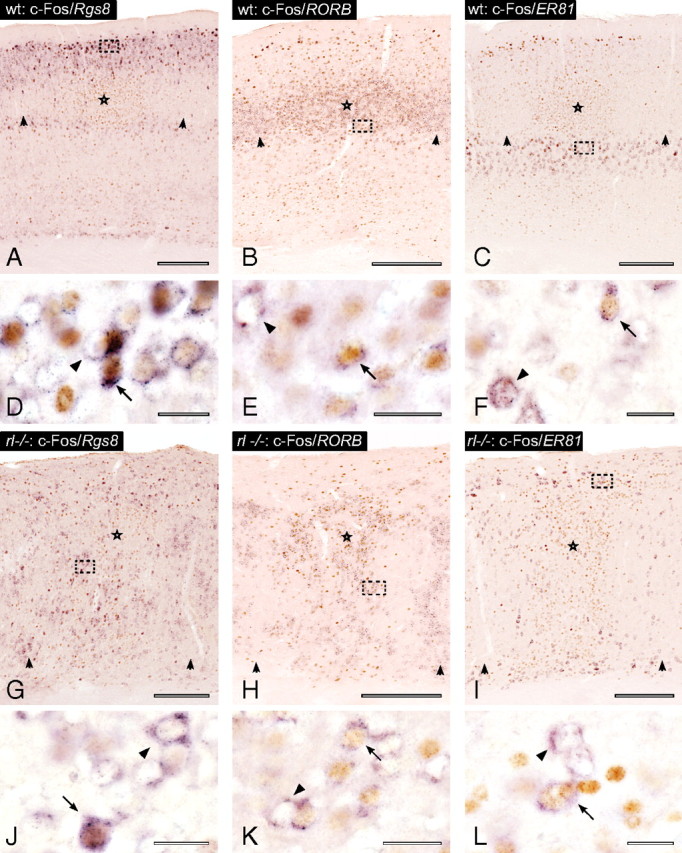
Colocalization of individual laminar markers and c-Fos in wild-type (wt) and reeler (rl−/−) animals. A–L, Stimulated and unstimulated columns in the wild-type cortex (A–F) and reeler cortex (G–L) sectioned in the standard coronal plane, immunostained for c-Fos (brown) and in situ hybridized for different laminar fate markers (purple). The center of the micrographs (A–C) show stimulated barrel-related columns. Activated barrels are marked by stars, and unstimulated barrels are marked by arrowheads at the lamina IV/Va border. Micrographs (G–I) show the corresponding area in reeler with the same labeling conventions. D–F and J–K show higher magnifications of the area indicated by the frames in the micrographs above. Arrows indicate cells that show colocalization of an individual laminar marker and c-Fos. Arrowheads indicate cells singly positive for one of the laminar markers. Scale bars: A–C, G–I, 250 μm; D–F, J–L, 20 μm.
Nevertheless, differences were found in c-Fos induction, and thus activation, of the examined supragranular and infragranular layers. Layer II/III-fated reeler cells showed significantly lower colocalization rates than the corresponding cells of the wild-type layers (Figs. 4D; 5A,D vs G,J). However, the examined populations were heterogeneous between the two genotypes because of higher total numbers of Rgs8-expressing cells within the reeler columnar equivalent. As a population, these cells showed reduced activation as a consequence of behavioral stimulation, but the inverse correlation of Rgs8-expressing cell numbers and their colocalization with c-Fos might indicate that the additionally generated layer II/III-fated cells in reeler are not recruited proportionately (supplemental Fig. 5).
Layer V-fated reeler cells also showed significantly lower colocalization rates compared to wild-type equivalents (Figs. 4F; 5C, F vs I,L). In this case, however, the examined populations were numerically within the same range. Behavioral stimulation, therefore, seems to generate a lower level of activation within this compartment.
Mapping of lemniscal thalamic boutons shows meaningful remodeling of terminal fields in reeler barrel cortex
We took advantage of the recently shown specificity of vGluT2-antibodies to reveal the distribution of lemniscal thalamic boutons in the sensory neocortex (Graziano et al., 2008). In wild type, the clear modular pattern of termination in layer IV was reminiscent of barrels, which receive the densest innervation from the VPM (Fig. 6A). Also a strong band-like labeling in layer VI, and to a lesser extent in layer I, was clearly visible. By contrast, in reeler barrel cortex neither a layer-specific terminal pattern nor an inverted tier of terminals, as reported previously (Caviness and Frost, 1983), could be observed. Instead, multiple bands of terminal boutons that were aligned with c-Fos-expressing columns (data not shown) spanned much of the cortical thickness and were focally enlarged in a patchy fashion (Fig. 6B). The quantification of the optical density showed that the two modes of termination did not resemble each other in any way (Fig. 6C,D) but were similar in shape to the respective RORB curves (cf. Fig. 3C,D).
Discussion
This study demonstrates a whisker-to-barrel pathway in reeler mice that is virtually indistinguishable in its examined structural and functional properties from that in wild-type mice at subcortical levels. At the cortical level, we characterized a major laminar disorganization in reeler. Nevertheless, behavioral stimulation of defined whiskers led to corresponding activation of defined columnar modules that were arranged in correct somatotopic order. To date, it has been believed that intact laminar organization of the cortex is necessary to enable a correct wiring with long-distance target sites (Jones, 1984). Our results suggest that although laminar organization in reeler barrel cortex is almost completely lost, thalamic neurons find their proper target cells in the cortex no matter where these are located within the cortical depth. This is in keeping with previous reeler studies showing intact targeting of cortical projections to distant areas (Polleux et al., 1998; Yamamoto et al., 2003). Furthermore, cortical microcircuits that adhere to the general layout of the canonical microcircuit (Schubert et al., 2007) seemed to be formed and functional in reeler, although with some limitations. Thus, a developmental plasticity mechanism based on molecular tags of the neurons to be connected according to their laminar fate (Lopez-Bendito and Molnar, 2003) can be postulated. This seems to ensure the building of the basic cortical module, i.e., the column (Mountcastle, 1997; Douglas and Martin, 2007; Petersen, 2007). Part of this developmental plasticity could be mediated by the proper interaction of early thalamic axons with subplate neurons (Higashi et al., 2005).
Nevertheless, for the understanding of the precise mechanisms of the described findings, future studies will have to analyze whether individual thalamocortical axons arborize within columnar domains. Tract tracing and single fiber reconstruction seem to be adequate methods toward this aim. Spatially restricted projections could explain the clearly delineated modules we detected with c-Fos labeling. However, their major target, the spiny stellate neurons, could also contribute to that phenomenon with their columnarly restricted axonal arbors (Lübke et al., 2000; Staiger et al., 2004). In vivo electrophysiological recordings will further help to understand the functional architecture of the reeler columnar modules.
Highly similar structural and functional layout of trigeminal and thalamic nuclei organization suggests a preserved lemniscal input to the somatosensory (barrel) cortex
The hallmark of reeler brain pathology is the disorganization and hypotrophy of laminated structures, in particular the cerebellar and cerebral cortices (Tissir and Goffinet, 2003; D'Arcangelo, 2005; Förster et al., 2006). Much less is known about unlaminated nuclei of the brain to which the subcortical components of the whisker-to-barrel pathway belong. Thus, to argue for a normally organized thalamic input to the cortex, we had to examine the structural layout and the functional activation of these components. Both the Pr5 and the VPM present a characteristic cytoarchitecture and contain modules that are arranged in a somatotopic map reflecting the organization of the whiskers on the snout (Van der Loos, 1976; Belford and Killackey, 1979; Ma, 1991). Using anatomical and molecular methods, we could convincingly demonstrate a cellular, modular, and functional map in both structures that is nearly identical in reeler and wild-type controls.
Laminar markers disclose a highly disorganized and not just inverted barrel cortex
Initially the concept was established that because of disturbances in radial migration, the normal inside-out development of the cortical layers is reversed, resulting in an inversion with layer VI-fated cells being found closest to the pia and layer II-fated cells closest to the white matter (Caviness and Sidman, 1973; Pinto-Lord et al., 1982; Hoffarth et al., 1995). Although several lines of evidence since then have suggested at least a substantial additional smearing of inverted layer borders caused by wrongly positioned cells, the concept of inversion is still frequently used to interpret findings in reeler (D'Arcangelo, 2005; Higashi et al., 2005; Strazielle et al., 2006).
The clearest evidence to date for a much stronger disorganization of the laminar pattern in reeler came from tracing studies showing that neurons projecting to long-distance target sites like the thalamus or the spinal cord are not to be found in layer-like tiers but, to the contrary, are spread out over much of the cortical depth (Cragg, 1975; Hoffarth et al., 1995; Polleux et al., 1998; Yamamoto et al., 2003). However, because rodent laminar specificity of many projection neurons is much less pronounced than in primates (Jones, 1984), these findings had to be interpreted with caution. Another hint was provided by a study that used the layer VI-specific transcription factor Tbr1 and indicated substantial disorganization, but again with the conclusion of an “overall inverted” cortex (Hevner et al., 2003). The complete mapping of the gene expression of the mouse genome led to a comprehensive description of specific markers for cortical layers (Lein et al., 2007). To be able to interpret our findings of a columnar de novo-expression of c-Fos (see below) on a layer-specific cellular level, we used these novel markers.
Although at closer examination the specificity of the markers was not as high as suggested by high-throughput methods (Lein et al., 2007) or diagrammatic reviews (Molyneaux et al., 2007), it was reasonably high to get a deeper understanding of the lamination defect in reeler. Our quantitative measures suggest that some populations of reeler cells with a common laminar fate take no ordered pattern at all (Rgs8), whereas others avoid the central portions of the cortex (ER81), which still others prefer (RORB); however, in all cases none of these cells reach a packing density that would justify the term “layer.” We observed a highly unordered placement of neurons as a consequence of disturbed migration due to the lack of reelin. This finding speaks against any “simplistic” function of reelin and may explain the variety of models about its action that propose reelin acts as a chemoattractant, a detachment signal for migrating neurons, or a stop signal (Gilmore and Herrup, 2000; Sanada et al., 2004; Hack et al., 2007). All the more astonishing are our results of the establishment of columnar modules in reeler. These columnar modules were detected by applying a behavioral stimulation paradigm to selected sets of whiskers.
Activated pathway mapping shows that despite massive laminar disorganization columnar and somatotopically ordered modules are formed
At the cortical level, the existence of barrel-related column equivalents in reeler animals was a controversial issue. Cell clustering obviously occurs in the reeler cortex. However, an interpretation was difficult without detailed knowledge of the lamination defect. Thus, previous studies postulated absence of barrels and barrel-field topography (Cragg, 1975), as well as partial (Welker, 1976) or even considerable preservation (Caviness et al., 1976; Welt and Steindler, 1977). The present data obtained by NeuroTrace staining, CO, c-Fos, and layer IV markers show the occurrence of barrel equivalents not as a distinct structure within an inverted layer IV equivalent but scattered through the cortical depth within a barrel equivalent-containing column.
Our method for mapping activated pathways by de novo expression of c-Fos uses the importance of whisker-derived tactile stimuli to guide the behavior of rodents (Brecht et al., 1997). The readout of the effect of exploring a novel enriched environment with a defined set of whiskers is enabled by the near lack of basal c-Fos expression in the entire whisker-to-barrel pathway (Bisler et al., 2002). Since salience and novelty of the stimulus is one of the prerequisites to induce c-Fos expression (Montag-Sallaz et al., 1999), as is spiking within synaptically driven networks (Luckman et al., 1994; Fields et al., 1997), it can be assumed that meaningful neuronal activity patterns led to c-Fos expression in our behavioral paradigm. This would imply that sensory stimulus-driven information processing is taking place not only in the structurally intact brainstem or thalamic components of the pathway, but also in the highly disorganized neocortex. One has to keep in mind that a final behavioral proof that reeler can use sensory information to guide behavior, for instance gap crossing (Hutson and Masterton, 1986) or sensory discrimination (Guić-Robles et al., 1989), is still lacking. However, previous conditioning experiments of other sensory modalities in reeler (Salinger et al., 2003) and our mapping at least suggest that the potential to do so exists. This may be because the activation of cortical neuronal ensembles takes place within relatively normally composed cortical columns that are positioned in correct topography to each other.
Footnotes
This study was supported by Deutsche Forschungsgemeinschaft Grant SFB 780, TP C1. We thank Monika Paetzold and Susanne Huber for expert technical help. Prof. Michael Frotscher is cordially acknowledged for encouragement and for critically reading the manuscript.
References
- Barth AL. Visualizing circuits and systems using transgenic reporters of neural activity. Curr Opin Neurobiol. 2007;17:567–571. doi: 10.1016/j.conb.2007.10.003. [DOI] [PMC free article] [PubMed] [Google Scholar]
- Belford GR, Killackey HP. Vibrissae representation in subcortical trigeminal centers of the neonatal rat. J Comp Neurol. 1979;183:305–321. doi: 10.1002/cne.901830207. [DOI] [PubMed] [Google Scholar]
- Bisler S, Schleicher A, Gass P, Stehle JH, Zilles K, Staiger JF. Expression of c-Fos, ICER, Krox-24 and JunB in the whisker-to-barrel pathway of rats: time course of induction upon whisker stimulation by tactile exploration of an enriched environment. J Chem Neuroanat. 2002;23:187–198. doi: 10.1016/s0891-0618(01)00155-7. [DOI] [PubMed] [Google Scholar]
- Brecht M, Preilowski B, Merzenich MM. Functional architecture of the mystacial vibrissae. Behav Brain Res. 1997;84:81–97. doi: 10.1016/s0166-4328(97)83328-1. [DOI] [PubMed] [Google Scholar]
- Caviness VS, Jr, Frost DO. Thalamocortical projections in the reeler mutant mouse. J Comp Neurol. 1983;219:182–202. doi: 10.1002/cne.902190205. [DOI] [PubMed] [Google Scholar]
- Caviness VS, Jr, Rakic P. Mechanisms of cortical development: a view from mutations in mice. Annu Rev Neurosci. 1978;1:297–326. doi: 10.1146/annurev.ne.01.030178.001501. [DOI] [PubMed] [Google Scholar]
- Caviness VS, Jr, Sidman RL. Time of origin or corresponding cell classes in the cerebral cortex of normal and reeler mutant mice: an autoradiographic analysis. J Comp Neurol. 1973;148:141–151. doi: 10.1002/cne.901480202. [DOI] [PubMed] [Google Scholar]
- Caviness VS, Jr, Frost DO, Hayes NL. Barrels in somatosensory cortex of normal and reeler mutant mice. Neurosci Lett. 1976;3:7–14. doi: 10.1016/0304-3940(76)90091-4. [DOI] [PubMed] [Google Scholar]
- Caviness VS, Jr, Crandall JE, Edwards MA. The Reeler malformation: implications for neocortical histogenesis. In: Peters A, Jones E, editors. Cereb cortex. Vol 7. New York: Plenum; 1988. pp. 59–89. [Google Scholar]
- Cooper JA. A mechanism for inside-out lamination in the neocortex. Trends Neurosci. 2008;31:113–119. doi: 10.1016/j.tins.2007.12.003. [DOI] [PubMed] [Google Scholar]
- Cragg BG. Absence of barrels and disorganization of thalamic afferent distribution in the sensory cortex of reeler mice. Exp Neurol. 1975;49:858–862. doi: 10.1016/0014-4886(75)90065-5. [DOI] [PubMed] [Google Scholar]
- D'Arcangelo G. The reeler mouse: anatomy of a mutant. Int Rev Neurobiol. 2005;71:383–417. doi: 10.1016/s0074-7742(05)71016-3. [DOI] [PubMed] [Google Scholar]
- D'Arcangelo G, Miao GG, Chen SC, Soares HD, Morgan JI, Curran T. A protein related to extracellular matrix proteins deleted in the mouse mutant reeler. Nature. 1995;374:719–723. doi: 10.1038/374719a0. [DOI] [PubMed] [Google Scholar]
- Diamond ME, von Heimendahl M, Arabzadeh E. Whisker-mediated texture discrimination. PLoS Biol. 2008;6:e220. doi: 10.1371/journal.pbio.0060220. [DOI] [PMC free article] [PubMed] [Google Scholar]
- Douglas RJ, Martin KA. Mapping the matrix: the ways of neocortex. Neuron. 2007;56:226–238. doi: 10.1016/j.neuron.2007.10.017. [DOI] [PubMed] [Google Scholar]
- Erzurumlu RS, Kind PC. Neural activity: sculptor of ‘barrels’ in the neocortex. Trends Neurosci. 2001;24:589–595. doi: 10.1016/s0166-2236(00)01958-5. [DOI] [PMC free article] [PubMed] [Google Scholar]
- Falconer DS. Two new mutants, “trembler” and “reeler”, with neurological actions in the house mouse (Mus musculus L.) J Genet. 1951;50:192–201. doi: 10.1007/BF02996215. [DOI] [PubMed] [Google Scholar]
- Fields RD, Eshete F, Stevens B, Itoh K. Action potential-dependent regulation of gene expression: temporal specificity in Ca2+, cAMP-responsive element binding proteins, and mitogen-activated protein kinase signaling. J Neurosci. 1997;17:7252–7266. doi: 10.1523/JNEUROSCI.17-19-07252.1997. [DOI] [PMC free article] [PubMed] [Google Scholar]
- Förster E, Zhao S, Frotscher M. Laminating the hippocampus. Nat Rev Neurosci. 2006;7:259–267. doi: 10.1038/nrn1882. [DOI] [PubMed] [Google Scholar]
- Frotscher M. Dual role of Cajal-Retzius cells and reelin in cortical development. Cell Tissue Res. 1997;290:315–322. doi: 10.1007/s004410050936. [DOI] [PubMed] [Google Scholar]
- Gilmore EC, Herrup K. Cortical development: receiving reelin. Curr Biol. 2000;10:R162–R166. doi: 10.1016/s0960-9822(00)00332-8. [DOI] [PubMed] [Google Scholar]
- Goffinet AM. Events governing organization of postmigratory neurons: studies on brain development in normal and reeler mice. Brain Res. 1984;319:261–296. doi: 10.1016/0165-0173(84)90013-4. [DOI] [PubMed] [Google Scholar]
- Gold SJ, Ni YG, Dohlman HG, Nestler EJ. Regulators of G-protein signaling (RGS) proteins: region-specific expression of nine subtypes in rat brain. J Neurosci. 1997;17:8024–8037. doi: 10.1523/JNEUROSCI.17-20-08024.1997. [DOI] [PMC free article] [PubMed] [Google Scholar]
- Graziano A, Liu XB, Murray KD, Jones EG. Vesicular glutamate transporters define two sets of glutamatergic afferents to the somatosensory thalamus and two thalamocortical projections in the mouse. J Comp Neurol. 2008;507:1258–1276. doi: 10.1002/cne.21592. [DOI] [PubMed] [Google Scholar]
- Guić-Robles E, Valdivieso C, Guajardo G. Rats can learn a roughness discrimination using only their vibrissal system. Behav Brain Res. 1989;31:285–289. doi: 10.1016/0166-4328(89)90011-9. [DOI] [PubMed] [Google Scholar]
- Hack I, Hellwig S, Junghans D, Brunne B, Bock HH, Zhao S, Frotscher M. Divergent roles of ApoER2 and Vldlr in the migration of cortical neurons. Development. 2007;134:3883–3891. doi: 10.1242/dev.005447. [DOI] [PubMed] [Google Scholar]
- Haidarliu S, Ahissar E. Size gradients of barreloids in the rat thalamus. J Comp Neurol. 2001;429:372–387. doi: 10.1002/1096-9861(20010115)429:3<372::aid-cne2>3.0.co;2-3. [DOI] [PubMed] [Google Scholar]
- Hamburgh M. Analysis of the postnatal developmental effects of ”Reeler“, a neurological mutation in mice. a study in developmental genetics. Dev Biol. 1963;19:165–185. doi: 10.1016/0012-1606(63)90040-x. [DOI] [PubMed] [Google Scholar]
- Hevner RF, Daza RA, Rubenstein JL, Stunnenberg H, Olavarria JF, Englund C. Beyond laminar fate: toward a molecular classification of cortical projection/pyramidal neurons. Dev Neurosci. 2003;25:139–151. doi: 10.1159/000072263. [DOI] [PubMed] [Google Scholar]
- Higashi S, Hioki K, Kurotani T, Kasim N, Molnár Z. Functional thalamocortical synapse reorganization from subplate to layer IV during postnatal development in the Reeler-like mutant rat (Shaking Rat Kawasaki) J Neurosci. 2005;25:1395–1406. doi: 10.1523/JNEUROSCI.4023-04.2005. [DOI] [PMC free article] [PubMed] [Google Scholar]
- Hoffarth RM, Johnston JG, Krushel LA, van der Kooy D. The mouse mutation reeler causes increased adhesion within a subpopulation of early postmitotic cortical neurons. J Neurosci. 1995;15:4838–4850. doi: 10.1523/JNEUROSCI.15-07-04838.1995. [DOI] [PMC free article] [PubMed] [Google Scholar]
- Hutson KA, Masterton RB. The sensory contribution of a single vibrissa's cortical barrel. J Neurophysiol. 1986;56:1196–1223. doi: 10.1152/jn.1986.56.4.1196. [DOI] [PubMed] [Google Scholar]
- Jones EG. Laminar distribution of cortical efferent cells. In: Peters A, Jones EG, editors. Cerebral cortex. Vol 1. New York: Plenum; 1984. pp. 521–552. [Google Scholar]
- Lein ES, Hawrylycz MJ, Ao N, Ayres M, Bensinger A, Bernard A, Boe AF, Boguski MS, Brockway KS, Byrnes EJ, Chen L, Chen L, Chen TM, Chin MC, Chong J, Crook BE, Czaplinska A, Dang CN, Datta S, Dee NR, et al. Genome-wide atlas of gene expression in the adult mouse brain. Nature. 2007;445:168–176. doi: 10.1038/nature05453. [DOI] [PubMed] [Google Scholar]
- López-Bendito G, Molnár Z. Thalamocortical development: how are we going to get there? Nat Rev Neurosci. 2003;4:276–289. doi: 10.1038/nrn1075. [DOI] [PubMed] [Google Scholar]
- Lübke J, Egger V, Sakmann B, Feldmeyer D. Columnar organization of dendrites and axons of single and synaptically coupled excitatory spiny neurons in layer 4 of the rat barrel cortex. J Neurosci. 2000;20:5300–5311. doi: 10.1523/JNEUROSCI.20-14-05300.2000. [DOI] [PMC free article] [PubMed] [Google Scholar]
- Luckman SM, Dyball RE, Leng G. Induction of c-fos expression in hypothalamic magnocellular neurons requires synaptic activation and not simply increased spike activity. J Neurosci. 1994;14:4825–4830. doi: 10.1523/JNEUROSCI.14-08-04825.1994. [DOI] [PMC free article] [PubMed] [Google Scholar]
- Ma PM. The barrelettes–architectonic vibrissal representations in the brainstem trigeminal complex of the mouse. I. Normal structural organization. J Comp Neurol. 1991;309:161–199. doi: 10.1002/cne.903090202. [DOI] [PubMed] [Google Scholar]
- Molyneaux BJ, Arlotta P, Menezes JR, Macklis JD. Neuronal subtype specification in the cerebral cortex. Nat Rev Neurosci. 2007;8:427–437. doi: 10.1038/nrn2151. [DOI] [PubMed] [Google Scholar]
- Montag-Sallaz M, Welzl H, Kuhl D, Montag D, Schachner M. Novelty-induced increased expression of immediate-early genes c-fos and arg 3.1 in the mouse brain. J Neurobiol. 1999;38:234–246. [PubMed] [Google Scholar]
- Mountcastle VB. The columnar organization of the neocortex. Brain. 1997;120:701–722. doi: 10.1093/brain/120.4.701. [DOI] [PubMed] [Google Scholar]
- Paxinos G, Franklin KBJ. Ed 2. New York: Academic; 2001. The mouse brain in stereotaxic coordinates. [Google Scholar]
- Petersen CC. The functional organization of the barrel cortex. Neuron. 2007;56:339–355. doi: 10.1016/j.neuron.2007.09.017. [DOI] [PubMed] [Google Scholar]
- Pinto-Lord MC, Evrard P, Caviness VS., Jr Obstructed neuronal migration along radial glial fibers in the neocortex of the reeler mouse: a Golgi-EM analysis. Brain Res. 1982;256:379–393. doi: 10.1016/0165-3806(82)90181-x. [DOI] [PubMed] [Google Scholar]
- Polleux F, Dehay C, Kennedy H. Neurogenesis and commitment of corticospinal neurons in reeler. J Neurosci. 1998;18:9910–9923. doi: 10.1523/JNEUROSCI.18-23-09910.1998. [DOI] [PMC free article] [PubMed] [Google Scholar]
- Sagar SM, Sharp FR, Curran T. Expression of c-Fos protein in brain-metabolic mapping at the cellular-level. Science. 1988;240:1328–1331. doi: 10.1126/science.3131879. [DOI] [PubMed] [Google Scholar]
- Salinger WL, Ladrow P, Wheeler C. Behavioral phenotype of the reeler mutant mouse: effects of RELN gene dosage and social isolation. Behav Neurosci. 2003;117:1257–1275. doi: 10.1037/0735-7044.117.6.1257. [DOI] [PubMed] [Google Scholar]
- Sanada K, Gupta A, Tsai LH. Disabled-1-regulated adhesion of migrating neurons to radial glial fiber contributes to neuronal positioning during early corticogenesis. Neuron. 2004;42:197–211. doi: 10.1016/s0896-6273(04)00222-3. [DOI] [PubMed] [Google Scholar]
- Schaeren-Wiemers N, André E, Kapfhammer JP, Becker-André M. The expression pattern of the orphan nuclear receptor RORbeta in the developing and adult rat nervous system suggests a role in the processing of sensory information and in circadian rhythm. Eur J Neurosci. 1997;9:2687–2701. doi: 10.1111/j.1460-9568.1997.tb01698.x. [DOI] [PubMed] [Google Scholar]
- Schubert D, Kötter R, Staiger JF. Mapping functional connectivity in barrel-related columns reveals layer- and cell type-specific microcircuits. Brain Struct Funct. 2007;212:107–119. doi: 10.1007/s00429-007-0147-z. [DOI] [PubMed] [Google Scholar]
- Simons DJ. Response properties of vibrissa units in rat SI somatosensory neocortex. J Neurophysiol. 1978;41:798–820. doi: 10.1152/jn.1978.41.3.798. [DOI] [PubMed] [Google Scholar]
- Staiger JF, Bisler S, Schleicher A, Gass P, Stehle JH, Zilles K. Exploration of a novel environment leads to the expression of inducible transcription factors in barrel-related columns. Neuroscience. 2000;99:7–16. doi: 10.1016/s0306-4522(00)00166-4. [DOI] [PubMed] [Google Scholar]
- Staiger JF, Flagmeyer I, Schubert D, Zilles K, Kötter R, Luhmann HJ. Functional diversity of layer IV spiny neurons in rat somatosensory cortex: quantitative morphology of electrophysiologically characterized and biocytin labeled cells. Cereb Cortex. 2004;14:690–701. doi: 10.1093/cercor/bhh029. [DOI] [PubMed] [Google Scholar]
- Strazielle C, Hayzoun K, Derer M, Mariani J, Lalonde R. Regional brain variations of cytochrome oxidase activity in Relnrl-orl mutant mice. J Neurosci Res. 2006;83:821–831. doi: 10.1002/jnr.20772. [DOI] [PubMed] [Google Scholar]
- Tissir F, Goffinet AM. Reelin and brain development. Nat Rev Neurosci. 2003;4:496–505. doi: 10.1038/nrn1113. [DOI] [PubMed] [Google Scholar]
- Van der Loos H. Barrelloids in mouse somatosensory thalamus. Neurosci Lett. 1976;2:1–6. doi: 10.1016/0304-3940(76)90036-7. [DOI] [PubMed] [Google Scholar]
- Waite PME. Trigeminal sensory system. In: Paxinos G, editor. The rat nervous system. Ed 3. San Diego: Academic; 2004. pp. 817–851. [Google Scholar]
- Watakabe A, Ichinohe N, Ohsawa S, Hashikawa T, Komatsu Y, Rockland KS, Yamamori T. Comparative analysis of layer-specific genes in mammalian neocortex. Cereb Cortex. 2007;17:1918–1933. doi: 10.1093/cercor/bhl102. [DOI] [PubMed] [Google Scholar]
- Welker C. Microelectrode delineation of fine grain somatotopic organization of (SmI) cerebral neocortex in albino rat. Brain Res. 1971;26:259–275. [PubMed] [Google Scholar]
- Welker C. Cyto-architectural organization of somatsensory (SmI) cortical “barrel field” in reeler mutant mice. Anat Rec. 1976;184:560–561. [Google Scholar]
- Welker C, Woolsey TA. Structure of layer IV in the somatosensory neocortex of the rat: description and comparison with the mouse. J Comp Neurol. 1974;158:437–453. doi: 10.1002/cne.901580405. [DOI] [PubMed] [Google Scholar]
- Welt C, Steindler DA. Somatosensory cortical barrels and thalamic barreloids in reeler mutant mice. Neuroscience. 1977;2:755–766. doi: 10.1016/0306-4522(77)90029-x. [DOI] [PubMed] [Google Scholar]
- Wong-Riley MT, Welt C. Histochemical changes in cytochrome oxidase of cortical barrels after vibrissal removal in neonatal and adult mice. Proc Natl Acad Sci U S A. 1980;77:2333–2337. doi: 10.1073/pnas.77.4.2333. [DOI] [PMC free article] [PubMed] [Google Scholar]
- Woolsey TA, Van der Loos H. The structural organization of layer IV in the somatosensory region (SI) of mouse cerebral cortex. The description of a cortical field composed of discrete cytoarchitectonic units. Brain Res. 1970;17:205–242. doi: 10.1016/0006-8993(70)90079-x. [DOI] [PubMed] [Google Scholar]
- Woolsey TA, Anderson JR, Wann JR, Stanfield BB. Effects of early vibrissae damage on neurons in the ventrobasal (VB) thalamus of the mouse. J Comp Neurol. 1979;184:363–380. doi: 10.1002/cne.901840210. [DOI] [PubMed] [Google Scholar]
- Yamamoto T, Sakakibara S, Mikoshiba K, Terashima T. Ectopic corticospinal tract and corticothalamic tract neurons in the cerebral cortex of yotari and reeler mice. J Comp Neurol. 2003;461:61–75. doi: 10.1002/cne.10678. [DOI] [PubMed] [Google Scholar]
- Yoneshima H, Yamasaki S, Voelker CC, Molnár Z, Christophe E, Audinat E, Takemoto M, Nishiwaki M, Tsuji S, Fujita I, Yamamoto N. ER81 is expressed in a subpopulation of layer 5 neurons in rodent and primate neocortices. Neuroscience. 2006;137:401–412. doi: 10.1016/j.neuroscience.2005.08.075. [DOI] [PubMed] [Google Scholar]