

Abstract
Neocortical neurons in vivo process each of their individual inputs in the context of ongoing synaptic background activity, produced by the thousands of presynaptic partners a typical neuron has. Previous work has shown that background activity affects multiple aspects of neuronal and network function. However, its effect on the induction of spike-timing dependent plasticity (STDP) is not clear. Here we report that injections of simulated background conductances (produced by a dynamic-clamp system) into pyramidal cells in rat brain slices selectively reduced the magnitude of timing-dependent synaptic potentiation while leaving the magnitude of timing-dependent synaptic depression unchanged. The conductance-dependent suppression also sharpened the STDP curve, with reliable synaptic potentiation induced only when EPSPs and action potentials (APs) were paired within 8 ms of each other. Dual somatic and dendritic patch recordings suggested that the deficit in synaptic potentiation arose from shunting of dendritic EPSPs and APs. Using a biophysically detailed computational model, we were not only able to replicate the conductance-dependent shunting of dendritic potentials, but show that synaptic background can truncate calcium dynamics within dendritic spines in a way that affects potentiation more strongly than depression. This conductance-dependent regulation of synaptic plasticity may constitute a novel homeostatic mechanism that can prevent the runaway synaptic potentiation to which Hebbian networks are vulnerable.
Introduction
Activity-dependent changes in synaptic strength depend on the properly timed integration of subthreshold and suprathreshold signals. Synaptic strengthening (or long-term potentiation) occurs when a presynaptic neuron repetitively fires before a postsynaptic neuron; when the order is reversed, the synapse undergoes synaptic weakening (or long-term depression). This is known as spike-timing dependent plasticity (STDP) (Caporale and Dan, 2008). Although the basic STDP protocol is straightforward, experiments over the last decade have revealed a rich underlying complexity. The strength and sign of synaptic change depend not only on relative spike timing, but on chemical neuromodulators (Seol et al., 2007), synapse position (Sjöström et al., 2008), EPSP shape (Fuenzalida et al., 2007), and the number and frequency of spikes (Sjöström et al., 2001; Froemke et al., 2006).
In the intact neocortex, integrative properties also depend on the level of synaptic background activity (Destexhe et al., 2003). Generally speaking, neocortical neurons in vivo reside in an environment of strong synaptic activity. This activity is generated by stochastic release from the thousands of synapses a typical neuron has and is maintained through local network dynamics (Haider and McCormick, 2009). Estimates of its effects on neuronal properties vary considerably. (Arieli et al., 1996; Borg-Graham et al., 1998; Steriade et al., 2001; Higley and Contreras, 2006). Choosing conservatively, background is thought to depolarize neurons by ∼10 mV, induce membrane potential fluctuations of several millivolts, and increase membrane conductance by more than a factor of two. Recent studies have built a compelling case for the role of background in the modulation of neuronal gain (Chance et al., 2002), adjusting sensitivity to inputs (Arieli et al., 1996; Borg-Graham et al., 1998), and shaping the temporal characteristics of subthreshold potentials (Destexhe and Paré, 1999). Despite this work, how background activity affects the induction of synaptic plasticity is not clear.
In these experiments, we addressed this issue by attempting to induce STDP while subjecting pyramidal neurons in neocortical brain slices to a simulated “in vivo-like” synaptic background. This background included both excitatory and inhibitory conductances and was introduced through a patch electrode using the dynamic-clamp method (Desai and Walcott, 2006). It was designed to mimic the background inputs neurons receive in the intact cortex. We found that the simulated conductances impaired the induction of timing-dependent long-term potentiation (t-LTP). This was a consequence of shunting, as we also observed it when we replaced the fluctuating in vivo-like background with a constant conductance of a similar mean. By contrast, the induction of timing-dependent long-term depression (t-LTD) was affected to a much lesser extent, and its magnitude was not significantly changed. Using dual somatic and dendritic patch recordings, we built a biophysical model that could replicate these results. Our findings have a number of implications for how plasticity operates in the intact brain. In particular, they bear on the question of homeostatic regulation of networks and the interaction between neuromodulation and plasticity. We end this study by examining the first issue using a phenomenological model and the second using pharmacology.
Methods and Methods
Electrophysiology.
Coronal slices of 350 μm thickness containing primary auditory cortex were prepared from male postnatal day 14 (P14)–P24 Sprague Dawley rats in accordance with institutional animal care and welfare rules. Animals were deeply anesthetized with isoflurane before decapitation. Their brains were quickly removed and sectioned in ice-cold artificial CSF (ACSF) containing the following (in mm): 126 NaCl, 3 KCl, 1 NaH2PO4, 25 NaHCO3, 1 MgCl2, 2.5 CaCl2, and 25 dextrose. After sectioning, slices were transferred to a custom-made oxygenated interface chamber, kept at 34°C throughout the day, and allowed to equilibrate for at least 2.5 h before the start of experiments. For recordings, slices were transferred one at a time to a submerged chamber mounted on a fixed-stage upright microscope (Leica DMLFSA). They were continuously perfused with warmed (30.5°C), oxygenated ACSF flowing at a rate of 2–3 ml/min. An agonist of the β-adrenergic receptor, isoproterenol hydrochloride, was purchased from Sigma-Aldrich.
Layer 2/3 pyramidal neurons in primary auditory cortex were identified at 400× magnification using infrared differential interference contrast optics and an infrared-sensitive camera (Dage-MTI). Whole-cell somatic and dendritic patch recordings were obtained with pulled glass micropipettes (somatic, 4–5 MΩ; dendritic, 7–9 MΩ). The standard intracellular solution contained the following (in mm): 110 K-gluconate, 10 KCl, 10 HEPES, 10 (Na)phosphocreatine, 4 (Mg)ATP, 0.3 (Na)GTP, and 0.1% w/v biocytin, adjusted with KOH to pH 7.4 and with sucrose to 292 mOsm. Liquid junction potentials (5 mV) were left uncorrected. Somatic whole-cell recordings were accepted if input resistances were >100 MΩ, series resistances were <20 MΩ, and membrane potentials were more negative than −60 mV. The average resting potential was −74 mV. Presynaptic fiber stimulation pulses were delivered at 0.1 Hz using a bipolar stimulating electrode placed at the proximal apical region to evoke EPSPs with rise times of at least 1 mV/ms and amplitudes of 3–10 mV.
All electrophysiological recordings were made using a Multiclamp 700A amplifier (Molecular Devices). Signals were filtered at 4 kHz and digitized at 10 kHz. Dynamic-clamp experiments were performed with a 16-bit digital signal processing board (dSpace) using custom software written in Matlab and Simulink (MathWorks). To minimize series resistance errors, the bridge was carefully balanced for current-clamp and dynamic-clamp recordings. Dynamic-clamp simulations were only run during the induction of synaptic plasticity.
All data analyses were performed using custom software written in Matlab. Plots were created using SigmaPlot 8.02. Numerical averages are presented as mean ± SEM. In the plasticity experiments, unless otherwise stated, within-group statistical significance was calculated using the paired Student's t test and between-group significance was calculated using the unpaired Student's t test.
Dynamic-clamp protocols.
All dynamic-clamp simulations were run at 10 kHz, as described previously (Desai and Walcott, 2006). For each conductance g(t), a current I(t) was injected through the somatic electrode: I(t) = g(t)[V(t) − Erev], with V(t) being the measured membrane potential and Erev the reversal potential for that conductance. Three types of conductances were simulated in different experiments: fluctuating synaptic background conductances, simulated EPSPs (dynEPSPs) made up of AMPA and NMDA components, and a static shunting conductance.
Synaptic background activity was simulated using the “point conductance” model (Destexhe et al., 2001). Two conductance trains, one representing excitatory inputs and the other representing inhibitory inputs, were generated independently as Ornstein–Uhlenbeck processes. Each was determined by an equation of the following form:
where g(t) is the value of the conductance, g0 is its mean value, τ is a time constant, D is a “diffusion” constant, and χ(t) is a Gaussian white noise term of zero mean and unit SD. As illustrated in supplemental Figure 1 (available at www.jneurosci.org as supplemental material), such an equation produces a random walk in time around the mean value, with a variance given by σ2 = Dτ/2. The reversal potentials were Eexc = 0 mV and Einh = −74 mV. As demonstrated previously (Destexhe et al., 2001; Fellous et al., 2003), background input can be modeled by making the following parameter choices for the excitatory and inhibitory trains: τexc = 2.5 ms, τinh = 8 ms, ginh ≈ 5 gexc, and σinh ≈ 2.5 σexc. We followed these guidelines: normally, we set gexc between 5 and 15 nS and σexc between 2.5 and 7.5 nS, because these choices (and the corresponding ones for the inhibitory train) depolarized neurons by ∼9 mV and produced membrane potential fluctuations of 3–5 mV. In the plasticity experiments, care was taken to adjust parameters so as to induce natural fluctuations with few spontaneous spikes.
DynEPSPs were generated by combining unitary AMPA and NMDA conductances. Each unitary conductance was modeled by a difference of exponentials (Harsch and Robinson, 2000):
for times t greater than or equal to the start time t0 of input and zero for earlier times. Here, τr and τd are rise and decay time constants, respectively, and ḡ is a scaling factor. In addition, the magnesium block of NMDA receptors was approximated by multiplying its conductance by 1/(1 + K1exp[−K2V(t)]) with K1 = 0.6 and K2 = 0.06 mV−1. The rise and decay time constants were set to 1 and 3 ms (AMPA) and 5 and 100 ms (NMDA). The scaling factor ḡ was varied between 2 and 10 nS for the AMPA conductance. We assumed that AMPA and NMDA conductances were always simultaneously activated, and that the NMDA scaling factor was always 1/10 the AMPA scaling factor (Watt et al., 2000). The AMPA–NMDA reversal potential was 0 mV.
A shunting conductance was added by setting ḡshunting to a constant value with reversal potential of approximately −66 mV, a value closely matching the membrane potential of cells recorded in vivo during active cortical states (Paré et al., 1998). All plasticity induction protocols, whether they included dynamic-clamp conductance or not, were run with cells at this baseline membrane potential, maintained by a constant current.
Biophysical neuron model.
The multicompartmental model of a layer 2/3 pyramidal neuron (used in Figs. 6, 7) was constructed using the neural simulator NEURON (Hines and Carnevale, 1997). It was similar to the model of Traub et al. (2003) and contained soma, axon, apical shaft, distal apical dendrites, basal dendrites, and a single dendritic spine of variable location. All compartments contained both passive and active (Hodgkin–Huxley) conductances. These included leak, sodium (fast), potassium (delayed rectifier, A-type, M-type, calcium dependent), and calcium (T-type and L-type) conductances. The spine was modeled as a sphere with a cylindrical neck. AMPA and NMDA receptors were inserted at the spine, with their kinetics modeled by two-state processes (Destexhe et al., 1994). A full description of the model is given in the supplemental material (available at www.jneurosci.org).
Figure 6.
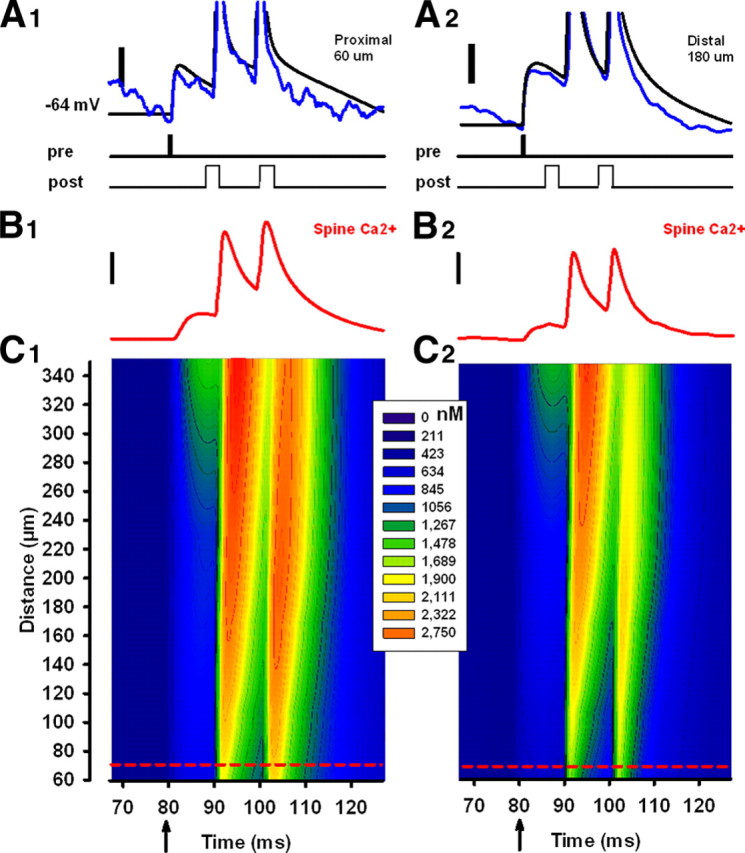
In vivo-like conductances reduce spine Ca2+ in a biophysical model. A1, A2, Somatic membrane potentials in the biophysical model after delivery of an EPSP paired with a bAP (burst frequency, 100 Hz) in the absence (black traces) or presence (blue traces) of in vivo-like fluctuating background conductances, for proximal and distal inputs. Scale bars: 10 mV. The conductances are the same as those in Figure 1B. B1, B2, Spine Ca2+ inside a spine 70 μm from the soma in response to the pairing protocol, in the absence (left) or presence (right) of background conductances. Scale bars: 500 nm. C1, C2, Spine Ca2+ at various points along the apical dendrite after the paired stimulation (arrow) in the absence (left) or presence (right) of background conductances. Calcium concentration over time is represented by the color scale. Spine position was changed in 10 μm increments. The positions of the individual traces shown in B1 and B2 is denoted by the short red dashed lines.
Figure 7.
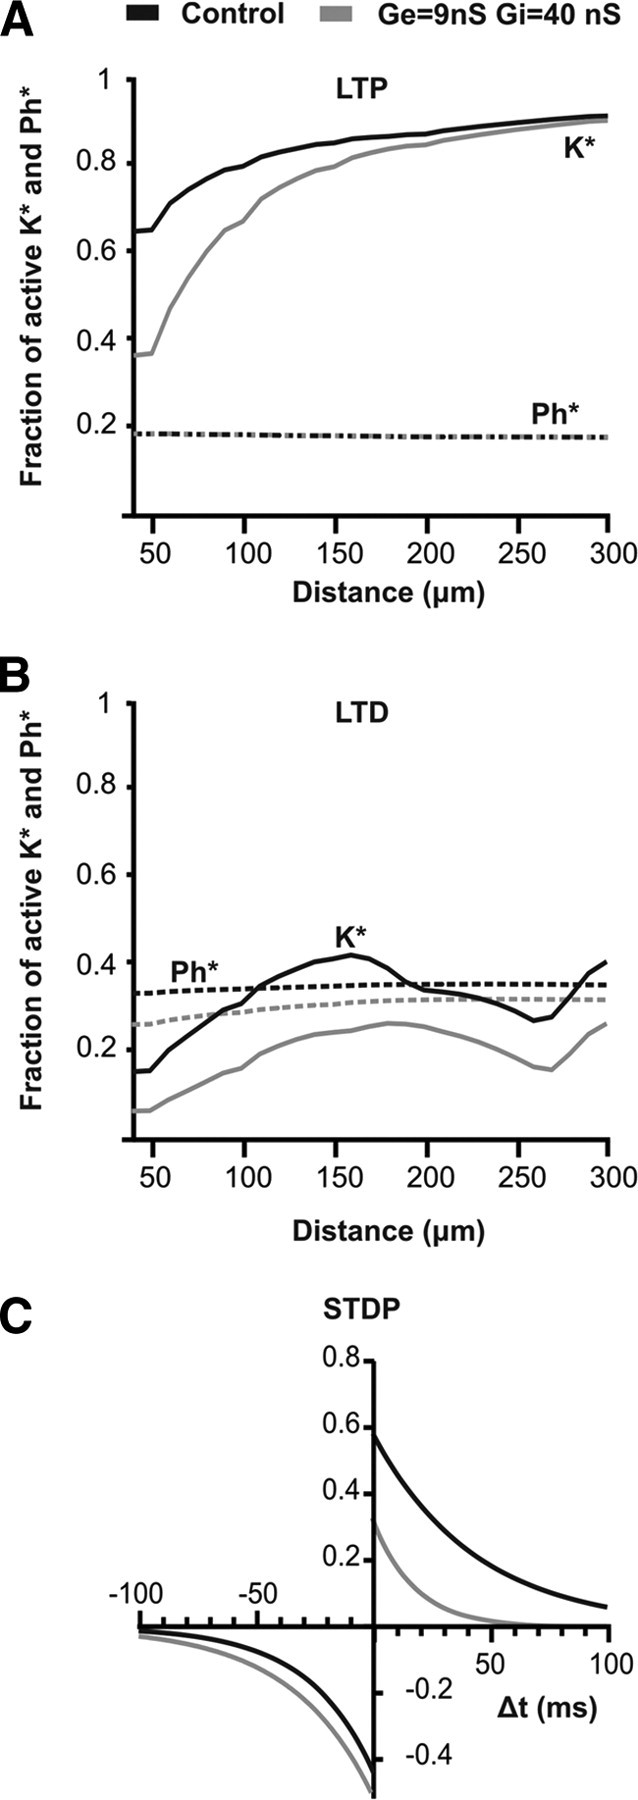
STDP in a biophysical model. A, A t-LTP protocol (EPSP–bAP pairing interval, +10 ms) was run. Solid lines indicate the maximum activated LTP enzyme K*, and dashed lines indicate the maximum activated LTD enzyme Ph*. The simulations were run in the absence (black) or presence (gray) of fluctuating background conductances. The conductances were the same as those used in Figure 1B. The horizontal axis is spine distance from the soma. B, A t-LTD protocol (EPSP–bAP pairing interval, −20 ms) was also run. Again K* and Ph* are plotted as a function of spine position in the absence or presence of fluctuating background conductances. C, STDP curves were constructed by varying the pairing interval in the absence (black) or presence (gray) of background conductances. These are data for a spine positioned 50 μm from the soma.
Plasticity was included according to the biophysical model of Badoual et al. (2006) in which synaptic strength is regulated by the activation states of LTP and LTD enzymes. The kinetic scheme for the LTP enzyme depends only on calcium concentration, Ca2+:
where K and K* respectively represent the nonactivated and activated forms of the LTP enzyme. This scheme incorporates the dependence of Ca2+/calmodulin-dependent protein kinase II autophosphorylation on the binding of four Ca2+ ions to calmodulin and the empirical observation that LTP requires high peak calcium signals. The kinetic scheme for the LTD enzyme depends on both Ca2+ and glutamate concentration, T:
Together these activate the LTD enzyme Ph:
The amount of LTP (LTD) is directly proportional to the maximum value of the concentration of K* (Ph*). The total plasticity is given by the difference between LTP and LTD contributions. The rate constants were ak = 2 × 10¹¹ mmol−4 ms−1, bk = 1 ms−1, am = 520 mmol−1 ms−1, bm = 0.1 ms−1, ah = 1 mmol−1 ms−1, bh = 0.4 ms−1. Other parameters were as in Badoual et al. (2006).
Phenomenological plasticity model.
The membrane potential V of the integrate-and-fire model neuron we used (in Fig. 8) was determined by the following equation:
The terms at right are a leak current, a spike-triggered adaptation current, excitatory synaptic currents, and inhibitory synaptic currents. The fixed parameters were capacitance C (200 pF), leak conductance gL (10 nS), resting potential EL (−70 mV), adaptation reversal potential EAHP (−70 mV), excitatory reversal potential Eexc (0 mV), and inhibitory reversal potential Einh (−70 mV). The neuron emitted a spike every time the membrane potential reached −54 mV. At the next time step, V was reset to −60 mV, and the adaptation conductance gAHP was incremented by 1 nS. Between spikes, gAHP relaxed exponentially back to zero with a 100 ms decay time. The excitatory and inhibitory synaptic currents represented the summed contributions of 1000 excitatory and 200 inhibitory synapses. Each of the presynaptic inputs was stimulated by Poisson spike trains and produced exponential conductances. The decay times of the excitatory and inhibitory conductances were 5 and 10 ms, respectively. The inhibitory synapses were fixed at a unitary weight of 7.5 pS. The excitatory synapses evolved according to the rules of STDP; each was bounded by a lower limit of 0 pS and an upper limit of 15 pS. STDP was implemented using the learning windows of Figure 8A. The windows describe the fractional change in synaptic weight for each presynaptic–postsynaptic spike pair (i.e., a multiplicative update rule). All pairings of presynaptic and postsynaptic spikes contributed to changes in synaptic weight (except where noted). The t-LTD windows are exponential functions of relative time with minimum −0.5% and resting decay time 30 ms; the t-LTP windows are exponential functions of relative time with maximum 1% and resting decay time 15 ms. In some cases, correlation across groups of N excitatory synapses was introduced by randomly distributing N2 Poisson trains between them (Destexhe and Paré, 1999). At every time step, the Poisson trains were redistributed. This produced correlations because N2 was smaller than N. Varying the value of N2 allowed us to vary correlation strength.
Figure 8.

A conductance-dependent STDP learning rule stabilizes synaptic weight distributions while preserving competition between presynaptic inputs. A, Three phenomenological learning rules were considered. Each represents the LTP and LTD windows as exponentially decaying curves. Under the first rule (LTP only), the LTP decay time is inversely proportional to the total instantaneous conductance g (normalized to the resting conductance). Under the second (Both), the LTP and LTD decay times are both scaled by conductance. Under the third (Neither), the LTP and LTD decay times are independent of conductance. B, A leaky integrate-and-fire neuron is subjected to uncorrelated Poisson inputs from 1000 excitatory and 200 inhibitory synapses, each firing at 10 Hz. Initially, the excitatory weights are distributed uniformly between zero and an upper limit (wMax), as shown in the histograms at the right. This produces rapid firing, as shown on the left. After sustained regulation by the LTP-only rule, the synaptic weight distribution remains broad, and spike firing in response to the uncorrelated inputs slows dramatically. By contrast, the other two learning rules produce large increases in firing rate because excitatory synaptic weights are pushed toward the upper limit. C, The LTP-only rule preserves synaptic competition. The excitatory synapses are divided into two groups. Group 1 (neurons 1-500) remains uncorrelated. Group 2 (neurons 501-1000) is correlated with Pearson coefficients c between 0 and 0.2. After 5 min regulation by the LTP-only rule, synaptic weights in the correlated group were pulled upward, whereas those in the uncorrelated group were pushed downward. The size of the effect varies with correlation strength. The scatter plots show individual weights in the uncorrelated (black dots) and correlated (gray dots) groups. The line plot shows the normalized mean weights for both groups (uncorrelated in black, correlated in gray) as a function of correlation coefficient.
Results
In vivo-like activity blocks t-LTP
To study the effects of background conductance on STDP, we combined whole-cell electrophysiology with dynamic clamp to simulate and inject conductances into layer 2/3 pyramidal neurons. We used rapidly fluctuating excitatory and inhibitory conductance trains that recreated several of the electrophysiological conditions neocortical neurons experience in vivo (Destexhe et al., 2001; Desai and Walcott, 2006; Haider and McCormick, 2009). The background injections depolarized membrane potential (Vm) to approximately −66 mV (from a control average of −74 mV), caused large Vm fluctuations with occasional action potentials (APs), and increased membrane conductance several fold (Fig. 1B, inset; supplemental Fig. 1A–C, available at www.jneurosci.org as supplemental material). We compared t-LTP induction in the presence of this background to t-LTP induction in its absence (“control”). In this way, we were able to test in vitro a question about how plasticity operates in vivo: does synaptic background activity affect the induction of synaptic plasticity?
Figure 1.
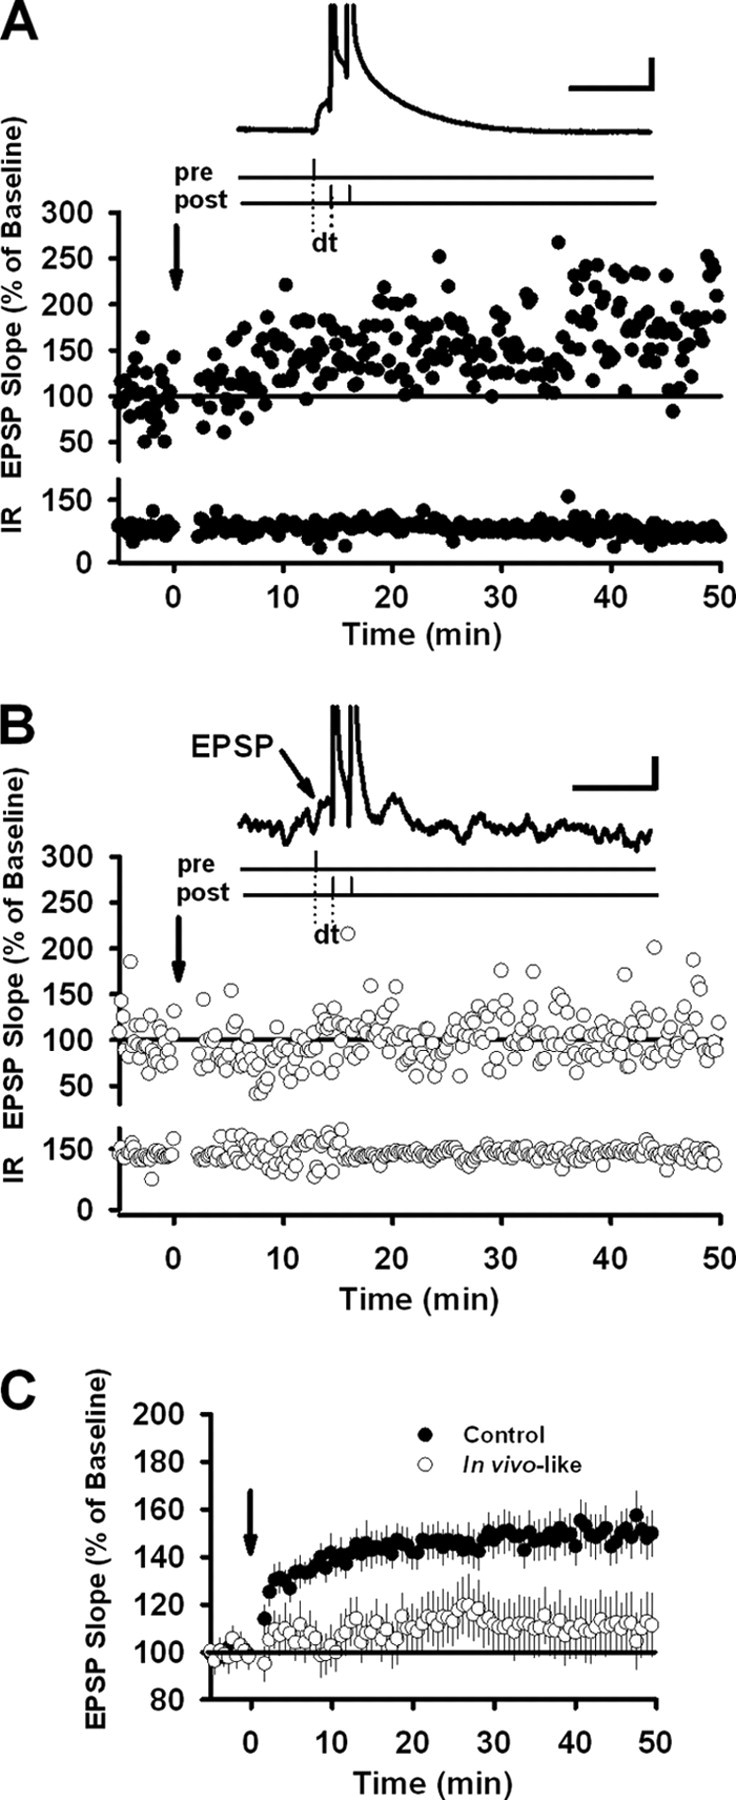
Fluctuating background conductances reduce t-LTP in layer 2/3 pyramidal cells. A, Experimental protocol used to induce synaptic potentiation in control cells. After a stable 5 min baseline, EPSPs were repeatedly paired with a burst of two postsynaptic APs (burst frequency, 100 Hz) with a delay of +10 ms (dt). The arrow indicates pairing onset (pairing frequency, 1 Hz; 100 total pairings). An example of an EPSP–bAP pairing is shown in the inset. At the bottom is the input resistance (IR) (in megaohms) over time. B, The same protocol applied to cells receiving the in vivo-like background conductance injections. In this example, the excitatory conductance had a mean of 9 nS and a standard deviation of 3 nS; the inhibitory conductance had a mean of 40 nS and a standard deviation of 6 nS. Calibration: vertical, 10 mV; horizontal, 50 ms. C, Average timing-dependent potentiation in control cells (n = 19) and cells paired in the presence of background conductance (n = 18). In all cases, a pairing delay of +10 ms was used. Error bars indicate mean ± SEM.
To maximize the effects of synaptic background on the induction of STDP, we selected EPSPs with rise rates >1 mV/ms. Large values indicate proximity to the soma (Letzkus et al., 2006), and this choice ensured that the conductance injections had a strong effect on the stimulated synapses (Williams, 2004). We attempted to induce t-LTP by pairing EPSPs with bursts of two postsynaptic action potentials (bAPs; burst frequency, 100 Hz) arriving 10 ms after EPSP onset (Fig. 1A). During the pairing period, we depolarized control cells to approximately −66 mV to match the average membrane potential of cells injected with synaptic background. Under control conditions, pairing EPSPs and bAPs 100 times (pairing frequency, 1 Hz) elicited potentiation of synaptic transmission in 17 of 19 recordings (control average, 159.1 ± 12.1%; p < 0.0011, paired t test) (Fig. 1A,C). By contrast, synaptic background activity (which was present only during the induction period) strongly impaired the induction of t-LTP (background average, 109.2 ± 11.7%; p > 0.05, paired t test) (Fig. 1B,C). Only 7 of 17 recordings showed significant potentiation in the presence of synaptic background (p < 0.001), whereas 6 of 17 recordings showed depression (p < 0.001). The remaining recordings did not show any change in synaptic strength (p > 0.05). In short, injections of synaptic background reduced the magnitude of t-LTP, to the extent that potentiation and depression were equally likely.
Membrane conductance sharpens the LTP side of the STDP curve
Synaptic background activity has three main effects: it depolarizes neurons, triggers large Vm fluctuations, and increases membrane conductance. We wanted to determine which of these factors was responsible for the deficit in t-LTP. We excluded depolarization because both groups of recordings were paired at the same membrane potential (−66 mV), and depolarization has been shown to promote rather than block t-LTP (Sjöström et al., 2001). Therefore, the deficit in t-LTP could have been caused by the increase in shunting or by the fluctuations in membrane potential. To distinguish between these two possibilities, we repeated the t-LTP experiment of Figure 1, but replaced the fluctuating excitatory and inhibitory conductances with a nonfluctuating shunting conductance (Fig. 2A,C). EPSPs followed within ∼8 ms by bAPs induced strong t-LTP in control recordings (p < 0.0005, paired t test), but a much smaller increase in synaptic strength when 50 nS of shunting conductance was added (p < 0.05, paired t test). Average synaptic potentiation was significantly different between the two groups (control, 185.7 ± 17.4%, n = 11; shunting, 114.6 ± 8.3%, n = 10; p < 0.005, unpaired t test) (Fig. 2B,D). Increasing the delay between EPSPs and bAPs to ∼11 ms still produced synaptic potentiation in control cells, but not in cells injected with 50 nS (control, 140.4 ± 9.5%, n = 13; shunting, 101.4 ± 12.9%, n = 11; p < 0.025, unpaired t test) (Fig. 2B,D). EPSP–bAP pairs separated by ∼17 ms also triggered significant synaptic potentiation under control conditions, but not when paired in the presence of 50 nS (control, 126.4 ± 7.8%, n = 13; shunting, 102.0 ± 6.9%, n = 10; p < 0.05, unpaired t test) (Fig. 2B,D). As expected, cells paired at longer delays failed to produce significant increases in synaptic strength in either group (p > 0.2, unpaired t test) (Fig. 2B,D). Although most data points for these long-delay pairings lay below baseline levels, the amounts of t-LTD induced were not significant. On the basis of these data, we concluded that Vm fluctuations were not responsible for the deficit in t-LTP because t-LTP was impaired to an approximately equal degree whether we used synaptic background conductances that induced Vm fluctuations (Fig. 1) or shunting conductance that did not (Fig. 2). This indicates that membrane conductance was the critical factor.
Figure 2.

Membrane conductance sharpens the potentiation side of the STDP curve. A, Single representative experiment showing the change in synaptic strength after the induction of t-LTP in a control cell. t-LTP was induced after a stable 5 min baseline by pairing EPSPs and bAPs with a delay of +10 ms (dt). The arrow indicates pairing onset (pairing frequency, 1 Hz; 100 total pairings). Traces show the synaptic responses evoked before pairing (gray) and after pairing (black). At the bottom is the input resistance (IR) (in megaohms) over time. B, Single representative experiment showing the change in synaptic strength after the induction of t-LTP in a cell injected with 50 nS shunting conductance. C, Change in EPSP slope for individual t-LTP experiments performed on control cells as in A but with various pairing delays (dt; n = 44). Also shown are mean changes for experiments grouped into four ranges of delays: 5–9.5 ms, 10–12 ms, 13–20 ms, and >20 ms. D, Same as C but for t-LTP experiments performed on cells injected with 50 nS shunting conductance (n = 39). Calibration: horizontal, 20 ms; vertical, 5 mV. Error bars indicate mean ± SEM.
An important question is, when during the t-LTP induction period did conductance have its effect? Was it before, during, or after each of the EPSP-bAP pairs? This question arises because the dynamic-clamp system was on during the entire induction period (100 s). A good deal of this period was “dead time” during which neither EPSPs nor bAPs were present, as these were paired only once every second. However, it is unlikely that the presence of conductance during this dead time was important. The acute slice preparation is very quiet. In the absence of stimuli imposed by the experimenter, membrane potential is stable. So it was during the dead time. The shunting conductance's reversal potential was set equal to this membrane potential, meaning that the dynamic clamp was not injecting current in between EPSP-bAP pairs. We can be confident that conductance suppressed t-LTP because of its effects on the interaction between EPSPs and bAPs (Bernander et al., 1991). In the remaining experiments, we used static shunting conductance exclusively.
A second question is whether somatic conductance injections suppressed faster-rising EPSPs more than slower-rising EPSPs, which may be positioned farther from the soma. We plotted the average EPSP slope before pairing versus the average EPSP slope after pairing (supplemental Fig. 2, available at www.jneurosci.org as supplemental material). If shunting injections affected faster EPSPs more than slower EPSPs, data points representing the former should be more likely than those representing the latter to lie below or along the diagonal line, which represents the position of no change in synaptic strength. But this was not the case. In the presence of 50 nS shunting conductance, data points for both faster (>1.5 mV/ms) and slower (<1.5 mV/ms) EPSPs showed significant suppression of t-LTP. This indicates that, given the proximal position of the stimulating electrode, EPSPs were generated close enough to the soma for the dynamic clamp to be effective.
t-LTD is only modestly affected by membrane conductance
As we have shown, membrane conductance regulates the induction of t-LTP. Does it also affect the induction of t-LTD? To answer this question, we reversed the temporal order of EPSPs and bAPs (Fig. 3, top inset). Now, bAPs were followed rather than preceded by EPSPs. We compared t-LTD induction in the presence or absence of a 50 nS shunting conductance, with a reversal potential again set equal to the baseline potential. Pairing intervals of 18–22 ms induced significant amounts of t-LTD in both control neurons and neurons injected with 50 nS (control, 75.8 ± 6.4%, n = 14; p < 0.001, paired t test; shunting, 81.3 ± 6.5%, n = 13; p < 0.01, paired t test) (Fig. 3A). Net LTD did not differ between the two groups (p = 0.55, unpaired t test). Increasing the delay between bAPs and EPSPs to 25–35 ms induced slightly larger depression of synaptic transmission in both groups (control, 69.3 ± 5.0%, n = 21; p < 0.0001; shunting, 76.3 ± 7.4%, n = 18; p < 0.003, paired t test) (Fig. 3B). Net LTD did not differ between them (p = 0.43, unpaired t test) (Fig. 3B). Increasing the delay between bAPs and EPSPs to 36–45 ms also produced no difference in net LTD between the two groups (control, 71.7 ± 5.5%, n = 7; p < 0.0001, paired t test; shunting, 78.7 ± 9.7%, n = 7; p < 0.025, paired t test; p = 0.27, unpaired t test) (Fig. 3C). Finally, no t-LTD resulted in either group when EPSPs lagged bAPs by delays of 46–55 ms (control, 87.0 ± 7.8%, n = 5; p > 0.05, paired t test; shunting, 97.4 ± 4.9%, n = 5; p > 0.05, paired t test) (Fig. 3D).
Figure 3.

Membrane conductance does not suppress t-LTD. t-LTD was induced in both control cells and cells injected with 50 nS shunting conductance. After acquisition of a stable 5 min baseline, t-LTD-inducing stimuli were delivered, as illustrated at the top of each graph, at times indicated by the arrows. In every case, a bAP (burst frequency, 100 Hz) was followed after a variable delay by an EPSP. As in the t-LTP experiments, a total of 100 pairings were made (pairing frequency, 1 Hz). Data are divided based on the pairing delay used. A, Pairing delays of 18–22 ms (control, n = 14; 50 nS, n = 13). B, Pairing delays of 25–35 ms (control, n = 21; 50 nS, n = 18). C, Pairing delays of 36–45 ms (control, n = 7; 50 nS, n = 7). D, Pairing delays of 46–55 ms (control, n = 5; 50 nS, n = 5). Error bars indicate mean ± SEM.
It is worth noting that the average amount of t-LTD was smaller for neurons injected with 50 nS in every case, even though the difference did not reach statistical significance in any of them. This suggests membrane conductance might have had a small (and difficult to detect) effect on t-LTD. The one difference between the control and 50 nS groups we were able to pull out of these data was in the time after pairing that t-LTD reached statistical significance. For each recording that showed t-LTD (at the p < 0.01 level), we estimated this time by sliding a 5 min window from the end of the recording forward, testing it at each time point against the 5 min window just before the start of t-LTD induction. The earliest contiguous time point that showed a significant difference between windows became our estimate of time to t-LTD for that recording. The control group (n = 37) reached t-LTD by this measure 14.2 ± 2.0 min after pairing, whereas the 50 nS group (n = 30) took 20.2 ± 2.2 min. This difference was significant (p < 0.05, unpaired t test).
We conclude that, although membrane conductance may have had a small effect on t-LTD, the effect was much smaller than the one it had on t-LTP. In one of the sections that follow, we will use a biophysical model to explore why this might be.
A range of conductance levels disrupt t-LTP
Membrane conductance in vivo varies enormously and depends on such factors as brain region, the amount of sensory stimulation, and the level of arousal (Steriade et al., 2001; Castro-Alamancos, 2004). Given the many sources of variability, it is likely that in vivo membrane conductance operates within a constantly changing range of values. To determine how large shunting conductance must be to disrupt t-LTP, we attempted to induce potentiation in the presence or absence of three conductance levels: 50, 25, and 12.5 nS. In all cases, we used a timing interval of 10 ms between EPSPs and bAPs. Control and conductance recordings were interleaved. In Figure 4A–C, comparisons are between conductance recordings and control recordings made on the same days, using the same solutions and tissue from the same animals. In Figure 4D, all control recordings have been combined. As was true previously, control recordings showed robust t-LTP in all three sets of experiments. However, t-LTP was successfully blocked when cells were injected with 50 nS of shunting conductance (control, 139.0 ± 9.6%, n = 13; 50 nS, 93.7 ± 12.8%, n = 10; p < 0.01, unpaired t test) (Fig. 4A,D) and impaired when cells were injected with 25 nS (control, 161.1 ± 11.6%, n = 13; 25 nS, 117.2 ± 9.1%, n = 10; p < 0.01, unpaired t test) (Fig. 4B,D). By contrast, 12.5 nS of shunting conductance had no effect (control, 155.5 ± 14.3%, n = 10; 12.5 nS, 158.1 ± 19.1%, n = 8; p > 0.05, unpaired t test) (Fig. 4C,D).
Figure 4.

Various levels of membrane conductance affect t-LTP induction. A–C, t-LTP was induced as in Figure 2 with pairing delays fixed at 10 ms. Control recordings were compared with recordings in which cells were injected with one of three different constant conductance levels: control (n = 13) versus 50 nS (n = 10); control (n = 13) versus 25 nS (n = 10); control (n = 10) versus 12.5 nS (n = 8). D, Summary box plot for all of the experiments (control, n = 36; 50 nS, n = 10; 25 nS, n = 10; 12.5, n = 8). Between-group statistical significance was determined using the unpaired t test; *p < 0.01. Error bars indicate mean ± SEM.
Membrane conductance shapes subthreshold dendritic responses
The increased shunt caused by synaptic background is expected to suppress the spread, amplitude, and duration of dendritic EPSPs, all of which are key factors in the induction of STDP (Bernander et al., 1991; Destexhe and Paré, 1999). To characterize how shunting conductance affects dendritic EPSPs, we performed dendritic patch-clamp recordings and injected simulated EPSPs (dynEPSPs) (see Materials and Methods) at various points along the apical dendrite. At the same time, we used somatic patch-clamp recordings to increase the shunt of the somatodendritic compartment. DynEPSPs produced maximal depolarization at the injection sites, as expected, and these dynEPSPs showed considerable attenuation as they traveled toward the soma (supplemental Fig. 3, available at www.jneurosci.org as supplemental material). Strong dynEPSPs (10 nS scaling factor) had a forward-propagating space constant of 135 μm, whereas weak dynEPSPs (2 nS) had one of 175.5 μm. Although both strong and weak dynEPSPs propagated over significant distances, increasing the somatic shunt produced a large decrease in the peak amplitude of proximal dynEPSPs (<40 μm) and a moderate decrease in that of more distally generated dynEPSPs (>40 μm) (Fig. 5A1–A3) (exponential fits, n = 26). The peak-scaled area was significantly decreased for higher levels of shunting conductance (F(3,98) = 32.87; p = 8.69e-15) (Fig. 5B). An increase in membrane conductance is known to decrease the space constant and reduce the depolarization reaching the soma (Bernander et al., 1991). To quantify the suppression of dynEPSPs reaching the soma, we plotted the ratio of the somatic dynEPSP to the dendritic dynEPSP as a function of the distance between electrodes for different membrane conductance levels (colored lines). Similar to the attenuation of proximal dendritic peak dynEPSP amplitude (Fig. 5A3), the amplitude and decay (tau) of somatic dynEPSPs showed large decrements with higher levels of shunting conductance (peak soma, 0 nS, 7.5 ± 0.45 mV; 12.5 nS, 5.47 ± 0.33 mV; 25 nS, 3.97 ± 0.19 mV; 50 nS, 3.45 ± 0.83 mV; F(3,98) = 12.52; p = 5.34e-07) (Fig. 5C3) (tau soma, 0 nS, 58.12 ± 14.46 ms; 12.5 nS, 14.28 ± 2.74ms; 25 nS, 6.98 ± 0.22 ms; 50 nS, 5.49 ± 0.24 ms; F(3,101) = 11.44; p = 1.61e-06) (Fig. 5D). More importantly, the space constant of 10 nS dynEPSPs was reduced from 135 to 67.45 μm when cells were injected with 12.5 nS, to 46.4 μm when injected with 25 nS, and to 34.9 μm with 50 nS (Fig. 5C3, small inset, dashed lines). These data demonstrate that increases in somatic shunting conductance profoundly affect the integrative capacities of small apical dendrites of layer 2/3 neurons by suppressing the amplitude of proximally generated EPSPs and by reducing the propagation of subthreshold EPSPs toward the soma (Bernander et al., 1991; Destexhe et al., 1999; Rudolph and Destexhe, 2003).
Figure 5.

High conductance state suppresses subthreshold dendritic signals. A, Somatic conductance attenuates peak amplitude of simulated EPSPs (dynEPSPs) in dendrites. Left, Examples of dynEPSPs (10 nS) injected and recorded 25 μm (A1) or 120 μm (A2) along the apical dendrite. Colors indicate the amount of shunting conductance: black, 0 nS; green, 12.5 nS; red, 25 nS; blue, 50 nS. Right, The percentage by which dendritic dynEPSPs were attenuated by somatic conductance as a function of position along the apical tree for three conductance levels (A3). B, Average peak-scaled dynEPSP area for all of the dendritic recordings sites shown in A3 in the presence of various levels of nonfluctuating conductance (n = 26). Black bars are recordings at the soma; gray bars are recordings at the dendrite. C, Representative somatic voltage depolarizations in response to dynEPSPs injected at 25 μm (C1) or 120 μm (C2) along the apical dendrite. For comparison, the depolarizations at the injection site are shown in gray. Colors represent the level of added somatic conductance as in A. C3, Exponential fits showing the attenuation of somatic EPSP relative to dendritic EPSP for different dendritic positions, in the presence of various levels of added static conductance. Inset, Average space constant obtained from C3 as a function of the increase in somatic conductance. D, Average dynEPSP decay time constant measured in the soma and in dendrites in the presence of various levels of somatic conductance. Calibration: vertical, 2 mV; horizontal, 20 ms. Error bars indicate mean ± SEM.
Simulations of voltage and calcium transients in spines
Our dual patch-clamp experiments suggested that the deficit in t-LTP was caused by the strong influence of membrane conductance on dendritic potentials. However, conductance may fail to affect voltage responses within dendritic spines because of filtering of electrical signals by the spine neck (Araya et al., 2006). To examine whether somatic conductance can suppress electrophysiological responses within dendritic spines, we constructed a biophysically detailed NEURON model (Hines and Carnevale, 1997; Traub et al., 2003) and measured spine voltage and Ca2+ transients in the presence or absence of fluctuating synaptic background conductances.
To draw parallels between the NEURON model and our experimental results, we calibrated the model so that its behavior was consistent with our dendritic recordings, as well as electrophysiological properties reported by other groups (Svoboda et al., 1999; Sabatini et al., 2002; Waters et al., 2003; Larkum et al., 2007). For example, we adjusted parameters so that the model spine's Ca2+ transients, caused by individual EPSPs and APs, mimicked those in Sabatini et al. (2002). The resulting model had levels of dendritic filtering, distance-dependent AP amplitude attenuation, spine Ca2+ transients, and conductance spread along the apical tree that reproduced those observed in our experiments and published in the literature (supplemental Fig. 4, available at www.jneurosci.org as supplemental material). To test whether membrane conductance can attenuate spine voltage, we subjected the model cell to the same t-LTP protocol as was used in Figure 1, in the presence or absence of fluctuating synaptic background. Pairing an EPSP with a burst of APs generated strong membrane potential depolarization within dendritic spines, but these were reduced by synaptic background (Fig. 6A). It affected both the peak EPSP amplitude and the duration of the depolarization after an EPSP or a burst of APs, with ≤39% suppression for proximal spine locations (<60 μm) and ≤20% suppression for distal locations (<180 μm). These results indicate that increases in somatic conductance suppress voltage responses within dendritic spines in a manner that depends on both distance along the dendrite and conductance magnitude.
Because conductance increases might only affect spine voltage and fail to influence spine Ca2+ to a significant degree, we repeated these simulations and instead measured the evoked spine Ca2+ transient. Pairing EPSPs and bAPs produced large increases in spine Ca2+ (Fig. 6B), which were reduced by the synaptic background. To determine whether synaptic background reduces spine Ca2+ after an EPSP more than after a bAP, we simulated separate presentations of EPSPs and bAPs. We found that synaptic background suppressed by ≤10% spine Ca2+ generated by EPSPs and by ∼20% spine Ca2+ generated by bAPs (all spine positions) (supplemental Fig. 5, available at www.jneurosci.org as supplemental material). It affected spine Ca2+ on proximal spines (<150 μm) more than spine Ca2+ on distal spines (>280 μm) (supplemental Fig. 5A, available at www.jneurosci.org as supplemental material). The reduction in spine Ca2+ after an AP was not attributable to reduced backpropagation of the action potential in the presence of synaptic background (supplemental Fig. 5B, available at www.jneurosci.org as supplemental material). Synaptic background, therefore, can alter the biophysical properties of both apical dendrites and dendritic spines, and can shape the amplitude and duration of EPSPs, APs, and evoked Ca2+ transients (Rudolph and Destexhe, 2003).
Simulations of the distance dependence of STDP
The modeling data and dendritic recordings show that increases in somatic conductance decrease spine voltage and Ca2+ transients, with signals at proximal synapses suppressed more than those at distal ones. To examine what this means for the induction of STDP, we added plasticity to our biophysical model by implementing simple enzymatic kinetic schemes for LTP and LTD (Badoual et al., 2006). Under these schemes, the induction of LTP was determined by activation of a calcium-dependent kinase K, which was meant to mimic the action of CaMKII, whereas the induction of LTD was determined by activation of a calcium- and glutamate-dependent phosphatase Ph. Although these formulations are simple compared to the actual enzymatic cascades underlying synaptic plasticity, Badoual et al. (2006) have demonstrated that they are sufficient to capture many of the essential characteristics of STDP, including its frequency dependence and the effects of spike pair and triplet interactions. The kinetic schemes (see Materials and Methods) were inserted into the movable dendritic spine in our NEURON model.
We first investigated the effects of spine position and somatic conductance on activation of the LTP and LTD enzymes. We did this by subjecting the model neuron to t-LTP and t-LTD protocols similar to those used in the experiments. Stimulating the model with a t-LTP protocol (EPSP–bAP pairing interval +10 ms) led to strong activation of the LTP kinase K but comparatively weak activation of the LTD phosphatase Ph (Fig. 7A). The net effect was t-LTP, which was larger at distal spine positions than at proximal ones. This can be explained by the larger and longer-lasting spine Ca2+ transients present more distally (Fig. 6C). Addition of somatic background conductances decreased activation of the LTP kinase, especially at proximal synaptic sites, but had only a small effect on activation of the LTD phosphatase. Stimulating the model instead with a t-LTD protocol (pairing interval, −20 ms) led to activation of both the LTD phosphatase Ph and the LTP kinase K (Fig. 7B). Phosphatase activation was again less sensitive than kinase activation to background conductance and to spine position along the dendrite. It should be noted that the precise shape of the curves, in both Figure 7, A and B, reflects not only distance from the soma but also dendritic morphology (e.g., there is a branch point at 200 μm and another at 300 μm).
Total plasticity in the model can be estimated by the difference between the LTP and LTD contributions (i.e., the difference between maximum activated K* and Ph*) (Badoual et al., 2006). For a spine positioned 50 μm from the soma, we constructed an STDP curve by varying the pairing interval between EPSPs and bAPs, calculating the contributions of the LTP and LTD enzymes, and taking the difference (Fig. 7C). The induction of t-LTP was strongly reduced by the presence of background conductances and was limited to short pairing intervals. The induction of t-LTD, however, was only modestly affected by background conductances at all pairing intervals. In fact, for the parameters used here, background slightly increased the amount of t-LTD, because suppression of the LTP enzyme was larger than suppression of the LTD enzyme even at negative pairing intervals.
These results suggest that the effects of background conductance are dominated by their effects on the biochemical pathways mediating LTP and help to explain why in the experimental data t-LTP was so much more sensitive to conductance than t-LTD was.
In the last two sections of Results, we consider two possible functional implications of our experimental data. One concerns stability of synaptic weights in Hebbian networks, and the other the interaction between neuromodulation and conductance-dependent STDP.
Conductance-dependent STDP promotes stability and competition
It has long been appreciated that Hebbian networks are potentially unstable because of positive feedback loops (Abbott and Nelson, 2000): the strengthening of a synapse between two cells allows the presynaptic cell to drive the postsynaptic one more strongly; this leads to more strengthening; this leads to more driving; and so on. This concern has led to the inclusion in network models of separate biophysical processes, such as synaptic scaling, that might stabilize synaptic weights in the midst of Hebbian change (Turrigiano, 2008; Watt and Desai, 2010). But separate stabilizing (homeostatic) processes are not strictly necessary. If the effects of depression can offset those of potentiation, STDP alone might be able to produce stable weight distributions. Previous studies of static STDP learning rules indicate that whether or not this balance is reached (and the nature of the resulting synaptic dynamics) depends critically on how STDP is implemented (Song et al., 2000; van Rossum et al., 2000; Gütig et al., 2003; Burkitt et al., 2004; Zou and Destexhe, 2007; Morrison et al., 2008; Billings and van Rossum, 2009). In this section, we suggest that replacing static STDP rules by a conductance-dependent rule, in the manner suggested by our data, might reduce this dependence and allow for more robust regulation.
To illustrate the idea, we studied STDP phenomenologically using a simple model neuron, as was done in much of the static STDP work. The model was a standard integrate-and-fire neuron with a spike-triggered adaptation conductance. It received Poisson input from both excitatory and inhibitory synapses. The inhibitory synaptic weights were fixed, but the excitatory ones evolved according to the rules of STDP. Those rules were given by the STDP learning curves shown in Figure 8A, which specify the fractional change in synaptic weight produced by each pair of presynaptic and postsynaptic spikes. Our experimental data indicate that t-LTP should be suppressed by conductance, whereas t-LTD should remain almost unchanged. We incorporated this finding into the “LTP-only” rule (Fig. 8A, leftmost curves) by making the t-LTP decay time vary inversely with total conductance. (This choice is not critical. Similar results could be obtained if, instead, t-LTP peak amplitude were made to vary with conductance.) The total conductance included contributions from the leak, adaptation, and synaptic conductances. We contrasted the behavior of the LTP-only rule with those of the other two rules shown in Figure 8A: one in which both t-LTP and t-LTD depended on conductance (Both), and one in which neither depended on conductance (Neither).
The stabilizing quality of the LTP-only rule can be demonstrated by considering the situation of Figure 8B. All presynaptic afferents were uncorrelated and were stimulated at a fixed rate. Initially, the excitatory weights were distributed uniformly and drove fast, regular firing of the model neuron. Under the influence of the LTP-only rule, the firing rate began to slow dramatically. Eventually, a steady state was reached in which firing was sparse and irregular. By contrast, the other two rules produced increases in postsynaptic firing rate, even though the presynaptic inputs were uncorrelated with each other and across time. These behaviors can be understood by examining how the synaptic weights evolve under the different rules (Fig. 8B, right column). When only the LTP window depends on conductance, there is a strong bias toward depression whenever presynaptic or postsynaptic activity is high. Only synapses that drive the postsynaptic neuron effectively (for example, by being correlated with other synapses) (see below) can overcome the bias. When inputs are uncorrelated, as in the case considered here, synaptic weights are pushed down by STDP, with the largest weights reduced the most because of the multiplicative update rule. The end result is a broad weight distribution with few strong synapses. Neither of the other two rules has a bias toward depression. The small positive correlation between presynaptic and postsynaptic spikes (the former drives the latter) is enough to potentiate synapses, until weights saturate near the upper limit. When both the t-LTP and t-LTD windows are reduced by conductance, weights are frozen in place.
In principle, a static STDP rule, such as the “neither” rule, can prevent synaptic weight saturation if one assumes an intrinsic bias toward depression (Abbott and Nelson, 2000). For example, one might assume that the minimum of the t-LTD curve is bigger than the maximum of the t-LTP curve (Song et al., 2000), or that the integral of the STDP curve is negative and that multispike interactions are such that the whole curve is sampled when firing rates are high (Izhikevich and Desai, 2003). However, given the diversity of experimental results obtained in different preparations and at different developmental time points (Abbott and Nelson, 2000; Sjöström et al., 2008; Butts and Kanold, 2010), assumptions like these are not desirable. Conductance-dependent STDP, as represented here by the LTP-only rule, makes them less necessary because it naturally incorporates a robust bias toward depression that grows as activity (as reflected by total conductance) grows. In fact, for the parameters of Figure 8B, synaptic weight saturation can be prevented by the LTP-only rule even if we were to bias the resting state STDP windows toward potentiation by decreasing the t-LTD decay time by one-third, increasing the t-LTP peak by one-third, or replacing all-to-all spike interactions with nearest-neighbor spike interactions (data not shown).
Other types of stable STDP implementations have been proposed (van Rossum et al., 2000; Gütig et al., 2003; Morrison et al., 2007). A limiting case, which serves as an exemplar, is the mixed-weight STDP rule of van Rossum et al. (2000) and Billings and van Rossum (2009). In this rule, the amount of depression produced by each spike pair is proportional to the current synaptic weight (multiplicative), but the amount of potentiation is independent of the current weight (additive). The asymmetry produces a synapse-specific bias toward depression that is stabilizing. However, it does not allow for strong competition between synapses unless a separate process like synaptic scaling (van Rossum et al., 2000) or lateral inhibition (Billings and van Rossum, 2009) is introduced. The LTP-only rule is inherently competitive because plasticity at any one synapse depends partly on the conductance environment created by all of the other synapses. To show this, we divided the excitatory inputs into two groups. The first group was left uncorrelated, but varying amounts of correlation were introduced into the second group, with Pearson coefficients between 0 and 0.2 (Destexhe and Paré, 1999). Over time, the synaptic weights of the correlated group were pulled up, whereas the synaptic weights of the uncorrelated group were pushed down (Fig. 8C); that is, the two groups competed against each other, and the correlated group won. Conductance-dependent STDP, although stabilizing, preserves synaptic competition.
β-Adrenergic receptor activation rescues deficit in t-LTP
A prominent feature of the intact cortex, the impact of which on STDP is only beginning to be explored, is neuromodulation (Seol et al., 2007; Zhang et al., 2009). One possibility raised by our experimental data is that synaptic background activity regulates the interaction between plasticity and chemical neuromodulators. After all, neuromodulators can affect some of the same physiological properties (e.g., membrane conductance) that background activity does. To test this possibility, we examined the effect of stimulation of β-adrenergic receptors on t-LTP in the presence or absence of 50 nS shunting conductance. Recent experiments in visual cortical slices indicate that β-adrenergic activation promotes the induction of t-LTP (Seol et al., 2007).
We found that not only does β-adrenergic activation promote t-LTP, but it can rescue the deficit in t-LTP produced by shunting conductance (Fig. 9). In these experiments, receptors were activated by bath application of the agonist isoproterenol (ISO) for 10 min at 1 μm. ISO application alone produced a small, transient increase in EPSP slope (Fig. 9B). When this was paired with a t-LTP induction protocol, the increase in EPSP slope was large and long lasting (Fig. 9A). When both of these were combined with 50 nS shunting conductance, the increase in EPSP slope remained long lasting and was comparable in size to that produced by t-LTP alone (Figs. 9A,C).
Figure 9.
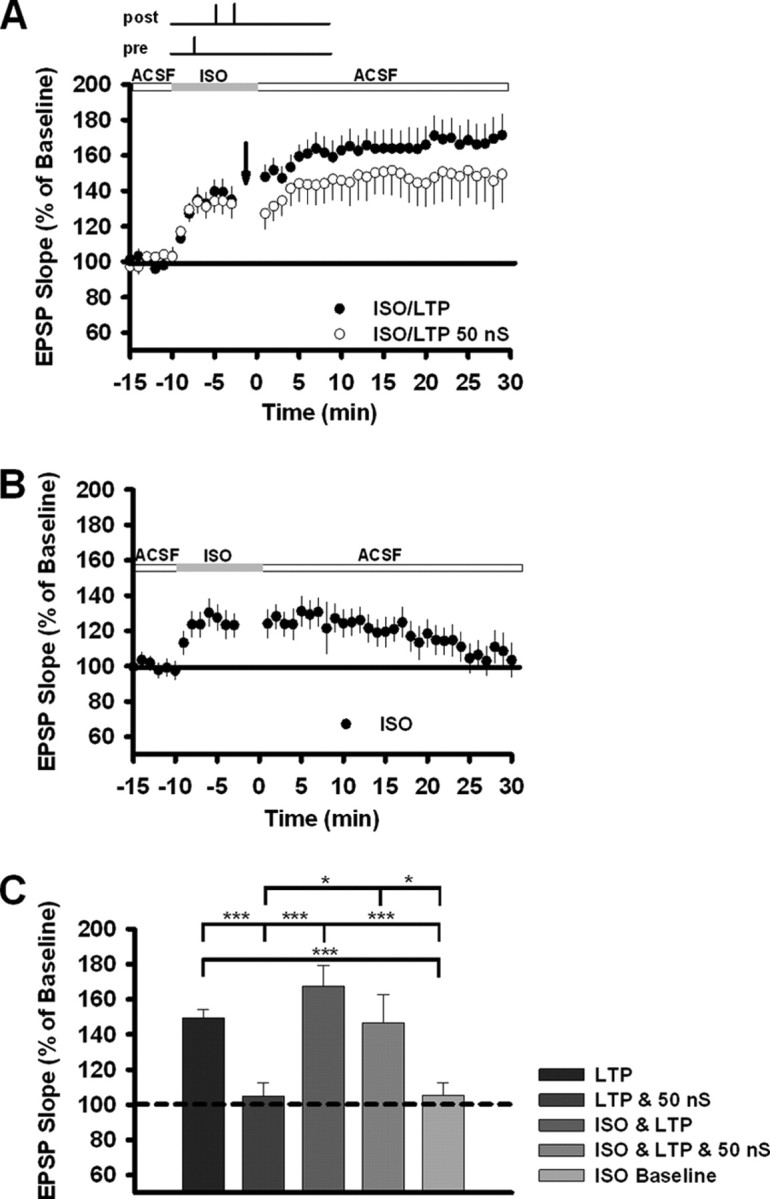
β-Adrenergic receptor activation rescues the deficit in t-LTP. A, After a stable 5 min baseline, 1 μm isoproterenol (top gray box) was applied for 10 min, and EPSPs were paired with bAPs at a fixed delay of +10 ms. Arrows indicate pairing onset in control cells (n = 16) and in cells subjected to 50 nS of shunting conductance (n = 17). As before, 100 total pairings were made at a frequency of 1 Hz. B, Transient ISO application failed to induce a lasting increase in EPSP slope (n = 19). C, Summary data for the change in EPSP slope produced by t-LTP, shunting conductance, and/or ISO. The numbers of recordings were as follows: LTP alone, n = 50; LTP and 50 nS, n = 30; ISO and LTP, n = 15; ISO, LTP, and 50 nS, n = 16; ISO alone, n = 19. Between-group statistical significance was calculated using Welch's t test; *p < 0.05; ***p < 0.001.
How β-adrenergic activation overcomes the suppressive effect of shunting conductance is not clear, as its proposed downstream targets of action are several and include both synaptic receptors and intrinsic channels (Haas and Konnerth, 1983; Madison and Nicoll, 1986; Gray and Johnston, 1987; Raman et al., 1996; Seol et al., 2007). However, this result indicates that background activity and neuromodulation are linked and should be considered in tandem (Desai and Walcott, 2006).
Discussion
Our experiments demonstrate that synaptic background activity can selectively suppress t-LTP. It does this by increasing membrane conductance, which reduces the net depolarization produced by pairing EPSPs and postsynaptic spikes. This in turn reduces spine Ca2+ transients in a way that affects potentiation more strongly than depression.
The conductance levels we used were meant to be in the range neocortical pyramidal neurons experience in vivo. This is likely a broad range, as previous studies suggest the magnitude and composition of background conductances vary considerably depending on brain region, amount of sensory stimulation, and network state (Borg-Graham et al., 1998; Anderson et al., 2000; Wehr and Zador, 2003; Rudolph et al., 2005; Zou et al., 2005; Haider et al., 2006; Higley and Contreras, 2006; Rudolph et al., 2007). Our conductance choices were most similar to the in vivo estimates of Rudolph et al. (2007), who made intracellular recordings from cortical neurons in the awake cat. They concluded that mean total conductance was ∼34 nS, with numbers from individual recordings ranging as high as 160 nS. Estimates from some other preparations are not so high (Zou et al., 2005), but even in these cases it is possible that conductance levels are high enough to have significant effects on t-LTP. In our experiments, conductance was added through a somatic injection, but in vivo, conductance is added through distributed excitatory and inhibitory synapses. As a result, the minimum effective conductance of our experiments (25 nS) should be viewed as an upper limit on what is necessary rather than as a cutoff. Rudolph et al. (2007) also concluded that total conductance was dominated by inhibition, but other studies suggest that inhibition and excitation are often balanced, with excitation even predominating in some cases (Wehr and Zador, 2003; Haider et al., 2006). This is unlikely to affect our conclusions because we found that a static conductance with a single reversal potential could truncate t-LTP as well as fluctuating “in vivo-like” excitatory and inhibitory conductances could.
Comparing the results of our experiments to STDP experiments performed in vivo (Meliza and Dan, 2006; Jacob et al., 2007) is difficult. Not only must one account for differences in brain region and anesthetic state, but the fact that in these experiments EPSPs were evoked by sensory stimulation (a flashed bar for visual cortex, whisker deflection for barrel cortex). Sensory stimulation is likely to activate multiple synaptic pathways (feedforward, recurrent, feedback), which may have differing plasticity requirements, and interact in a complex manner with spontaneous activity in vivo, which might lower the temporal precision of presynaptic firing. Even so, some interesting parallels can be drawn. Jacob et al. (2007) found that pairing principal whisker stimulation with postsynaptic spikes induced by current injection resulted in reliable t-LTD in layer 2/3 barrel cortex but unreliable t-LTP. Meliza and Dan (2006) were able to induce t-LTP reliably in visual cortex, but only at levels lower than those measured previously in visual cortical slices (Froemke and Dan, 2002). To make a stronger connection between our results and experiments performed in vivo, it will be necessary to have greater control over background state. One possibility, elegant though difficult at present, is through the use of optogenetic tools (Scanziani and Häusser, 2009), both to control background activity and to stimulate single intracortical pathways. Another possibility, applicable in primary auditory cortex, is to induce STDP at synapses activated by best frequency stimulation while neurons are subjected to a background created by unstructured noise with power concentrated at distant frequencies; that is, one might exploit the tonotopic organization of auditory cortex to separate “signal” from “background.”
A striking feature of our results is the difference between t-LTP and t-LTD in sensitivity to conductance. This difference is consistent with recent experiments that indicate that t-LTP and t-LTD involve separate calcium sources and coincidence detection mechanisms (Sjöström et al., 2003, 2004; Bender et al., 2006; Chevaleyre et al., 2006; Duguid and Sjöström, 2006; Nevian and Sakmann, 2006; Rodríguez-Moreno and Paulsen, 2008; Sjöström et al., 2008; Rodríguez-Moreno et al., 2010). In sensory cortex, t-LTP shows classical NMDA receptor dependence, whereas t-LTD is independent of postsynaptic NMDA receptors but does require metabotropic glutamate receptors and calcium from voltage-sensitive channels and IP3 receptor-gated stores (Bender et al., 2006; Rodríguez-Moreno and Paulsen, 2008). The threshold Ca2+ elevation required for t-LTP is approximately twofold higher than that for t-LTD (Nevian and Sakmann, 2006). And t-LTD requires retrograde endocannibinoid signaling, whereas t-LTP does not (Duguid and Sjöström, 2006; Nevian and Sakmann, 2006). These biophysical differences have a number of consequences. One is that t-LTP is more sensitive to postsynaptic depolarization and EPSP amplitude than t-LTD (Sjöström et al., 2001). In fact, in visual cortical slices, pairing presynaptic spikes with subthreshold postsynaptic depolarization is enough to produce depression of a magnitude comparable to that observed when pairing with postsynaptic spikes (Sjöström et al., 2004). Another is that disruptions of spine Ca2+ signaling affect t-LTD to a smaller extent than t-LTP (Meredith et al., 2007). Our experimental and modeling results on the effects of conductance complement these previous findings.
Using a simple phenomenological model, we suggested a possible consequence of the LTP–LTD asymmetry, namely, a way of maintaining stability and competition in Hebbian networks without resorting to separate homeostatic processes (Watt and Desai, 2010). Attempts to do this with conductance-independent STDP rules have been made in the past (for review, see Morrison et al., 2008), but conductance-dependent STDP has two advantages. First, it requires fewer assumptions about the shape of the STDP learning windows and the nature of multispike interactions. Second, its bias toward depression is not static but grows with activity. This is reminiscent of the sliding threshold hypothesis of the Bienenstock–Cooper–Munro model for rate-based plasticity (Bienenstock et al., 1982; Abraham, 2008). Additional analysis is needed to determine how close the connection is, but such work is worthwhile because of the importance of reconciling timing-based and rate-based models of plasticity (Izhikevich and Desai, 2003; Bush et al., 2010; Clopath et al., 2010).
Also necessary are more experiments on the interaction between background activity and neuromodulation. We showed that the deficit in t-LTP produced by background conductance could be overcome by β-adrenergic activation, but the mechanism remains uncertain. Also uncertain is what effect other neuromodulators might have. Background activity and neuromodulation are ubiquitous features of the brains of behaving animals, but are usually absent from in vitro experiments. Combining them is a useful goal for future studies.
Footnotes
This work was supported by the Neurosciences Research Foundation and grants from the G. Harold and Leila Y. Mathers Charitable Foundation and the Del E. Webb Foundation. We are grateful to Emily Higgins and Helen Makarenkova for technical assistance and to Tanya Casimiro and Elisabeth Walcott for reading this manuscript.
References
- Abbott LF, Nelson SB. Synaptic plasticity: taming the beast. Nat Neurosci [Suppl] 2000;3:1178–1183. doi: 10.1038/81453. [DOI] [PubMed] [Google Scholar]
- Abraham WC. Metaplasticity: tuning synapses and networks for plasticity. Nat Rev Neurosci. 2008;9:387–399. doi: 10.1038/nrn2356. [DOI] [PubMed] [Google Scholar]
- Anderson JS, Lampl I, Gillespie DC, Ferster D. The contribution of noise to contrast invariance of orientation tuning in cat visual cortex. Science. 2000;290:1968–1972. doi: 10.1126/science.290.5498.1968. [DOI] [PubMed] [Google Scholar]
- Araya R, Jiang J, Eisenthal KB, Yuste R. The spine neck filters membrane potentials. Proc Natl Acad Sci U S A. 2006;103:17961–17966. doi: 10.1073/pnas.0608755103. [DOI] [PMC free article] [PubMed] [Google Scholar]
- Arieli A, Sterkin A, Grinvald A, Aertsen A. Dynamics of ongoing activity: explanation of the large variability in evoked cortical responses. Science. 1996;273:1868–1871. doi: 10.1126/science.273.5283.1868. [DOI] [PubMed] [Google Scholar]
- Badoual M, Zou Q, Davison AP, Rudolph M, Bal T, Frégnac Y, Destexhe A. Biophysical and phenomenological models of multiple spike interactions in spike-timing dependent plasticity. Int J Neural Systems. 2006;16:79–97. doi: 10.1142/S0129065706000524. [DOI] [PubMed] [Google Scholar]
- Bender VA, Bender KJ, Brasier DJ, Feldman DE. Two coincidence detectors for spike timing-dependent plasticity in somatosensory cortex. J Neurosci. 2006;26:4166–4177. doi: 10.1523/JNEUROSCI.0176-06.2006. [DOI] [PMC free article] [PubMed] [Google Scholar]
- Bernander O, Douglas RJ, Martin KA, Koch C. Synaptic background activity influences spatiotemporal integration in single pyramidal cells. Proc Natl Acad Sci U S A. 1991;88:11569–11573. doi: 10.1073/pnas.88.24.11569. [DOI] [PMC free article] [PubMed] [Google Scholar]
- Bienenstock EL, Cooper LN, Munro PW. Theory for the development of neuron selectivity: orientation specificity and binocular interaction in visual cortex. J Neurosci. 1982;2:32–48. doi: 10.1523/JNEUROSCI.02-01-00032.1982. [DOI] [PMC free article] [PubMed] [Google Scholar]
- Billings G, van Rossum MC. Memory retention and spike-timing-dependent plasticity. J Neurophysiol. 2009;101:2775–2788. doi: 10.1152/jn.91007.2008. [DOI] [PMC free article] [PubMed] [Google Scholar]
- Borg-Graham LJ, Monier C, Frégnac Y. Visual input evokes transient and strong shunting inhibition in visual cortical neurons. Nature. 1998;393:369–373. doi: 10.1038/30735. [DOI] [PubMed] [Google Scholar]
- Burkitt AN, Meffin H, Grayden DB. Spike-timing-dependent plasticity: the relationship to rate-based learning for models with weight dynamics determined by a stable fixed point. Neural Comput. 2004;16:885–940. doi: 10.1162/089976604773135041. [DOI] [PubMed] [Google Scholar]
- Bush D, Philippides A, Husbands P, O'Shea M. Reconciling the STDP and BCM models of synaptic plasticity in a spiking recurrent neural network. Neural Comput. 2010;22:2059–2085. doi: 10.1162/NECO_a_00003-Bush. [DOI] [PubMed] [Google Scholar]
- Butts DA, Kanold PO. The applicability of spike time dependent plasticity to development. Front Syn Neurosci. 2010;2:30. doi: 10.3389/fnsyn.2010.00030. [DOI] [PMC free article] [PubMed] [Google Scholar]
- Caporale N, Dan Y. Spike timing-dependent plasticity: a Hebbian learning rule. Annu Rev Neurosci. 2008;31:25–46. doi: 10.1146/annurev.neuro.31.060407.125639. [DOI] [PubMed] [Google Scholar]
- Castro-Alamancos MA. Absence of rapid sensory adaptation in neocortex during information processing states. Neuron. 2004;41:455–464. doi: 10.1016/s0896-6273(03)00853-5. [DOI] [PubMed] [Google Scholar]
- Chance FS, Abbott LF, Reyes AD. Gain modulation from background synaptic input. Neuron. 2002;35:773–782. doi: 10.1016/s0896-6273(02)00820-6. [DOI] [PubMed] [Google Scholar]
- Chevaleyre V, Takahashi KA, Castillo PE. Endocannabinoid-mediated synaptic plasticity in the CNS. Annu Rev Neurosci. 2006;29:37–76. doi: 10.1146/annurev.neuro.29.051605.112834. [DOI] [PubMed] [Google Scholar]
- Clopath C, Busing L, Vasilaki E, Gerstner W. Connectivity reflects coding: a model of voltage-based STDP with homeostasis. Nat Neurosci. 2010;3:344–352. doi: 10.1038/nn.2479. [DOI] [PubMed] [Google Scholar]
- Desai NS, Walcott EC. Synaptic bombardment modulates muscarinic effects in forelimb motor cortex. J Neurosci. 2006;26:2215–2226. doi: 10.1523/JNEUROSCI.4310-05.2006. [DOI] [PMC free article] [PubMed] [Google Scholar]
- Destexhe A, Paré D. Impact of network activity on the integrative properties of neocortical pyramidal neurons in vivo. J Neurophysiol. 1999;81:1531–1547. doi: 10.1152/jn.1999.81.4.1531. [DOI] [PubMed] [Google Scholar]
- Destexhe A, Mainen ZF, Sejnowski T. An efficient method for computing synaptic conductances based on a kinetic model of receptor binding. Neural Comput. 1994;6:10–14. [Google Scholar]
- Destexhe A, Rudolph M, Fellous J, Sejnowski T. Fluctuating synaptic conductances recreate in vivo-like activity in neocortical neurons. Neuroscience. 2001;107:13–24. doi: 10.1016/s0306-4522(01)00344-x. [DOI] [PMC free article] [PubMed] [Google Scholar]
- Destexhe A, Rudolph M, Paré D. The high-conductance state of neocortical neurons in vivo. Nat Rev Neurosci. 2003;4:739–751. doi: 10.1038/nrn1198. [DOI] [PubMed] [Google Scholar]
- Duguid I, Sjöström PJ. Novel presynaptic mechanisms for coincidence detection in synaptic plasticity. Curr Opin Neurobiol. 2006;16:312–322. doi: 10.1016/j.conb.2006.05.008. [DOI] [PubMed] [Google Scholar]
- Fellous J, Rudolph M, Destexhe A, Sejnowski TJ. Synaptic background noise controls the input/output characteristics of single cells in an in vitro model of in vivo activity. Neuroscience. 2003;122:811–829. doi: 10.1016/j.neuroscience.2003.08.027. [DOI] [PMC free article] [PubMed] [Google Scholar]
- Froemke RC, Dan Y. Spike-timing-dependent synaptic modification induced by natural spike trains. Nature. 2002;416:433–438. doi: 10.1038/416433a. [DOI] [PubMed] [Google Scholar]
- Froemke RC, Tsay IA, Raad M, Long JD, Dan Y. Contribution of individual spikes in burst-induced long-term synaptic modification. J Neurophysiol. 2006;95:1620–1629. doi: 10.1152/jn.00910.2005. [DOI] [PubMed] [Google Scholar]
- Fuenzalida M, Fernandez De Sevilla D, Buño W. Changes of the EPSP waveform regulate the temporal window for spike-timing-dependent plasticity. J Neurosci. 2007;27:11940–11948. doi: 10.1523/JNEUROSCI.0900-07.2007. [DOI] [PMC free article] [PubMed] [Google Scholar]
- Gray R, Johnston D. Noradrenaline and beta-adrenoceptor agonists increase activity of voltage-dependent calcium channels in hippocampal neurons. Nature. 1987;327:620–622. doi: 10.1038/327620a0. [DOI] [PubMed] [Google Scholar]
- Gütig R, Aharonov R, Rotter S, Sompolinsky H. Learning input correlations through nonlinear temporally asymmetric Hebbian plasticity. J Neurosci. 2003;23:3697–3714. doi: 10.1523/JNEUROSCI.23-09-03697.2003. [DOI] [PMC free article] [PubMed] [Google Scholar]
- Haas HL, Konnerth A. Histamine and noradrenaline decrease calcium-activated potassium conductance in hippocampal pyramidal cells. Nature. 1983;302:432–434. doi: 10.1038/302432a0. [DOI] [PubMed] [Google Scholar]
- Haider B, McCormick DA. Rapid neocortical dynamics: cellular and network mechanisms. Neuron. 2009;62:171–189. doi: 10.1016/j.neuron.2009.04.008. [DOI] [PMC free article] [PubMed] [Google Scholar]
- Haider B, Duque A, Hasenstaub AR, McCormick DA. Neocortical network activity in vivo is generated through a dynamic balance of excitation and inhibition. J Neurosci. 2006;26:4535–4545. doi: 10.1523/JNEUROSCI.5297-05.2006. [DOI] [PMC free article] [PubMed] [Google Scholar]
- Harsch A, Robinson HP. Postsynaptic variability of firing in rat cortical neurons: the roles of input synchronization and synaptic NMDA receptor conductance. J Neurosci. 2000;20:6181–6192. doi: 10.1523/JNEUROSCI.20-16-06181.2000. [DOI] [PMC free article] [PubMed] [Google Scholar]
- Higley MJ, Contreras D. Balanced excitation and inhibition determine spike timing during frequency adaptation. J Neurosci. 2006;26:448–457. doi: 10.1523/JNEUROSCI.3506-05.2006. [DOI] [PMC free article] [PubMed] [Google Scholar]
- Hines ML, Carnevale NT. The NEURON simulation environment. Neural Comput. 1997;9:1179–1209. doi: 10.1162/neco.1997.9.6.1179. [DOI] [PubMed] [Google Scholar]
- Izhikevich EM, Desai NS. Relating STDP to BCM. Neural Comput. 2003;15:1511–1523. doi: 10.1162/089976603321891783. [DOI] [PubMed] [Google Scholar]
- Jacob V, Brasier DJ, Erchova I, Feldman D, Shulz DE. Spike timing-dependent synaptic depression in the in vivo barrel cortex of the rat. J Neurosci. 2007;27:1271–1284. doi: 10.1523/JNEUROSCI.4264-06.2007. [DOI] [PMC free article] [PubMed] [Google Scholar]
- Larkum ME, Waters J, Sakmann B, Helmchen F. Dendritic spikes in apical dendrites of neocortical layer 2/3 pyramidal neurons. J Neurosci. 2007;27:8999–9008. doi: 10.1523/JNEUROSCI.1717-07.2007. [DOI] [PMC free article] [PubMed] [Google Scholar]
- Letzkus JJ, Kampa M, Stuart GJ. Learning rules for spike timing-dependent plasticity depend on dendritic synapse location. J Neurosci. 2006;26:10420–10429. doi: 10.1523/JNEUROSCI.2650-06.2006. [DOI] [PMC free article] [PubMed] [Google Scholar]
- Madison DV, Nicoll RA. Actions of noradrenaline recorded intracellularly in rat hippocampal CA1 pyramidal neurones, in vitro. J Physiol. 1986;372:221–244. doi: 10.1113/jphysiol.1986.sp016006. [DOI] [PMC free article] [PubMed] [Google Scholar]
- Meliza CD, Dan Y. Receptive-field modification in rat visual cortex induced by paired visual stimulation and single-cell spiking. Neuron. 2006;49:183–189. doi: 10.1016/j.neuron.2005.12.009. [DOI] [PubMed] [Google Scholar]
- Meredith RM, Holmgren CD, Weidum M, Burnashev N, Mansvelder HD. Increased threshold for spike-timing-dependent plasticity is caused by unreliable calcium signaling in mice lacking fragile X gene FMR1. Neuron. 2007;54:627–638. doi: 10.1016/j.neuron.2007.04.028. [DOI] [PubMed] [Google Scholar]
- Morrison A, Aertsen A, Diesmann M. Spike-timing-dependent plasticity in balanced random networks. Neural Comput. 2007;19:1437–1467. doi: 10.1162/neco.2007.19.6.1437. [DOI] [PubMed] [Google Scholar]
- Morrison A, Diesmann M, Gerstner W. Phenomenological models of synaptic plasticity based on spike timing. Biol Cybern. 2008;98:459–478. doi: 10.1007/s00422-008-0233-1. [DOI] [PMC free article] [PubMed] [Google Scholar]
- Nevian T, Sakmann B. Spine Ca2+ signaling in spike-timing-dependent plasticity. J Neurosci. 2006;26:11001–11013. doi: 10.1523/JNEUROSCI.1749-06.2006. [DOI] [PMC free article] [PubMed] [Google Scholar]
- Paré D, Shink E, Gaudreau H, Destexhe A, Lang EJ. Impact of spontaneous synaptic activity on the resting properties of cat neocortical pyramidal neurons in vivo. J Neurophysiol. 1998;79:1450–1460. doi: 10.1152/jn.1998.79.3.1450. [DOI] [PubMed] [Google Scholar]
- Raman IM, Tong G, Jahr CE. Beta-adrenergic regulation of synaptic NMDA receptors by cAMP-dependent protein kinase. Neuron. 1996;16:415–421. doi: 10.1016/s0896-6273(00)80059-8. [DOI] [PubMed] [Google Scholar]
- Rodríguez-Moreno A, Paulsen O. Spike-timing dependent long-term depression requires presynaptic NMDA receptors. Nat Neurosci. 2008;11:744–745. doi: 10.1038/nn.2125. [DOI] [PubMed] [Google Scholar]
- Rodríguez-Moreno A, Banerjee A, Paulsen O. Presynaptic NMDA receptors and spike timing-dependent depression at cortical synapses. Front Syn Neurosci. 2010;2:18. doi: 10.3389/fnsyn.2010.00018. [DOI] [PMC free article] [PubMed] [Google Scholar]
- Rudolph M, Destexhe A. A fast-conducting, stochastic integrative mode for neocortical neurons in vivo. J Neurosci. 2003;23:2466–2476. doi: 10.1523/JNEUROSCI.23-06-02466.2003. [DOI] [PMC free article] [PubMed] [Google Scholar]
- Rudolph M, Pelletier JG, Paré D, Destexhe A. Characterization of synaptic conductances and integrative properties during electrically-induced EEG-activated states in neocortical neurons in vivo. J Neurophysiol. 2005;94:2805–2821. doi: 10.1152/jn.01313.2004. [DOI] [PubMed] [Google Scholar]
- Rudolph M, Pospischil M, Timofeev I, Destexhe A. Inhibition determines membrane potential dynamics and controls action potential generation in awake and sleeping cat cortex. J Neurosci. 2007;27:5280–5290. doi: 10.1523/JNEUROSCI.4652-06.2007. [DOI] [PMC free article] [PubMed] [Google Scholar]
- Sabatini BL, Oertner TG, Svoboda K. The life cycle of Ca(2+) ions in dendritic spines. Neuron. 2002;33:439–452. doi: 10.1016/s0896-6273(02)00573-1. [DOI] [PubMed] [Google Scholar]
- Scanziani M, Häusser M. Electrophysiology in the age of light. Nature. 2009;461:930–939. doi: 10.1038/nature08540. [DOI] [PubMed] [Google Scholar]
- Seol GH, Ziburkus J, Huang S, Song L, Kim IT, Takamiya K, Huganir RL, Lee H, Kirkwood A. Neuromodulators control the polarity of spike timing-dependent synaptic plasticity. Neuron. 2007;55:919–929. doi: 10.1016/j.neuron.2007.08.013. [DOI] [PMC free article] [PubMed] [Google Scholar]
- Sjöström PJ, Turrigiano GG, Nelson SB. Rate, timing, and cooperativity jointly determine cortical synaptic plasticity. Neuron. 2001;32:1149–1164. doi: 10.1016/s0896-6273(01)00542-6. [DOI] [PubMed] [Google Scholar]
- Sjöström PJ, Turrigiano GG, Nelson SB. Neocortical LTD via coincident activation of presynaptic NMDA and cannabinoid receptors. Neuron. 2003;39:641–654. doi: 10.1016/s0896-6273(03)00476-8. [DOI] [PubMed] [Google Scholar]
- Sjöström PJ, Turrigiano GG, Nelson SB. Endocannabinoid-dependent neocortical layer-5 LTD in the absence of postsynaptic spiking. J Neurophysiol. 2004;92:3338–3343. doi: 10.1152/jn.00376.2004. [DOI] [PubMed] [Google Scholar]
- Sjöström PJ, Rancz EA, Roth A, Häusser M. Dendritic excitability and synaptic plasticity. Physiol Rev. 2008;88:769–840. doi: 10.1152/physrev.00016.2007. [DOI] [PubMed] [Google Scholar]
- Song S, Miller KD, Abbott LF. Competitive Hebbian learning through spike-timing-dependent synaptic plasticity. Nat Neurosci. 2000;3:919–926. doi: 10.1038/78829. [DOI] [PubMed] [Google Scholar]
- Steriade M, Timofeev I, Grenier F. Natural waking and sleep states: a view from inside neocortical neurons. J Neurophysiol. 2001;85:1969–1985. doi: 10.1152/jn.2001.85.5.1969. [DOI] [PubMed] [Google Scholar]
- Svoboda K, Helmchen F, Denk W, Tank DW. Spread of dendritic excitation in layer 2/3 pyramidal neurons in rat barrel cortex in vivo. Nat Neurosci. 1999;2:65–73. doi: 10.1038/4569. [DOI] [PubMed] [Google Scholar]
- Traub RD, Buhl EH, Gloveli T, Whittington MA. Fast rhythmic bursting can be induced in layer 2/3 cortical neurons by enhancing persistent Na+ conductance or by blocking BK channels. J Neurophysiol. 2003;89:909–921. doi: 10.1152/jn.00573.2002. [DOI] [PubMed] [Google Scholar]
- Turrigiano GG. The self-tuning synapse: synaptic scaling of excitatory synapses. Cell. 2008;135:422–435. doi: 10.1016/j.cell.2008.10.008. [DOI] [PMC free article] [PubMed] [Google Scholar]
- van Rossum MC, Bi GQ, Turrigiano GG. Stable Hebbian learning from spike timing-dependent plasticity. J Neurosci. 2000;20:8812–8821. doi: 10.1523/JNEUROSCI.20-23-08812.2000. [DOI] [PMC free article] [PubMed] [Google Scholar]
- Waters J, Larkum M, Sakmann B, Helmchen F. Supralinear Ca2+ influx into dendritic tufts of layer 2/3 neocortical neurons in vitro and in vivo. J Neurosci. 2003;23:8558–8567. doi: 10.1523/JNEUROSCI.23-24-08558.2003. [DOI] [PMC free article] [PubMed] [Google Scholar]
- Watt AJ, Desai NS. Homeostatic plasticity and STDP: keeping a neuron's cool in a fluctuating world. Front Syn Neurosci. 2010;2:5. doi: 10.3389/fnsyn.2010.00005. [DOI] [PMC free article] [PubMed] [Google Scholar]
- Watt AJ, Rossum MC, Macleod KM, Nelson SB, Turrigiano GG. Activity coregulates quantal AMPA and NMDA currents at neocortical synapses. Neuron. 2000;26:659–670. doi: 10.1016/s0896-6273(00)81202-7. [DOI] [PubMed] [Google Scholar]
- Wehr M, Zador AM. Balanced inhibition underlies tuning and sharpens spike timing in auditory cortex. Nature. 2003;426:860–863. doi: 10.1038/nature02116. [DOI] [PubMed] [Google Scholar]
- Williams SR. Spatial compartmentalization and functional impact of conductance in pyramidal neurons. Nat Neurosci. 2004;7:961–967. doi: 10.1038/nn1305. [DOI] [PubMed] [Google Scholar]
- Zhang JC, Lau PM, Bi GQ. Gain in sensitivity and loss in temporal contrast of STDP by dopaminergic modulation at hippocampal synapses. Proc Natl Acad Sci U S A. 2009;106:13028–13033. doi: 10.1073/pnas.0900546106. [DOI] [PMC free article] [PubMed] [Google Scholar]
- Zou Q, Destexhe A. Kinetic models of spike-timing dependent plasticity and their functional consequences in detecting correlations. Biol Cybern. 2007;97:81–97. doi: 10.1007/s00422-007-0155-3. [DOI] [PubMed] [Google Scholar]
- Zou Q, Rudolph M, Roy N, Sanchez-Vives M, Contreras D, Destexhe A. Reconstructing synaptic background activity from conductance measurements in vivo. Neurocomputing. 2005;65:673–678. [Google Scholar]