

Abstract
Motor primitives and modularity may be important in biological movement control. However, their neural basis is not understood. To investigate this, we recorded 302 neurons, making multielectrode recordings in the spinal cord gray of spinalized frogs, at 400, 800, and 1200 μm depth, at the L2/L3 segment border. Simultaneous muscle activity recordings were used with independent components analysis to infer premotor drive patterns. Neurons were divided into groups based on motor pattern modulation and sensory responses, depth recorded, and behavior. The 187 motor pattern modulated neurons recorded comprised 14 cutaneous neurons and 28 proprioceptive neurons at 400 μm in the dorsal horn, 131 intermediate zone interneurons from ∼800 μm depth without sensory responses, and 14 motoneuron-like neurons at ∼1200 μm. We examined all such neurons during spinal behaviors. Mutual information measures showed that cutaneous neurons and intermediate zone neurons were related better to premotor drives than to individual muscle activity. In contrast, proprioceptive-related neurons and ventral horn neurons divided evenly. For 46 of the intermediate zone interneurons, we found significant postspike facilitation effects on muscle responses using spike-triggered averages representing short-latency postspike facilitations to multiple motor pools. Furthermore, these postspike facilitations matched significantly in both their patterns and strengths with the weighting parameters of individual primitives extracted statistically, although both were initially obtained without reference to one another. Our data show that sets of dedicated interneurons may organize individual spinal primitives. These may be a key to understanding motor development, motor learning, recovery after CNS injury, and evolution of motor behaviors.
Introduction
If movement organization was a simple problem, biomorphic robots would arguably be more animal like, more agile, and resemble robots of popular imagination. The degrees of freedom (DOF) problem may be a factor in this disparity. Musculoskeletal redundancy and neural complexity represent control problems for motor systems, as first discussed by Bernstein (1967). Such complexity remains a concern (Abbott, 2006). However, animals cope efficiently with their degrees of freedom. A newborn wildebeest can walk shortly after birth. The spinal cord of a headless frog or a spinalized turtle can organize complex trajectories (Fukson et al., 1980; Giszter et al., 1989) (for review, see Stein, 2005), and rapidly correct for perturbations (Kargo and Giszter, 2000b). Such remarkable spinal cord capacities may originate in modular control schemes. Spinal-driven motions may be constructed with small sets of primitives and pattern generators (Grillner and Wallen, 1985; Mussa-Ivaldi, 1992; Mussa-Ivaldi et al., 1994; Kiehn et al., 1997; Lemay et al., 2001; Schouenborg, 2002; d'Avella et al., 2003; Grillner, 2003; Hart and Giszter, 2004; Lemay and Grill, 2004; d'Avella and Bizzi, 2005; Chhabra and Jacobs, 2006; Bizzi et al., 2008). Modularity impacts how flexible motor behaviors arise and evolve (Wagner and Altenberg, 1996; Bateson, 2004; Schlosser and Wagner, 2004) and interactions of brain and spinal cord (Callebaut and Rasskin-Gutman, 2005). The neural basis of modularity affects development of skilled movements (Burdet and Milner, 1998; Sosnik et al., 2004; Schaal and Schweighofer, 2005) and determines how flexibly the nervous system copes with injury and aging (Krebs et al., 1999; Rohrer et al., 2002). These ideas may extend from motor control, into development, morphology, vocalization, and evolutionary psychology (Mowrey and MacKay, 1990; Samuels, 2000), but modularity is controversial (Giszter et al. 2009, Tresch and Jarc, 2009). Modularity could simply represent task structures and/or optimal control outcomes using a redundant limb (Sanger, 1994, 2000; Todorov, 2004; Todorov et al., 2005; Chhabra and Jacobs, 2006). Conversely, modularity might represent strategies built into the CNS structure a priori. Support for modularity comes from statistical analysis of motor patterns (Hart and Giszter, 2004; d'Avella and Bizzi, 2005; Cappellini et al., 2006; d'Avella et al., 2006; Krouchev et al., 2006), from stimulation (Bizzi et al., 1991; Giszter et al., 1993; Mussa-Ivaldi et al., 1994), and from physiological tests (Kargo and Giszter 2000b, 2008; Lafreniere-Roula and McCrea, 2005). Experimentally, discrete units in motor patterns can be adaptively recruited or deleted in behaviors (Giszter and Kargo, 2000; Kargo and Giszter, 2000b; Stein, 2005, 2008). However, the precise neural underpinnings of the modularity observed are unknown.
We here attack this issue using multielectrode neural recording and information-based analyses of motor patterns. We hypothesized that specific neural activities associate with primitives. Following our previous work, we define a primitive as a pulsed premotor drive of fixed duration that recruits a covarying set of muscles, yielding force patterns typical of force-field primitives (Kargo and Giszter, 2000b, 2008; Hart and Giszter, 2004). Activity strongly matching such drives would be consistent with a relatively direct implementation of discrete modules in the neural circuitry, possibly as result of evolutionary selection and constraints.
Materials and Methods
All work was conducted in accordance with United States Department of Agriculture and National Institutes of Health guidelines for animal use and with Institutional Animal Care and Use Committee approval and oversight. We recorded neural activity from 16 spinalized frogs, proceeding as follows.
Surgical methods.
We anesthetized large adult bullfrogs using 0.3 ml of 5% tricaine and placed them on a bed of ice to quicken the anesthetic effect. Making an incision along the dorsal midline of the skin on the skull from the midpoint of the eyes to the midpoint of the ears, we reflected back the skin and held it in place with forceps. We made an incision in the muscles behind the base of the skull along the midline, deepened it, and deflected the musculature at the incision using a retractor, until the foramen magnum was exposed. After opening the foramen, we cauterized the vascular dura over the fourth ventricle and pulled aside the cauterized dura. We then aspirated a section of spinal tissue in a straight, lateral line immediately below the medulla of the frog, taking care not to rupture any of the remaining dura or large blood vessels along the sides of the incision or underlying the spinal tissue. After completing the transection, we filled the cavity with a piece of Gelfoam and closed the incision. We next made a small opening over the brain and decerebrated the frog at a low level through repeated applications of heat cautery to the tectum and rostral structures. Packing the small holes with Gelfoam, the incision was closed with wound clips and then sealed with vet bond. We inserted bipolar intramuscular electromyogram (EMG) electrodes, as described in previous work (Hart and Giszter, 2004), in 10 muscles of the frog right hindlimb. These muscles are as follows: the rectus anterior (RA), rectus interior (RI), adductor magnus (AD), semimembranosus (SM), gluteus (GL), vastus internus (VI), biceps (BI), sartorius (SA), vastus externus (VE), and semitendinosus (ST).
To expose the spinal cord for recording with our probe, we made an incision on the mid-to-lower back of the frog's skin and musculature and reflected the skin back. We incised fascia and with blunt dissection separated the back musculature and kept the muscles deflected via retractors. Other vertebral musculature was cleared using blunt dissection and iridectomy scissors until the bone of the vertebral arches was cleanly exposed. After clearing connective tissue, we used rongeurs to cut away the spinal arch and spinous processes, revealing the dura beneath. We removed between two and three arches, exposing the L2/L3 border region of the frog spinal cord.
We covered the dura with moistened Gelfoam and a cotton ball. The frog was allowed to recover for 1 d. On the day a recording was to be made, we used electrocautery to cauterize small patches of blood vessels in the vascular dura. We then opened a small hole in the dura using an additional electrocautery, which we expanded until it became possible to deflect the dura and the attached blood vessel back, revealing the spinal cord pia mater for a length of two or even three spinal segments. This allowed full access to approximately half the width of the spinal cord, from the midline to the right lateral extreme of the cord.
EMG recording.
EMGs were recorded from the right hindlimb. They were high-pass filtered using A-M Systems amplifiers, with a low-frequency cutoff at 100 Hz. EMGs were amplified by a gain of 10,000, and recordings were made at a sampling rate of 2 kHz using the analog channels of a 128 channel Cerebus recording device from Cyberkinetics and saved to the hard drive of the computer. Wiping movements were elicited through light pinch stimulations delivered via blunted and insulated forceps to the frog's ankle or brief electrical skin stimulation at the ankle dorsum. Unlike previous work on wiping, multiple stimuli were applied in succession: the frog spinal cord was thus not fully quiescent at the time of the last stimulus given. This regimen elicited more rich motor patterns than previous stereotyped wiping recordings (Kargo and Giszter, 2000b, 2008), consistent with that described by Hart and Giszter (2004). Neural recordings were made in a 10–30 s interval after stimulus delivery. Between 50 and 100 stimuli were delivered in the course of an experiment, with at least 30 s between stimulus applications. EMGs and neural records were concatenated for the ensuing analysis, with the number of records/trials concatenated ranging between a minimum of 20 and a maximum of 100. Unfiltered rectified EMG records were checked for evidence of crosstalk by examining the independent components analysis (ICA) results for unfiltered EMG [the identity matrix results in the absence of crosstalk (Hart and Giszter, 2004)] and examining short-latency cross-correlation. We found no evidence for significant EMG crosstalk with our electrode placements.
Probe construction and neural recording.
Probes that comprised collections of up to six tetrodes (thus 24 channels) arrayed uniformly around a central tungsten shaft were used to record neural activity. Tetrode impedances were set to between 1 and 1.5 MΩ by controlled gold plating.
Probes were inserted at the L2/L3 border at 500 μm lateral from the midline and the cluster of tetrodes advanced to 400, 800, or 1200 μm depth. The placement at 800 μm was squarely in the intermediate zone. This location placed the probe near the region described by Bizzi et al. (1991) and Giszter et al. (1993): a location where microstimulation proved highly effective at evoking relevant, primitive associated force fields. After placement of the probe in the spinal cord at each level, we checked isolated neural activity for cutaneous or proprioceptive responses by stroking and pinching regions of the frog's skin and by palpating leg muscles. Offline cluster cutting was performed using Plexon Neurotechnology Research System's Offline Sorter. We identified the principal components (PCs) of 1.6- ms-long waveforms centered on each recorded spike and used the identified factor loadings to sort spikes. Spikes were sorted using clustering of the first four PCs of the activity of the tetrodes. Wave shape variability was modeled by a t distribution, and this was used in an automated, expectations maximization-based sorting (Wheeler, 1999; Shoham et al., 2003; Gold et al., 2006).
In 12 frogs, we recorded up to 24 channels of neural activity at a time in a single six-tetrode probe. In four additional frogs, we implanted and recorded simultaneously from two probes. One probe and its electrodes were always placed at the border of the L2/L3 spinal segment in all 16 frogs. In total, we recorded 302 neurons (10–30 per frog in each of the 16 frogs). Of these 302 neurons, 187 responded to sensory stimuli in the quiescent frog or were actively modulated in firing rate during spinal behaviors.
Sensory classification.
We qualitatively assigned neurons into categories by sensory modality, classifying them as having cutaneous, proprioceptive/limb configuration related or mixed responses. We qualitatively surveyed responses to gentle skin stimulation with a stylus or stiffer von Frey hair (cutaneous), to muscle palpation (muscle proprioceptive), and to gentle limb motions (joint related/proprioceptive).
We defined as “strongly rate-modulated units” those units whose firing rate was deviated by >2 SDs from their mean resting rate, either when the frog was stimulated in sensory testing or in elicited active behaviors (see below).
Analysis focused on the 187 strongly rate-modulated neurons we recorded. The 131 neurons recorded in intermediate zone displayed no simple and repeatable sensory fields, in contrast to many of the 400 μm depth recordings and no clear 1:1 muscle responses that might indicate that they were motoneurons, in contrast to some of the recordings at 1200 μm. The 131 selected neurons thus qualified as putative interneurons (INs). A subset of these were likely premotor interneurons based on spike-triggered averaging (STA) tests (see below). Apart from their depth and status as potential interneurons, this population was unidentified in terms of whether they were ipsilaterally or contralaterally projecting neurons, excitatory or inhibitory neurons, or any other classes of interneuron known before our analyses. However, we do know they did not respond proprioceptively or cutaneously in quiescent frogs, suggesting no strong group I or II inputs at rest. Spike-triggered averaging (see below) also indicated functional connections of some such interneurons to motor pools, either directly or through other intervening INs.
EMG analysis/identification of components or primitives.
To examine modularity of motor pattern, we here used the same statistical techniques as we used previously (Hart and Giszter, 2004) (see Figs. 1, 2). We began with raw and rectified and filtered EMG.
Figure 1.
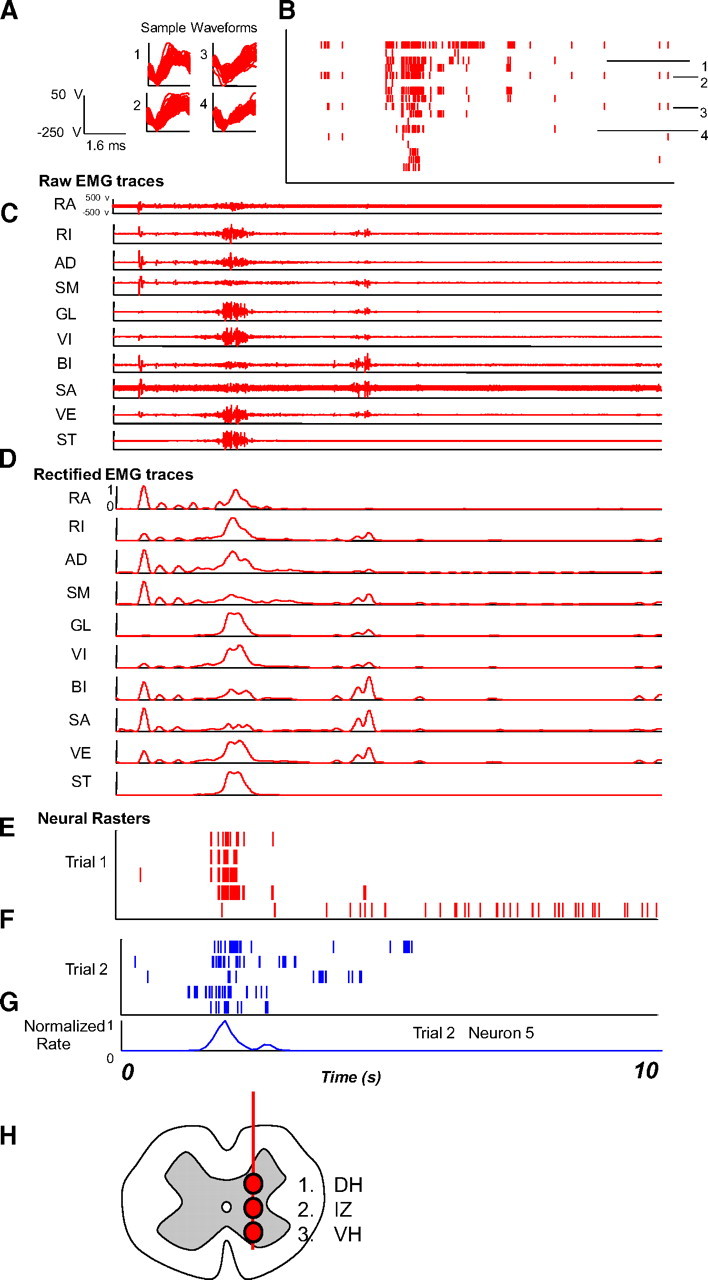
Data types and processing used in the study. A, Recordings were made using a custom tetrode system. Individual units were isolated using PCA and EM algorithms incorporating the tetrode co-occurrence and covariations. Sample waveforms of four units from the highest amplitude tetrode channels are shown in each trace 1–4 for units whose rasters are shown with all 17 channels isolated in a frog in B. Multielectrode single and multiunit activity was recorded at 400–500, 700–800, and 1000–1200 μm depth at the L2/L3 segment border in a spinalized frog. B, Typical rasters of spike activity in a frog. C–G show sample data recorded in two trials (Trial 1, C–E; Trial 2, F, G): C, raw EMG; D, integrated and filtered EMG recordings; E, rasters on the corresponding trial; F, rasters on a second trial in the frog. Note general crude resemblance of firing structures in E–G from a second frog. G, Estimated rate from a unit in F using a Gaussian filter. H, Sites in spinal cord from which data were obtained: dorsal horn (DH), 400 μm; intermediate zone (IZ) gray, 800 μm; ventral horn (VH), 1200 μm. Recording occurred along penetrations at the L2/L3 border 500 μm from the midline.
Figure 2.

Data analysis approach. Spike data were converted from analog recordings (type A in each analysis) to isolated unit spike times (type B) used in spike-triggered averages, to continuous rate estimates (type A) used for linear correlation based methods and to symbol string representations (15 ms bins, 8 symbols for level, type C) used for information-based analyses. Electromyograms were rectified filtered and used in ICA to obtain activation patterns of independent components or sources (type A) and their projection weights to muscles (type D). The resulting (type A) EMG and component waveforms were used in linear correlation methods and converted to symbol strings (15 ms bins, 8 symbols for level) for use in information techniques. Raw and rectified unfiltered EMG was used in spike-triggered averages to obtain significant facilitations and their magnitudes (type D). Comparisons and statistical tests of hypotheses were then made using the symbol string representations (C), the analog time series (A), and the projection weights and STA facilitation weights (D).
We define a primitive as a premotor drive that recruits a covarying group of muscles that remain in fixed proportions through their recruitment, occurring in a fixed-duration pulse (for mathematical description, see Kargo and Giszter, 2008, their Appendix). In all studies to date in frogs, we have always observed pulsed activation of such premotor drives in 250–275 ms bursts. Such a pulsed drive acting alone leads to a muscle activation, which in isometric conditions generates a scaled constant-structure force field at the limb endpoint (Kargo and Giszter, 2000b). In free-limb conditions, the effect can be described as a viscoelastic force field. These premotor drives can be examined physiologically (Kargo and Giszter, 2000b, 2008) or extracted from the motor pattern with various techniques (Hart and Giszter, 2004).
We extracted such primitives [corresponding to “premotor drives” (Hart and Giszter, 2004)] from the muscle patterns using the statistical signal processing method of ICA (Bell and Sejnowski, 1995; Brown et al., 2001; Hart and Giszter, 2004). We used an 80-point tapered root mean square filter to the 2 kHz EMG recordings and downsampled the results to 250 Hz for ICA. The specific implementation of this infomax algorithm can be found at http://sccn.ucsd.edu/eeglab/. This implementation uses the observation that mixtures of sources tend toward Gaussian-shaped distributions. Independent components are identified by iteratively extracting components whose distributions are less Gaussian than those of the preceding step. ICA as used here extracts estimates of the synchronous drives to sets of EMGs by assuming that they represent distinct information sources. The resulting extracted independent components found here strongly resembled the data already published by Hart and Giszter (2004), in both their temporal patterns and the component weights in their weight matrices (see below). The ICA-extracted groups of muscles also closely matched the groups of muscles identified by other means. For example, we have shown that groups of muscles in muscle activation patterns in spinal frogs during adjustments, corrections, and deletions in motor patterns behaved as units (Giszter and Kargo, 2000; Kargo and Giszter, 2000b, 2008). ICA extracted these same units. We retained the top six components, which reconstructed 85–95% of variance. We constructed a global template matrix representing the average contribution of each extracted primitive to the set of muscles using data from 24 previously recorded frogs. The average column-by-column (columns correspond to the weights of each component) correlation of each mixing matrix obtained here with this template matrix from previous work was 0.85 (median, 0.84), with an SD of 0.0709. In addition, we tested the stability of parameter ratios in the top three muscle parameters matched in the extracted components across frogs in the data used here, using the ratiometric method developed by Kargo et al. (2009, their Fig. 10). We also examined the correlation of the muscle ratio parameters. Median correlations range from 0.7 to 0.99. This analysis is presented in Table 1. The coefficient of variation of each corresponding component activation pattern across the frogs' activations is presented in the last column. To examine the richness of activations of components relative to one another in the frogs tested, we then performed a principal components analysis (PCA). We used PCA on the top six activations from the data (i.e., those with their component weights analyzed in Table 1). Our rationale for this analysis was that it was conceivable that, despite the informational measure independence discovered with ICA, there could nonetheless be significant stereotypic covariance of components in, for example, very standard wiping (Kargo and Giszter, 2000b, 2008), which would be revealed in a PCA-type analysis. Although this is usually not the case in such analyses (Cappellini et al., 2006; Tresch et al., 2006), it was nonetheless possible. An isometric wipe with three primary components would then have a significant fraction of the total variance in the component activation patterns captured with the first two or three components, implying a dimensionality of two or three in the PCA. We found that the PCA showed variance fairly evenly distributed among the orthogonal principal components, i.e., dimensionality reduction to a simpler linear subspace was not possible. We also plotted independent components directly against one another and saw that trajectories showed significant space filling and little obvious simple structure (supplemental Fig. 1, available at www.jneurosci.org as supplemental material). The independent component activations thus ranged over the activation space and showed rich combinations of activation patterns. If only highly stereotyped patterns were elicited, with strong muscle covariation, the dimensionality of activation would have been significantly reduced in the principal component space and likely revealed in cross-plots of component activations.
Table 1.
The stability and correlation of the muscle ratio parameters for components across frogs
| Top 3 muscles in component | M1/M2 ratio | Mean M1/M2SE | M3/M1 ratio | Mean M3/M1SE | Median top three muscle parameter correlations across frogs | Coefficient of variation (%) of activation level across trials |
|---|---|---|---|---|---|---|
| BI, SA, VE | 0.4472 | 0.1587 | 0.9597 | 0.1697 | 0.8932 | 52.1895 |
| SM, AD, RA | 1.0347 | 0.2229 | 1.8072 | 0.3195 | 0.9587 | 85.9654 |
| ST, RA, VE | 1.2514 | 0.4092 | 0.8790 | 0.1554 | 0.9466 | 90.0926 |
| GL, SA, AD | 0.3916 | 0.1910 | 1.5994 | 0.2827 | 0.9934 | 57.5303 |
| VI, SA, AD | 1.2254 | 0.2073 | 1.1324 | 0.2002 | 0.7030 | 65.8259 |
| RI, AD, SA | 1.2973 | 0.2726 | 0.9789 | 0.1731 | 0.9360 | 81.2818 |
We thus used the results of ICA decompositions to obtain rich drive patterns (the activations) representing primitives, which were used to compare how the recorded neural activity was related to the extracted drives and to the original EMG recordings. Raw (unfiltered) EMG activity and simple unfiltered but rectified EMG activity were retained for the spike-triggered averaging (described below) without down sampling.
Smoothing and binning of neural activity for rate measure.
Neural activity of single neurons was binned (15 ms bins) using standard criteria (Moddemeijer, 1997; Paninski, 2003) to obtain firing rates estimates. Continuous neural firing rate functions were estimated by binning neural time stamps using a sliding window of 15 ms width. We used a unity Gaussian weighting of spikes as a function of distance from the window center (with a Gaussian σ or SD of 2 ms). To estimate rate at the center, we then summed the weighted values of the spikes in the window. Effectively, this rate calculation ignored spikes >7.5 ms (or 3.75 σ for the Gaussian) away. This scheme follows the work of Abeles (1982). Continuous waveforms were created by advancing the window, one time stamp at a time, to the end of the record, performing this smoothing operation at each step. The mean value of the resulting continuous waveform across fixed-duration (15 ms) bins was then used in subsequent discretization and binning. Firing rates were highly variable over time, with very sparse firing the rule rather than the exception. After application of the wipe stimulus, firing rates usually increased dramatically. Similar stimulus-locked variability in firing rate is also seen in cortical neurons (Schaette et al., 2005). We examined the fano factor F (the ratio of the variance of a process to its mean) for the rates. It represents a measure of departure of the rate process from Poisson statistics, wherein the mean and variance are equal:
where σ2 is the rate variance and μ is the mean rate.
For binning intervals of 10, 15, 30, and 50 ms, the average ± SD fano factors were 0.9915 ± 0.095, 1.0566 ± 0.0580, 1.1029 ± 0.1542, and 1.2193 ± 0.3226, respectively.
Linear regression measures of association.
Regression coefficients, and variance accounted for, were used to examine and compare linear associations of neural activity, EMG, and components. These were calculated in MATLAB using standard methods. Multivariate regressions, when used, were obtained using the MATLAB mvregress function for diagonal parameter models and the GLMfit function for full parameter matrix fits.
Estimation of information measures.
Shannon information is a measure of the capacity of the firing pattern of a neuron (i.e., a communication channel) to encode information or patterns of symbols and the novelty and probability of these patterns. Mutual information (MI) is a measure of how much of the Shannon information is held in common between two or more channels, or neurons (Moddemeijer, 1989, 1997, 1999; Paninski, 2003). The idea is that low probability patterns that occur in both of two channels may represent significant common messages in the channels and a relationship between the channels.
Measures of MI examine linear and nonlinear correlations among neurons and are agnostic about the precise timing between the patterns of information among the channels or neurons. As such, mutual information measures can form a broad “net” to capture and compare many different associations of activity across a population of active neurons, without any a priori selection or classification of the neurons. We used the measures in this way in populations of neurons to compare their associations with EMG and components at different depths and after sorting into groups, e.g., based on sensory field responses (see Fig. 2).
The patterning of symbols that is used for making estimates of information and mutual information depends both on spike binning and how symbols are assigned to the spike rates of the bins, i.e., how it is assumed that information is encoded. We do not yet know how best to think about the neural coding of movement in spinal interneuron populations. Accordingly, we performed analyses of mutual information using both normalized and absolute firing rates. In the normalized analysis, the peak firing rates of all neurons were scaled to 1. For absolute firing rates, the level binning for all neurons was based on the highest rate observed across recordings of neurons in that frog (i.e., relative to the fastest firing neuron in the recordings). This second method of setting levels was for us most relevant in interneuron clusterings of information, which are not presented here. However, we note the method here because basic findings presented here did not differ qualitatively between analyses with the two different methods of symbol generation. Firing rates were converted to a symbol string representation following the methodology of Abeles (1982). Amplitudes were divided into eight level ranges, each level corresponding to a unique symbol. The time axis of each waveform was divided into bins of width 15 ms (as in the Gaussian smoothing step). The mean amplitude of each firing rate waveform within each bin was calculated, and the resultant number was, depending on its value, assigned to the appropriate level range and to one of the eight symbols defined above. EMG or component activity was converted to a symbol string representation according to identical criteria. We also tested mutual information using 12 level ranges, but this did not alter our results. Our basic findings also did not differ in any major ways between the 15 and 30 ms binnings.
We here present the analysis of normalized firing rates for 15 ms bins chosen for calculation of mutual information using the methods outlined by Paninski (2003) and Moddemeijer (1997). We used the Moddemeijer algorithm for calculation of mutual information (code available at http://www.cs.rug.nl/∼rudy/matlab/), which incorporates both bias estimation and its removal. Mutual information was calculated between symbol string representations of spike firing rates, EMG, and IC, using the information toolbox for MATLAB developed by Rudy Moddemeijer (http://www.cs.rug.nl/∼rudy/matlab/index.html).
Information was estimated by binning the number of occurrences of each symbol in a two-dimensional histogram. One axis of the histogram represents either the EMG or IC variable, whereas the other axis represents the neural firing rate. The mutual information between the two series of variables is then estimated by the double sum over the joint probability of the two variables times the logarithm of the quantity represented by joint probability divided by the marginal probabilities of those variables, that is:
 |
where each xi represents a range of values (i.e., binned and transformed into a given symbol) for the EMG (or IC), and each yj represents a range of values for the firing rate and p(xi) the probability of xi, p(yj) the probability of yj, and p(xi,yj) the joint probability of xi and yj. Because each cell in the histogram may not necessarily be occupied, the estimate of the mutual information may incur a not insignificant bias (Miller, 1955). A bias correction term, proportional to the number of occupied cells divided by the number of counts in those cells, may be subtracted off to improve the mutual information estimate (Moddemeijer, 1997):
 |
Jackknifing of the concatenated symbol string data was performed by dropping out a portion of the data, here a single trial for each iteration and calculating the MI as described above. We then repeat the procedure, dropping out another trial portion of the string and recalculating the MI. This procedure was performed for all trials in a frog recorded with the neuron (15–50 trials), and the average and SD of the set of jackknifed mutual information values were calculated. The median to mean ratio of these mutual information estimates always lay in the interval 0.8–1.2, and, in 90% of neurons, median to mean ratios lay in the interval 0.9–1.1, which we took as an indication of near symmetric distributions and approximate normality.
We constructed a matrix of mutual information values between symbol string representations of each independent component/primitive derived from the EMG and the symbol string representation of the firing rate of each cell. The best associated (highest mutual information) component–cell pairing of each cell was identified from this matrix. The dominant four muscles present in each component/primitive and mutual information values with these muscles were then also examined for each muscle–cell pairing. The mutual information (with the cell firing rate) of the best associated and worst associated muscle in each set of four were retained for comparison with the highest mutual information values for the component.
Mutual information comparisons.
To compare mutual information values in our data analysis, we used a jackknife procedure to determine statistical significance of mutual information differences. We then classified cells as significantly better related to components/primitives, significantly better related to individual muscles, or indeterminate. We examined the variance in the mutual information estimates in our data by successively omitting each of the trials of the 15–30 trials in a frog, as described in the preceding section. We used the individual variances of two series MI estimates, in combination, to calculate whether the estimated value difference was significant. We calculated the perpendicular distance d of the coordinate pair [MI1, MI2] (of the mean mutual information values from jackknifing) from the equality line. We then compared this with the distance defined by 2 SDs, estimated from the summed variance. The difference thus was considered significant if
 |
If d for jackknifed mutual information comparisons was >2 SDs and the difference was positive, then the difference of cell/component and cell/EMG were identified as “associated with series 1.” If the difference was >2 SDs below 0, they were identified as “associated with series 2.” If d was <2 SDs, the cells were considered indeterminate. In practice, variance was low in MI estimates, and few to no cells were “indeterminate.” We then compared the numbers of cells in specific recorded populations (e.g., cutaneous dorsal horn cells) that fell in each of the two significant difference categories, assuming equal probability of each type of significant difference and used standard Z scores to test the population for significant differences from chance under this assumption.
Comparison of proportions of mutual information.
Proportions of mutual information were estimated and compared for the best components and for the highest and lowest information EMGs associated with the component. The mutual information as a proportion of the lowest Shannon information obtained from either the component or EMG series was then calculated.
Shannon self-information or entropy of each series was calculated in the standard manner as
 |
where p(xi) is the discrete probability of symbol xi.
The rationale for this comparing of proportions as well as absolute values is as follows: MI obeys some basic constraints. If we examine MI(A,B) for two sequences of variables A and B, then MI(A,B) cannot exceed the lesser of I(A) and I(B), where I is the Shannon information. The difference of MI(A,B) from total information of I(A) or I(B) is a noise entropy term, which we will term I(Noise):
 |
Conceivably, a neuron series N could have a higher mutual information with one series A of high entropy but also have a high noise entropy, although having lower mutual information with a second series B but also a very low noise entropy.
The fractional mutual information for a neuron series N with a series A, for I(N) > I(A), [which mostly held true (see Fig. 4A)], is given by the following:
For the second series (B), the fractional mutual information from Equation 7 would be close to 1, whereas for the first series (A), it would be much smaller. Most information in series B would be accounted for by the information in N, whereas proportionately much less in series A was captured. To account for these possible disparities, which intuition suggests could potentially be functionally important, we examined fractional as well as absolute mutual information in our comparisons here. Jackknifing was used to estimate variance of the proportion values calculated as it was for mutual information and thus to evaluate significant differences.
Figure 4.
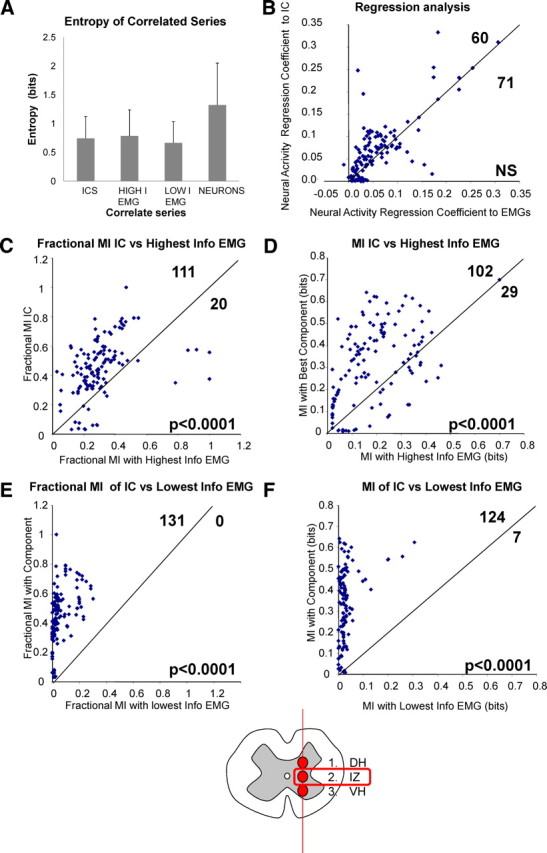
Comparisons of relations of 131 interneurons recorded in intermediate zone at 700–800 μm (diagram at bottom) with EMG and with components. Units had no clear sensory fields in quiescent frogs as shown in Figure 3. The neurons were related to components and to the associated individual EMGs comprising the component projection, and the relationships were calculated and compared. We tested both linear regression and mutual information measures. In each plot, only those neurons in which jackknifing of mutual information measures showed could be compared and differed with 95% confidence are shown (131 in all C–F). A, Comparison of Shannon self-information or entropy in the three sets of muscle-derived time series with which neuron MI is compared in C–F. These are not significantly different from one another (SDs shown). The neural entropy is also shown and on average was significantly larger than the EMG derived series. B, Lag 0 linear regression (and lagged regressions not shown) of neuron firing to components and EMG using a 15 ms window showed no significant differences between variance captured by EMG or components. C, Fraction of possible MI of neurons with components were routinely higher for the best-matched component than with the highest information EMG found in the projection of the component (111 of 131, p < 0.0001). D, The absolute MI of the neurons with best-matched component was greater than with the highest information EMG found in the projection of the component (102 of 131, p < 0.0001). E, The fraction of possible MI of neurons with the best-matched component for the neuron was routinely higher with components than with the lowest information EMG found in the projection of the component (131 of 131, p < 0.0001). F, Absolute MI of neurons with the best-matched component was greater than with the lowest information EMG found in the projection of the component (124 of 131, p < 0.0001). Mutual information measures for intermediate zone thus support spinal representation of pattern and motor drive in intermediate zone neurons in terms of premotor drive components, not individual muscles EMGs. DH, Dorsal horn; IZ, intermediate zone; VH, ventral horn.
Spike-triggered averaging analysis.
In a final phase of analysis, we examined all neurons with strongly modulated firing rates for STA effects in motor pools. STA can often reveal short-latency neural postspike facilitations to motor pools, by averaging the EMG signals (Fortier, 1994). This approach allowed us to look more directly at the relation between neural spiking and muscle recruitment in the recorded interneurons. We used STA applied to raw and to rectified, but unfiltered, variance normalized EMGs. Following Fortier (1994), significance of STA effects was calculated by standard methods based on preceding baseline variance to obtain confidence intervals and persistence of the average signal above this level for several successive samples. A 30 ms interval of EMG record of 15 ms before each spike and 15 ms after each spike was excised and retained for averaging. Baseline activity and its variance were calculated using a 10 ms window of points between −15 and −5 ms from each spike used in the calculation. Significant peaks in the resulting spike-triggered averages were identified using Fortier's criterion of at least three points above a threshold defined by 2 SDs above the mean baseline value, using at least 500 spikes. Chronux, a package of analytical tools available at http://www.chronux.org/, was used to perform the spike-triggered averaging on EMG data and to determine the significance of spike-triggered averaging results in this way. Chronux determines significance of STA by a bootstrap technique for baseline variance, compiling 20 windows of EMG data before the spike time to estimate SD for the baseline. Forty-six neurons were recorded from the intermediate zone with firing patterns that supported significant STA effects. Several (14) neurons recorded in the ventral horn were also examined for comparison, and these each had significant facilitations to only one muscle at shorter latency. We cannot definitively state that these were motoneurons because we did not backfire them from muscle, but the response latency is consistent with this classification. All 46 intermediate zone neurons with strong and significant facilitations either had >500 spikes across the recording sessions (most neurons) or showed statistically significant STA results using the Chronux analysis package criteria (http://www.chronux.org) with slightly fewer spikes. Finally, we compared the similar shapes of STA waveforms from these interneurons with those obtained from spike-triggered averaging of EMGs that were obtained from STA triggered by individual muscle motor units recording with single-unit intramuscular electrodes (supplemental Fig. 2, available at www.jneurosci.org as supplemental material).
Comparisons of STA and component matching.
Vectors of parameters from STA and from ICA were compared by binary inner product correlations and by regression analysis. For binary inner product correlations, a vector of length 10 (the number of recorded muscles) with all but the four most significant weights of the component set to 0 and the four most significant weights set to 1 was constructed. This binary component vector was then correlated with the binary STA vector. The binary STA vector was also of length 10. For all significant STA facilitations, the value was 1 and 0 elsewhere. The number of STA facilitations observed did not exceed six. A standard correlation from 0 to 1 was then obtained for the best binary component and STA vector pairings. The distribution of these correlations was next compared with the distributions of correlations of components to randomly generated distributions of STA vectors. We made 1000 drawings from two random distributions: (1) drawing four muscles from a uniform distribution with equal likelihood of each muscle and (2) drawing from a distribution with each muscle represented in proportion to the number of times it occurred in components multiplied by the number of occurrences of each such component in the best mutual information associations with neural data. The cumulative distribution of the measured data and the cumulative distributions of the randomly generated data were compared with the Kolmogorov–Smirnov test. The random draws were not significantly different from each other, but each differed significantly from the observed data.
For regression analysis, we proceeded as follows. We regressed in log–log coordinates to allow for nonlinear effects in the data. First, we simply regressed significant STA facilitation levels above baseline with the matching component weight ignoring the other STA or component weights. That is, each weight/facilitation match was treated independently. Next, we performed a multi-input multi-output multivariate regression with each neuron having four components and weights and the regression parameters constrained to be diagonal. Finally, we relaxed this constraint and allowed off-diagonal parameters in a similar regression. The diagonal parameters of all regressions were large and significant, and variance accounted for was 0.44 or better in each regression.
Results
We made simultaneous recordings of EMG activity and multielectrode neural activity in the superficial gray (400 μm), the deep intermediate zone (800 μm), and the upper ventral horn (1200 μm) of the spinal bullfrog. Recordings were made at the L2/L3 border at ∼500 μm lateral to the midline. Figure 1 shows examples of EMG and isolated interneuron spike train rasters from deep intermediate zone in a frog. Recordings occurred under isometric but unparalyzed conditions. We extracted independent components from muscle activity using infomax ICA (Bell and Sejnowski, 1995; Hart and Giszter, 2004). These extracted components represent estimates of premotor drives. All time series (EMG, components, and neural rates) were normalized to a range from 0 to 1. We then proceeded to relate neural activity to the EMG and to the components-based representations of motor activity using the analysis scheme in Figure 2. No strongly rate-modulated active neurons were omitted from this analysis, but analyses were performed with cells grouped by region of gray based on depth and by presence or absence of quiescent sensory responses within a region.
We tested both linear methods and mutual information-based analyses. When we compared multiple linear regressions of neural firing with independent components and with associated EMG, we found that regression coefficients were generally very weak (Fig. 4B examines regression coefficients in the population of cells recorded in intermediate zone at 800 μm depth). On average, recorded spiking activity accounted for <10% of motor pattern variance. There were also no significant differences in any tested region of gray among the number of cells in the population that were evaluated as significantly better related to either muscle activity or independent components using linear regression. We therefore focused on information-based techniques in subsequent analysis.
Response patterns across depths
Results with Shannon information were significantly different in different regions of gray and showed differences between the association of neurons with muscles and components, contrasting with the linear regressions. Three sensory tests were performed before the initiation of wiping and other behaviors at each recording depth. We were concerned that cells sensitive to different sensorimotor modalities might relate differently to EMG and component activity at different recording depths and we expected different modalities to have disparate representations at different depths. We first examined neural responses to gentle palpation of muscles of the hindlimb. We second examined cutaneous responses using gentle stroking with a blunt wooden stylus along the length of the skin of the thigh and shank, applying minimal pressure during the stimulation. We third observed responses to slowly moving the limb around the workspace. In each instance, neural recordings and evoked EMG activity were obtained and spikes were sorted as described in Materials and Methods. In no instance did we observe any limb movement or systematic EMG responses during gentle palpations or light touch, nor any systematic EMGs in response to slow and gentle imposed limb movement.
Dorsal horn
At the shallowest depth (400–500 μm), significant neural activity was observed in response to all sensory/proprioceptive manipulations. One hundred nine total units, as identified from tetrode classifications using the Shoham algorithm, were recorded at this depth. Of these 109 units, 42 units demonstrated strongly rate-modulated activity (as defined previously) during the sensory stimulation regimens described above. The remaining units fired very infrequently (fewer than 30 spikes) or were tonically active but unmodulated. Muscle palpation resulted in strongly modulated firing rates in eight recorded neurons in dorsal horn (i.e., 20% of the strongly rate-modulated neurons) (Fig. 3A,C). We related the MI between the firing rate of each such cell calculated with the best associated EMG and the MI between the firing rate and the best associated component (IC). At this depth, we saw an even division of the proprioceptively modulated neurons in superficial gray into two groups: those better associated with EMGs and those better associated with ICs. As shown in Figure 3E, we also examined 20 cells modulated less specifically by limb configuration changes. In frogs, published data suggest that these might be proprioceptive, joint, or cutaneously driven firing changes. These 20 neurons also divided evenly in their mutual information relationships with components and EMGs when spinal behaviors were activated: 11 cells were better associated with EMG activity, and 9 cells were more closely associated with IC activity. Using a Z score for frequency counts to test for a significant difference for these neurons alone, we found a Z statistic of 0.44, and the distribution thus did not differ significantly from pure chance at an α = 0.05. Combining these neurons and the proprioceptive cells identified by palpation did not alter this. However, the 14 neurons that were clearly modulated by cutaneous inputs differed from this pattern. These cells were uniformly (14 of 14) better associated with ICs than EMGs (p < 0.001, binomial test distribution). Figure 3D shows this comparison. This strong association for light touch-responsive neurons may indicate that stronger skin stimuli recruited these neurons to initiate recruitment of parts of flexion and the wipe patterns and thereby initiate particular motor primitives (represented by the independent component in question) present early in the wiping or flexion sequence. We were not able to find any significant spike-triggered averaging effects for any of the cells we recorded at the 400–500 μm depth. Combining all neurons in the dorsal horn into a single set, 29 of 42 related better to components (Z score of 2.62, p < 0.005), but this was clearly a result dominated by the set of cutaneously responsive cells.
Figure 3.

Comparisons across depths. Units responses were evoked in response to muscle palpation, light touch stimulation, or manipulation of limb position around the workspace in quiescent frogs or by activating spinal behaviors with strong skin stimulation. A, Quiescent responses. We obtained a range of neuron responses at 400–500 μm depth with muscle palpation (“muscle palp”), light touch (“light touch”), and passive limb movements (“limb movement”) of quiescent spinal frogs, but no neurons responded clearly and repeatably in this way at 700–800 or 1000–1200 μm. B, Informational comparisons between neurons recorded at different depths. Mutual information was not higher with components or EMG in neurons at 1000–1200 μm or neurons at 400–500 μm with the exception of light touch responses (plotted in C–E). At 700–800 μm, there was a strong preference for components (as elaborated further in Fig. 4 and here in C–E). DH, Dorsal horn; IZ, intermediate zone; VH, ventral horn. C, Neurons with responses to muscle palpation showed no clearly stronger relationship in their fractional mutual informational with either EMGs or ICs, with four neurons possessing better associations to EMG (points above line) and four neurons possessing better associations to the ICs (points below the equality line). D, Neurons responding to light touch stimuli had mutual information fractions uniformly better associated with ICs. All points were below the equality line (binomial distribution probability <0.001). E, Cells responding to manipulation of the limb showed no clearly better fractional mutual information association to either EMGs or ICs (Z score of 0.44 for frequency counts, p = 0.67, n = 20).
Ventral horn
In the ventral horn (14 neurons), we found no clear responses to passive leg manipulation, palpation, or light cutaneous stimulation in the quiescent frog, as seen in Figure 3A. The neurons recorded divided evenly among those related best to components and those related best to EMG (Fig. 3B). Several cells appeared to relate to specific muscles, with high firing rates well suited to spike-triggered averaging (see below).
Intermediate zone
In the recordings in intermediate zone (700–800 μm) (Fig. 3A), the cutaneous and proprioceptive manipulations we used in the spinal frog generated very little activity, similar to ventral horn responses (1000–1200 μm). We could not evoke more than a few spikes over the entire testing period (usually 10–30 spikes). This observation matches the weak primary afferent effects reported in the quiescent frog for many interneurons in published data (Simpson, 1973). However, clear patterns emerged when we activated the wiping behavior using brief strong skin stimulation.
In the intermediate zone depths (700–800 μm), when recording during brisk wiping behaviors, a clear relationship of neurons to components that was stronger than that to individual muscles emerged. The various mutual information measures with the motor pattern that we obtained for individual neurons at this depth were consistently and significantly greater for premotor drive components than for individual EMGs. One hundred thirty-one interneurons were tested in the intermediate zone. The significance of association comparisons was tested using a jackknifing procedure (see Materials and Methods). We made comparisons of the numbers of the intermediate zone neurons with significant differences in mutual information between individual muscle electromyograms and components. The absolute mutual information of 102 of 131 neurons tested (Z score of −6.29, p < 0.0001) was significantly higher with at least one component than with the most information-rich individual EMG (Fig. 4D). One hundred eleven of 131 also had a higher fraction of the maximum possible mutual information with one component rather than with the most information-rich EMG (Fig. 4C) (Z score of −7.86, p < 0.0001). Furthermore, we found that, in 45 of these neuron tests, the most information-rich EMGs exceeded the corresponding components in their total information. A significant number of these 45 cases nonetheless had higher fractions of mutual information with components (32 of 45, Z score of −2.683, p < 0.005). The mutual information of these neurons with components was also greater when compared with the lowest information EMGs (124 of 131 higher absolute MI, Z score of −9.63, p < 0.0001; 131 of 131 higher fractions of MI, Z score of −11.53, p < 0.0001). Together, these several tests comparing components with both higher and lower information EMG time series showed that the larger absolute and fractional mutual information of neurons with components did not simply reflect variations in the total information of sources from which mutual information was calculated, i.e., this result was not attributable to the information content of the components themselves being larger or smaller than individual EMGs. Neurons had both higher mutual information and higher fractions of mutual information with components than with individual EMGs. Neurons were best related to the independent components on the basis of mutual information, not to individual muscles or simply to aggregated muscle activity.
In deep gray matter and in upper ventral horn (at depths of 1000–1200 μm), the association of neural activity divided equally between components and individual muscles using mutual information measures as described above.
As a graphical representation of the association between component/primitive activity and interneuronal firing obtained by the mutual information methods we used, we looked at the distribution of spike times relative to the onset in motor activity of the three main phases of the motor patterns observed during a wiping behavior: hip flexors (HF), knee flexors (KF), and hip extensors (HE) (Kargo and Giszter, 2000a,b, 2008). These three muscle groups were identified in a survey of the three largest contributing muscle groups performed over 30 frogs. The muscle groups were defined as follows: KF: ST, BI, and SA; HE: RA, RI, SM, and ST; and HF: IP (iliopsoas), GL, ST, and SA. These correspond to muscle groups in the study by Hart and Giszter (2004) and to muscle groups in wiping in the studies by Kargo and Giszter (2000a,b, 2008). Extracted independent components were assigned to one of these three groups based on the strength of their projections onto all the muscles in the set. The muscle group for which the component possessed the largest mean projection was used to assign the status of that component as a hip flexor, hip extensor, or knee flexor primitive. Onsets of component bursts were defined by a significant increase in the activity of each component to >3 SDs above baseline noise levels. Recorded neurons were segregated into three categories based on which of the three groups of components above were best associated with those neurons (with respect to mutual information). Population histograms for each were constructed (Fig. 5).
Figure 5.

Interneurons segregated into groups based on mutual information matching to components in intermediate zone (IZ; 800 μm depth). Components were related to primitives identified previously by both statistical and physiological means (Hart and Giszter, 2004; Kargo and Giszter, 2008; Kargo et al., 2009). Interneuronal firing was phasically related to primitive/component group activity. A, Rasters of two neurons in two frogs with strong relationships to the hip extensor component/primitive are shown. The rates of the neurons clearly relate to component amplitudes and the burst or pulse-like behavior. These neurons were also used in STA analysis. B, Two neurons best related to the period preceding (above) or the onset (below) of the hip extensor component burst. C, Neurons best related to one of the most frequent components (the hip flexor component) were aligned with component burst/pulse onsets (defined as 3 SDs above baseline noise). The neural activity was then binned to form a population peri-onset time histogram (PSTH), and the component burst/pulses that were aligned in this way were also averaged. It can be seen that the aggregate activity of the informationally related neuron population can be related especially well to the motor burst onsets and duration. However, strong preceding and following population activity can also be seen as might be expected based on the mutual information criteria for selection used (see Results). DH, Dorsal horn; IZ, intermediate zone; VH, ventral horn.
The mutual information-based classification is broad, including neurons related in numerous ways to the components, and these different kinds of firing patterns are all combined in the population histograms for components. As illustrated in Figure 5A, there were some neurons in intermediate zone that clearly modulated their spiking directly with component activity (hip extensor component-related activity is shown for sample neurons from two frogs; these cells also qualified for the STA presented in the next section). Figure 5B shows neurons preceding onset of component activity. There were also a variety of other firing patterns that could lead to high mutual information. These kinds of patterns were all combined in the population histogram. Figure 5C shows the aggregate activity of the population of hip flexor component-associated cells, averaged across all frogs. This combination of cells types in a single histogram has the potential to obscure the relationships of different sets of neurons to components as remarked already. However, it can be seen that there was a peak of firing at early onset, as well as strong firing through the averaged peak of the component. Note also that there was a second period of elevated firing in the population of component-related neurons that occurred after the cessation of the component and the more directly component-related firing. These later peaks likely indicate that, although the population of cells related best to a particular component on the basis of mutual information, the population included substantial strongly rate-modulated activity (see definition above) of some neurons that occurred during the termination or as a result of particular sequencing of burst phases. The variability of firing patterns is perhaps not surprising given the potential complexity of connection patterns between intermediate zone interneurons and ventral horn motor neurons and within intermediate zone networks themselves. We briefly note this here but plan to analyze this further in future work because it is not the focus of this study.
Topography of component representations
In each frog, at each probe placement in intermediate gray at the L2/L3 border, we always saw neurons related to most of the six components. We never observed a situation in which all neurons on 24 electrodes associated with only one or two components. This differs strongly from the expectation suggested with microstimulation (Bizzi et al., 1991; Giszter et al., 1993, 2000a,b) or NMDA iontophoresis (Saltiel et al., 2005). However, the current data were collected using a very focused recording strategy. More work is needed to fully understand the relationship of these data to stimulation results.
Spike-triggered average effects from neurons to muscle activity
In a final stage of our analysis, we tested all neurons from the dorsal horn, ventral horn, and deep intermediate zone using the STA technique (Cheney and Fetz, 1985; Botteron and Cheney, 1989; Schieber and Rivlis, 2005). STA of EMG activity can often reveal short-latency neural projections to motor pools. This approach allowed us to look more directly at the relation between neural spiking and muscle recruitment in a subset of suitable recorded interneurons. Many neurons had too few spikes to be expected to allow for any significant STA effects or, despite high rates, showed no effects. There were no significant STA effects from any neurons recorded in the dorsal horn. However, 46 neurons recorded in intermediate zone showed significant facilitations with spike-triggered averaging of the EMG. We analyzed the STA postspike facilitations of these neurons using both unrectified and conventional rectified but unfiltered EMG. STA using unrectified EMGs provides slightly more stringent statistical testing of connectivity. Unfortunately, STA of unrectified EMG is unable to distinguish excitation from suppression (Botteron and Cheney, 1989). Significant facilitations using both rectified and unrectified EMG were judged to be those that persisted above the 97.5% confidence level (obtained from the baseline preceding the spike) for >1.6 ms (or three sample points) (Botteron and Cheney, 1989; Fortier, 1994). In our data, the results of both analyses were very similar. When we compared facilitation effects with both approaches, it was clear from the STA of the rectified EMGs that all the significant postspike facilitations found in the unrectified data were excitatory. In the ventral horn, all significant STA postspike facilitations examined were to single muscles. These ventral horn neurons showed these single muscle facilitation effects at latencies of ∼2.5–3.5 ms in STA (Fig. 6A). In intermediate zone, all postspike facilitations in the 46 neurons with significant effects were to multiple muscles at a longer latency (Fig. 6B). We found no STA suppression. The spike-triggered averaging analysis of the 46 neurons from intermediate zone showed significant peak onsets at average latencies of ∼5.5 ms. These results fit with the known physiology: a calculated 2–3 ms conduction delay for large-caliber motor axons over the 6–12 cm of peripheral nerve from the spinal cord to the motor points of thigh muscles in our bullfrogs and ∼0.5 ms delay at the neuromuscular junction at 25°C. The ∼5.5 ms latencies for the EMG potentiation in STA seen in testing the interneurons are consistent with polysynaptic (or more likely disynaptic) projections to motoneurons. All of the interneurons tested had significant simultaneous or nearly simultaneous peaks in multiple muscles at these latencies.
Figure 6.
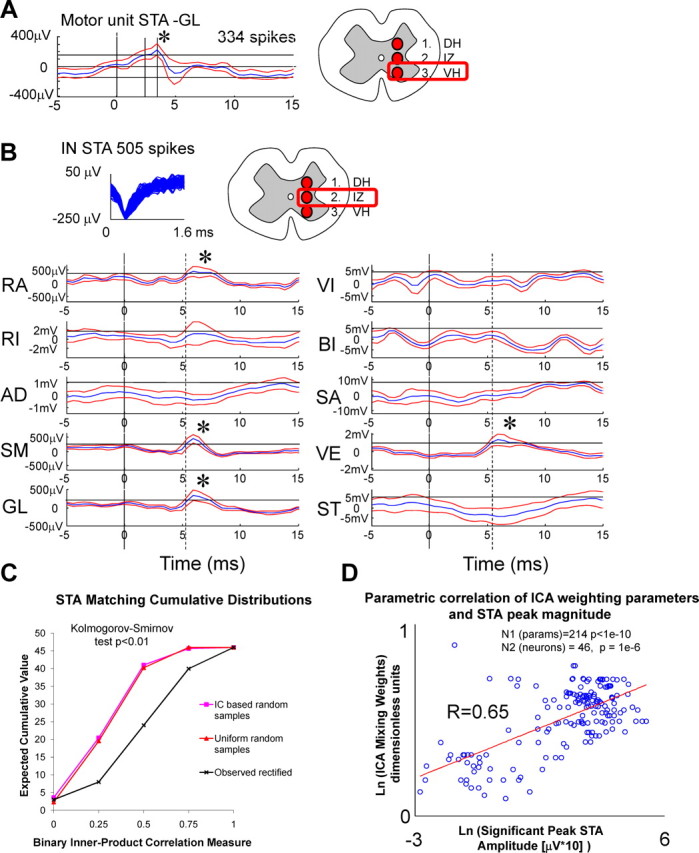
Spike-triggered averaging of EMG postspike facilitations of interneurons. We used both STA of raw EMG that minimizes likelihood of false positives and STA of rectified unfiltered EMG to examine facilitation or inhibition. All effects were facilitatory. A, Spike-triggered average of raw EMG for a putative motor unit from the ventral horn (1200 μm depth) to the gluteus muscle of a frog. Shown for comparison with interneuron spike-triggered averages. B, Spike-triggered averages of raw recorded EMG with an interneuron in which we recorded 505 spikes. The best tetrode channel waveform is displayed at the top. The average waveform, the significant peaks (asterisks), and the Chronux calculated confidence limits are shown. The unit had significant STA peaks for RA, SM, GL, and VE. Each postspike facilitation effect was excitatory and also significant in STA of rectified EMG. The most closely related component had significant projections to RA, SM, GL, and RI. The binary inner product correlation measure of the two would thus be 0.75. C, Comparison of the distribution of binary inner product correlations of 46 neurons with significant STA postspike facilitations matched to best components (rectified EMG distributions shown) are compared with those predicted by distributions of (1) random connections or (2) random connections drawn from the distribution of observed components from mutual information matches in our data (calculated with Monte Carlo simulations with 1000 iterations). Cumulative distributions are shown. These were used in Kolmogorov–Smirnov tests. The high number and distributions of good matches of components to STA postspike facilitations were unlikely to have arisen by chance sampling of the random distributions (p < 0.01). D, Log–log correlation of the STA postspike facilitation peak strengths with the component weight strengths. Open circles represent the corresponding STA peaks measured at the same latency. Correlation of STA peak strengths with component weights were 0.65. The significance of the relation can be calculated assuming that each connection and its strength is an independent observation [r = 0.65, t statistic of 12.4, n = 214 (taken from STA peaks), p < 1e−10]. Alternatively, only individual neurons are considered independent observations (significant STA peaks: t statistic of 5.5, DOF of 45, p = 1e−6; all matched STA peaks: t statistic of 2.04, n = 34, p < 0.05). The regression presented here provides a good visual representation by collapsing all parameters onto a plane. More correct multiple input/output regressions were also performed, and outcomes are given in Results. Together, these results support a specific interneuronal distribution system providing drive for primitives.
We next examined whether the postspike facilitation patterns detected with STA analysis in the intermediate zone interneurons showed any matching with the motor projection patterns of primitives extracted with ICA (tested in Fig. 6C). To test this correspondence, we first used a binary matching. The binary inner product-based correlation that we used (ranging from 0 to 1, with 0 being no match and 1 being a perfect match) compared the qualitative matching of the patterns of significant STA peaks with the patterns of the EMG projections of the significant components (Figs. 5B, 6A). This analysis revealed a good correspondence between the significant STA peaks and the significant weightings of EMG in the extracted ICA component drives. Sixty-one percent (28 of 46) of the cells in the STA analysis had binary inner products that were 0.75 or better. That is, most of their significant STA effect peaks matched with the corresponding significant projection weights of the independent component onto EMG. Furthermore, 86% (40 of 46) of cells had better than a 0.5 inner product (or a 50% match, at least two of four significant correspondence). We tested whether this result clearly differed from the distribution expected if connections to motoneurons were formed randomly for these interneurons. We compared our observed data with the results that would be expected based on 1000 random samples of (1) random connections of uniform likelihood that occurred to similar numbers of muscles and (2) connections to muscles that were drawn randomly from distributions matching the frequency of occurrence of components found with the information measures. The cumulative distributions under these two random connectivity assumptions were both significantly different from the observed cumulative distribution in the data (Fig. 6C). The Kolmogorov–Smirnov test differed significantly (p < 0.01, n = 46) for the peak differences in cumulative distributions of observed unrectified EMG with the two random models (uniform, 25.93 ± 0.563; component distribution, 22.25 ± 0.483). Similarly, the observed rectified EMG differed significantly (p < 0.01, n = 46; uniform, 20.25 ± 0.44; component distribution, 23.93 ± 0.52). The significant matching of the postspike facilitations that we observed to component weights was thus highly unlikely to have arisen by chance.
The matching of postspike facilitations extended beyond the qualitative pattern of component projection weights, as tested with the binary inner product measure. More detailed analysis showed that peak heights of each of the STA facilitations also showed significant parametric correlation with the corresponding component projection weight when regressed and plotted on log–log axes (r = 0.65, t = 12.513, p < 1e−10, n = 214) (Fig. 6D) (for raw plots, see supplemental Fig. 3). This again was unlikely to have arisen by chance. In a perfect correspondence, there would have been 186 (46 × 4) peaks in STA data. There were slightly more significant STA peaks than expected. On average, there were 4.6 STA peaks per neuron, ∼16% more than expected for an average matching of four per neuron. To more stringently examine the significance of the correspondences of the peak, instead of considering individual postspike facilitations as independent observations, we considered only individual neurons as independent observations (n = 46, DOF of 44). We used two multivariate regression tests, one constrained to diagonal parameters (regression coefficient, 0.44; diagonal parameters, p < 0.05; DOF of 44) and one unconstrained (regression coefficient, 0.55; diagonal parameters all significant, two significant off diagonal parameters, p < 0.05; DOF of 44). In the unconstrained regression, we found that diagonal terms remained strongest and significant, indicating a significant relationship between each of the neural facilitation strengths and the corresponding premotor drive projection strengths. In addition, two of four significant relations of weights to STA remained purely diagonal with no cross terms from other weights significant in the regression parameter matrix. Our data thus support the existence of a collection of drive distributing neurons in the spinal cords of frogs. These neurons possess functional projection patterns (revealed as postspike facilitations using STA) that closely matched individual components both qualitatively (shown by binary matching) and quantitatively (shown by the significant correlation of STA facilitation to component weights). Before this study, the existence of such focused neural effects in multiple motor pools, and occurring in patterns closely related to motor primitives detected by other means, was simply a speculation.
Discussion
Our data demonstrate that, with respect to information measures, neurons in the intermediate zone of spinal cord relate significantly better to the motor primitives (or premotor drives) than to the activities of the individual muscles. Furthermore, using spike-triggered averaging, we showed that a subset of intermediate zone neurons had short-latency postspike facilitations to muscles that closely and directly match primitives. These neurons matched with primitives in both their connectivity pattern and the strength of their detected STA facilitations. Neurons recorded in the dorsal horn showed different patterns of activity; only cutaneous-related cells showed similar stronger mutual information with primitives. No dorsal horn neurons had significant STA effects. These results suggest that dedicated sets of interneurons in intermediate gray are associated with each drive or primitive. These circuits and their primitives are shared across behaviors.
The need for modularity in motor behavior and perspectives on the neural bases of modularity
Modularity is frequently observed in motor behaviors (Gottlieb, 1998; Bracha et al., 1999; Zaal et al., 1999; Earhart and Stein, 2000a,b; Flash and Hochner, 2005; Ting and Macpherson, 2005; Torres-Ovideo et al., 2006). It has been a conundrum to relate activity in the CNS to the modularity observed in execution tasks. A priori, many neural models could generate modular primitive-like behavior. David Marr (1982) divided computational analyses of CNS operation into levels of task, algorithm, or implementation. Which of these are represented by motor primitives? We here hypothesized that spinal modularity might be directly embodied in the neural circuitry (i.e., modular circuitry at Marr's implementation level). To test this hypothesis, we sought to identify and test the relations of the interneurons to motor pattern structure. Mutual information measures provided a broad and relatively assumption-free means to do this. Furthermore, spike-triggered averaging also supported the existence of specialized short-latency premotor effects in motor pools. The patterns of these match the pattern of muscles in primitives that can be identified by other statistical, physiological, and behavioral means in the motor pattern (Giszter and Kargo, 2000; Kargo and Giszter, 2000a, 2008; Hart and Giszter, 2004).
Specialized populations of neurons supporting primitives, as supported by the presented data, might be attributable to evolutionary constraints (Giszter et al., 2009). There are strong evolutionary arguments for constructing primitives early in development and even for hardwiring primitives. A motor system, like a computer, may need a “bootstrap.” Initial movements and building blocks for useful movement are needed early on in many animals. However, the necessary initial motions would be hard to identify “tabula rasa.” Conceivably, needed primitives might be built into the CNS and its development by evolution. Early experience in utero or in ovo during critical periods might then further shape the modularity (Schouenborg, 2002, 2004; Bradley et al., 2005). This would support early motor functions and could “seed” subsequent motor learning, thus helping, for example,, the wildebeest calf to walk almost de novo and to rapidly learn agile movements. However, a competing perspective suggests that modularity represents a natural outcome of online optimal controls, implemented in the CNS and operating on a fast timescale (Giszter et al., 2009; Tresch and Jarc, 2009). It has been shown that optimal controls and neural network mechanisms may lead naturally to low dimensional representations (Sanger, 1994; Todorov and Jordan, 2002; Ijspeert et al., 2003; Todorov and Ghahramani, 2003; Todorov et al., 2005; Chhabra and Jacobs 2006). Our data indicate that, if such optimizations drive modularity, then their physiological outcome is a quite focused selection, or tuning, of a set of premotor neurons. To choose between evolutionary and online optimization, it will be necessary to understand the plasticity, cellular, and developmental physiology of the neuron populations recorded here.
Spinal interneuron systems and recordings in other lower tetrapod vertebrates
As noted by Berkowitz (2008), both shared and dedicated neurons contribute to multiple motor behaviors in most invertebrates. Examination of both extracellular and intracellular recordings in turtle fictive and nonfictive preparations by Stein, Berkowitz, Currie, Hounsgaard, and others also show both shared and dedicated neurons recruited in fictive vertebrate motor patterns (Berkowitz, 2001, 2002, 2008; Alaburda et al., 2005; Stein, 2005, 2008; Berg et al., 2007; Samara and Currie, 2008). However, their data cannot or did not examine modularity in terms of premotor drive, or examine EMG and force patterns as we did here. Nonetheless, close but qualified correspondences exist. Berkowitz (2005, 2006, 2008) found shared neurons deeper in gray. Many of these neurons were recruited across many behaviors in the turtle.
Our multielectrode data from unparalyzed spinal frogs provide a multineuron picture of the neural supports of nonfictive spinal behaviors. Although our recordings here are extracellular, they are accompanied by active electromyograms, force generation, and fully operating sensory feedback, albeit under isometric conditions in this study. The relationship of the extracellularly recorded firing patterns to muscle activation can be assessed. Our data show that some of the shared multifunctional activity reported in fictive preparations of vertebrate spinal cord may represent neurons driving specific muscle group assemblies or primitives. Such neurons and their primitives are reused across behaviors. We found a subset of 46 cells in intermediate gray in which STA identified short-latency postspike facilitations indicating functional monosynaptic, disynaptic, or perhaps trisynaptic connections to motor pools. Like Berkowitz's (2008) intracellular study in turtle, these interneurons would be reused across behaviors, reflecting the activation of the same motor pattern in multiple contexts. Berkowitz showed direct anatomical projections of such reused neurons into the motor pools. Our data show specifically patterned physiological postspike facilitation effects of the neurons recorded that match primitives or premotor drives. Our data show that motor neuron connectivity and postspike facilitation strengths of some (shared) interneurons can be very specific, (i.e., they can likely act as conduits for drive across behaviors).
It is not currently possible to discount neuronal synchrony as a part of the basis of the matched STA postspike facilitations observed (Kutch et al., 2007, 2008). However, it is nonetheless clear that, in this case, our data support the existence of specific coordinated neural ensembles with effective connectivity or even projections matching components or premotor drive.
Mutual information-based classification grouped a range of neuron firing types. We found that the drive-related neurons showed strong burst-related specificity as a population, despite these broad mutual information criteria used to group them. Some neurons fired strongly during component bursts, and some of these showed STA responses. However, the population average response included some neurons that fired strongly around the onsets (or early in bursting) of primitives and some after termination. This is similar to some neurons from Berkowitz's intracellular data (Berkowitz, 2008) and to Stein's OFF and ON units (Stein, 2008).
The information-based techniques revealed several types of neural activity related to spinal modules or primitives. As noted, they related to onset, offset, transitions between primitives in a patterned sequence, and some more directly related to the activation and the drive to motor pools as subsequently captured by STA analysis. All related well to the decomposition of the motor pattern into primitives in broad information terms. However, we believe that the core reusable elements are likely to be the drive-related neurons, revealed by STA. We do not yet know how closely associated these and the other different neural elements are. It is conceivable that these different neurons might form tight modules with reusable activity of neurons in triggering, termination, and sequencing circuits. Alternatively, each type might be only loosely associated and be independently controlled and reused. Selection of neuron sets could then depend only on context and task. Only additional research can address this.
Spinal microstimulation maps and neural recordings
Our multielectrode recordings were made at a specific segmental location, providing a localized picture. We found overlapping component representations in this segmental location. At least three components, and usually more, were represented at each probe placement. Prima facie, this seems incompatible with strongly spatially segregated circuitry or simpler interpretations of microstimulation maps (see microstimulation of Bizzi et al., 1991; Tresch and Bizzi, 1999; Giszter et al., 2000a,b; Saltiel et al., 2001, 2005). How microstimulation low-threshold regions and “hotspots” relate to underlying circuit organization is an open question. We now know that microstimulation maps can be labile with experience (Boyce and Lemay, 2009) or as a result of contralateral interactions (Giszter et al., 2000a). It should be noted that the presence of a modular neural organization and of collections of circuits supporting primitives (as discussed here and by Kargo and Giszter, 2000a, 2008; Hart and Giszter, 2004; Kargo et al., 2009) is not wedded to any specific spatial map organization, and these concepts are quite separate, as discussed in some recent reviews (Giszter et al., 2007; Giszter, 2009). More details of the spatial topography of multiple-neuron activity will be important to address this in the future.
Pattern generation and primitive organization: spinal hierarchical organization
Our data are consistent with the modular schemes of Cappellini et al. (2006) and d'Avella et al. (2006) in man and with Krouchev et al. (2006) and McCrea and Rybak and their colleagues in the cat (Quevedo et al., 2005; McCrea and Rybak, 2007). They suppose that locomotor pattern generation comprises separated rhythm generation and pattern shaping with layered connections. This division of labor in organizing motion in spinal cord is also supported by our previous work in frog (Kargo and Giszter, 2000a,b, 2008; Hart and Giszter, 2004; Giszter et al., 2007) and by the results here. The neurons with STA facilitation effects here that may operate to construct motor drive would likely form elements in the pattern-shaping layers of Rybak and McCrea. The activity of these neurons would be deleted or suppressed in deletions of a primitive or recruited in a phase in which the primitive was expressed or added. This would be similar to the results of Stein and Daniels-McQueen (2002, 2003, 2004) for propriospinal interneurons in turtle and Lafreniere-Roula and McCrea (2005) in the cat. Our data could also relate to the ideas of Lundberg regarding modularity of group II interneuron systems in the cat spinal cord (Lundberg et al., 1987a,b) and to the developmental scaffolding of spinal neural circuits (Grillner and Jessel, 2009). Our data are consistent with the testable hypothesis that pattern shaping in reflex or spinal behaviors comprises primarily selection and graded recruitment of populations of neurons dedicated to individual primitives but shared across behaviors and that act as unitary conduits and/or initiators of modular drives.
Spinal interneurons and their associated premotor drives as compositional elements
Our data provide a first clear linkage between motor primitives and structured neural activity. As noted above, it has been speculated that motor primitives represent a successful evolutionary strategy for dealing with the “degrees of freedom problem,” by helping solve difficult but evolutionarily predictable motor tasks de novo. This strategy is also attractive because of its simplicity in adding and subsuming spinal controls in new behaviors. Pools of cells, available for activation of particular primitives by descending controls, could simplify problems of neural control for more rostral neural structures.
Conclusion
We have identified populations of interneurons recruited during the execution of spinal behaviors and intimately related to motor primitives and premotor drive. The pools of interneurons tested with spike-triggered averaging primarily corresponded to single components, drives, or primitives. Such modular premotor circuits will support well defined biomechanical effects in the limb. They could thus potentially act as compositional elements for voluntary motor behaviors, for pattern generators, and for reflex adjustments, and they could help to seed and organize early motor learning. In summary, our data support the notion that neurons dedicated to act as specific premotor drive conduits and circuits may comprise the low-level building blocks of many motor patterns and behaviors.
Footnotes
This work was supported by National Institutes of Health Grant NS40412 and National Science Foundation Grant IIS-0827684, with electrode development and testing supported by National Institutes of Health Grant NS44564. Nicholas AuYong, Dr. Michel Lemay, Dr. Adrienne Fairhall, Dr. Philip Sabes, Dr. Terence Sanger, and various members of the Neural Control of Movement Society contributed advice or pointed discussion regarding how best to relate neural and motor features and test ideas of neural modularity.
References
- Abbott LF. Where are the switches on this thing? In: van Hemmen JL, Sejnowski TJ, editors. Problems in Systems Neuroscience. Ed 23. Oxford: Oxford UP; 2006. pp. 423–431. [Google Scholar]
- Abeles M. Quantification, smoothing and confidence limits for single-units histograms. J Neurosci Methods. 1982;5:317–325. doi: 10.1016/0165-0270(82)90002-4. [DOI] [PubMed] [Google Scholar]
- Alaburda A, Russo R, MacAulay N, Hounsgaard J. Periodic high-conductance states in spinal neurons during scratch-like network activity in adult turtles. J Neurosci. 2005;25:6316–6321. doi: 10.1523/JNEUROSCI.0843-05.2005. [DOI] [PMC free article] [PubMed] [Google Scholar]
- Bateson PJ. The active role of behaviour in evolution. Biol Philos. 2004;19:283–298. [Google Scholar]
- Bell AJ, Sejnowski TJ. An information-maximization approach to blind separation and blind deconvolution. Neural Comput. 1995;7:1129–1159. doi: 10.1162/neco.1995.7.6.1129. [DOI] [PubMed] [Google Scholar]
- Berg RW, Alaburda A, Hounsgaard J. Balanced inhibition and excitation drive spike activity in spinal half-centers. Science. 2007;315:390–393. doi: 10.1126/science.1134960. [DOI] [PubMed] [Google Scholar]
- Berkowitz A. Broadly tuned spinal neurons for each form of fictive scratching in spinal turtles. J Neurophysiol. 2001;86:1017–1025. doi: 10.1152/jn.2001.86.2.1017. [DOI] [PubMed] [Google Scholar]
- Berkowitz A. Both shared and specialized spinal circuitry for scratching and swimming in turtles. J Comp Physiol A Neuroethol Sens Neural Behav Physiol. 2002;188:225–234. doi: 10.1007/s00359-002-0297-7. [DOI] [PubMed] [Google Scholar]
- Berkowitz A. Propriospinal projections to the ventral horn of the rostral and caudal hindlimb enlargement in turtles. Brain Res. 2004;1014:164–176. doi: 10.1016/j.brainres.2004.04.020. [DOI] [PubMed] [Google Scholar]
- Berkowitz A. Physiology and morphology indicate that individual spinal interneurons contribute to diverse limb movements. J Neurophysiol. 2005;94:4455–4470. doi: 10.1152/jn.00229.2005. [DOI] [PubMed] [Google Scholar]
- Berkowitz A. Spinal interneurons that are selectively activated during fictive flexion reflex. J Neurosci. 2007;27:4634–4641. doi: 10.1523/JNEUROSCI.5602-06.2007. [DOI] [PMC free article] [PubMed] [Google Scholar]
- Berkowitz A. Physiology and morphology of shared and specialized spinal interneurons for locomotion and scratching. J Neurophysiol. 2008;99:2887–2901. doi: 10.1152/jn.90235.2008. [DOI] [PubMed] [Google Scholar]
- Berkowitz A, Yosten GL, Ballard RM. Somato-dendritic morphology predicts physiology for neurons that contribute to several kinds of limb movements. J Neurophysiol. 2006;95:2821–2831. doi: 10.1152/jn.01246.2005. [DOI] [PubMed] [Google Scholar]
- Bernstein N. The co-ordination and regulation of movements. Oxford: Pergamon; 1967. [Google Scholar]
- Bizzi E, Mussa-Ivaldi FA, Giszter SF. Computations underlying the execution of movement: a biological perspective. Science. 1991;253:287–291. doi: 10.1126/science.1857964. [DOI] [PubMed] [Google Scholar]
- Bizzi E, Cheung VCK, d'Avella A, Saltiel P, Tresch MC. Combining modules for movement. Brain Res Rev. 2008;57:125–133. doi: 10.1016/j.brainresrev.2007.08.004. [DOI] [PMC free article] [PubMed] [Google Scholar]
- Botteron GW, Cheney PD. Corticomotoneuronal postspike effects in averages of unrectified EMG activity. J Neurophysiol. 1989;62:1127–1139. doi: 10.1152/jn.1989.62.5.1127. [DOI] [PubMed] [Google Scholar]
- Boyce VS, Lemay MA. Modularity of endpoint force patterns evoked using intraspinal microstimulation in treadmill trained and/or neurotrophin-treated chronic spinal cats. J Neurophysiol. 2009;101:1309–1320. doi: 10.1152/jn.00034.2008. [DOI] [PMC free article] [PubMed] [Google Scholar]
- Bracha V, Kolb FP, Irwin KB, Bloedel JR. Inactivation of interposed nuclei in the cat: classically conditioned withdrawal reflexes, voluntary limb movements and the action primitive hypothesis. Exp Brain Res. 1999;126:77–92. doi: 10.1007/s002210050718. [DOI] [PubMed] [Google Scholar]
- Bradley NS, Solanki D, Zhao D. Limb movements during embryonic development in the chick: evidence for a continuum in limb motor control antecedent to locomotion. J Neurophysiol. 2005;94:4401–4411. doi: 10.1152/jn.00804.2005. [DOI] [PubMed] [Google Scholar]
- Brown GD, Yamada S, Sejnowski TJ. Independent components analysis (ICA) at the neural cocktail party. Trends Neurosci. 2001;24:54–63. doi: 10.1016/s0166-2236(00)01683-0. [DOI] [PubMed] [Google Scholar]
- Burdet E, Milner TE. Quantization of human motions and learning of accurate movements. Biol Cybern. 1998;78:307–318. doi: 10.1007/s004220050435. [DOI] [PubMed] [Google Scholar]
- Callebaut W, Rasskin-Gutman D, editors. Modularity: understanding the development and evolution of natural complex systems. Cambridge, MA: MIT; 2005. [Google Scholar]
- Cappellini G, Ivanenko YP, Poppele RE, Lacquaniti F. Motor patterns in human walking and running. J Neurophysiol. 2006;95:3426–3437. doi: 10.1152/jn.00081.2006. [DOI] [PubMed] [Google Scholar]
- Chhabra M, Jacobs RA. Properties of synergies arising from a theory of optimal motor behavior. Neural Competition. 2006;18:2320–2342. doi: 10.1162/neco.2006.18.10.2320. [DOI] [PubMed] [Google Scholar]
- Cheney PD, Fetz EE. Comparable patterns of muscle facilitation evoked by individual corticomotoneuronal cells and by single intracortical microstimuli in primates. Evidence of function groups of CM cells. J Neurophysiol. 1985;53:786–804. doi: 10.1152/jn.1985.53.3.786. [DOI] [PubMed] [Google Scholar]
- d'Avella A, Bizzi E. Shared and specific muscle synergies in natural motor behaviors. Proc Natl Acad Sci USA. 2005;102:3076–3081. doi: 10.1073/pnas.0500199102. [DOI] [PMC free article] [PubMed] [Google Scholar]
- d'Avella A, Saltiel P, Bizzi E. Combinations of muscle synergies in the construction of a natural motor behavior. Nat Neurosci. 2003;6:300–308. doi: 10.1038/nn1010. [DOI] [PubMed] [Google Scholar]
- d'Avella A, Portone A, Fernandez L, Lacquaniti F. Control of fast-reaching by muscle synergy combinations. J Neurosci. 2006;26:7791–7810. doi: 10.1523/JNEUROSCI.0830-06.2006. [DOI] [PMC free article] [PubMed] [Google Scholar]
- Earhart GM, Stein PS. Scratch-swim hybrids in the spinal turtle: blending of rostral scratch and forward swim. J Neurophysiol. 2000a;83:156–165. doi: 10.1152/jn.2000.83.1.156. [DOI] [PubMed] [Google Scholar]
- Earhart GM, Stein PS. Step, swim and scratch motor patterns in the turtle. J Neurophysiol. 2000b;84:2181–2190. doi: 10.1152/jn.2000.84.5.2181. [DOI] [PubMed] [Google Scholar]
- Flash T, Hochner B. Motor primitives in vertebrates and invertebrates. Curr Opin Neurobiol. 2005;15:660–6666. doi: 10.1016/j.conb.2005.10.011. [DOI] [PubMed] [Google Scholar]
- Fortier PA. Use of spike-triggered averaging of muscle activity to quantify inputs to motoneuron pools. J Neurophysiol. 1994;72:248–265. doi: 10.1152/jn.1994.72.1.248. [DOI] [PubMed] [Google Scholar]
- Fukson OI, Berkinblit MB, Feldman AG. The spinal frog takes into account the scheme of its body during the wiping reflex. Science. 1980;209:1261–1263. doi: 10.1126/science.7403886. [DOI] [PubMed] [Google Scholar]
- Giszter SF. Motor primitives. In: Squire LR, editor. Encyclopedia of neuroscience. Vol 5. Oxford: Academic; 2009. pp. 1023–1040. [Google Scholar]
- Giszter SF, Kargo WJ. Conserved temporal dynamics and vector superposition of primitives in frog wiping reflexes during spontaneous extensor deletions. Neurocomputing. 2000;32–33:775–783. [Google Scholar]
- Giszter SF, McIntyre J, Bizzi E. Kinematic strategies and sensorimotor transformations in the wiping movements of frogs. J Neurophysiol. 1989;62:750–767. doi: 10.1152/jn.1989.62.3.750. [DOI] [PubMed] [Google Scholar]
- Giszter SF, Mussa-Ivaldi FA, Bizzi E. Convergent force fields organized in the frog spinal cord. J Neurosci. 1993;13:467–491. doi: 10.1523/JNEUROSCI.13-02-00467.1993. [DOI] [PMC free article] [PubMed] [Google Scholar]
- Giszter SF, Grill W, Lemay M, Mushahwar V, Prochazka A. Intraspinal microstimulation: techniques, perspectives and prospects for FES. In: Moxon KA, Chapin JK, editors. Neural prostheses for restoration of sensory and motor function. Boca Raton, FL: CRC; 2000a. pp. 101–138. [Google Scholar]
- Giszter SF, Loeb E, Mussa-Ivaldi FA, Bizzi E. Dense mapping of frog lumbar spinal cord: organization of force and muscle use. Human Movement Science. 2000b;19:597–626. [Google Scholar]
- Giszter S, Patil V, Hart CB. Primitives, premotor drives and pattern generation: a combined computational and neuroethological perspective. Prog Brain Res. 2007;165:323–346. doi: 10.1016/S0079-6123(06)65020-6. [DOI] [PubMed] [Google Scholar]
- Giszter SF, Hart CB, Silfies S. Spinal cord modularity: evolution, development, and optimization and the possible relevance to low back pain in man. Exp Brain Res. 2009 doi: 10.1007/s00221-009-2016-x. [DOI] [PMC free article] [PubMed] [Google Scholar]
- Gold C, Henze DA, Koch C, Buzsáki G. On the origin of the extracellular action potential waveform: a modeling study. J Neurophysiol. 2006;95:3113–3128. doi: 10.1152/jn.00979.2005. [DOI] [PubMed] [Google Scholar]
- Gottlieb GL. Muscle activation patterns during two types of voluntary single-joint movement. J Neurophysiol. 1998;80:1860–1867. doi: 10.1152/jn.1998.80.4.1860. [DOI] [PubMed] [Google Scholar]
- Grillner S. The motor infrastructure: from ion channels to neuronal networks. Nat Neurosci Rev. 2003;4:673–686. doi: 10.1038/nrn1137. [DOI] [PubMed] [Google Scholar]
- Grillner S, Jessell TM. Measured motion: searching for simplicity in spinal locomotor networks. Curr Opin Neurobiol. 2009;19:572–586. doi: 10.1016/j.conb.2009.10.011. [DOI] [PMC free article] [PubMed] [Google Scholar]
- Grillner S, Wallén P. Central pattern generators for locomotion, with special reference to vertebrates. Annu Rev Neurosci. 1985;8:233–261. doi: 10.1146/annurev.ne.08.030185.001313. [DOI] [PubMed] [Google Scholar]
- Hart CB, Giszter SF. Modular premotor drives and unit bursts as primitives for frog motor behaviors. J Neurosci. 2004;24:5269–5282. doi: 10.1523/JNEUROSCI.5626-03.2004. [DOI] [PMC free article] [PubMed] [Google Scholar]
- Ijspeert A, Nakanishi J, Schaal S. Learning attractor landscapes for learning motor primitives. In: Becker S, Thrun S, Obermayer K, editors. Advances in neural information processing systems 15. Cambridge, MA: MIT; 2003. pp. 1547–1554. [Google Scholar]
- Kargo WJ, Giszter SF. Rapid corrections of aimed movements by combination of force-field primitives. J Neurosci. 2000a;20:409–426. doi: 10.1523/JNEUROSCI.20-01-00409.2000. [DOI] [PMC free article] [PubMed] [Google Scholar]
- Kargo WJ, Giszter SF. Afferent roles in hindlimb wiping reflex: free limb kinematics and motor patterns. J Neurophysiol. 2000b;83:1480–1501. doi: 10.1152/jn.2000.83.3.1480. [DOI] [PubMed] [Google Scholar]
- Kargo WJ, Giszter SF. Individual premotor drive pulses, not time-varying synergies, are the units of adjustment for limb trajectories constructed in spinal cord. J Neurosci. 2008;28:2409–2425. doi: 10.1523/JNEUROSCI.3229-07.2008. [DOI] [PMC free article] [PubMed] [Google Scholar]
- Kargo WJ, Ramakrishnan A, Hart CB, Rome LC, Giszter SF. A simple experimentally-based model using proprioceptive regulation of motor primitives captures adjusted trajectory formation in spinal frogs. J Neurophysiol. 2009 doi: 10.1152/jn.01054.2007. Advance online publication. Retrieved Oct. 2009. doi: 0:01054.2007v1. [DOI] [PMC free article] [PubMed] [Google Scholar]
- Kiehn O, Hounsgard J, Sillar KT. Basic building blocks of vertebrate CPGs. In: Stein PSG, Grillner S, Selverston AI, Stuart DG, editors. Neurons, networks and motor behavior. Cambridge, MA: MIT; 1997. pp. 47–60. [Google Scholar]
- Krebs HI, Aisen ML, Volpe BT, Hogan N. Quantization of continuous arm movements in humans with brain injury. Proc Natl Acad Sci USA. 1999;96:4645–4649. doi: 10.1073/pnas.96.8.4645. [DOI] [PMC free article] [PubMed] [Google Scholar]
- Krouchev N, Kalaska JF, Drew T. Sequential activation of muscle synergies during locomotion in the intact cat as revealed by cluster analysis and direct decomposition. J Neurophysiol. 2006;96:1991–2010. doi: 10.1152/jn.00241.2006. [DOI] [PubMed] [Google Scholar]
- Kutch JJ, Suresh NL, Bloch AM, Rymer WZ. Analysis of the effects of firing rate and synchronization on spike-triggered averaging of multidirectional motor unit torque. J Comput Neurosci. 2007;22:347–361. doi: 10.1007/s10827-007-0023-0. [DOI] [PubMed] [Google Scholar]
- Kutch JJ, Kuo AD, Bloch AM, Rymer WZ. Endpoint force fluctuations reveal flexible rather than synergistic patterns of muscle cooperation. J Neurophysiol. 2008;100:2455–2471. doi: 10.1152/jn.90274.2008. [DOI] [PMC free article] [PubMed] [Google Scholar]
- Lafreniere-Roula M, McCrea DA. Deletions of rhythmic motoneuron activity during fictive locomotion and scratch provide clues to the organization of the mammalian central pattern generator. J Neurophysiol. 2005;94:1120–1132. doi: 10.1152/jn.00216.2005. [DOI] [PubMed] [Google Scholar]
- Lemay MA, Grill WM. Modularity of motor output evoked by intraspinal microstimulation in cats. J Neurophysiol. 2004;91:502–514. doi: 10.1152/jn.00235.2003. [DOI] [PubMed] [Google Scholar]
- Lemay MA, Galagan JE, Hogan N, Bizzi E. Modulation and vectorial summation of the spinalized frog's hindlimb end-point force produced by intraspinal electrical stimulation of the cord. IEEE Trans Neural Syst Rehabil Eng. 2001;9:12–23. doi: 10.1109/7333.918272. [DOI] [PubMed] [Google Scholar]
- Lundberg A, Malmgren K, Schomburg ED. Reflex pathways from group II muscle afferents. 2. Functional characteristics of reflex pathways to a-motoneurones. Exp Brain Res. 1987a;65:282–293. doi: 10.1007/BF00236300. [DOI] [PubMed] [Google Scholar]
- Lundberg A, Malmgren K, Schomburg ED. Reflex pathways from group II muscle afferents. 3. Secondary spindle afferents and the FRA: a new hypothesis. Exp Brain Res. 1987b;65:294–306. doi: 10.1007/BF00236301. [DOI] [PubMed] [Google Scholar]
- Marr D. San Francisco: Freeman; 1982. Vision. A computational investigation into the human representation and processing of visual information. [Google Scholar]
- McCrea DA, Rybak IA. Modeling the mammalian locomotor CPG: insights from mistakes and perturbations. Prog Brain Res. 2007;165:235–253. doi: 10.1016/S0079-6123(06)65015-2. [DOI] [PMC free article] [PubMed] [Google Scholar]
- Miller G. “Notes on the bias of information estimates” information theory in psychology II-B. Glencoe, IL: Free Press; 1955. pp. 95–100. [Google Scholar]
- Moddemeijer R. On estimation of entropy and mutual information of continuous distributions. Signal Processing. 1989;16:233–248. [Google Scholar]
- Moddemeijer R. Groningen, The Netherlands: University of Groningen, Department of Computing Science; 1997. The variance of the mutual information estimator, Computing Science Report: CS-R9701. [Google Scholar]
- Moddemeijer R. A statistic to estimate the variance of histogram-based mutual information estimator based on dependent pairs of observations. Signal Processing. 1999;75:51–63. [Google Scholar]
- Mowrey RA, MacKay IR. Phonological primitives: electromyographic speech error evidence. J Acoust Soc Am. 1990;88:1299–1312. doi: 10.1121/1.399706. [DOI] [PubMed] [Google Scholar]
- Mussa-Ivaldi FA. From basis functions to basis fields: Using vector primitives to capture vector patterns. Biol Cybern. 1992;67:479–489. doi: 10.1007/BF00198755. [DOI] [PubMed] [Google Scholar]
- Mussa-Ivaldi FA, Giszter SF, Bizzi E. Linear combination of primitives in vertebrate motor control. Proc Natl Acad Sci USA. 1994;91:7534–7538. doi: 10.1073/pnas.91.16.7534. [DOI] [PMC free article] [PubMed] [Google Scholar]
- Paninski L. Estimation of entropy and mutual information. Neural Comput. 2003;15:1191–1253. [Google Scholar]
- Quevedo J, Stecina K, Gosgnach S, McCrea DA. Stumbling corrective reaction during fictive locomotion in the cat. J Neurophysiol. 2005;94:2045–2052. doi: 10.1152/jn.00175.2005. [DOI] [PubMed] [Google Scholar]
- Rohrer B, Fasoli S, Krebs HI, Hughes R, Volpe B, Frontera WR, Stein J, Hogan N. Smoothness during stroke recovery. J Neurosci. 2002;22:8297–8304. doi: 10.1523/JNEUROSCI.22-18-08297.2002. [DOI] [PMC free article] [PubMed] [Google Scholar]
- Saltiel P, Wyler-Duda K, D'Avella A, Tresch MC, Bizzi E. Muscle synergies encoded within the spinal cord: evidence from focal intraspinal NMDA iontophoresis in the frog. J Neurophysiol. 2001;85:605–619. doi: 10.1152/jn.2001.85.2.605. [DOI] [PubMed] [Google Scholar]
- Saltiel P, Wyler-Duda K, d'Avella A, Ajemian RJ, Bizzi E. Localization and connectivity in spinal interneuronal networks: the adduction-caudal extension-flexion rhythm in the frog. J Neurophysiol. 2005;94:2120–2138. doi: 10.1152/jn.00117.2005. [DOI] [PubMed] [Google Scholar]
- Samara RF, Currie SN. Location of spinal cord pathways that control hindlimb movement amplitude and interlimb coordination during voluntary swimming in turtles. J Neurophysiol. 2008;99:1953–1968. doi: 10.1152/jn.01087.2007. [DOI] [PubMed] [Google Scholar]
- Samuels R. Massively modular minds: the evolutionary psychological account of cognitive architecture. In: Carruthers P, Chamberlain A, editors. Evolution and the human mind: modularity, language and meta-cognition. Cambridge, MA: Cambridge UP; 2000. [Google Scholar]
- Sanger TD. Optimal unsupervised motor learning for dimensionality reduction of nonlinear control systems. IEEE Trans Neural Netw. 1994;5:965–973. doi: 10.1109/72.329694. [DOI] [PubMed] [Google Scholar]
- Sanger TD. Human arm movements described by a low-dimensional superposition of principal components. J Neurosci. 2000;20:1066–1072. doi: 10.1523/JNEUROSCI.20-03-01066.2000. [DOI] [PMC free article] [PubMed] [Google Scholar]
- Schaal S, Schweighofer N. Computational motor control in humans and robots. Curr Opin Neurobiol. 2005;15:675–682. doi: 10.1016/j.conb.2005.10.009. [DOI] [PubMed] [Google Scholar]
- Schaette R, Gollisch T, Herz AVM. Spike-train variability of auditory neurons in vivo: dynamic responses. J Neurophysiol. 2005;93:3270–3281. doi: 10.1152/jn.00758.2004. [DOI] [PubMed] [Google Scholar]
- Schieber MH, Rivlis G. A spectrum from pure post-spike effects to synchrony effects in spike-triggered averages of electromyographic activity during skilled finger movements. J Neurophysiol. 2005;94:3325–3341. doi: 10.1152/jn.00007.2005. [DOI] [PubMed] [Google Scholar]
- Schlosser G, Wagner GP, editors. Modularity in development and evolution. Chicago: The University of Chicago; 2004. [Google Scholar]
- Schouenborg J. Modular organization and spinal somatosensory imprinting. Brain Res Rev. 2002;40:80–91. doi: 10.1016/s0165-0173(02)00191-1. [DOI] [PubMed] [Google Scholar]
- Shoham S, Fellows MR, Normann RA. Robust, automatic spike sorting using mixtures of multivariate t-distributions. J Neurosci Methods. 2003;127:111–122. doi: 10.1016/s0165-0270(03)00120-1. [DOI] [PubMed] [Google Scholar]
- Simpson JJ. Massachusetts Institute of Technology; 1973. On how a frog is not a cat. PhD thesis. [Google Scholar]
- Sosnik R, Hauptmann B, Karni A, Flash T. When practice leads to co-articulation: the evolution of geometrically defined movement primitives. Exp Brain Res. 2004;156:422–438. doi: 10.1007/s00221-003-1799-4. [DOI] [PubMed] [Google Scholar]
- Stein PS. Neuronal control of turtle hindlimb motor rhythms. J Comp Physiol A Neuroethol Sens Neural Behav Physiol. 2005;191:213–229. doi: 10.1007/s00359-004-0568-6. [DOI] [PubMed] [Google Scholar]
- Stein PS. Motor pattern deletions and modular organization of turtle spinal cord. Brain Res Rev. 2008;57:118–124. doi: 10.1016/j.brainresrev.2007.07.008. [DOI] [PMC free article] [PubMed] [Google Scholar]
- Stein PS, Daniels-McQueen S. Modular organization of turtle spinal interneurons during normal and deletion fictive rostral scratching. J Neurosci. 2002;22:6800–6809. doi: 10.1523/JNEUROSCI.22-15-06800.2002. [DOI] [PMC free article] [PubMed] [Google Scholar]
- Stein PS, Daniels-McQueen S. Timing of knee-related spinal neurons during fictive rostral scratching in the turtle. J Neurophysiol. 2003;90:3585–3593. doi: 10.1152/jn.00762.2003. [DOI] [PubMed] [Google Scholar]
- Stein PS, Daniels-McQueen S. Variations in motor patterns during fictive rostral scratching in the turtle: knee-related deletions. J Neurophysiol. 2004;91:2380–2384. doi: 10.1152/jn.01184.2003. [DOI] [PubMed] [Google Scholar]
- Ting LH, Macpherson JM. A limited set of muscle synergies for force control during a postural task. J Neurophysiol. 2005;93:609–613. doi: 10.1152/jn.00681.2004. [DOI] [PubMed] [Google Scholar]
- Todorov E. Optimality principles in sensorimotor control. Nat Neurosci. 2004;7:907–915. doi: 10.1038/nn1309. [DOI] [PMC free article] [PubMed] [Google Scholar]
- Todorov E, Ghahramani Z. Unsupervised learning of sensory-motor primitives. Proceedings of the 25th Annual International Conference of the IEEE Engineering in Medicine and Biology Society; Cancun, Mexico: IEEE; 2003. [Google Scholar]
- Todorov E, Jordan MI. Optimal feedback control as a theory of motor coordination. Nat Neurosci. 2002;5:1226–1235. doi: 10.1038/nn963. [DOI] [PubMed] [Google Scholar]
- Todorov E, Li W, Pan X. From task parameters to motor synergies: a hierarchical framework for approximately-optimal control of redundant manipulators. J Robot Syst. 2005;22:691–710. doi: 10.1002/rob.20093. [DOI] [PMC free article] [PubMed] [Google Scholar]
- Torres-Oviedo G, Macpherson JM, Ting LH. Muscle synergy organization is robust across a variety of postural perturbations. J Neurophysiol. 2006;96:1530–1546. doi: 10.1152/jn.00810.2005. [DOI] [PubMed] [Google Scholar]
- Tresch MC, Bizzi E. Responses to spinal microstimulation in the chronically spinalized rat and their relationship to spinal systems activated by low threshold cutaneous stimulation. Exp Brain Res. 1999;129:401–416. doi: 10.1007/s002210050908. [DOI] [PubMed] [Google Scholar]
- Tresch MC, Jarc A. The case for and against muscle synergies. Curr Opin Neurobiol. 2009;19:601–607. doi: 10.1016/j.conb.2009.09.002. [DOI] [PMC free article] [PubMed] [Google Scholar]
- Tresch MC, Cheung VC, d'Avella A. Matrix factorization algorithms for the identification of muscle synergies: evaluation on simulated and experimental data sets. J Neurophysiol. 2006;95:2199–2212. doi: 10.1152/jn.00222.2005. [DOI] [PubMed] [Google Scholar]
- Wagner GP, Altenberg L. Complex adaptations and the evolution of evolvability. Evolution. 1996;50:967–976. doi: 10.1111/j.1558-5646.1996.tb02339.x. [DOI] [PubMed] [Google Scholar]
- Wheeler BC. Automatic discrimination of single units. In: Nicolelis MAL, editor. Methods for neural ensemble recordings. New York: CRC; 1999. pp. 61–78. [Google Scholar]
- Zaal FT, Daigle K, Gottlieb GL, Thelen E. An unlearned principle for controlling natural movements. J Neurophysiol. 1999;82:255–259. doi: 10.1152/jn.1999.82.1.255. [DOI] [PubMed] [Google Scholar]