

Abstract
Although single-unit studies in monkeys have identified effector-related regions in the posterior parietal cortex (PPC) during saccade and reach planning, the degree of effector specificity of corresponding human regions, as established by recordings of the blood oxygen level-dependent signal, is still under debate. Here, we addressed this issue from a different perspective, by studying the neuronal synchronization of the human PPC during both reach and saccade planning. Using magnetoencephalography (MEG), we recorded ongoing brain activity while subjects performed randomly alternating trials of memory-guided reaches or saccades. Additionally, subjects performed a dissociation task requiring them to plan both a memory-guided saccade and reach to locations in opposing visual hemifields. We examined changes in spectral power of the MEG signal during a 1.5 s memory period in relation to target location (left/right) and effector type (eye/hand). The results show direction-selective synchronization in the 70–90 Hz gamma frequency band, originating from the medial aspect of the PPC, when planning a reaching movement. In contrast, activity in a more central portion of the PPC was synchronized in a lower gamma band (50–60 Hz) when planning the direction of a saccade. Both observations were corroborated in the dissociation task. In the lower frequency bands, we observed sustained alpha-band (8–12 Hz) desynchronization in occipitoparietal regions, but in an effector-unspecific manner. These results suggest that distinct modules in the posterior parietal cortex encode movement goals of different effectors by selective gamma-band activity, compatible with the functional organization of monkey PPC.
Introduction
The posterior parietal cortex (PPC) has been implicated in processing sensory information and planning goal-directed actions. Monkey single-unit experiments using delayed-response tasks (Hikosaka and Wurtz, 1983) have identified effector-specific working memory representations in separate regions in the PPC. More specifically, the lateral intraparietal area (LIP) retains increased firing rates during saccade planning (Colby et al., 1996; Mazzoni et al., 1996; Glimcher, 2003), whereas the parietal reach region (PRR) sustains activity during intended reaches (Snyder et al., 1997; Andersen and Buneo, 2002; Calton et al., 2002; Galletti et al., 2003).
In contrast, recent functional magnetic resonance imaging (fMRI) studies in humans have noted only limited effector-specificity in the PPC during intended saccades and reaches (Connolly et al., 2003; Medendorp et al., 2005; Beurze et al., 2007, 2009; Hagler et al., 2007; Levy et al., 2007). But since blood oxygen level-dependent (BOLD) imaging and single-unit recordings inform about different aspects of neural processes (Bartels et al., 2008; Logothetis, 2008), it is not clear whether human PPC is in fact organized differently than monkey PPC.
Electric field potentials, and the corresponding electric currents and magnetic fields, which represent the synchronized postsynaptic potentials of groups of neurons (Frost, 1967; Mitzdorf, 1985), allow for a closer assessment since they can be measured both invasively in monkeys and noninvasively in humans. In monkeys, areas LIP and PRR show direction-selective increases in spectral power of the field potentials in particular frequency ranges (LIP, 25–90 Hz; PRR, 20–50 Hz) when planning saccades and reaches, respectively (Pesaran et al., 2002; Scherberger et al., 2005).
In humans, a recent magnetoencephalography (MEG) study by Van Der Werf et al. (2008, 2009) showed synchronized activity (50–100 Hz) in a posterior parietal region during the planning of eye movements, consistent with the above findings in monkey LIP. In fact, their delayed prosaccade and antisaccade paradigm revealed the sustained power to be tuned to the planned saccade direction, not the memorized stimulus location, further resembling monkey LIP characteristics (Zhang and Barash, 2004). To our knowledge, however, spectral activity in relation to memory-guided reaches has not been demonstrated in human PPC.
Although human BOLD studies have shown little spatioanatomical differences between the areas involved in delayed reaches and saccades, a difference in the spectral fingerprint, which cannot be detected in BOLD, would still support the notion of effector-specific working memory representations in the PPC. Here, we tested this spectral dissociation hypothesis by recording MEG signals while subjects planned reaches or saccades to stimuli presented in either the left or right visual hemifield. To control for a potential effect of covertly planning the noninstructed movement, we also tested our subjects in a two-movement dissociation task, in which they planned and executed saccades and reaches simultaneously in opposite directions (Snyder et al., 1997).
Our results show direction-selective oscillatory activity in different gamma frequency bands during reach versus saccade planning. The source of the reach-related activity was identified more medially in the PPC than the saccade-related source, in homology to monkey PPC. In contrast, the lower frequency band (alpha, 8–12 Hz) showed effector-unspecific desynchronization in posterior areas, consistent with a mechanism for active functional inhibition.
Materials and Methods
Participants.
Sixteen healthy subjects [2 females, 14 males; mean age, 28 years (SD, 4)], free of any known sensory, perceptual, or motor disorders, volunteered to participate in the experiment. All subjects provided written informed consent according to institutional guidelines of the local ethics committee (Commissie Mensgebonden Onderzoek Committee on Research Involving Human Subjects, Region Arnhem-Nijmegen, The Netherlands). Each subject practiced all tasks extensively before data acquisition to ensure that the tasks were performed correctly.
MEG recordings.
Subjects were seated upright in the MEG system that was placed in a magnetically shielded room. They were instructed to sit comfortably but still and to look at the stimulus screen, located ∼40 cm in front of them. Visual stimuli, generated with Presentation 9.10 software (Neurobehavioral Systems), were presented using a liquid crystal display video projector (60 Hz refresh rate) and backprojected onto the screen using two front-silvered mirrors. MEG data were recorded continuously using a whole-head system with 275 axial gradiometers (Omega 2000; CTF Systems). Head position with respect to the sensor array was measured using localization coils fixed at anatomical landmarks (the nasion and at the left and right ear canal). These measurements were made continuously during the MEG recordings to assess head movements during the experiment. In addition, horizontal and vertical electro-oculograms (EOGs) were recorded using electrodes placed below and above the left eye and at the bilateral outer canthi. Reaching movements were made with the right hand, by means of wrist rotations such that the index finger pointed in the direction of the remembered stimulus. The hand was held a few centimeters ipsilateral to the body midline; the rest of the arm was fixated comfortably by vacuum cushions and Velcro straps. The subject's view of the hand was occluded with black cardboard. To assess onsets and offsets of the pointing movements, the electromyogram (EMG) was recorded by using two electrodes placed along the extensor digitorum muscle of the forearm. Impedance of all electrodes was kept <5 kΩ. During the experiment, eye and arm recordings were continuously inspected to ensure the subject was vigilant and performed the task correctly. MEG, EMG, and EOG signals were low-pass filtered at 300 Hz, sampled at 1200 Hz, and then saved to disk.
For each subject, a full-brain anatomical magnetic resonance image (MRI) was acquired using a standard inversion prepared three-dimensional T1-weighted scan sequence (flip angle, 15°; voxel size, 1.0 mm in-plane; 256 × 256; 164 slices; repetition time, 0.76 s; echo time, 5.3 ms). The anatomical MRIs were recorded using a 1.5 T whole-body scanner (Siemens), with anatomical reference markers at the same locations as the head position coils during the MEG recordings (see above). The reference markers allow alignment of the MEG and MRI coordinate systems, such that the MEG data can be related to the anatomical structures within the brain.
Experimental tasks.
Subjects performed three different tasks: the delayed-reaching task, the delayed-saccade task, and the dissociation task. In the first phase of the experiment, subjects performed delayed-reach or delayed-saccade trials in an intermingled manner. In the second phase, subject performed a series of delayed-dissociation trials, simultaneously planning and making a reach to one target and a saccade to the other.
Each trial began with the subject fixating their gaze and pointing their right index finger to a central white cross, presented on the screen (Fig. 1). After a baseline period of 1 s, two peripheral stimuli were flashed simultaneously for 100 ms, on opposite sides of the fixation cross, at a random eccentricity between 5 and 15°. The color of these stimuli (red, green, or gray) signaled the task instruction; red and green stimuli instructed the responding effector, the gray stimulus was a noninformative cue and served to balance visual input across hemifields over all three tasks. The color instructions of the effector cues were counterbalanced over subjects. After a delay of 1.5 s, during which the subject prepared the appropriate movement (or movements), the fixation cross changed to a small white dot, instructing the subjects to make the reach and/or the saccade to the remembered location(s), and return immediately back to center. In the delayed-reach and delayed-saccade trials, the noninstructed effector maintained directed centrally, assisted by the small central dot visible after the movement instruction was given. In the dissociation trials, subjects had to respond with a simultaneous reach and saccade in opposite directions. Then, 0.6 s later, the fixation cross was turned on again until the end of the trial, and subjects were allowed to blink their eyes, if necessary.
Figure 1.
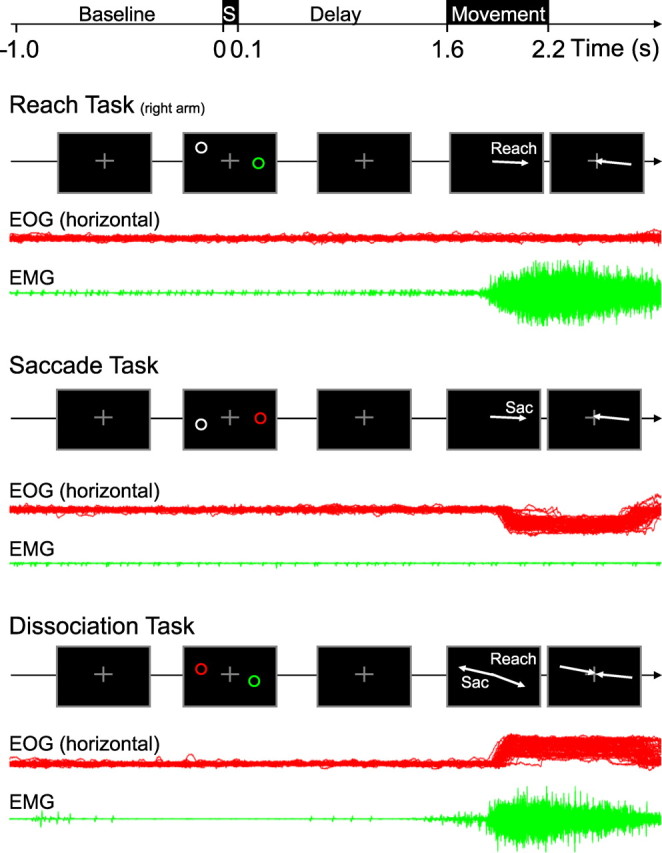
Experimental design. Sequence of stimuli and subject instructions during all three task conditions: delayed-reach task, delayed-saccade task, and dissociation task. All trials began with fixating and pointing to a central cross for a 1 s period. Next, two stimuli were presented for 100 ms on opposite sides of the fixation point. The red/green stimulus instructed the type of movement to prepare to that location; the gray stimulus was a noninformative cue and served to balance visual input across the tasks. After an additional delay of 1.5 s, the central cross disappeared, instructing the subject to perform the movement(s). In the dissociation task, this was a simultaneous reach and saccade in opposite directions. In reach and saccade tasks, the noninstructed effector kept the initial central position during the movement. Corresponding eye position traces (horizontal EOG) and hand movement EMG of a typical subject are shown in red and green, respectively, for each task condition.
The delayed-reach and delayed-saccade trials were randomly interleaved in blocks of 60 trials, between which a brief rest was provided. A total of 10 of these blocks resulted in 300 trials in each task, comprising 150 leftward and 150 rightward movements. Subjects also performed 300 dissociation trials, tested in five blocks, consisting of 150 trials with a leftward reach and rightward saccade and 150 trials with a rightward reach and a leftward saccade.
Behavioral analysis.
EOG and EMG were recorded in all subjects. Figure 1 shows the EOG (horizontal component) and EMG traces of a typical subject during 80 correctly performed trials of the reach-right, saccade-right, and reach-right/saccade-left conditions, respectively, in relation to the temporal order of events. As shown, this subject maintained fixation during the baseline period, the presentation of the stimulus, and the memory interval, and made eye and/or reaching movements after the fixation spot was turned off. The EOG and EMG recordings and on-line infrared camera observation in all 16 subjects confirmed that they followed the instructions correctly in most trials. Trials in which subjects broke (ocular or manual) fixation, made saccades or reaches in the wrong direction, or blinked the eyes during the trial, were excluded from additional analysis. On average, 687 ± 122 (SD) trials were incorporated in the analysis of each participant (reach, 229 ± 36 trials; saccade, 234 ± 37; dissociation, 219 ± 54). There was no significant difference in the number of rejected trials among the three task conditions (one-way ANOVA, F(2,30) = 0.5; p = 0.6), confirming that the three tasks were performed equally well. Mean reaction times (RTs) were 281 ± 64 ms for reach trials, 231 ± 46 ms for saccades, and 203 ± 36 ms for dissociation trials. These RTs differed significantly between the response types (one-way ANOVA, F(2,30) = 9.03; p < 0.05). Post hoc t tests between each pair of trial types confirmed that reach trial RTs were slower than both saccade trials (Snyder et al., 1997; Beurze et al., 2009) and dissociation trials.
MEG data analysis.
Data were analyzed using Fieldtrip software (http://www.ru.nl/neuroimaging/fieldtrip), an open source MatLab toolbox for neurophysiological data analysis developed at the Donders Institute for Brain, Cognition and Behavior. From the trials that survived the exclusion criteria described above, data segments that were contaminated with muscle activity or jump artifacts in the superconducting quantum interference devices (or SQUIDS) were excluded using semiautomatic artifact rejection routines.
For the sensor level analysis, an estimate of the planar gradient was calculated for each sensor using the signals from the neighboring sensors (Bastiaansen and Knösche, 2000). The horizontal and vertical components of the planar gradients approximate the signal measured by MEG systems with planar gradiometers. The planar field gradient simplifies the interpretation of the sensor-level data since the maximal signal is located above the source (Hamalainen et al., 1993). Power spectra were computed separately for the horizontal and vertical planar gradients of the MEG field at each sensor location and the sum of both was computed to obtain the power at each sensor location regardless of the orientation of the gradient.
Time–frequency representations (TFRs), estimating the time course in power, were computed using a Fourier approach, applying a sliding tapered window, with neighboring time points temporally segregated by 0.05 s. Because the gamma band is typically much wider and therefore better characterized with more spectral concentration (Hoogenboom et al., 2006), we analyzed two frequency ranges separately: 5–30 and 30–100 Hz. For the lower frequency band (5–30 Hz), we used sliding windows of 0.5 s and a Hanning taper. This resulted in a spectral smoothing of ∼2 Hz. For the higher frequency band (30–100 Hz), we applied a multitaper approach (Percival and Walden, 1993) using a sliding window of 0.4 s and 11 orthogonal Slepian tapers. This resulted in a spectral smoothing of ∼14 Hz.
We defined the time interval of the sensory response from 0.1 to 0.5 s after stimulus onset, with the given boundaries being the center times of the sliding time window. The delay period was defined from 0.5 to 1.6 s after the presentation of the stimulus and excludes the initial sensory response. Contamination of the motor response in this interval is also supposed to minimal, given the movement latencies >200 ms (see above).
We examined the task-related changes in power in various frequency bands relative to average power in the baseline periods (Fig. 1). The baseline power was computed over a 0.4 s (higher frequencies) or 0.5 s (lower frequencies) time window centered 0.3 s before the presentation of the stimulus. Using a jackknife procedure (Efron and Tibshirani, 1993), we determined the variance of the log power in the selected frequency bands across trials. Using these estimates, we expressed the difference in log power between the memory period and the baseline as a t score for each subject and for each condition. The resulting t scores were transformed into z scores (Medendorp et al., 2007) to obtain a normalized estimate of power difference. Using the same z score metric, direction selectivity of power in the various frequency bands was examined by comparing the power in each sensor for stimuli in the contralateral and ipsilateral hemifield. The resulting z scores, which are well normalized for intrasubject variance, were pooled across subjects (zgroup = 1/√N Σzi, with zi being the z score of the ith subject).
Statistical significance was tested at the sensor level by using a nonparametric clustering procedure (Nichols and Holmes, 2002; Maris and Oostenveld, 2007). In this procedure, the cluster-level test statistic is defined by pooling the z scores of neighboring sensors showing the same effect (pooled z scores >1.96) in a given time–frequency window of interest. In a nonparametric statistical test, the type I error rate for the complete set of 275 sensors was controlled by evaluating the cluster-level test statistic under the randomization null distribution of the maximum cluster-level test statistic. This was obtained by randomly permuting the data between two conditions (i.e., the reach-left vs the reach-right condition) within every participant. By creating a reference distribution from 1000 random sets of permutations, the p value was estimated as the proportion of the elements in the randomization null distribution exceeding the observed maximum cluster-level test statistic. Statistical significance at the frequency level, to examine the spectral dissociation hypothesis, was tested in a similar manner: clustering was applied by pooling together neighboring frequencies showing the same effect.
To localize the neural sources of the different spectral components, we applied an adaptive spatial filtering or beamforming technique (dynamic imaging of coherent sources) (Gross et al., 2001; Liljeström et al., 2005). First, we divided a template brain volume [International Consortium for Brain Mapping template; Montreal Neurological Institute (MNI), Montreal, Quebec, Canada] into a regular 1 cm three-dimensional grid. We then warped every subject's MRI to fit this template MRI and the template's grid. We then warped the grid back to fit every subject's original MRI to obtain a grid in MNI coordinates for every subject. This procedure allowed us to directly compare grid points across subjects in MNI space without the need to normalize. For each subject and for each grid point, a spatial filter was constructed that passes activity from this location with unit gain, while attenuating activity from other locations (Gross et al., 2001). This filter was computed from forward models with respect to dipolar sources at each grid point (the lead field matrix) and the cross-spectral density between all combinations of sensors at the frequency of interest. We used realistic single-sphere head models from every subject's individual MRI to calculate the lead field matrix (Nolte, 2003). For every single subject, the source power was estimated per condition and expressed as z scores relative to the same baseline interval that was used for the sensor-level analysis. These z scores were then used for additional analysis. To overcome the problem of spatial leakage in a delay versus baseline contrast (see Fig. 2B, middle panel), caused by a strong dominant source, we applied a two-dipole beamformer, with one dipole fixed at the grid location with the maximum activity in an average over subjects (MNI coordinates: −20, 0, 60 mm), while the other dipole scanned all grid points (for details, see Schoffelen et al., 2008).
Figure 2.

A frontoparietal network shows increased power in the 70–90 Hz gamma band during reach planning and execution. A, Topographic representations of the gamma-band power during all three stages of the delayed-reach task (stimulus encoding, 0.1–0.5 s; delay period, 0.5–1.6 s; execution phase, 1.6–1.8 s). The color format is as follows: warmer (red) colors, power increase relative to baseline; cooler (blue) colors, power decrease. Sensors showing a significant change relative to baseline are marked. B, Reconstruction of the gamma-band sources. Because of spectral leakage caused by a strong frontal source (MNI coordinates: −20, 0, 60 mm), the reconstruction of the delay period was done in two steps: first by means of a conventional beamformer (represented by z scores well above 2.5, masked at z < 8) and second by means of a beamformer that suppressed the strong left-frontal source (Schoffelen et al., 2008) (represented by z < 2.5, masked at z < 1). Results of both analyses are plotted onto the same standard brain surface. Both the stimulus and execution period are standard one-dipole beamformers, masked at z < 5 and z < 20, respectively. CS, Central sulcus; preCS, precentral sulcus; IPS, intraparietal sulcus; PO, parieto-occipital sulcus.
To assess the spatial difference between directional selective reach and saccade sources in posterior parietal cortex, we applied a nonparametric clustering algorithm, similarly as described above. In this case, neighboring voxels showing a similar effect in space and time were clustered and tested against a reference distribution from 1000 random sets of permutations. We constrained source space in parietal cortex based on previous observations. That is, clusters were grown in predefined regions of interest (ROIs) of the PPC, shown to possess a contralateral, topographic organization of target location for saccade and reaches (referred to as IPS0/V7, IPS1, and IPS2) (Schluppeck et al., 2005; Hagler et al., 2007; Levy et al., 2007). We defined partly overlapping ROIs as spheres with a diameter of 5 cm, centered at MNI-converted Talairach coordinates [MNI coordinates (in millimeters); IPS0: −25, −84, 25; IPS1: −21, −80, 41; IPS2: −18, −76, 53], as reported by Schluppeck et al. (2005).
Results
Reach-related gamma-band activity
We first describe the modulations of power in the higher frequency bands during the delayed-reaching task, regardless of the direction of the reaching movement. Figure 2A depicts the scalp topography (left panel) during the three different stages of a trial of the 70–90 Hz gamma band, which is the frequency band that showed the highest power increases relative to baseline. These three stages dissect the sensory response (time, 0.1–0.5 s, left panel) and motor execution activity (time, 1.6–1.8 s, right panel) from the delay-activity encoding the working memory of the reach (time, 0.5–1.6 s, middle panel). Sensors showing a significant effect are marked (p < 0.05). Figure 2B shows the associated source reconstructions of the three stages, represented on a normalized cortical surface. Both the sensor and the source data are expressed as z scores pooled across subjects. Regions with warmer (red) colors indicate a power increase relative to baseline; regions with cooler (blue) color reflect a power decrease. As shown, there are power increases during all three phases of the trial, at both parietal and frontal sensors. After stimuli presentation (left panel), there are clear bilateral responses in occipital, parietal, and frontal regions. During the delay interval, the frontal and parietal areas show sustained activation, with the frontal activation arising in the precentral sulcus (preCS) and the parietal activation originating from the parieto-occipital sulcus (PO) and the medial aspect of the PPC. During this period, the activity is mostly biased to the left hemisphere, which is consistent with preparing a movement of the (contralateral) right hand. During execution (right panel), the sensor-level data shows increased gamma-band power in all regions compared with the delay period, more so in the left than right hemisphere. Source reconstruction maps the maximum movement-related activity to the central sulcus (CS); the strength of this source has compromised the reconstruction of the sources in more posterior areas.
We next focused our analysis on those regions that showed a preference for remembered reach goals in either the contralateral or ipsilateral visual hemifield. We performed this analysis separately for each hemisphere. For sensors over the left hemisphere, we subtracted activity for a goal in the left visual field from the activity for a goal in the right visual field, and vice versa for sensors overlying the right hemisphere. Figure 3 shows the topographic distribution of the direction-selective power in the 70–90 Hz gamma band for the three different stages of the reach trial, in the same format as Figure 2A, coding regions with contralateral goal selectivity in warmer (red) colors and those with ipsilateral tuning in cooler (blue) colors. This analysis revealed a left posterior cluster of sensors, the power of which has a statistically significant (p < 0.05; left hemisphere marked sensors are significant) preference for contralateral reach goals during the retention period (0.5–1.6 s). Thus, of the sensors that showed significant 70–90 Hz spectral power increases during the planning and execution of pointing movements (Fig. 2), only one cluster located posterior in the left hemisphere, showed significant selectivity for the direction of the reach. In other words, a posterior region in the left hemisphere represents the direction of reaching movement in a 70–90 Hz gamma frequency band. It is noteworthy that this region was lateralized to the left hemisphere, which is the hemisphere contralateral to the reaching hand. In this respect, we cannot exclude that some direction-specific results, for example, those in the right hemisphere, were masked by interactions between direction selectivity and the effector hand used (Vesia et al., 2006; Beurze et al., 2007; Chang et al., 2008). To further address the hemispheric differences, the bar plots in Figure 3 show the average response of the marked parietal sensor groups to contralateral and ipsilateral goals in isolation. They confirm the clear contralateral bias for the left parietal sensors and demonstrate equal activation, thus lack of laterality, for the right parietal sensors, across all stages of the trial.
Figure 3.

A cluster of sensors overlying the left hemisphere shows direction-selective gamma-band activity (70–90 Hz) during the three different stages of the reach trials. The color format is as follows: warmer (red) colors, preference for stimuli in the contralateral hemifield; cooler (blue) color, bias toward ipsilateral stimuli. Sensors marked in the left hemisphere show significant effects in all stages (clustering and randomization approach) (see Materials and Methods). The bar graphs at either side of the topographic plots demonstrate the activation in relation to contralateral (C) and ipsilateral (I) reach goals, separately for the marked clusters in both hemispheres. The cluster of sensors overlying the right hemisphere was taken mirror-symmetric to that overlying the left hemisphere.
Before concluding that this left posterior cluster is selectively involved in planning and executing reaching movements, we first have to examine its response during the delayed-saccade and the dissociation task. In a previous study on delayed saccades, we showed that goals for saccades are maintained in virtually the same frequency range as the current reach goals (Van Der Werf et al., 2008). Because the subjects in this study also performed delayed-saccade trials (while maintaining central pointing with the right hand), we could directly compare gamma-band selectivity during these movements under similar task constraints. As an additional control, we used the two-movement dissociation task, during which subjects planned (and made) eye and reach movements simultaneously in opposite directions (Snyder et al., 1997). This task is intended to further test whether the direction-selective activity in the posterior region relates to the reach or saccade direction, or rather vanishes because of balancing spatial attention over both visual hemifields.
The right-hand panels of Figure 4A–C represent the topographic distributions of the direction-selective power in the 70–90 Hz band during the delay period of all three tasks (thus, the right-hand panel of Fig. 4A replicates the middle panel of Fig. 3). The topographic distribution in Figure 4B shows that the power increases that characterized the reach-only condition were absent during the delayed-saccade task.
Figure 4.
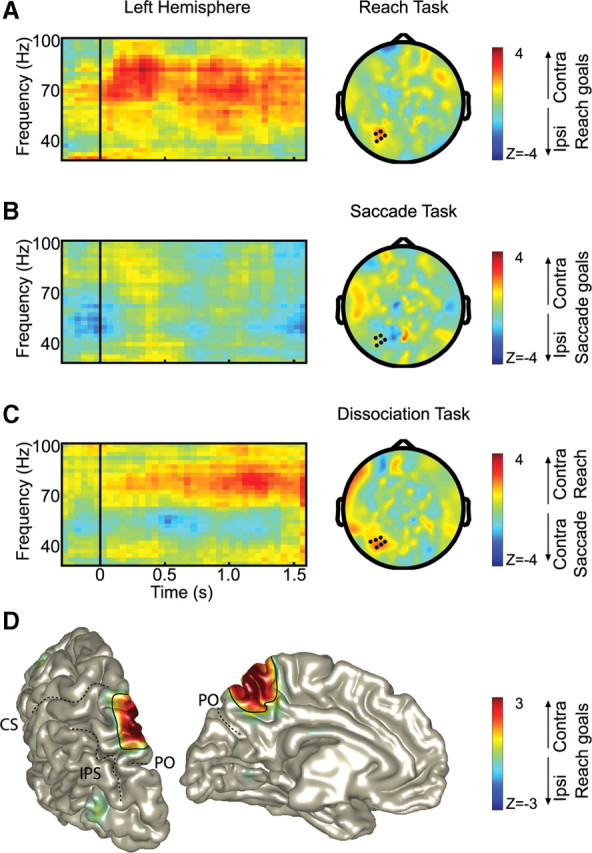
Direction-selective gamma-band synchronization during the three task conditions. A–C, Time–frequency resolved changes (left) of the direction-selective power of the sensors marked in the 70–90 Hz scalp topography (right) during the delay period (0.5–1.6 s). Only significant sensors are marked (p < 0.05, cluster randomization statistics). Time, t = 0, the time of stimulus presentation; t = 1.6, the time of the movement(s). Power is color-coded. In A, the topography plot replicates Figure 3, middle panel. D, Source of the reach gamma-band activity (80 ± 14 Hz) during the delay period of reach task, thresholded at z > 1, in the left hemisphere. The color format is as in A. PO, Parieto-occipital sulcus; CS, central sulcus; IPS, intraparietal sulcus.
The results of the dissociation task are plotted in Figure 4C, with warmer (red) colors indicating a bias toward contralateral reach goals (or ipsilateral saccade goals) and cooler colors representing a preference for contralateral saccade goals (or ipsilateral reach goals). The dissociation task reveals a cluster of sensors with a significant preference for contralateral reach goals (p < 0.05; sensors are marked). Most notably, this cluster is almost identical with the cluster that shows the significant effects in the delayed-reaching task.
The left-hand panels in Figure 4A–C show the temporal evolution of the direction selectivity of the power in the higher frequency band (30–100 Hz) pooled across the selected posterior sensors overlying the left hemisphere, and averaged across subjects, during the three movement tasks. Stimuli are presented at t = 0 s, and the movement cue is given at t = 1.6 s. The spectrogram of power during the delayed-reach task (Fig. 4A) shows contralateral goal selectivity (color-coded in red) in the 50–90 Hz range, most prominently at ∼70–90 Hz. The contralateral goal selectivity arises fairly soon after presentation of the stimuli and was sustained across the entire delay period. Interestingly, the delayed-saccade tasks demonstrated no such clear power modulations in this frequency range, as shown by Figure 4B. Thus, the region shows a stronger synchronization for reaching than for saccades, which characterizes it as a reach-specific region.
Figure 4C presents the spectrogram of the significant set of sensors during the dissociation task, using the same color format as in the topographic distributions, showing the power differences between trials in which subjects reached right and saccaded left versus trials in which subjects reached left and saccaded right. As the spectrogram shows, there is a significant 70–90 Hz gamma band biased toward contralateral reach goals, emerging ∼0.4 s after stimulus presentation, and increasing in strength toward the response. Together, the results in Figure 4 confirm the hypothesis that the oscillatory activity in 70–90 Hz gamma band observed at these posterior sensors is involved in coding reach goals, and is not a product of generic spatial attention or (covert) saccade planning.
We used adaptive spatial filtering techniques (beamforming) (see Materials and Methods) to estimate the source underlying the gamma-band activity during reach planning as found at the posterior sensors overlying the left hemisphere. Figure 4D shows the source of activity during the delay period (0.6–1.6 s) at the 80 Hz (±14 Hz smoothing) gamma band on a rendered representation of a standardized left hemisphere. The peak of this activity was found in the medial side of the posterior parietal cortex, analogous to observations made in the nonhuman primate (Snyder et al., 1997).
Saccade-related gamma-band activity
From recent studies, it is known that parietal neurons also synchronize their activity in the gamma frequency range when coding pending saccades, in both monkeys (Pesaran et al., 2002) and humans (Van Der Werf et al., 2008, 2009). In this regard, close scrutiny of the spectrograms in Figure 4B, and especially that in Figure 4C, seems to indicate a slight bias in oscillatory power at the 50–60 Hz gamma band for contralateral saccades, although this effect failed to reach significance. To increase the statistical power of our analysis of the saccade-related oscillations, we therefore examined the saccade effects using a combined evaluation across all three trial types: delayed-reaching, delayed-saccade, and dissociation trials. More specifically, we assumed that the contralateral-selective power in the dissociation task, referred to as DD, is composed of both a reaching (DR = RC − RI) and a saccade contribution (DS = SC − SI), in which C and I refer to contralateral and ipsilateral directions, respectively, and R and S refer to the reach and saccade components. From this follows that DD = (RC + SI) − (RI + SC) = (RC − RI) − (SC − SI) = DR − DS. Hence, by subtracting DD from the lateralized power during the delayed-reaching task (DR), we isolate the saccade contribution (DS). Pooling this isolated saccade contribution and the lateralized power observed during the single delayed-saccade task enhances the signal-to-noise ratio of the overall saccade-related power (i.e., DStot = DS + DR − DD). For completeness, we followed the same procedure to decompose also the overall reach component (DRtot = DR + DD + DS) from the complete data set.
Figure 5 presents the results of this decomposition analysis. Figure 5A depicts the isolated saccade-related power component, whereas Figure 5B shows the reach-related effect. Warmer colors indicate a preference for contralateral goals, whereas cooler colors correspond to a bias for ipsilateral goals. For saccades, the scalp topography during the delay period (0.5–1.6 s) demonstrates contralateral-selective elevated power in the 50–60 Hz gamma band in nearly symmetrical posterior regions in the two hemispheres with the most notable power increase in the right posterior region (Fig. 5A, middle panel). A clustering and randomization algorithm (see Materials and Methods) over the pooled hemispheres shows these symmetrical clusters of posterior sensors to be significant (p < 0.05). The left- and right-hand panels of Figure 5A illustrate the time–frequency representations of the power in either region. Based on the symmetry of these panels, these spectrograms were pooled across hemispheres, resulting in the combined hemifield-specific changes in power for saccades with respect to contralateral versus ipsilateral goals. The pooled spectrogram revealed a narrow band of sustained gamma activity (50–60 Hz) during the delay period (Fig. 5A, bottom panel). Source reconstruction estimated a region in the posterior part of the intraparietal sulcus as the source of this 50–60 Hz saccade-related gamma-band activity (Fig. 5A, bottom panel).
Figure 5.

Decomposition of gamma-band activity in reach and saccade components. A, Saccade component. Top panels, Directional selectivity of time–frequency resolved gamma-band power of the saccade component, for the sensors marked in the central panel. Power is color-coded, in terms of contralateral and ipsilateral selectivity. Central panel, Topographic distribution shows direction-selective power during the delay period (0.5–1.6 s), in the 50–60 Hz frequency band. Bottom panel, Direction selectivity of the saccade component in the higher frequency bands, pooled across hemispheres. Right, Source reconstruction of saccade component (50 ± 14 Hz) pooled across hemispheres, thresholded at z > 1, and shown on a standard left hemisphere. The color format is as in A. B, Reach component, in the same format as A. Topographic distribution shows direction-selective power during the delay period (0.5–1.6 s), in the 70–90 Hz frequency band.
The panels of Figure 5B demonstrate the isolated reach component. Consistent with the results in Figures 3 and 4, the scalp topography (middle panel) of the power in the 70–90 Hz gamma band revealed a region in the left hemisphere, coding for contralateral reach goals. Corresponding TFRs of the sensors marking this region, and a symmetrical set of sensors in the right hemisphere, confirm that the effect is only strong and sustained in the left posterior hemisphere. Importantly, neither hemisphere shows any sustained power changes at lower gamma frequencies, which indicates a spectral dissociation between reach planning and saccade planning in posterior brain regions. To confirm this statistically, Figure 6 illustrates a power contrast over the entire delay interval of the significant reach and saccade sensors (as marked in Fig. 5A,B), with negative z values representing specificity for saccade goals, and positive z values representing specificity for reach goals. Significant specificity (p < 0.05, indicated by the darker gray zone) bears out in the 50–57.5 Hz frequency range for saccades and at the 72.5–87.5 Hz range for reaches.
Figure 6.

Spectral dissociation between reach and saccade planning. Spectral power was averaged over time (0.1–1.6 s) and significant sensors (indicated in Fig. 5). The reach and saccade component were contrasted and statistically tested (cluster-randomization approach, p < 0.05). Positive z values represent specificity for contralateral reach goals; negative values represent specificity for contralateral saccade goals. The light-gray bands indicate SEM. The dark-gray zones indicate frequencies showing significant effector specificity.
Finally, to determine whether the effector-specific spectral dissociation also has an anatomical basis, we directly compared the observed “reach” source reconstruction in Figure 4D with the “saccade” source reconstruction in Figure 5A, using a nonparametric clustering algorithm constrained to predefined parietal ROIs (Schluppeck et al., 2005) and semioverlapping time windows (for more details, see Materials and Methods). Figure 7 shows the results of this analysis. Red voxels have significantly positive t values in the ROI centered at IPS2 (p < 0.05) and have a bias for contralateral reach goals. In contrast, blue voxels represent a significant preference for contralateral saccade goals over reach goals in the ROI centered at IPS0/V7 (significantly negative t values, p < 0.05). Area IPS1 shows no clear preference for either effector. This analysis confirms that the spectral dissociation for reaches and saccades arises from different posterior parietal areas.
Figure 7.

Effector specificity of gamma-band power in space and time. Positive t values represent specificity for contralateral reach goals; negative values represent specificity for contralateral saccade goals. CS, Central sulcus; IPS, intraparietal sulcus; PO, parieto-occipital sulcus.
Effector-unspecific desynchronization in the alpha band
We also investigated the direction selectivity of the activation in the lower frequency band (5–30 Hz) during the delayed-reaching and delayed-saccade task. Figure 8 presents the results of this analysis, expressed as z scores pooled over subjects, for both tasks (Fig. 8A, reaches; B, saccades). The color code represents the difference in power for contralateral versus ipsilateral movement goals. The middle panels, showing the topographic distribution of alpha-band power (8–12 Hz) during the delay interval (0.5–1.6 s), indicate contralateral suppression effects in posterior areas during both tasks. In the reach task, these effects are significant in both hemispheres (p < 0.05); the saccade task yielded the significant effects only in the right hemisphere (p < 0.05). The spectrograms of the marked sensors overlying the left and right hemisphere further illustrate that the power in the alpha band behaves rather similar during the two tasks. Thus, in contrast to the gamma band results, the alpha band appears not to process the goal information in an effector-selective manner. The pooled spectrograms, plotted in the bottom panels of Figure 8, A and B, show that the alpha-band desynchronization arises at ∼0.5 s after stimuli presentation. It is also important to note that we did not observe any significant alpha-band lateralization during the dissociation tasks (data not shown). Finally, the pooled spectrograms also demonstrate significant contralateral transient enhancements of activity in the theta range (at ∼6 Hz) and beta range (12–20 Hz) a few 100 ms after stimuli presentation. These biases may be attributable to attention-facilitation effects, since the visual input itself was balanced across hemifields by a noninformative cue, presented simultaneously with the movement goal.
Figure 8.

Alpha-band modulations are effector-unspecific. Data are presented in the format of Figure 5. Power is color-coded as follows: cooler (blue) colors, power suppression for contralateral movement goals. A, Reach task. TFRs are shown for the marked sensors in the left and right hemispheres, respectively. Significant contralateral suppression effects were found at both left and right hemisphere sensors. Bottom panels, TFR pooled across hemispheres (left). Right, Source reconstruction of the alpha-band suppression during the delay period, pooled across hemispheres, thresholded at z < −1, plotted on a standard left hemisphere. B, Saccade task. The format is as in A. Selected sensors in the left hemisphere failed to reach significance.
We applied spatial filtering techniques to estimate the sources underlying the alpha lateralization during the delay period (0.5–1.6 s). Results of this reconstruction are presented in the bottom right panels of Figure 8, A and B, plotted on a standardized brain. Consistent with the scalp topography, the reach task revealed a strong bilateral alpha source overlying occipital and parietal areas, with the locus of maximum activity in the posterior part of the intraparietal sulcus. During the saccade task, the sources of alpha lateralization are primarily found in the right hemisphere overlying visual and parietal regions, consistent with the scalp topography. The left hemisphere shows some scattered loci of activity in occipital and parietal areas, corroborating with the weaker alpha lateralization on the scalp level.
Discussion
We set out to characterize the spectral signature of parietal oscillatory activity during both reach and saccade planning. Our main finding was that high-gamma-band synchronization (70–90 Hz), originating from the medial aspect of the PPC, encodes the direction of a reach, whereas activity in a lower gamma band (50–60 Hz), originating from a more posterior portion of the PPC, encodes the direction of a saccade. These results, suggesting that distinct modules in the posterior parietal cortex encode movement goals of different effectors by selective gamma-band synchronization, are compatible with the functional organization of monkey PPC. In the lower frequency bands, we observed sustained alpha-band (8–12 Hz) desynchronization in occipitoparietal regions, which did not show clear effector specificity. Thus, whereas neurons in the PPC synchronize their activity in different gamma-band frequencies to encode different movement intentions, the alpha-band activation reflects effector-unspecific goal processing, or simply visuospatial attention.
In the present study, we found reach representations to be encoded by power increases in a 70–90 Hz gamma frequency band (Fig. 2). We found this representation to lateralize to the left hemisphere, contralateral to the reaching hand (Fig. 3). This hemispheric lateralization may suggest that selectivity for the hand to be used is also encoded by this representation (Connolly et al., 2003; Medendorp et al., 2003, 2005; Beurze et al., 2007). Furthermore, the power modulations of the parietal representation depended on the movement direction, with a clear bias toward contralateral reaches. In two ways, we ruled out that this representation in the medial parietal area is confounded by saccade planning. First, the respective sensor group did not demonstrate clear power modulations in this frequency range during the delayed-saccade task (Fig. 4B). Second, in the dissociation task, in which subjects planned and executed a reach and saccade in opposite directions, we found the activity of the reach sensors to tune to the reach direction, in actually even a more narrow frequency band (Fig. 4C). These findings are thus consistent with the notion that the PPC is involved in movement planning (Snyder et al., 1997; Andersen and Buneo, 2002).
Activity in relation to saccade planning was found in a more central bilateral parietal source (thus, more lateral from the reach source), consistent with our previous work (Van Der Werf et al., 2008) and previous fMRI work (Levy et al., 2007). The observed frequency band for saccade planning ranged from 50 to 60 Hz, which is slightly lower than the frequency band observed in our previous study, which ranged from 70 to 100 Hz.
The presently reported estimated locations of the gamma-band activity involved in reach and saccade planning (Fig. 7) nicely fit the notion that mostly stems from monkey literature that there are effector-specific movement-goal representations in the PPC. Neural spiking activity and local field potential (LFP) recordings in monkey posterior parietal cortex have revealed separate subregions for reaches and saccades: the LIP for saccades (Snyder et al., 1997; Pesaran et al., 2002) and the PRR for reach programming (Snyder et al., 1997; Galletti et al., 2003; Scherberger et al., 2005; Scherberger and Andersen, 2007). Our study revealed a large frontoparietal network engaged in rhythmic activity in a high gamma band during the retention period of a delayed reaching task (Fig. 2). Of this larger network, a smaller, posterior parietal region shows sustained direction selectivity during the delay period (Figs. 3, 4). The reach region was found in the hemisphere contralateral to the used (right) hand, consistent with findings in monkeys that reach plans depend on the hand to be used (Chang et al., 2008). In this respect, our reach region may represent the human analog of monkey area PRR. Accordingly, the more central parietal region may functionally correspond to monkey area LIP.
Recent studies, simultaneously recording electrophysiological and hemodynamic signals, have shown high positive correlations between hemodynamic signals and spectral power in the gamma band (>30 Hz) (Logothetis et al., 2001; Niessing et al., 2005). Generally speaking, our results are in support of this notion. That being said, recent human neuroimaging studies have only demonstrated limited effector specificity in parietal cortex (Astafiev et al., 2003; Medendorp et al., 2003, 2005; Hagler et al., 2007; Levy et al., 2007; Tosoni et al., 2008; Beurze et al., 2009). Why then would MEG be more sensitive to effector-specific differences than fMRI? One explanation relates to the following. It is known that even in monkey PPC the anatomical distinction between saccade- and reach-related areas is not so strict (Snyder et al., 1997; Calton et al., 2002). Although area LIP is mainly saccade-related, it may still have a minority of reach-sensitive cells, whereas in area PRR—despite the preponderance of reach cells—one could also find saccade-related cells. Since fMRI does not have the same spatial resolution as single-cell recordings, the BOLD effects caused by the functionally different types of neurons may blend (Bartels et al., 2008). However, in MEG recordings, neurons that synchronize their activity will show up stronger against the background noise of unsynchronized neural assemblies. The finding by Scherberger et al. (2005), that the power spectrum of the LFP (i.e., the synchronized firing of an assembly of neurons) better predicts the monkey's behavioral state than the spiking of individual neurons, supports the notion that synchronized neural assemblies carry more information than single neurons.
In contrast to the gamma band, we did not find a spectral difference between the planning of reach and saccades in the lower frequency band. In both types of single-movement planning, we found a contralateral desynchronization of the alpha band, which was most pronounced later in the delay period (0.5–1.6 s). Contralateral desynchronization of the alpha band has been reported before, during both spatial attention and delayed-saccade tasks (Worden et al., 2000; Thut et al., 2006; Medendorp et al., 2007; Siegel et al., 2008). It has been suggested that alpha-band desynchronization reflects a general regulatory mechanism, allocating resources for processing sensory information without actually encoding this information (Jensen et al., 2002; Jokisch and Jensen, 2007; Klimesch et al., 2007). The present study is consistent with this notion. When the two spatial stimuli are presented in opposing visual hemifields, there is no clear laterality of power in the alpha band. Together with the observation that during both single-movement conditions the lateralized desynchronization arises later in the course of the trial (0.5–1.6 s), this seems to reflect a role for alpha in the efficient processing of the movement goal over the noninformative visual stimulus (Fig. 8). That this effect is rather effector-unspecific may suggest a reflection of a top-down driven visuospatial attention mechanism. In this respect, fast alpha lateralization in relation to single stimuli, as observed in our previous studies (Medendorp et al., 2007; Van Der Werf et al., 2008), may be linked more closely to bottom-up attention effects.
Functional implications of high-frequency oscillations
The difference between the high-frequency gamma-band activities for reaches (70–90 Hz) and saccades (50–60 Hz) indicates that different neural networks are engaged in programming these movements. This selective frequency specialization also suggests that gamma-band synchronization is not a hardwired mechanism subserving a single function, which is in agreement with previous studies that have reported different gamma-band frequencies for different cognitive operations (Kayser and König, 2004; Vidal et al., 2006; Buschman and Miller, 2007; Wyart and Tallon-Baudry, 2008).
In support of this notion, it should also be mentioned that the presently observed gamma band during saccade planning (50–60 Hz) differs from the band (70–100 Hz) found in our previous study (Van Der Werf et al., 2008). Although we cannot exclude that these differences are attributable to different subject populations—gamma-band frequencies have been shown to vary considerably in individuals performing the same task (Hoogenboom et al., 2006; Muthukumaraswamy et al., 2009)—they may be attributable to different task conditions. More specifically, whereas in our previous study the hand was simply resting on the lap (Van Der Werf et al., 2008), the present study required the position of the hand to be kept central while the saccades were being planned and executed, which possibly exposed the posterior parietal regions to interfering oscillations from the active control of hand position. To minimize the interference between locally coexisting oscillations, the respective neural assemblies may “tune in” on different frequencies, as a means of flexible control to keep the spectral processing for the different functions apart (Roopun et al., 2008).
In addition to a difference in gamma frequency, we found the saccade source at a more posterior location than in our previous study. A purely methodological reason is that 275 channels provide a better resolution of source space than the previous 151 channel MEG experiments. A functional reason relates to the recent fMRI observations that target locations of saccades and reaches are coded in multiple topographic maps in posterior parietal cortex (Schluppeck et al., 2005; Hagler et al., 2007; Levy et al., 2007). Levy et al. (2007) found a weak bias for reaches for the most anterior map (IPS2) and a saccade bias in the most posterior map (IPS0/V7). Our observations in Figure 7 are consistent with their observations. If these maps are activated depending on task constraints, this might also explain the different locations of the saccade source in the previous (saccade vs antisaccades) and current study (saccades vs reaches).
Finally, LFP recordings in monkey area PRR have reported the maximum power increases in a lower frequency range of 15–50 Hz, whereas recordings in LIP during delayed saccades reported delay period activity in a higher frequency range of 25–90 Hz. In contrast, in humans we found a higher gamma frequency during reach planning and a somewhat lower gamma frequency during saccade planning. One could speculate that this difference reflects an interspecies effect. However, it is also possible that the monkey data were recorded from a cortical layer different from the layers that produce the dominating oscillation recorded in MEG (E. A. Buffalo, P. Fries, R. Desimone, unpublished observations). Recently, Rickert et al. (2005) found evidence for the encoding of reach direction in a higher gamma frequency range (>60 Hz) of local field potentials in motor cortex, supporting the present results that higher gamma frequency oscillations also play a role in movement planning. Additional studies are needed to reveal which specific movement parameters are encoded by the high-frequency oscillations in parietal cortex during movement planning.
Footnotes
This work was supported by The Netherlands Organization for Scientific Research Grants 864-03-007 (O.J.), 452-03-344 (P.F.), 400-04-186 (W.P.M.), and 452-03-307 (W.P.M.), a European Young Investigators Grant by the European Science Foundation (P.F.), Volkswagen Foundation Grant I/79876 (P.F., O.J.), and the Human Frontier Science Program (W.P.M.).
References
- Andersen RA, Buneo CA. Intentional maps in posterior parietal cortex. Annu Rev Neurosci. 2002;25:189–220. doi: 10.1146/annurev.neuro.25.112701.142922. [DOI] [PubMed] [Google Scholar]
- Astafiev SV, Shulman GL, Stanley CM, Snyder AZ, Van Essen DC, Corbetta M. Functional organization of human intraparietal and frontal cortex for attending, looking, and pointing. J Neurosci. 2003;23:4689–4699. doi: 10.1523/JNEUROSCI.23-11-04689.2003. [DOI] [PMC free article] [PubMed] [Google Scholar]
- Bartels A, Logothetis NK, Moutoussis K. fMRI and its interpretations: an illustration on directional selectivity in area V5/MT. Trends Neurosci. 2008;31:444–453. doi: 10.1016/j.tins.2008.06.004. [DOI] [PubMed] [Google Scholar]
- Bastiaansen MC, Knösche TR. Tangential derivative mapping of axial MEG applied to event-related desynchronization research. Clin Neurophysiol. 2000;111:1300–1305. doi: 10.1016/s1388-2457(00)00272-8. [DOI] [PubMed] [Google Scholar]
- Beurze SM, de Lange FP, Toni I, Medendorp WP. Integration of target and effector information in the human brain during reach planning. J Neurophysiol. 2007;97:188–199. doi: 10.1152/jn.00456.2006. [DOI] [PubMed] [Google Scholar]
- Beurze SM, de Lange FP, Toni I, Medendorp WP. Spatial and effector processing in the human parietofrontal network for reaches and saccades. J Neurophysiol. 2009;101:3053–3062. doi: 10.1152/jn.91194.2008. [DOI] [PubMed] [Google Scholar]
- Buschman TJ, Miller EK. Top-down versus bottom-up control of attention in the prefrontal and posterior parietal cortices. Science. 2007;315:1860–1862. doi: 10.1126/science.1138071. [DOI] [PubMed] [Google Scholar]
- Calton JL, Dickinson AR, Snyder LH. Non-spatial, motor-specific activation in posterior parietal cortex. Nat Neurosci. 2002;5:580–588. doi: 10.1038/nn0602-862. [DOI] [PubMed] [Google Scholar]
- Chang SW, Dickinson AR, Snyder LH. Limb-specific representation for reaching in the posterior parietal cortex. J Neurosci. 2008;28:6128–6140. doi: 10.1523/JNEUROSCI.1442-08.2008. [DOI] [PMC free article] [PubMed] [Google Scholar]
- Colby CL, Duhamel JR, Goldberg ME. Visual, presaccadic, and cognitive activation of single neurons in monkey lateral intraparietal area. J Neurophysiol. 1996;76:2841–2852. doi: 10.1152/jn.1996.76.5.2841. [DOI] [PubMed] [Google Scholar]
- Connolly JD, Andersen RA, Goodale MA. FMRI evidence for a “parietal reach region” in the human brain. Exp Brain Res. 2003;153:140–145. doi: 10.1007/s00221-003-1587-1. [DOI] [PubMed] [Google Scholar]
- Efron B, Tibshirani RJ. An introduction to the bootstrap. Boca Raton, FL: Chapman and Hall/CRC; 1993. [Google Scholar]
- Frost JD., Jr Comparison of intracellular potentials and ECoG activity in isolated cerebral cortex. Electroencephalogr Clin Neurophysiol. 1967;23:89–90. [PubMed] [Google Scholar]
- Galletti C, Kutz DF, Gamberini M, Breveglieri R, Fattori P. Role of the medial parieto-occipital cortex in the control of reaching and grasping movements. Exp Brain Res. 2003;153:158–170. doi: 10.1007/s00221-003-1589-z. [DOI] [PubMed] [Google Scholar]
- Glimcher PW. The neurobiology of visual-saccadic decision making. Annu Rev Neurosci. 2003;26:133–179. doi: 10.1146/annurev.neuro.26.010302.081134. [DOI] [PubMed] [Google Scholar]
- Gross J, Kujala J, Hamalainen M, Timmermann L, Schnitzler A, Salmelin R. Dynamic imaging of coherent sources: studying neural interactions in the human brain. Proc Natl Acad Sci U S A. 2001;98:694–699. doi: 10.1073/pnas.98.2.694. [DOI] [PMC free article] [PubMed] [Google Scholar]
- Hagler DJ, Jr, Riecke L, Sereno MI. Parietal and superior frontal visuospatial maps activated by pointing and saccades. Neuroimage. 2007;35:1562–1577. doi: 10.1016/j.neuroimage.2007.01.033. [DOI] [PMC free article] [PubMed] [Google Scholar]
- Hamalainen M, Hari R, Ilmoniemi RJ, Knuutila J, Lounasmaa OV. Magnetoencephalography—theory, instrumentation, and applications to noninvasive studies of the working human brain. Rev Mod Phys. 1993;65:413–497. [Google Scholar]
- Hikosaka O, Wurtz RH. Visual and oculomotor functions of monkey substantia nigra pars reticulata. 2. Visual responses related to fixation of gaze. J Neurophysiol. 1983;49:1254–1267. doi: 10.1152/jn.1983.49.5.1254. [DOI] [PubMed] [Google Scholar]
- Hoogenboom N, Schoffelen JM, Oostenveld R, Parkes LM, Fries P. Localizing human visual gamma-band activity in frequency, time and space. Neuroimage. 2006;29:764–773. doi: 10.1016/j.neuroimage.2005.08.043. [DOI] [PubMed] [Google Scholar]
- Jensen O, Gelfand J, Kounios J, Lisman JE. Oscillations in the alpha band (9–12 Hz) increase with memory load during retention in a short-term memory task. Cereb Cortex. 2002;12:877–882. doi: 10.1093/cercor/12.8.877. [DOI] [PubMed] [Google Scholar]
- Jokisch D, Jensen O. Modulation of gamma and alpha activity during a working memory task engaging the dorsal or ventral stream. J Neurosci. 2007;27:3244–3251. doi: 10.1523/JNEUROSCI.5399-06.2007. [DOI] [PMC free article] [PubMed] [Google Scholar]
- Kayser C, König P. Stimulus locking and feature selectivity prevail in complementary frequency ranges of V1 local field potentials. Eur J Neurosci. 2004;19:485–489. doi: 10.1111/j.0953-816x.2003.03122.x. [DOI] [PubMed] [Google Scholar]
- Klimesch W, Sauseng P, Hanslmayr S. EEG alpha oscillations: the inhibition-timing hypothesis. Brain Res Brain Res Rev. 2007;53:63–88. doi: 10.1016/j.brainresrev.2006.06.003. [DOI] [PubMed] [Google Scholar]
- Levy I, Schluppeck D, Heeger DJ, Glimcher PW. Specificity of human cortical areas for reaches and saccades. J Neurosci. 2007;27:4687–4696. doi: 10.1523/JNEUROSCI.0459-07.2007. [DOI] [PMC free article] [PubMed] [Google Scholar]
- Liljeström M, Kujala J, Jensen O, Salmelin R. Neuromagnetic localization of rhythmic activity in the human brain: a comparison of three methods. Neuroimage. 2005;25:734–745. doi: 10.1016/j.neuroimage.2004.11.034. [DOI] [PubMed] [Google Scholar]
- Logothetis NK. What we can do and what we cannot do with fMRI. Nature. 2008;453:869–878. doi: 10.1038/nature06976. [DOI] [PubMed] [Google Scholar]
- Logothetis NK, Pauls J, Augath M, Trinath T, Oeltermann A. Neurophysiological investigation of the basis of the fMRI signal. Nature. 2001;412:150–157. doi: 10.1038/35084005. [DOI] [PubMed] [Google Scholar]
- Maris E, Oostenveld R. Nonparametric statistical testing of EEG- and MEG-data. J Neurosci Methods. 2007;164:177–190. doi: 10.1016/j.jneumeth.2007.03.024. [DOI] [PubMed] [Google Scholar]
- Mazzoni P, Bracewell RM, Barash S, Andersen RA. Motor intention activity in the Macaque's lateral intraparietal area. 1. Dissociation of motor plan from sensory memory. J Neurophysiol. 1996;76:1439–1456. doi: 10.1152/jn.1996.76.3.1439. [DOI] [PubMed] [Google Scholar]
- Medendorp WP, Goltz HC, Vilis T, Crawford JD. Gaze-centered updating of visual space in human parietal cortex. J Neurosci. 2003;23:6209–6214. doi: 10.1523/JNEUROSCI.23-15-06209.2003. [DOI] [PMC free article] [PubMed] [Google Scholar]
- Medendorp WP, Goltz HC, Crawford JD, Vilis T. Integration of target and effector information in human posterior parietal cortex for the planning of action. J Neurophysiol. 2005;93:954–962. doi: 10.1152/jn.00725.2004. [DOI] [PubMed] [Google Scholar]
- Medendorp WP, Kramer GF, Jensen O, Oostenveld R, Schoffelen JM, Fries P. Oscillatory activity in human parietal and occipital cortex shows hemispheric lateralization and memory effects in a delayed double-step saccade task. Cereb Cortex. 2007;17:2364–2374. doi: 10.1093/cercor/bhl145. [DOI] [PubMed] [Google Scholar]
- Mitzdorf U. Current source-density method and application in cat cerebral cortex: investigation of evoked potentials and EEG phenomena. Physiol Rev. 1985;65:37–100. doi: 10.1152/physrev.1985.65.1.37. [DOI] [PubMed] [Google Scholar]
- Muthukumaraswamy SD, Edden RA, Jones DK, Swettenham JB, Singh KD. Resting GABA concentration predicts peak gamma frequency and fMRI amplitude in response to visual stimulation in humans. Proc Natl Acad Sci U S A. 2009;106:8356–8361. doi: 10.1073/pnas.0900728106. [DOI] [PMC free article] [PubMed] [Google Scholar]
- Nichols TE, Holmes AP. Nonparametric permutation tests for functional neuroimaging: a primer with examples. Hum Brain Mapp. 2002;15:1–25. doi: 10.1002/hbm.1058. [DOI] [PMC free article] [PubMed] [Google Scholar]
- Niessing J, Ebisch B, Schmidt KE, Niessing M, Singer W, Galuske RA. Hemodynamic signals correlate tightly with synchronized gamma oscillations. Science. 2005;309:948–951. doi: 10.1126/science.1110948. [DOI] [PubMed] [Google Scholar]
- Nolte G. The magnetic lead field theorem in the quasi-static approximation and its use for magnetoencephalography forward calculation in realistic volume conductors. Phys Med Biol. 2003;48:3637–3652. doi: 10.1088/0031-9155/48/22/002. [DOI] [PubMed] [Google Scholar]
- Percival DB, Walden AT. Spectral analysis for physical applications. Cambridge, UK: Cambridge UP; 1993. [Google Scholar]
- Pesaran B, Pezaris JS, Sahani M, Mitra PP, Andersen RA. Temporal structure in neuronal activity during working memory in macaque parietal cortex. Nat Neurosci. 2002;5:805–811. doi: 10.1038/nn890. [DOI] [PubMed] [Google Scholar]
- Rickert J, Oliveira SC, Vaadia E, Aertsen A, Rotter S, Mehring C. Encoding of movement direction in different frequency ranges of motor cortical local field potentials. J Neurosci. 2005;25:8815–8824. doi: 10.1523/JNEUROSCI.0816-05.2005. [DOI] [PMC free article] [PubMed] [Google Scholar]
- Roopun AK, Kramer MA, Carracedo LM, Kaiser M, Davies CH, Traub RD, Kopell NJ, Whittington MA. Temporal interactions between cortical rhythms. Front Neurosci. 2008;2:145–154. doi: 10.3389/neuro.01.034.2008. [DOI] [PMC free article] [PubMed] [Google Scholar]
- Scherberger H, Andersen RA. Target selection signals for arm reaching in the posterior parietal cortex. J Neurosci. 2007;27:2001–2012. doi: 10.1523/JNEUROSCI.4274-06.2007. [DOI] [PMC free article] [PubMed] [Google Scholar]
- Scherberger H, Jarvis MR, Andersen RA. Cortical local field potential encodes movement intentions in the posterior parietal cortex. Neuron. 2005;46:347–354. doi: 10.1016/j.neuron.2005.03.004. [DOI] [PubMed] [Google Scholar]
- Schluppeck D, Glimcher P, Heeger DJ. Topographic organization for delayed saccades in human posterior parietal cortex. J Neurophysiol. 2005;94:1372–1384. doi: 10.1152/jn.01290.2004. [DOI] [PMC free article] [PubMed] [Google Scholar]
- Schoffelen JM, Oostenveld R, Fries P. Imaging the human motor system's beta-band synchronization during isometric contraction. Neuroimage. 2008;41:437–447. doi: 10.1016/j.neuroimage.2008.01.045. [DOI] [PubMed] [Google Scholar]
- Siegel M, Donner TH, Oostenveld R, Fries P, Engel AK. Neuronal synchronization along the dorsal visual pathway reflects the focus of spatial attention. Neuron. 2008;60:709–719. doi: 10.1016/j.neuron.2008.09.010. [DOI] [PubMed] [Google Scholar]
- Snyder LH, Batista AP, Andersen RA. Coding of intention in the posterior parietal cortex. Nature. 1997;386:167–170. doi: 10.1038/386167a0. [DOI] [PubMed] [Google Scholar]
- Thut G, Nietzel A, Brandt SA, Pascual-Leone A. Alpha-band electroencephalographic activity over occipital cortex indexes visuospatial attention bias and predicts visual target detection. J Neurosci. 2006;26:9494–9502. doi: 10.1523/JNEUROSCI.0875-06.2006. [DOI] [PMC free article] [PubMed] [Google Scholar]
- Tosoni A, Galati G, Romani GL, Corbetta M. Sensory-motor mechanisms in human parietal cortex underlie arbitrary visual decisions. Nat Neurosci. 2008;11:1446–1453. doi: 10.1038/nn.2221. [DOI] [PMC free article] [PubMed] [Google Scholar]
- Van Der Werf J, Jensen O, Fries P, Medendorp WP. Gamma-band activity in human posterior parietal cortex encodes the motor goal during delayed prosaccades and antisaccades. J Neurosci. 2008;28:8397–8405. doi: 10.1523/JNEUROSCI.0630-08.2008. [DOI] [PMC free article] [PubMed] [Google Scholar]
- Van Der Werf J, Buchholz VN, Jensen O, Medendorp WP. Neuronal synchronization in human parietal cortex during saccade planning. Behav Brain Res. 2009;205:329–335. doi: 10.1016/j.bbr.2009.06.011. [DOI] [PubMed] [Google Scholar]
- Vesia M, Monteon JA, Sergio LE, Crawford JD. Hemispheric asymmetry in memory-guided pointing during single-pulse transcranial magnetic stimulation of human parietal cortex. J Neurophysiol. 2006;96:3016–3027. doi: 10.1152/jn.00411.2006. [DOI] [PubMed] [Google Scholar]
- Vidal JR, Chaumon M, O'Regan JK, Tallon-Baudry C. Visual grouping and the focusing of attention induce gamma-band oscillations at different frequencies in human magnetoencephalogram signals. J Cogn Neurosci. 2006;18:1850–1862. doi: 10.1162/jocn.2006.18.11.1850. [DOI] [PubMed] [Google Scholar]
- Worden MS, Foxe JJ, Wang N, Simpson GV. Anticipatory biasing of visuospatial attention indexed by retinotopically specific alpha-band electroencephalography increases over occipital cortex. J Neurosci. 2000;20:RC63. doi: 10.1523/JNEUROSCI.20-06-j0002.2000. (1–6) [DOI] [PMC free article] [PubMed] [Google Scholar]
- Wyart V, Tallon-Baudry C. Neural dissociation between visual awareness and spatial attention. J Neurosci. 2008;28:2667–2679. doi: 10.1523/JNEUROSCI.4748-07.2008. [DOI] [PMC free article] [PubMed] [Google Scholar]
- Zhang M, Barash S. Persistent LIP activity in memory antisaccades: working memory for a sensorimotor transformation. J Neurophysiol. 2004;91:1424–1441. doi: 10.1152/jn.00504.2003. [DOI] [PubMed] [Google Scholar]