

Abstract
Vascular endothelial growth factor (VEGF) regulates angiogenesis, but also has important, yet poorly characterized roles in neuronal wiring. Using several genetic and in vitro approaches, we discovered a novel role for VEGF in the control of cerebellar granule cell (GC) migration from the external granule cell layer (EGL) toward the Purkinje cell layer (PCL). GCs express the VEGF receptor Flk1, and are chemoattracted by VEGF, whose levels are higher in the PCL than EGL. Lowering VEGF levels in mice in vivo or ectopic VEGF expression in the EGL ex vivo perturbs GC migration. Using GC-specific Flk1 knock-out mice, we provide for the first time in vivo evidence for a direct chemoattractive effect of VEGF on neurons via Flk1 signaling. Finally, using knock-in mice expressing single VEGF isoforms, we show that pericellular deposition of matrix-bound VEGF isoforms around PC dendrites is necessary for proper GC migration in vivo. These findings identify a previously unknown role for VEGF in neuronal migration.
Introduction
Wiring of neuronal circuits relies on precise spatial positioning of neurons and axons (Rakic, 2002). The cerebellar cortex contains three layers in adult mammals: a molecular layer (ML), an intermediate Purkinje cell layer (PCL), and a deeper internal granule cell layer (IGL) (Rakic, 1990; Hatten, 1999; Sotelo, 2004). In development, an additional layer on the surface of the cerebellar cortex, termed the external granule cell layer (EGL), contains granule cell precursors (GCPs) from the rhombic lip. In rodents, GCPs continue to proliferate in the upper part of the EGL after birth and give rise to postmitotic granule cells (GCs), which migrate tangentially in the lower part of the EGL, while extending bipolar axons, which form parallel fibers (Solecki et al., 2006; Chédotal, 2010). Later, postmitotic GCs grow out an inwardly projecting leading process that guides radial migration of GCs across the ML along Bergmann glia fibers (Kawaji et al., 2004; Solecki et al., 2006).
Neuronal migration and axon navigation are orchestrated by attractive and repulsive guidance cues (Dickson, 2002; Marín et al., 2010). Diffusible molecules act as long-range cues, whereas matrix-associated or membrane-anchored molecules function as short-range signals (Park et al., 2002). In the cerebellum, GC migration involves neuronal–glial adhesion molecules (Hatten, 2002), stromal cell-derived factor (Ma et al., 1998; Zou et al., 1998; Klein et al., 2001), EphrinB (Lu et al., 2001), brain-derived neurotrophic factor (BDNF) (Rocamora et al., 1993; Borghesani et al., 2002; Zhou et al., 2007), and semaphorin 6A (Kerjan et al., 2005; Renaud et al., 2008), among other cues.
Vascular endothelial growth factor (VEGF) is best known for its role in angiogenesis (Carmeliet, 2003; Ferrara, 2004; Kerbel, 2008; Shibuya, 2008). A spatial gradient of VEGF isoforms, which differ in size and binding properties to heparin in the extracellular matrix, is critical for vessel patterning and morphogenesis (Carmeliet et al., 1999; Stalmans et al., 2002, 2003). In the nervous system, VEGF regulates proliferation, differentiation, and survival of neuronal cells (Ruiz de Almodovar et al., 2009). In addition, VEGF promotes tangential migration of motoneurons and migration of cranial neural crest cells (NCCs) via binding to neuropilin-1 (Npn-1), a coreceptor of the signaling receptor VEGFR-2 (Flk1) (Schwarz et al., 2004, 2008; McLennan et al., 2010; Schwarz and Ruhrberg, 2010). Since Npn-1 does not elicit signals in response to VEGF in neurons, the mechanism whereby VEGF attracts motoneurons and NCCs remains unknown. Furthermore, there is no conclusive evidence that VEGF regulates neuronal migration in vivo through direct activation of Flk1.
VEGF is expressed in the cerebellum (Acker et al., 2001); however, nothing is known about its effects on GC migration. Therefore, using various loss- and gain-of-function genetic and pharmacological approaches, we explored the role and underlying mechanisms of VEGF in GC migration. Our findings indicate that VEGF, via direct binding to its receptor Flk1 in postmitotic GCs, regulates GC migration during cerebellar development. Moreover, we describe how matrix-bound VEGF isoforms are necessary for proper GC migration.
Materials and Methods
Animals.
VEGFLacZ (Miquerol et al., 2000), VEGF∂/∂ (Oosthuyse et al., 2001), VEGF164/164, VEGF188/188, and VEGF120/120 (Carmeliet et al., 1999; Stalmans et al., 2003) were previously generated. The transgenic Math1CreER and the Flk1-GFP and Flk1-LacZ mouse lines were kindly provided by Dr. S. J. Baker, St. Jude Children's Research Hospital, Memphis, TN (Chow et al., 2006) and Dr. J. Rossant, University of Toronto, Toronto, ON, Canada (Ema et al., 2006), respectively. The Flk1lox/LacZ mouse line was generated by crossing Flk1lox/lox mice (Haigh et al., 2003) with Flk1LacZ/+ mice. For each transgenic mouse line, littermates or proper wild-type (WT) control mice were used. Wistar rat pups [postnatal day 6 (P6) and P8] were also used for ELISA and for immunostainings, respectively. All animals were treated according to the guidelines approved by the French Ethical Committee (decrée 87-878) and the Animal Care Committee of the University of Leuven, Belgium.
Histology, immunohistochemistry.
Mouse and rat pups (males and females), and adult mice (males and females), were perfused transcardially with saline followed by 4% paraformaldehyde (PFA). Serial cryosections of dissected brains were cut parasagitally at 10–20 μm thickness. Cerebellar slices (200–350 μm) were fixed in 2% PFA for 2 h before immunostaining. For immunohistochemistry, the following antibodies were used: anti-β-galactosidase (Cappel; 55976), anti-VEGF (Santa Cruz Biotechnology; SC-152; batch K301), anti-p27 (Santa Cruz Biotechnology; SC-1641), anti-Ki67 (Novocastra; NCL-Ki67-P; Ki67-MMI), anti-5-bromo-2′-deoxyuridine (BrdU) (Immunologicals Direct), anti-CD31 (BD Pharmingen; 557355), anti-GFAP (Dako; ZO334), anti-calbindin (Sigma-Aldrich; C9848), anti-parvalbumin (Sigma-Aldrich; P3088), anti-GABAA-α6 receptor subunit (Millipore Bioscience Research Reagents; AB5610), anti-Pax6 (Covance; PRB-278P), anti-phospho-histone-3 (Cell Signaling; 9701), anti-activated caspase-3 (Abcam; ab2302), anti-TAG-1 (Dr. D. Karagogeos, University of Crete, Heraklion, Greece), anti-Sema6A (R&D Systems; AF1615), Hydroxyprobe-1-Mab-1 (Millipore Bioscience Research Reagents), anti-green fluorescent protein (GFP) (Invitrogen; A11122), anti-Npn-1 (R&D Systems; AF566), anti-Npn2 (R&D Systems; 2215) and anti-Flk1 (Santa Cruz Biotechnology; SC-6251). Sections were subsequently incubated with fluorescently conjugated secondary antibodies (Invitrogen; Alexa 488 or 546) or with peroxidase-labeled IgGs (Dako), followed by amplification with tyramide signal amplification system (Cy3 or FT; PerkinElmer Life and Analytical Sciences) for anti-CD31 and anti-GFP. To determine the time course of GC migration in vivo, P10 mice were injected intraperitoneally with BrdU (50 mg/kg body weight). Sections were heated three times 5 min in 10 mm citrate buffer, pH 6.0, in a microwave, and subsequently double labeled for BrdU and VEGF, for BrdU/p27, Ki67/p27, Ki67/Pax6, or p27/Pax6, before being counterstained with 4′,6′-diamidino-2-phenylindole (DAPI) (Roche). For the detection of hypoxic cells, mice were treated with 60 mg/kg pimonidazole hydrochloride (Millipore Bioscience Research Reagents) 1.5 h before brain dissection, and afterward staining for hydroxyprobe-1-Mab-1 was performed following manufacturer's instructions. Immunostainings were examined using Imager and AxioP Zeiss microscopes equipped with epifluoresence illumination or confocal system (Zeiss CLSM510; 0.5–1.0 μm optical sections). VEGF immunostaining was analyzed by pseudocolor analysis, which attributed a specific color to defined intensity gray levels of the VEGF immunostaining, with red areas representing the highest intensity value, and the yellow, light green, dark green, blue, and dark purple areas representing decreasing intensity values, respectively.
VEGF-alkaline phosphatase binding and staining.
VEGF164-AP and PlGF-AP fusion proteins were made by cloning their cDNA sequences into a pAPtag-5 vector (GenHunter). Proteins were expressed and secreted from HEK-293 cells, and the conditioned medium was used directly as described previously (Renaud et al., 2008). VEGF164-AP protein was quantified via ELISA. For competition experiments, recombinant VEGF164 (R&D Systems; 493-MV) or VEGF-E (RELIATech 300-046S) was coincubated with VEGF164-AP-supernatant.
Morphometric analyses.
All morphometric analyses in transgenic and corresponding control mice were performed in lobes V and IX at the most medial location of the cerebellar vermis on five cerebellar parasaggital sections per animal. GC migration was analyzed at P12 in VEGF∂/∂, VEGF188/188, and VEGF164/164 mice, at P9 in VEGF120/120 mice and at P8 in Math1CreER × Flk1lox/LacZ mice. Briefly, the total number of BrdU+ cells in the EGL, ML, and IGL was counted, and the number of BrdU+ cells in the IGL was expressed as a percentage of the total number of BrdU+ cells in the EGL, ML, and IGL. To determine BrdU+ cells present in the postmitotic part of the EGL, percentages were assessed by dividing the number of BrdU+ cells in the p27+ area of the EGL by the total number of BrdU+ cells in the EGL. The EGL area was expressed as a percentage of the total area of the cerebellar cortex in the same region. Vascular development was assessed by analyzing the CD31-immunostained area as a percentage of the total area of the cerebellar cortex. Proliferation was analyzed at P10 and P12 by counting BrdU+ or Ki67+ cells and relating these numbers to the length of the EGL in lobe IX. GC death was analyzed at P10 by counting act-casp-3+ cells in the EGL and relating it to the total EGL area of lobe IX. Differentiation was analyzed, at P10 for VEGF∂/∂ and P12 for VEGF188/188 mice, by counting p27+ and Pax6+ cells in the EGL and relating the numbers to the length of the EGL or to the total EGL area. Purkinje cell number was analyzed at P12 by counting Purkinje cell soma in lobe IX and relating the number to the total area of lobe IX. In each analysis, N equals the number of mice analyzed. At least three to four mice of each genotype were used for each analysis. N = 5 indicates five mice analyzed for WT and five for the specific transgenic line. N = 5–4 indicates five mice analyzed for WT and four for the specific transgenic line.
Granule cell purification.
GCs were purified as previously described (Hatten, 1985).
Apoptosis assay.
Terminal deoxynucleotidyl transferase-mediated biotinylated UTP nick end labeling (TUNEL) staining was performed on sections (10 μm at P12) or on cerebellar slices (200 μm) by using the Apoptosis Detection System kit (Promega) following manufacturer's instructions.
DiI labeling.
To trace parallel fibers, we used the fluorescent carbocyanine dye 1,1′-dioctadecyl-3,3,3′3′-tetramethylindocarbocyanine perchlorate (DiI) (Invitrogen) in 200-μm-thick fixed coronal vibratome slices of VEGF∂/∂ and WT cerebella (P12). Sized crystals (50 μm diameter) were placed in the ML of brain slices of paired littermates using a patch pipette and slices were kept in the dark at 37°C for 2–4 d to allow appropriate dye diffusion. Images were acquired using a Leica confocal system (0.5–1.0 μm optical sections).
In vitro chemotaxis assay.
Purified GCs were resuspended in serum-free DMEM [supplemented with N2 (Invitrogen) and B27 (Invitrogen)]. In vitro migration of GCs was assessed using laminin (Sigma-Aldrich; 20 μg/ml)-coated-PET (polyethylene) track-etched membranes with 8 μm pore size in modified Boyden chambers as previously described (Lu et al., 2001). Briefly, 200 μl of serum-free DMEM containing 1 × 10⁵ GCs was placed in the upper chamber. The corresponding treatment was added in serum-free medium in the lower chamber. After 17 h at 37°C in 5% CO2, the upper surface of membranes was scraped free of cells and debris, membranes were fixed in 4% PFA for 1 h at room temperature, stained for β3-tubulin and DAPI. Cells that had migrated through pores and adhered to the membrane were analyzed under high-power fluorescent microscopy and counted in 30 adjacent high-power fields. Experiments were performed in triplicate, and data are expressed as fold increase in number of cells present at the lower side of the filter with respect to the number of cells present at that side of the filter in control conditions. N values represent the number of independent experiments performed.
Growth cone turning assay.
GCs that formed only a single thick leading process and were not migrating at the start or during recording, were selected for analysis. Concentration gradients of recombinant human VEGF165 (R&D Systems) and recombinant human BDNF (R&D Systems) were produced for 1 h by application of VEGF or BDNF solution through a glass pipette. The turning angle between the original direction of the neurite and its new direction at the end of the 1 h period was measured using Software Analysis (Soft Imaging System). For statistical analysis nonparametric Kruskal–Wallis and Mann–Whitney tests were used. N values indicate the total number of cells analyzed.
Cocultures of HEK-293 cells with GCs.
We generated HEK-293 cells, stably expressing a single VEGF isoform (HEK-VEGF188, HEK-VEGF164, HEK-VEGF120) or mock control (HEK-Mock); despite intense screening, only clones with 10-fold lower VEGF188 levels than the other isoforms could be generated. These cells were plated on noncoated coverslips at sparse (50%) confluency, and cultured for 24 h in DMEM with 10% serum. Afterward, a fixed number of purified GCs was added to the cultures in serum-free DMEM [supplemented with the neuronal supplements N2 (Invitrogen) and B27 (Invitrogen)]. Seventeen hours later, cocultures were fixed with 4% PFA for 15 min at room temperature, permeabilized, and stained for Pax-6, β-III-tubulin, actin, and DAPI, to visualize each cell type. Confocal images were taken from three independent experiments. Since purified GCs only survive if they adhere to these cellular substrates in this assay (they cannot adhere to the uncoated dish), we counted the number of adhered GCs per HEK-293 cell (the conditions were selected such that with HEK-Mock cells, on average, one GC adhered per two HEK-293 cells).
Ex vivo cerebellar electroporation.
Cerebella dissected from P10 wild-type pups were injected with 8 μl of DNA of interest (3 μg/μl) (endofree, GFP expression vector in 5:1 ratio) into the superficial layers of the cerebellum. Similarly, for the GC-specific conditional knock-out experiments, cerebella dissected from P8 Math1CreER+ × Flk1lox/LacZ mice and Math1CreER− × Flk1lox/LacZ (Flk1lox/LacZ) pups were injected with 24 μg of the Brainbow1.0 plasmid (Livet et al., 2007). The age of P8 was selected to target more GCs in the EGL, as Math1 expression is restricted to GCs in the EGL (Akazawa et al., 1995). The DNA of interest was diluted in PBS together with 0.2% Fast Green (Sigma-Aldrich). The cerebellum was subjected to five electric pulses of 85 V, 50 ms, and a 1.0 s delay between pulses using 10 mm electrodes connected to a square pulse ECM830 ElectroSquarePorator (BTX; Harvard). Meninges were removed and 350 μm slices were made with a tissue chopper (McIllwain). Slices were incubated in millicells (Millipore) at 35°C, 5% CO2, and in medium containing 94.5% BME (Invitrogen), 1% glucose, 0.5% BSA, 1% penicillin/streptomycin (Invitrogen), and 1% supplement insulin/transferin/selenium (Sigma-Aldrich).
Treatment of electroporated cerebellar slices.
Electroporated slices were treated either with PTK787 (75 μm; LCL Laboratories) or αFlk1 (100 μg/ml) by adding them to the culture medium. One-half of the medium was refreshed every day with new inhibitor. For long-term αFlk1 treatment, slices were cultured 8 d. Brainbow-electroporated cerebellar slices from Math1CreER × Flk1lox/LacZ were treated for 2 d with 4-hydroxy-tamoxifen (Sigma-Aldrich) (100 nm) to activate Cre, and analyzed 2 d later.
Analysis of electroporated cerebellar slices.
Confocal images were taken by using the Zeiss CLSM510 mounted on an AxioVert100M and LSM software. To quantify radial migration of GFP+ GCs in electroporated slices, the distance that each GFP+ GC migrated radially from the EGL/ML border was measured (see Fig. 4F, distance b) using KS300 morphometry software (Zeiss), and normalized for the total length of the cerebellar lobe (see Fig. 4F, distance a). The cerebellar cortex was then divided into five equally spaced areas. A comparable total number of migrating GCs was counted in control and treated groups; at least 1500 GFP+ GC from at least three electroporated control and “treated” cerebella were analyzed in each group. Using binomial nonparametric statistics, the statistical differences between the observed and expected number of GCs in each area was determined, with the expected number of cells representing the number found in the control group (assuming that if the treatment would have no effect, a similar number of GCs would be expected in each of the areas). The difference between the observed versus expected number of cells in each area was expressed as a percentage of the expected number of cells.
Figure 4.

Ex vivo overexpression of VEGF in the EGL induces GC migration defects. A–D, Immunostaining of cerebellar slices for CD31, revealing progressive regression and disintegration of blood vessels at day 1 (A), day 2 (B), day 3 (C), or day 4 (D) of culture. E, Quantitative RT-PCR analysis, revealing a 250% increase of VEGF mRNA levels in cerebellar slices electroporated with a plasmid encoding VEGF compared with slices electroporated with the corresponding control plasmid (N = 5; *p < 0.05). Results are normalized to the expression levels in the control. Error bars indicate SEM. F, Scheme illustrating the methods used to quantify GC migration in the electroporated cerebellar slices. The cerebellar cortex from the EGL to IGL (a) was divided in five equally spaced areas, and the number of GFP+ GCs that reached each of these areas and had migrated a specific distance from the EGL/ML border (b), was counted. G, H, Confocal microscopy of electroporated cerebellar slices after 4 d of culture, revealing that a substantial fraction of GFP+ GCs had already migrated into the PCL/IGL in control slices (electroporated with empty vector; G); by contrast, in slices electroporated with a VEGF expression plasmid (which results in ectopic expression of VEGF in the EGL), a larger fraction of GFP+ GCs stalled at the EGL/ML border (H). Scale bars: A–D, G, H, 100 μm.
Time-lapse imaging.
Time-lapse movies were made (16 h) of ex vivo electroporated cerebellar slices after being 2 d in culture (for imaging tangential and radial migration, respectively). Images were obtained with a Zeiss CLSM510 NLO META mounted on an AxioVert200M (Zeiss) inverted microscope. Multiphoton imaging of GFP+ GCs was performed using 920 nm pulsed mode-locked laser emission from a tunable Ti:Sapphire Chameleon laser (Coherent). Time-lapse imaging was performed with minimal necessary laser power. Stacks of frame-averaged (five frames) confocal optical slices were collected digitally, at 20 min intervals for time-lapse sequences. Three-dimensional as well as four-dimensional reconstructions of image data were prepared using LSM software package. A semiautomatic macro, written in KS300 software, was used to analyze the tracks of migrating GFP+ GCs and calculate the speed of tangential migration.
Induction of Cre activity in Math1CreER × R26R-stop-LacZ and in Math1CreER × Flk1lox/LacZ mice.
Tamoxifen (Sigma-Aldrich) was dissolved in sunflower seed oil (Sigma-Aldrich) at 30 mg/ml. For all experiments, 4 mg of tamoxifen/35 g of body weight was administered by oral gavage to pregnant mice at embryonic day 17 (E17). After injection of BrdU at P6, BrdU+ cells were counted 2 d later.
Quantification of VEGF and Flk1 by ELISA.
Two defined regions, one comprising the EGL plus the upper ML, and a second one comprising the PCL plus the lower ML, were microdissected from 200 μm slices of P6 rat pups or P6 mouse pups. The microdissected tissues from 6–10 pups were pooled and processed in one sample for additional analysis of VEGF protein concentration using the commercial Quantikine rat or mouse VEGF ELISA kit (R&D Systems; Quantikine RRV00 and MMV00, respectively). Flk1 expression was determined in lysates from purified GCs using the commercial mouse Flk1 ELISA kit (R&D Systems; Quantikine MVR200B). N values for this experiment indicate the number of independent experiments performed, each of them of pooled samples from 6–10 pups.
Quantitative real-time reverse transcription-PCR.
Expression levels were quantified by real-time reverse transcription (RT)-PCR, relative to the expression level of β-actin or GAPDH, using the following forward (F) and reverse primers (R) and probes (P), labeled with fluorescent dye (FAM) and quencher (TAMRA). VEGF: F, 5′-AGTCCCATGAAGTGATCAAGTTCA-3′; R, 5′-ATCCGCATGATCTGCATGG-3′; P, 5′-FAM-TGCCCACGTCAGAGAGCAACATCAC-TAMRA-3′; Npn-1: F, 5′-ACACCTGAGCTTCGGACGTT-3′; R, 5′-CCACTGTGTGTGGCTCTCTCA-3′; P, 5′-FAM-TCACCTCTCTCCACAAGGTTCATCAGGATC-TAMRA-3′; Math-1: F, 5′-AGCTTCCTGCAAAAATGACCA-3′; R, 5′-GCCCGCACCTCCTTCATAG-3′; P, 5′-FAM-CATCACCTTCGCACCGCCTCCT-TAMRA-3′; β-actin: F, 5′-AGAGGGAAATCGTGCGTGAC-3′; R, 5′-CAATAGTGATGACCTGGCCGT-3′; P, 5′-FAM-CACTGCCGCATCCTCTTCCTCCC-TAMRA-3′; GAPDH: F, 5′-ACGTGCCGCCTGGAGA-3′; R, 5′-CCCTCAGATGCCTGCTCCA-3′; P, 5′-FAM-CACCTTCTTGATGTCATCATACTTGGCAGG-TAMRA-3′. For the different VEGF isoforms, a common forward primer and probe were used: F, 5′-TGCAGGCTGCTGTAACGATG-3′; P, 5′-FAM-TGTCTTTCTTTGGTCTGCATTCACATCGG-TAMRA-3′. The reverse primers specific for the VEGF isoforms were as follows: for VEGF120: R, 5′-CCTCGGCTTGTCACATTTTTCT-3′; for VEGF188: R, 5′-CTCCAGGATTTAAACCGGGATT-3′; for VEGF164: R, 5′-GAACAAGGCTCACAGTGATTTTCT; for Flk1: F, 5′-ACTGCAGTGATTGCCATGTTCT-3′; R, 5′-TCATTGGCCCGCTTAACG-3′; P, 5′-FAM-TGGCTCCTTCTTGTCATTGTCCTACGGA-TAMRA-3′. N values indicate the number of independent experiments performed with different cultures of purified GCs.
Nuclear magnetic resonance spectroscopy.
P10 pups were anesthetized, and their cerebellum was rapidly dissected and snap frozen. After homogenization in 1 m HClO4, the extracts were centrifuged, the supernatants were neutralized, and the precipitated HClO4 was removed. Subsequently, samples were dried, resuspended in D2O, and adjusted to pH 7.0–7.5 before analysis. In vitro 1H nuclear magnetic resonance (NMR) spectroscopy (repetition time, 15 s; number of acquisitions, 64) analyses of lactate, glutamate, succinate, and NTP (ATP-NADH) content in cerebellar extracts were performed in a high-resolution AVANCEII (9.4 tesla) spectrometer (Bruker). Peak intensities were quantified by integration after baseline correction, using the spectrometer processing software. These values were related to total creatin levels. Mean peak intensities, relative to total creatin, of NTP (ATP-NADH), lactate, succinate, and glutamate after 1H NMR of P10 cerebellar extracts are summarized together with the SEM.
Electron paramagnetic resonance oximetry.
Lithium phthalocyanine (LiPc) has a single, sharp electron paramagnetic resonance (EPR) line whose width is highly sensitive to pO2. Two small aggregates of LiPc crystals (80–100 μg) were implanted into brain tissue. EPR spectra were recorded using an EPR spectrometer (Magnettech) operating at 1.2 GHz with an extended loop resonator placed over the head of the mice. Clear signal-to-noise ratios were obtained in recorded spectra. The measurements reflect the average partial pressure of oxygen on the crystal surface.
Statistical analysis.
All data represent mean ± SEM. Statistical significance for most analyses was performed using Student's t tests, except stated otherwise.
Results
VEGF is expressed in a radial pattern from the PCL to the upper cerebellar layers
We first characterized the expression pattern of VEGF in the developing cerebellum of WT mice at different time points during inward GC migration (Komuro and Yacubova, 2003). We used a LacZ-VEGF mouse line (VEGFLacZ mice), in which an IRES-nls-LacZ reporter cassette was knocked in, via homologous recombination, into the last exon of the Vegf gene (Miquerol et al., 2000). This line overexpresses VEGF from its endogenous locus by twofold (Miquerol et al., 2000), but the spatiotemporal expression pattern of β-galactosidase (β-Gal) reliably mimics that of the endogenous Vegf gene (Miquerol et al., 1999). Immunostaining revealed that β-Gal was expressed in Purkinje cells (PCs) at P13 (Fig. 1A,B). VEGF immunostaining at different time points during GC migration (P3, P5, P8, and P13) confirmed that VEGF was detectable in the PC soma and dendrites, even in dendritic extensions that reached the lower EGL (Fig. 1C; supplemental Fig. 1A–C, available at www.jneurosci.org as supplemental material). These data are consistent with reports that VEGF is detectable in the PCL from P1 to adulthood (Acker et al., 2001).
Figure 1.

Expression of VEGF and Flk1 in the postnatal mouse cerebellum. A, B, β-Gal immunostaining (red), combined with DAPI counterstaining (blue), of cerebellar sections from P13 VEGFLacZ/+ mice at low (A) and high (B) magnification, revealing expression of β-Gal in nuclei of Purkinje cells (B, white arrow) and in some Bergmann glial cells (B, white arrowhead). C, Immunostaining for VEGF (red) of cerebellar sections from P13 WT mice, revealing labeling of Purkinje cell bodies and dendrites. D, Double immunostaining for GFAP (green) and VEGF (red) of cerebellar sections from P13 VEGFLacZ/+ mice, showing VEGF expression in Purkinje cells and in some Bergmann glial fibers (white arrowheads). E, F, Staining of P10 cerebellar sections with VEGF164-AP fusion protein, revealing at low (E) and high (F) magnification the presence of VEGF receptors, abundant in pial vessels (thick strongly labeled black lines on top) and parenchymal vessels (F, black arrows) and, at lower levels, in the deeper EGL (F, white arrowheads). G, The VEGF164-AP staining was specific, as an excess of VEGF-E, known to bind selectively to Flk1, reduced the signal in endothelial cells and GCs (black arrowheads). H, Micrograph, showing Flk1 expression in Flk1-GFP knock-in mice (P10) in pial and parenchymal blood vessels (white arrow) and in the deeper layers of the EGL, postmitotic GCs (white arrowheads); GFP+ structures underneath the pial vessels represent endothelial cells, sprouting into the parenchyme. I, Confocal image of a cultured postmitotic GC migrating along a glia fiber (gray/white), showing Flk1 expression in the GC soma and neurite (green). Scale bar: A, 400 μm; B, 50 μm; C, 65 μm; D, 30 μm; E, 220 μm; F, G, 75 μm; H, 30 μm; I, 9.6 μm.
Semiquantitative pseudocolor conversion of VEGF immunostaining indicated that the VEGF-immunoreactive levels were higher in the PC somata than dendrites (see Fig. 3C); apotome microscopy confirmed these findings (data not shown). ELISA on microdissected P6 rat cerebella (used because of their larger size to facilitate reliable microdissection) also showed that VEGF protein levels were higher in the deeper than in the more superficial cerebellar layers (ng VEGF/mg protein: 77.7 ± 7.6 in PCL/lower ML vs 25.4 ± 10.3 in EGL/upper ML; N = 4 samples of 10 pups each; p < 0.01); comparable results were obtained in mouse cerebella (supplemental Table 1, available at www.jneurosci.org as supplemental material) (for reasons of clarity, several of the data presented in the main text are overviewed again in the supplement). Using similar criteria as those used to judge the presence of a BDNF gradient (Borghesani et al., 2002; Zhou et al., 2007), these findings suggest that VEGF is deposited in a radial concentration gradient from the PCL to the upper layers. Measurements of extracellular VEGF would be needed to conclusively demonstrate the presence of such a radial VEGF concentration gradient.
Figure 3.

GC migration defects in VEGF∂/∂ mice. A, B, VEGF immunostaining showing reduced VEGF expression in Purkinje cell bodies (asterisks) and dendrites (arrows) in VEGF∂/∂ mice (B) compared with WT mice (A). C, D, Pseudocolor images of VEGF immunostaining indicating an overall reduction of the VEGF-immunoreactive signal in Purkinje cell bodies (asterisk) and dendrites (arrow) in VEGF∂/∂ mice (D) compared with WT mice (C). E, F, Double immunolabeling for BrdU (green) and VEGF (red), combined with DAPI counterstaining (blue), in cerebella of a P12 WT (E) and VEGF∂/∂ (F) mice, revealing impaired migration of BrdU+ GCs in the VEGF∂/∂ mouse (F) compared with the WT mouse (E). Note that more BrdU+ cells accumulated at the interface between the EGL and the ML (arrows) in the VEGF∂/∂ (F) compared with the WT (E) mouse. G, H, Double immunostaining for BrdU (green) and p27 (red), labeling postmitotic neurons in the inner two-thirds of the EGL (marked by dotted lines), revealing an enlarged p27+ area in the EGL of VEGF∂/∂ (H) compared with WT (G) mice. Note the more numerous double-labeled BrdU+/p27+ cells (yellow) in the EGL of VEGF∂/∂ mice (H). I, J, DiI labeling of parallel fibers in adult WT (I) and VEGF∂/∂ (J) revealing a similar fiber pattern throughout the ML in both genotypes. K, L, Immunostaining for CD31 (red) revealing a comparable microvasculature in the cerebellar cortex of a WT (K) and VEGF∂/∂ (L) mouse. Scale bars: A–D, 50 μm; E, F, 65 μm; G, H, 20 μm; I, J, 50 μm; K, L, 320 μm.
VEGF was also detectable in Bergmann glia cells in VEGFLacZ mice (P13) when immunostained with an anti-β-Gal or anti-VEGF antibody (Fig. 1B,D), but in WT mice, we could not label these cells with anti-VEGF antibodies (Fig. 1C; supplemental Fig. 1A–C, available at www.jneurosci.org as supplemental material), suggesting that VEGF is expressed at lower levels in Bergmann glia than in PCs. Immunostaining with anti-β-Gal also revealed that VEGF is expressed in PCs, Bergmann glia, and in astrocytes in the IGL, but not in interneurons, in adult VEGFLacZ cerebellum (supplemental Fig. 1D–F, available at www.jneurosci.org as supplemental material).
VEGF receptor-2/Flk1 is expressed in granule cells
We next determined whether GCs express VEGF receptors. In purified GCs from P6 mice, both Flk1 mRNA (7.4 ± 1.3 mRNA copies per 105 copies of β-actin mRNA; N = 4) (supplemental Table 1, available at www.jneurosci.org as supplemental material) and Flk1 protein (ng Flk1/mg protein: 0.53 ± 0.02; N = 3) (supplemental Table 1, available at www.jneurosci.org as supplemental material) were detectable; immunoblotting confirmed this finding (supplemental Fig. 1G, available at www.jneurosci.org as supplemental material). We also used a sensitive staining technique, based on the use of a VEGF164/alkaline phosphatase fusion protein (VEGF164-AP), to study Flk1 expression in the cerebellum. At P10, VEGF164-AP staining was strong in pial and parenchymal blood vessels, whereas a weaker but specific signal was detected in the deeper layer of the EGL (Fig. 1E,F; supplemental Fig. 1H, available at www.jneurosci.org as supplemental material). Control pharmacological experiments showed that VEGF164-AP bound to Flk1 in the lower EGL (Fig. 1G; supplemental Fig. 1I,J, available at www.jneurosci.org as supplemental material). A similar Flk1 expression pattern was observed in the postnatal cerebellum of P10 Flk1-GFP knock-in mice (Ema et al., 2006), immunostained for GFP (Fig. 1H), or in P8 rat cerebellum, immunostained with an anti-Flk1 antibody, previously used to identify Flk1+ neurons (Marko and Damon, 2008) (supplemental Fig. 1N, available at www.jneurosci.org as supplemental material). Double immunostaining for GFP and Sema6A further revealed that Flk1 was expressed by Sema6A+ postmitotic GCs (supplemental Fig. 1K–M, available at www.jneurosci.org as supplemental material). In addition, Flk1 was also expressed on the cell surface of postmitotic GCs and their radial leading process in in vitro cocultures of GCs and Bergmann glia fibers (Fig. 1I).
Of all VEGF receptors, only Flk1 was detected in postmitotic GCs. Indeed, staining of cerebellar sections (from P10 WT mice) using a fusion protein of placental growth factor (PlGF) (a VEGF homolog that binds to another VEGF receptor Flt1) and alkaline phosphatase (PlGF-AP) or immunostaining for neuropilin-1 (Npn-1) or neuropilin-2 (Npn-2) revealed that these receptors were not detectable in GCPs in the EGL, neither in postmitotic GCs in the EGL or ML. Instead, Flt1 and Npn-1 were expressed in vessels, whereas Npn-2 was detected in cells of the IGL (supplemental Fig. 1J,O,P, available at www.jneurosci.org as supplemental material). Similar data were obtained by RT-PCR analysis of isolated GCs (data not shown).
Granule cells and their growth cones are attracted by VEGF
To assess whether VEGF is a chemoattractant factor for postmitotic GCs, we first analyzed GC migration in a modified Boyden chamber assay (Lu et al., 2001). GCs that migrated to the lower side of the filter expressed postmitotic differentiation markers (data not shown). When VEGF (50 ng/ml) was added to the lower chamber, GC migration from the upper to the lower compartment was increased, comparably with the effect induced by BDNF, a known GC chemoattractant (Zhou et al., 2007). Indeed, relative to control, the number of GCs in the lower compartment was increased 3.7 ± 0.8-fold by VEGF (N = 11, experiments with triplicates; p < 0.01) and 5.2 ± 2.7-fold by BDNF (N = 5, experiments with triplicates; p < 0.05) (supplemental Table 2, available at www.jneurosci.org as supplemental material). This was attributable to a chemotropic activity of VEGF, and not to an effect on survival, proliferation, or chemokinesis, as supplementation of VEGF to the lower and upper chamber failed to enhance GC migration to the lower compartment (supplemental Table 2, available at www.jneurosci.org as supplemental material).
To confirm the role of VEGF as a chemoattractant for postmitotic GCs, we also analyzed whether VEGF could induce turning of growth cones of dissociated GCs, cultured on poly-lysine and laminin, in a standard growth cone turning assay. In this assay, dissociated GCs expressed nearly exclusively markers of postmitotic GCs in the inner EGL (data not shown). Topical application of control solution (PBS) did not induce any effect on growth cone orientation (Fig. 2A,B). In contrast, topical application of VEGF induced a clear turning response toward VEGF (Fig. 2C,D). In the control situation, a comparable number of growth cones turned toward (positive turning) or away (negative turning) from the medium, or failed to turn at all (no turning) (Fig. 2E,G). In contrast, when exposed to the VEGF gradient, all but one growth cone positively turned toward VEGF (Fig. 2F,G). The effect of VEGF was comparable with that of BDNF, a known chemoattractant factor for GCs (Borghesani et al., 2002; Li et al., 2005) (Fig. 2F,G). When measuring the turning angle, growth cones turned by −4.1 ± 5.5° in control conditions versus +35.8 ± 16.8° when exposed to VEGF (N = 12; p = 0.001 vs control) (Fig. 2H; supplemental Table 2, available at www.jneurosci.org as supplemental material). In this assay, VEGF was equipotent to BDNF (+24.7 ± 10.3°; N = 8; p < 0.05, vs control) (Fig. 2H; supplemental Table 2, available at www.jneurosci.org as supplemental material). Incubation with an anti-Flk1 blocking antibody (αFlk1) inhibited the VEGF-induced chemoattraction of GC growth cones (Fig. 2E,G,H), indicating that VEGF attracts growth cones of GCs via Flk1.
Figure 2.

VEGF chemoattracts GC growth cones. A–D, Representative GC growth cones at the onset (A) and 1 h (B) after application of control solution (PBS), or at the onset (C) and 1 h (D) after induction of VEGF gradient. The white arrows represent the orientation of VEGF or PBS application. E, F, Superimposed traces of growth cone trajectories in response to topical application of PBS (E, black curves), to a BDNF gradient (F, black traces), to a VEGF gradient (F, red traces) or to a VEGF gradient in the presence of αFlk1 (E, red traces). The black arrows denote the orientation of the PBS, VEGF, or BDNF gradient application. The tick marks along the x- and y-axis represent 2 μm. G, Scatterplots illustrating the turning responses of growth cones to topical application of PBS (black dots, left panel), to a BDNF gradient (black dots, right panel), to a VEGF gradient (red dots, right panel) or to a VEGF gradient in the presence of αFlk1 (red dots, left panel). H, Histogram representing the average turning angle of growth cones when exposed to PBS, a BDNF gradient, or a VEGF gradient with and without αFlk1. Note the chemoattractive response induced by VEGF (N = 8–11; **p < 0.001). Error bars indicate SEM. Scale bar: A–D, 5 μm.
Reduced VEGF levels delay granule cell migration in VEGF∂/∂ mice
We then performed a number of loss- and gain-of-function experiments to provide genetic evidence that endogenous VEGF regulates GC migration in vivo. We therefore used the hypomorphic VEGF∂/∂ mouse line, in which deletion of a regulatory cis-element in the VEGF promoter reduced VEGF levels (Oosthuyse et al., 2001). RT-PCR analysis revealed that VEGF mRNA levels were reduced in cerebella of VEGF∂/∂ mice at P12 (copies VEGF mRNA per 105 copies β-actin mRNA: 19 ± 2 in WT vs 10 ± 2 in VEGF∂/∂; N = 5; p < 0.05) (supplemental Table 3, available at www.jneurosci.org as supplemental material). Cerebellar VEGF protein levels were also lower in P10 VEGF∂/∂ mice (pg VEGF/mg protein: 24.2 ± 1.2 in WT vs 17.9 ± 0.9 in VEGF∂/∂; N = 10; p = 0.001) (supplemental Table 3, available at www.jneurosci.org as supplemental material). In addition, in P12 VEGF∂/∂ mice, the VEGF-immunoreactive signal was weaker in PC bodies, barely visible in PC dendrites in the ML, and undetectable in the PC dendritic tips at the ML/EGL border (Fig. 3A–D).
To study GC migration in vivo, we analyzed the laminar distribution of migrating GCs. Using a widely used technique (Borghesani et al., 2002; Vaillant et al., 2003; Chen et al., 2005; Friedel et al., 2007), P10 mice were injected with BrdU to label GCPs and killed 2 d later to analyze the number of BrdU-labeled (BrdU+) GCs present in the EGL, ML, and IGL. Immunostaining for BrdU was complemented with VEGF immunostaining to confirm the reduced VEGF levels in VEGF∂/∂ mice. By P12, more BrdU+ cells were found in the IGL in WT than in VEGF∂/∂ mice (Fig. 3E,F). More precisely, 25% fewer BrdU+ GCs reached their destination in VEGF∂/∂ mice (BrdU+ cells in IGL, expressed as percentage of total BrdU+ cells in EGL, ML, and IGL: 24.8 ± 0.6% in WT vs 18.5 ± 2.6% in VEGF∂/∂; N = 5; p < 0.05) (supplemental Table 3, available at www.jneurosci.org as supplemental material).
The impairment in GC migration in VEGF∂/∂ mice was confirmed by additional methods. When taking advantage of the fact that postmitotic GCs in the deeper EGL layers express the cell cycle inhibitor p27 (Miyazawa et al., 2000), more BrdU+ GCs stalled in the p27+ EGL area in P12 VEGF∂/∂ mice (BrdU+ cells in p27+ EGL area, percentage of BrdU+ cells in total EGL: 38.8 ± 1.8% in WT vs 44.8 ± 0.7% in VEGF∂/∂; N = 5; p < 0.05) (Fig. 3G,H; supplemental Table 3, available at www.jneurosci.org as supplemental material). Consistent with a defect in GC migration, significantly more p27+ cells accumulated in the EGL of VEGF∂/∂ than in WT mice (Table 1). Morphometry confirmed that the EGL was thicker in P12 VEGF∂/∂ mice (EGL area, percentage of total cerebellar cortex area in lobe IX: 4.8 ± 0.6% in WT vs 8.3 ± 1.1% in VEGF∂/∂; N = 5; p < 0.05) (supplemental Table 3, available at www.jneurosci.org as supplemental material). Additional analysis showed that proliferating Ki67+ GCs were only found in the upper EGL, whereas postmitotic p27+ GCs were only present in the lower EGL, indicating that the upper and lower EGL are properly segregated (supplemental Fig. 2E,F, available at www.jneurosci.org as supplemental material). Also, there were no genotypic differences in the density of Pax6+ cells (Table 1), or in the number of Ki67+ cells in the EGL (Table 1), indicating normal formation of the upper EGL and proliferation of GCPs. Normal proliferation rate of GCPs in VEGF∂/∂ mice was further confirmed by BrdU+ labeling and phosphohistone 3 (PH3+) immunostaining (supplemental Fig. 2A,B, available at www.jneurosci.org as supplemental material; Table 1). The reduced GC migration in VEGF∂/∂ mice was also not attributable to differences in GC apoptosis (Table 1), or GC differentiation (Fig. 3I,J; supplemental Fig. 2E,F,I,J,M,N, available at www.jneurosci.org as supplemental material; Table 1). We could also not detect developmental defects of PCs or Bergmann glia fibers (supplemental Fig. 3A,B, supplemental Table 3, available at www.jneurosci.org as supplemental material). The shape and patterning of the folia, and overall cerebellar structure were also comparable (supplemental Table 3, available at www.jneurosci.org as supplemental material) (data not shown). Also, staining for the endothelial marker CD31 revealed no angiogenic defects at P12 (Fig. 3K,L; Table 1). Additional vascular and metabolic studies showed no overt signs of ischemia (data not shown) or metabolic insufficiency in VEGF∂/∂ cerebella (supplemental Fig. 3G, supplemental Table 4, available at www.jneurosci.org as supplemental material).
Table 1.
Normal GC proliferation, differentiation, cell death, and blood vessel density in VEGF∂/∂ and VEGF188/188 mice
| WT | VEGF∂/∂ | VEGF188/188 | p value | |
|---|---|---|---|---|
| P27+ GCs—lower EGL (P10) (p27+ GCs/100 μm EGL) | 38.5 ± 3.0 | 55.3 ± 5.6 | p < 0.05 | |
| Pax6 density (P10) (Pax6+ GCs/103 μm2 EGL) | 26.1 ± 4.1 | 27.6 ± 3.4 | p = NS | |
| GCP proliferation—upper EGL (P10) (Ki67+ GCs/100 μm EGL) | 33.6 ± 3.0 | 37.8 ± 1.5 | p = NS | |
| GCP proliferation (P10) (BrdU+ GCs/100 μm EGL) | 26.5 ± 1.5 | 23.3 ± 1.3 | p = NS | |
| GCP proliferation (P10) (PH3+ GCs/mm EGL length) | 13.2 ± 1.4 | 14.5 ± 2.2 | p = NS | |
| GC apoptosis (P10) (act-casp-3+ GCs/105 μm2 EGL) | 10.9 ± 0.6 | 10.9 ± 0.9 | p = NS | |
| Blood vessel density (P12) (CD31+ area, as % of total cerebellum area) | 5.7 ± 0.8 | 4.8 ± 0.8 | p = NS | |
| P27+ GCs—lower EGL (P12) (p27+ GCs/100 μm EGL) | 26.2 ± 1.6 | 17.6 ± 2.0 | p < 0.05 | |
| Pax6 density (P12) (Pax6+ GCs/103 μm2 EGL) | 29.7 ± 0.7 | 27.1 ± 1.3 | p = NS | |
| GCP proliferation—upper EGL (P12) (Ki67+ GCs/100 μm EGL) | 12.0 ± 1.4 | 12.0 ± 1.0 | p = NS | |
| GCP proliferation (P10) (BrdU+ GCs/100 μm EGL area) | 19.4 ± 0.5 | 19.3 ± 1.7 | p = NS | |
| GC proliferation (P10) (PH3+ GCs/mm EGL length) | 17.8 ± 2.5 | 18.8 ± 1.4 | p = NS | |
| GC apoptosis (P10) (act-casp-3+ GCs/105 μm2 EGL) | 10.6 ± 0.8 | 10.6 ± 0.7 | p = NS | |
| Blood vessel density (P12) (CD31+ area, as % of total area) | 4.2 ± 0.6 | 4.1 ± 0.6 | p = NS |
Analysis in older and adult VEGF∂/∂ mice revealed that GCs eventually resumed migration (supplemental Table 3, available at www.jneurosci.org as supplemental material); the transient nature of this migratory defect is likely attributable to the moderate reduction of VEGF protein levels in the cerebellum of these hypomorphic mice and to a possible compensation by other cues. A transient impairment of GC migration has been also reported in BDNF−/− mice (Schwartz et al., 1998; Borghesani et al., 2002).
Ectopic VEGF expression in the EGL perturbs granule cell migration
To further examine the chemotropic role of VEGF in GC migration, we performed VEGF gain-of-function experiments. In normal cerebellar development, VEGF is produced by PC bodies and dendrites, but not by GCs in the EGL; VEGF levels are also higher in the PCL/lower ML than in the EGL/lower ML (see above). If this spatial expression pattern is critical for GC migration, then ectopic VEGF expression in the EGL would be expected to perturb this process. We therefore overexpressed VEGF in GCs in the EGL by electroporating a VEGF expression plasmid in P10 cerebella [using conditions known to transfect primarily GCs in the EGL (Savill et al., 2005; Renaud et al., 2008)] and cultured slices of electroporated cerebella ex vivo for 4 d. These organotypic cultures, in which the cytoarchitecture of the developing cerebellum is preserved, are an established model to study GC migration (Komuro and Rakic, 1998; Solecki et al., 2004; Savill et al., 2005). To identify electroporated GCs, a GFP expression plasmid was also electroporated. Double immunostaining for GFP and markers of various cerebellar cell types confirmed that >95% of GFP+ cells were GCs (supplemental Fig. 4, available at www.jneurosci.org as supplemental material). Another advantage of this model is that the role of VEGF in GC migration can be studied independently of its vascular effects, as vessels degenerate in these cultures (Fig. 4A–D) (Rosenstein et al., 1998; Moser et al., 2003). Electroporation of the VEGF expression plasmid upregulated VEGF mRNA levels by 250% in these slices (Fig. 4E).
To quantify the migration of GFP+ GCs in electroporated slices, the cerebellar cortex was divided in five equally spaced areas, and the number of GFP+ GCs that had reached each of these areas was counted (for scheme, see Fig. 4F). GC counts per area in VEGF-electroporated slices were then compared with those in control slices, and the genotypic difference calculated (in percentage). Both this quantitative analysis and microscopic inspection revealed that ectopic VEGF expression caused a fraction of GCs to stall in areas closer to the EGL, whereas fewer GCs reached the PCL and IGL (Fig. 4G,H; Table 2). Moreover, time-lapse video-imaging revealed that GCs were entrapped in the vicinity of the EGL in VEGF-overexpressing slices (supplemental Movies 2, 3, available at www.jneurosci.org as supplemental material). In some cases, the radial leading process of GCs even turned back toward the EGL shortly after initiation of radial migration (supplemental Movie 2, available at www.jneurosci.org as supplemental material), a process that was never observed in control slices (supplemental Movie 1, available at www.jneurosci.org as supplemental material). Analysis of GC proliferation and cell death revealed no differences in VEGF-overexpressing slices when compared with control slices (data not shown). Although technical reasons do not allow us to formally exclude that ectopic expression of VEGF in GCs might influence GC differentiation, our results suggest that ectopic VEGF expression in the EGL perturbs GC migration.
Table 2.
Ectopic expression of VEGF or inhibition of Flk1 in cerebellar slices inhibits GC migration
| Area | Ectopic VEGF overexpression | αFlk1 | PTK |
|---|---|---|---|
| 1 | +14.0%** | +16.2%** | +30.0%** |
| 2 | −4.0% | +2.7% | −6.0% |
| 3 | −18.0%** | −19.31%** | −48.0%** |
| 4 | −22.0%** | −33.78%** | −66.0%** |
| 5 | −26.0%** | ND | ND |
Area 1–5 represent equally divided areas of the cerebellar cortex, from the EGL/ML border to the IGL (Fig. 4F), and the number of GFP+ GCs that migrated into each of these areas was counted in control cerebellar slices, in slices coelectroporated with the VEGF expression vector and a GFP expression vector, or in slices electroporated with a GFP expression vector and treated with αFlk1 antibody or the VEGF receptor inhibitor PTK. The observed number of GCs in each area in the treated slices was then statistically compared, using binomial nonparametric statistics, with the expected number of GCs, as detected in control slices. The difference between the observed versus expected number of cells in each area was expressed as a percentage of the expected number of cells. Data of PTK and αFlk1 treatment in area 5 could not be determined (ND) because of the low amount of cells present in this area.
**p ≤ 0.001 versus corresponding controls.
To start exploring the underlying mechanisms of VEGF's chemotactic activity, we addressed two questions: first, are matrix-binding VEGF isoforms involved, and second, is Flk1 directly mediating VEGF signaling?
A matrix-binding VEGF isoforms gradient is present in the developing cerebellum
Alternative splicing generates various VEGF isoforms, which differ in molecular weight, receptor binding specificity, and affinity for heparin-rich extracellular matrix proteins (Ferrara et al., 2003). The short VEGF120 isoform is freely diffusible, whereas the long VEGF188 isoform sticks to heparin-rich matrix, and the VEGF164 isoform exhibits an intermediate profile (Ferrara et al., 2003). All three isoforms bind to Flk1. Previous studies using knock-in mice, selectively expressing a single VEGF isoform, showed that a pericellular VEGF gradient of these isoforms is critical for normal vessel branching morphogenesis (Stalmans et al., 2002, 2003; Ruiz de Almodovar et al., 2009). In contrast to VEGF120, VEGF188 promotes endothelial navigation along matrix scaffolds (Stalmans et al., 2002, 2003). We therefore explored whether a similar VEGF isoforms gradient also exists in the cerebellum.
To address this question, we first determined the expression of the VEGF isoforms in cerebella of P12 WT mice. Quantitative RT-PCR analysis revealed that VEGF164 was more abundant than the other isoforms (copies VEGF isoform mRNA per 106 copies β-actin mRNA: 28 ± 2, 143 ± 10, and 7.0 ± 0.3 for VEGF120, VEGF164, and VEGF188, respectively; N = 5) (supplemental Table 1, available at www.jneurosci.org as supplemental material). As none of the available anti-VEGF antibodies discriminates between the distinct isoforms, we used VEGF120/120, VEGF164/164, and VEGF188/188 knock-in mice (which express selectively the indicated isoform) and a pan-anti-VEGF antibody that recognizes all isoforms to visualize the spatial expression pattern of the soluble and matrix-bound VEGF isoforms. Immunostaining revealed that the pattern of VEGF expression in VEGF164/164 mice was similar as in WT mice (data not shown), whereas PC bodies and individual dendritic branches in VEGF188/188 mice were strongly labeled, even up to their very extremities (Fig. 5B,D). In contrast, in VEGF120/120 mice (see further), only PC bodies but not dendrites were labeled, and some diffuse labeling distant from the PC bodies was observed (supplemental Fig. 5B, available at www.jneurosci.org as supplemental material). This staining pattern suggested higher pericellular VEGF levels (and likely also a steeper pericellular VEGF gradient) around PC dendrites and cell bodies in VEGF188/188 than VEGF120/120 mice. Also, compared with a soluble VEGF isoform, a matrix-bound VEGF isoform is expected to create a steeper radial VEGF gradient from the deeper to upper cerebellar layers, as unrestricted diffusion of VEGF would ultimately abrogate such a gradient. We therefore used these strains to evaluate the importance of pericellular matrix-bound VEGF deposits in GC migration.
Figure 5.
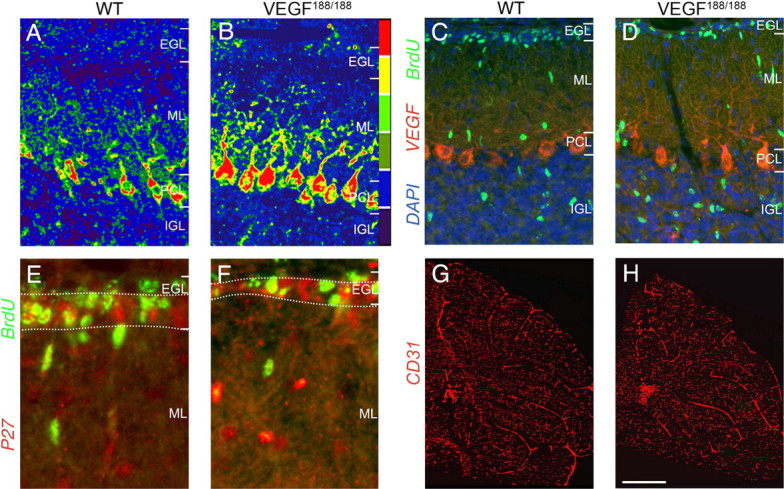
Accelerated GC migration in VEGF188/188 mice. A, B, Pseudocolor images of VEGF immunostaining in P12 cerebella, revealing stronger labeling of Purkinje cell bodies and dendritic extensions in VEGF188/188 (B) than WT (A) mice. C, D, Double immunolabeling for BrdU (green) and VEGF (red), combined with DAPI counterstaining (blue) in the cerebellum of P12 mice, revealing more BrdU+ GCs in the IGL in VEGF188/188 (D) than WT (C) mice. E, F, Double immunostaining for BrdU (green) and p27 (red), labeling postmitotic neurons in the inner two-thirds of the EGL as marked by dotted lines, revealing a smaller p27+ area in VEGF188/188 (F) than WT (E) mice. Note the reduced number of double-labeled yellow BrdU+/p27+ GCs in the VEGF188/188 mouse. G, H, Immunostaining for CD31 (red) revealing comparable microvasculature in the cerebellum of VEGF188/188 (H) and WT (G) mice. Scale bar: A–D, 65 μm; E, F, 20 μm; G, H, 320 μm.
Matrix-binding VEGF isoforms are required for normal GC migration
We first analyzed GC migration in VEGF164/164 mice using the above-mentioned BrdU-labeling protocol and found that GC migration was normal. Indeed, counting of BrdU+ GCs in the IGL revealed no differences in GC migration (BrdU+ cells in IGL, percentage of total BrdU+ cells in EGL, ML, and IGL: 22.6 ± 0.5% in WT vs 20.9 ± 0.8% in VEGF164/164; N = 6–5; p = NS) (supplemental Table 5, available at www.jneurosci.org as supplemental material). The microvascular density in the cerebellum of these mice was also normal (CD31+ area, expressed as percentage of total cerebellar area: 4.2 ± 0.6% in WT vs 4.1 ± 0.8% in VEGF164/164; N = 5; p = NS) (supplemental Table 5, available at www.jneurosci.org as supplemental material). The normal GC migration in VEGF164/164 mice is not surprising, when considering that VEGF164 has intermediate matrix-bound properties and is the most abundant isoform in WT mice.
We then analyzed GC migration at P12 in VEGF188/188 knock-in mice, engineered to express only the matrix-binding short-range acting VEGF188 isoform. GC migration was enhanced in these mice, as 35% more BrdU+ GCs reached their final position (BrdU+ cells in IGL, percentage of total BrdU+ cells in EGL, ML, and IGL: 22.6 ± 0.5% in WT vs 30.7 ± 1.5% in VEGF188/188; N = 6–5; p < 0.001) (Fig. 5C,D; supplemental Table 6, available at www.jneurosci.org as supplemental material). Also, fewer BrdU+ GCs stalled in the p27+ area (BrdU+ cells in p27+ area, percentage of total BrdU+ cells in the EGL: 45.9 ± 0.6% in WT vs 39.6 ± 0.9% in VEGF188/188; N = 5–3; p < 0.01) (Fig. 5E,F; supplemental Table 6, available at www.jneurosci.org as supplemental material) and the EGL area was thinner (area of EGL, percentage of total area of the total cerebellar cortex in lobe IX: 6.9 ± 0.3% in WT vs 5.1 ± 0.5% in VEGF188/188; N = 5; p < 0.05) (supplemental Table 6, available at www.jneurosci.org as supplemental material). Consistent with an enhanced GC migration, there were fewer p27+ cells in the EGL in VEGF188/188 mice compared with WT mice (Table 1). Additional analysis showed that proliferating Ki67+ GCs were only found in the upper EGL, whereas postmitotic p27+ GCs were only found in the lower EGL, indicating that the upper and lower EGL are properly segregated in these mice (supplemental Fig. 2G,H, available at www.jneurosci.org as supplemental material). Also, there were no genotypic differences in the density of Pax6+ cells (Table 1), or in the number of Ki67+ cells in the EGL (Table 1), indicating normal formation of the upper EGL and proliferation of GCPs. Normal proliferation rate of GCPs in VEGF188/188 mice was further confirmed by BrdU+ labeling and phosphohistone 3 (PH3+) immunostaining (supplemental Fig. 2C,D, available at www.jneurosci.org as supplemental material; Table 1). This phenotype was not attributable to changes in GC apoptosis (Table 1) or differentiation (supplemental Fig. 2G,H,K,L,O,P, available at www.jneurosci.org as supplemental material; Table 1), neither to defects in Bergmann glia fibers or PCs (supplemental Fig. 5C,D, available at www.jneurosci.org as supplemental material). VEGF188/188 cerebella also had normal vascular densities (Fig. 5G,H; Table 1), consistent with previous findings (Stalmans et al., 2003); oxygenation and metabolic parameters were also normal (supplemental Fig. 3G, supplemental Table 4, available at www.jneurosci.org as supplemental material). Thus, a matrix-bound VEGF isoform, which increases pericellular VEGF levels (and therefore likely also steepens the pericellular and radial VEGF concentration gradient), facilitates/enhances GC migration.
To explore whether long-range acting VEGF isoforms are necessary for GC migration, we analyzed VEGF120/120 knock-in mice, expressing only VEGF120. As most homozygous VEGF120/120 mice die within a few days after birth (Carmeliet et al., 1999), we could use only a few VEGF120/120 mice (of hundreds of litters), which survived long enough for the analysis of GC migration. Since not a single VEGF120/120 mouse survived up to P12, we injected BrdU at P7 and counted BrdU+ GCs at P9. This analysis revealed that 42% fewer postmitotic GCs reached the IGL in VEGF120/120 mice (BrdU+ cells in IGL, expressed as percentage of total BrdU+ cells in EGL, ML, and IGL: 23.5 ± 1.3% in WT vs 11.5 ± 2.1% in VEGF120/120; N = 3; p = 0.008) (supplemental Fig. 5C,D, supplemental Table 7, available at www.jneurosci.org as supplemental material). Consistent with previous findings in other organs (Carmeliet et al., 1999; Mattot et al., 2002; Maes et al., 2004), fewer vessels developed in VEGF120/120 cerebella (CD31+ area, percentage of total area: 2.8 ± 0.4% in WT vs 1.3 ± 0.3% in VEGF120/120; N = 3; p < 0.05) (supplemental Fig. 5E,F, supplemental Table 7, available at www.jneurosci.org as supplemental material). Double immunolabeling for GFAP and calbindin revealed a normal number, radial organization, and location of Bergmann glia fibers and PCs (supplemental Fig. 3E,F, available at www.jneurosci.org as supplemental material). Thus, the presence of only a diffusible VEGF isoform, which results in lower pericellular VEGF (and, therefore, likely also in a more shallow pericellular and radial VEGF concentration gradient), impairs GC migration and indicates that matrix-bound VEGF isoforms are required for proper GC migration.
VEGF matrix-binding isoforms facilitate GC adhesion
We finally explored whether matrix-binding VEGF isoforms could facilitate the positioning of postmitotic GCs onto Bergmann glia fibers, along which they slide inwardly, by promoting their attachment. However, since recombinant VEGF188 cannot be purified because of its matrix-binding properties, and GCs require a matrix substrate to adhere to culture dishes, we tested whether GCs would attach preferentially to cells, expressing the matrix-binding VEGF isoforms. HEK-293 cells, stably expressing a single VEGF isoform (HEK-VEGF188, HEK-VEGF164, HEK-VEGF120) or mock control (HEK-Mock), were plated onto uncoated dishes at sparse confluency. We then added a fixed number of purified GCs with the various types of HEK-293 cells overnight. Since purified GCs only survive if they adhere to these cellular substrates in this assay (they cannot adhere to the uncoated dish), we counted the number of adhered GCs per HEK-293 cell (the conditions were selected such that, on average, three GCs could adhere to one HEK-293 cell). This analysis revealed that more GCs attached to HEK-VEGF188 or HEK-VEGF164 cells than to HEK-VEGF120 or HEK-Mock cells (supplemental Fig. 6, available at www.jneurosci.org as supplemental material). Thus, adhesion of postmitotic GCs is facilitated onto cells expressing matrix-binding VEGF isoforms.
Together, our results suggest that matrix-binding VEGF isoforms (VEGF188 and VEGF164), expressed by PC dendrites, located in close vicinity to Bergmann glia fibers, and possibly by Bergmann glia, function as a local chemoattractant and/or adhesive cue for postmitotic GCs toward the glia fibers and thereby control their migration.
Inhibition of Flk1 impedes granule cell migration
As described above, Flk1 is expressed in GCs. We thus assessed whether Flk1 mediates the chemotropic effect of VEGF by supplementing αFlk1 or the VEGF receptor tyrosine kinase inhibitor PTK787 (PTK) (Thomas et al., 2005) to the aforementioned ex vivo model of electroporated cerebellar slices. Both αFlk1 and PTK impaired GFP+ GC migration when electroporated slices were incubated in their presence during 4 d (Fig. 6A,B; Table 1). For instance, in PTK-treated slices, area 1 (close to the EGL/ML border) contained 30% more GCs, whereas 66% fewer GCs reached area 4 in the deeper layers of the IGL (Table 2). Notably, treatment of slices with αFlk1 for a longer period (8 d) caused a persisting GC migration defect (area 1 contained 27% more GCs, whereas 28% fewer GCs reached area 4). Thus, inhibition of Flk1 in cerebellar slices impaired GC migration.
Figure 6.
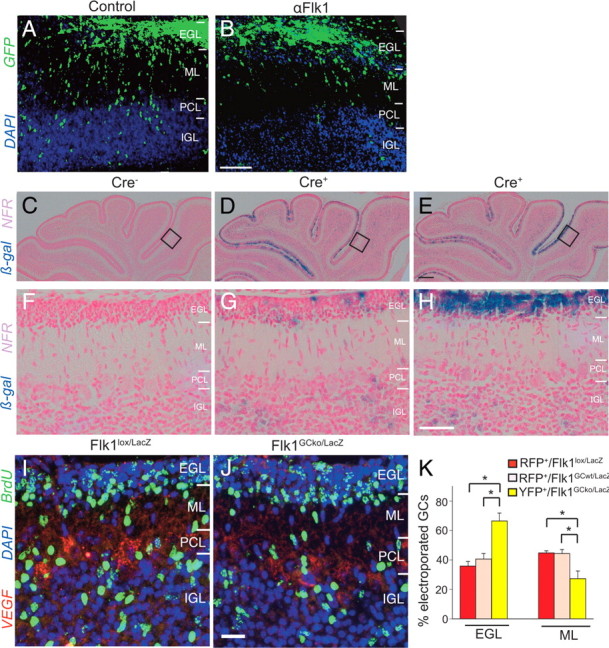
GC migration defects in GC-specific Flk1 conditional knock-out mice. A, B, Confocal microscopy of electroporated cerebellar slices after 4 d in culture, revealing that more GFP+ GCs migrated into the PCL/IGL in control IgG-treated slices (A) than in αFlk1-treated slices (B). C–H, Images at low (C–E) and high (F–H) magnification of β-galactosidase enzymatic staining (β-gal, blue), combined with nuclear fast red counterstaining (NFR, pink), of cerebella from Math1CreER × R26R-stop-LacZ mice at P8, revealing absence of blue staining in the Cre− mouse (C, F), and the mosaic and variable presence of β-gal+ cells in two different Cre+ littermates (D, E, G, H). I, J, Immunostaining for BrdU (green) and VEGF (red) combined with DAPI counterstaining (blue) of cerebella of P8 mice, revealing impaired migration of BrdU+ GCs in Flk1GCko/LacZ mice (J) compared with Flk1lox/LacZ mice (I). K, Quantification of the percentage of RFP+/Flk1lox/LacZ GCs (red bar), RFP+/Flk1GCwt/LacZ GCs (pink bar), and YFP+/Flk1GCko/LacZ GCs (yellow bar) present in the EGL and ML of slices, electroporated with the Brainbow1.0 plasmid and treated with tamoxifen (P8), indicating that more Flk1-depleted than Flk1-expressing GCs stalled in the EGL. In each case, the number of electroporated GCs in the EGL and ML was expressed as percentage of total Brainbow-electroporated GCs in the EGL, ML, and IGL. Even though labeled GCs migrated to the IGL, their numbers were too low to allow robust statistical analysis. Error bars indicate SEM; *p < 0.05. Scale bars: A, B, 100 μm; C–E, 200 μm; F–H, 50 μm; I, J, 100 μm.
To determine whether the impaired GC migration could be attributable to primary defects in GC tangential migration, we quantified the speed of GC tangential migration in cerebellar slices treated with αFlk1. We therefore electroporated GCs with a GFP expression vector, cultured them for 48 h in the presence or absence of αFlk1, and performed time-lapse analysis. Quantification of the tangential migration speed revealed no differences between control and αFlk1-treated slices (4.57 ± 0.17 μm/h in control vs 4.68 ± 0.20 μm/h in αFlk1-treated slices; p = NS; N = 246–242). Thus, inhibition of Flk1 does not impair tangential migration of GCs in cerebellar slices.
Impaired granule cell migration in GC-specific Flk1 knock-out mice
To underscore that VEGF regulates GC migration via a direct effect on postmitotic GCs, we generated mice with selective loss of Flk1 in these cells. We therefore used a Cre-driver line, expressing a tamoxifen-inducible form of Cre (CreER™; abbreviated as CreER) under the control of the Math1 promoter (Math1CreER mice) (Chow et al., 2006). To analyze the expression pattern of CreER, we intercrossed this line with the R26R-stop-LacZ reporter line and administered tamoxifen to pregnant mothers at E17 (pilot experiments showed that delivery of tamoxifen at this time point yielded optimal results). Analysis of the pups at P8 revealed that CreER was active only in some GCs, but in a very heterogeneous and mosaic pattern, which was even variable from mouse to mouse in the same litter (Fig. 6C–H). Since Cre-mediated recombination is inefficient in Flk1lox/lox mice and often only inactivates a single floxed Flk1 allele (Maes et al., 2010), we used Flk1lox/LacZ mice, harboring one floxed and one inactivated Flk1 allele to increase the chance of Flk1 elimination. A maximal tolerable dose of tamoxifen was delivered to pregnant mothers, carrying [Math1CreER+ × Flk1lox/LacZ] embryos (termed Flk1GCko/LacZ) as well as [Math1CreER− × Flk1lox/LacZ] embryos (termed Flk1lox/LacZ). PCR analysis of genomic DNA from purified GCs of Flk1GCko/LacZ pups at P8 revealed that CreER-mediated recombination did not occur in all GCs (supplemental Fig. 7, available at www.jneurosci.org as supplemental material). Nonetheless, 28% fewer BrdU+ GCs reached the IGL in Flk1GCko/LacZ pups than in Flk1lox/LacZ control pups (BrdU+ cells in IGL, percentage of total BrdU+ cells in EGL, ML and IGL: 35.9 ± 1.0% in Flk1lox/LacZ vs 25.9 ± 1.3% in Flk1GCko/LacZ; N = 9–5; p < 0.0001) (Fig. 6I,J; supplemental Table 8, available at www.jneurosci.org as supplemental material; BrdU injected at P6 and analyzed at P8). Thus, despite the mosaic activation of CreER, GC-specific inactivation of Flk1 impaired GC migration. Analysis of older (P21) Flk1GCko/LacZ mice revealed that GCs eventually resumed migration since a similar percentage of BrdU+ GCs was present in the IGL of Flk1GCko/LacZ and Flk1lox/LacZ mice at this age (supplemental Table 8, available at www.jneurosci.org as supplemental material). Moreover, cerebella size and foliation were also similar between these genotypes (supplemental Table 8, available at www.jneurosci.org as supplemental material) (data not shown).
In a final effort to circumvent the problem of the mosaic expression of Cre and to analyze selectively the migration of those GCs, in which CreER was active, we electroporated ex vivo the Brainbow1.0 plasmid in cerebella of [Math1CreER+ × Flk1lox/LacZ] mice that had not received tamoxifen yet. The Brainbow1.0 plasmid is a construct in which the cDNA of red (RFP), yellow (YFP), and blue (M-CFP) fluorescent proteins are flanked by incompatible sets of lox sites, such that RFP is expressed in baseline conditions, but expression of YFP or M-CFP is induced on Cre-recombination (Livet et al., 2007). On tamoxifen treatment of [Math1CreER+ × Flk1lox/LacZ] cerebellar slices, electroporated with Brainbow1.0, CreER-activated GCs expressed YFP and could thus be distinguished from GCs that did not express CreER; these YFP+ GCs were assumed to have the Flk1 floxed allele excised and termed YFP+/Flk1GCko/LacZ (for unknown reasons, possibly because of less efficient access of CreER to the lox sites flanking M-CFP, expression of M-CFP was very weak). In other electroporated GCs, CreER was not (sufficiently) expressed or tamoxifen failed to activate CreER sufficiently to induce a color switch to YFP and hence were assumed to have still a functional Flk1 allele (floxed allele not excised); these GCs were termed RFP+/Flk1GCwt/LacZ and served as controls. As another control, we also electroporated Brainbow1.0. in cerebella of Flk1lox/LacZ pups, which did not carry the CreER gene and thus retained their RFP color; these RFP+ GCs were termed RFP+/Flk1lox/LacZ. Counting of these labeled GCs revealed that 44% of the RFP+/Flk1GCwt/LacZ GCs reached the ML, whereas 41% was still present in the EGL (Fig. 6K, pink bar). Similar results were obtained with the other control RFP+/Flk1lox/LacZ GCs (Fig. 6K, red bar), indicating that when CreER is not present/active and Flk1 is thus still expressed, GC migration occurs normally. However, compared with these control GCs, 63% more YFP+/Flk1GCko/LacZ GCs were present in the EGL, whereas 39% fewer of YFP+/Flk1GCko/LacZ GCs reached the ML (N = 6; p < 0.05 vs controls) (Fig. 6K, yellow bar), indicating that when CreER was active, GC migration was impaired. Thus, specific Flk1 inactivation also ex vivo impairs GC migration.
Although we cannot formally rule out the theoretical possibility that in some YFP+ GCs, the floxed Flk1 allele was not excised, the combination of the in vivo and ex vivo experiments strongly suggest that Flk1 expression is necessary for proper GC migration during cerebellar development.
Discussion
In this study, we demonstrate for the first time that VEGF guides GC migration in vivo through a direct chemoattractive effect via Flk1 signaling. Analysis based on the use of several techniques revealed that postmitotic GCs in the EGL express detectable levels of Flk1 in the cerebellum in situ. Additional studies in vitro indicate that Flk1 is present in the soma and radial leading process of postmitotic GCs, when migrating along glia fibers, whereas biochemical and molecular biological studies confirmed the presence of Flk1 in isolated GCs. Moreover, we provide several lines of evidence that VEGF, through a direct effect on its signaling receptor Flk1, regulates GC migration. First, in vitro data show that purified GCs and their growth cones are chemoattracted by VEGF and that this effect is blocked by αFlk1. Also, in another study (our unpublished data), we show that VEGF enhances NMDA-type glutamate receptor (NMDAR)-mediated Ca2+ influx and currents via activation of Flk1, and that this effect can be blocked by αFlk1 or a VEGF receptor tyrosine kinase inhibitor. Second, GC-specific deletion of Flk1 in vivo or pharmacological inhibition of Flk1 (signaling) ex vivo delayed GC migration, thereby providing additional supportive evidence that Flk1 on postmitotic GCs mediates the chemoattractive effects of VEGF. Third, GC migration defects were unlikely attributable to changes in cerebellar vascularization, as GC migration was impaired in VEGF∂/∂ mice without observable vessel or oxygenation defects; also, postmitotic GCs migrated normally in cerebellar slices, even when blood vessels were not perfused and regressed.
The analysis of knock-in mice, expressing selectively a single VEGF isoform, highlights that matrix-binding VEGF isoforms promote GC migration. Indeed, replacement of soluble VEGF isoforms with the matrix-bound VEGF188 isoform in VEGF188/188 mice facilitated/enhanced migration of GCs, whereas the opposite phenotype was found when mice expressed solely a soluble VEGF120 isoform in VEGF120/120 mice. Such a role for the matrix-binding VEGF188 isoform in neuronal guidance has not been documented yet. Another study reported that the guidance effects of the VEGF164 isoform for the somata of motoneurons relied on its selective binding to Npn-1, but in this study, a spatial VEGF isoform concentration gradient was not invoked as a possible underlying mechanism (Schwarz et al., 2004). In addition, navigation of axon growth cones of these motoneurons occurred independently of VEGF (Schwarz et al., 2004). Furthermore, a recent study challenged that only the VEGF164 isoform is capable of binding to Npn-1 and documented similar binding capacity for VEGF120 (Pan et al., 2007). Together, the precise mechanisms of how VEGF controls neuron migration are still ill defined. Since GCs do not express Npn-1 in vivo (Solowska et al., 2002; this study), the VEGF isoforms must regulate GC migration via a distinct mechanism in the cerebellum. Also, contrary to the effects of VEGF on motoneuron migration, GCs and their growth cones were chemoattracted by VEGF in vitro and ex vivo, implying distinct mechanisms of GC migration. We therefore favor the interpretation that the VEGF isoforms are important for establishing a spatial VEGF concentration gradient that promotes GC chemoattraction.
Immunostaining for VEGF showed that the PC soma and dendrites were more strongly labeled and better identifiable as sharply demarcated extensions in VEGF188/188 mice, whereas these structures were more vaguely and diffusely marked in VEGF120/120 mice. These findings suggest that the matrix-bound VEGF188 isoform is associated more closely around the cell surface of PCs, whereas the soluble VEGF120 isoform diffuses further away from its producer cell. It is tempting to speculate that such a different type of pericellular VEGF isoform concentration gradient may help to explain the observed phenotypes. Indeed, not only the pericellular VEGF isoform concentration gradient locally around the PC dendrites and Bergman glia fibers, but also the VEGF concentration gradient in the radial direction from the deeper to upper cerebellar layers would be expected to be steeper in VEGF188/188 mice and to be more shallow in VEGF120/120 mice. Indeed, matrix-associated isoforms are instrumental in establishing and maintaining a spatial concentration gradient, whereas freely diffusible isoforms would spread out in a more scattered pattern and dilute out the gradient. Heparan sulfate proteoglycans (HSPGs) in the EGL (Rubin et al., 2002) known to interact with the heparin-binding VEGF188 and VEGF164 isoforms (Ferrara et al., 2003), can provide an additional level of regulation and further fine-tune GC migration, as HSPG-bound VEGF induces distinct Flk1 signaling responses than unbound VEGF (Jakobsson et al., 2006; Chen et al., 2010). Whether HSPGs are present in spatiotemporal patterns/gradients in the cerebellar layers, which can favor GC migration, remains to be explored.
The differences in GC migration in the VEGF isoform-specific mice can be explained by several complementary, nonexclusive mechanisms via which matrix-binding VEGF isoforms modulate this process. First, VEGF might bind to Flk1 on postmitotic GCs in the EGL and modulate their tangential migration. Indeed, VEGF-producing PC dendrites are positioned in the ML all along the EGL/ML border, Flk1 is expressed in postmitotic GCs in the lower layer of the EGL, and postmitotic GC growth cones turn toward a VEGF source in vitro and in slices ex vivo (our unpublished data). However, pharmacological inhibition of Flk1 did not affect tangential migration speed of GCs in situ. Thus, even though tangential migration of GCs is responsive to VEGF in experimental conditions, VEGF is present in a radial—not tangential—gradient in the developing cerebellum, explaining why radial migration is more likely regulated by VEGF.
Second, given that postmitotic GCs migrate along Bergmann glia fibers and PC dendrites lie in close contact with these fibers (Stottmann and Rivas, 1998; Yamada et al., 2000; Lordkipanidze and Dunaevsky, 2005), pericellular VEGF around PC dendrites and Bergmann glia fibers could chemoattract Flk1-expressing postmitotic GCs and facilitate their positioning relative to the glia fibers. A steeper VEGF concentration gradient around these structures would be expected to increase inward GC migration by promoting the positioning and/or alignment of the radial leading process of GCs along these fibers. In line with this hypothesis, more GCs adhered to HEK-293 cells expressing matrix binding VEGF isoforms than the VEGF120 isoform or control. Although an effect of VEGF on adhesion has been amply characterized for endothelial cells (Byzova et al., 2000; Hutchings et al., 2003; Vlahakis et al., 2007), such an activity of VEGF on neurons has not been documented yet. Finally, VEGF might also promote chemoattraction of postmitotic GCs from the EGL toward the deeper cerebellar layers, since VEGF is expressed in a radial gradient, and ectopic VEGF expression in the EGL chemoattracted radial leading processes and GC bodies back to the upper layers. When this radial VEGF gradient is steeper, it would also be expected to promote chemoattraction of postmitotic GCs from the EGL toward the deeper cerebellar layers. Additional support for the latter model will have to await confirmation of the presence of a radial concentration gradient of extracellular VEGF, which cannot be readily resolved using available technology to date.
In VEGF∂/∂ mice, GC migration was delayed but resumed at later time points, suggesting that other signals compensated for the reduced VEGF levels. It is nonetheless noteworthy that, unlike other signals (such as BDNF, Sema6A, Barhl1, PlexinB2, Jagged1, etc.) whose expression must be near completely eliminated in vivo to impair GC migration (Borghesani et al., 2002; Li et al., 2004; Kerjan et al., 2005; Weller et al., 2006; Friedel et al., 2007), even a relatively small decrease in VEGF levels sufficed to perturb this process. Another consideration is that the spatial VEGF expression pattern leads us to conclude that migration of postmitotic GCs beyond the PCL into the IGL must involve other cues than VEGF. Furthermore, in addition to the aforementioned role of VEGF in GC migration, this molecule might exert additional activities in the cerebellum, which we did not characterize in this study. For instance, VEGF might have a neurotrophic activity or stimulate axon outgrowth, as reported for neurons in the peripheral nervous system (Sondell et al., 1999, 2000). However, no differences in GC survival were observed in VEGF∂/∂ hypomorph mice. In a separate study, we document how VEGF cross talks with NMDARs to enhance calcium influx in GCs via enhancing NR2B phosphorylation in a Src family kinase-dependent manner (our unpublished data), a molecular mechanism that may explain in part how VEGF modulates GC migration during cerebellar development.
In conclusion, although it is becoming increasingly evident that vessels coopted axon guidance signals to navigate (Carmeliet, 2003; Carmeliet and Tessier-Lavigne, 2005), there is still little evidence that molecules involved in angiogenesis also guide migrating neurons. Our findings shed new light on the emerging importance of the neurovascular link and may stimulate future interest to study the involvement of VEGF in additional guidance events in the nervous system.
Footnotes
This work was supported, in part, by grants from Institut National de la Santé et de la Recherche Médicale, Région Rhône-Alpes, and Ligue contre le Cancer, and Concerted Research Activities, Belgium, Grant GOA2001/09 (P.C.). P.C. receives “long-term structural funding: Methusalem funding by the Flemish Government” and support through the Fund for Scientific Research–Flemish Government [Fonds Wetenschappelijk Onderzoek (FWO)] Grants G0125.00 and G.0121.02, European Union Grant QLRT-2001-0195, Concerted Research Activities Katholieke Universiteit Leuven Grants GOA2001/09 and GOA/2006/11, and Belgian Science Policy Grants IUAP-P5/02 and IUAP-P6/30. During the course of this study, C.R.d.A. was a postdoctoral fellow from the Federation of European Biochemical Societies and a fellow of European Molecular Biology Organization ATS 123-2007, and is currently a postdoctoral fellow of FWO. C.C., K.P., J.D., K.H., and I.G. are fellows of the Institute for the Promotion of Innovation through Science and Technology in Flanders (IWT-Vlaanderen), Belgium. E.S. is a postdoctoral fellow of FWO. S.S. is a postdoctoral fellow of the European Union Seventh Framework Program (Marie Curie Intra-European Fellowship). We thank A. Bouché, A. Van Den Broeck, A. Carton, L. Cathala, N. Dai, M. De Mol, B. Hermans, A. Manderveld, S. Terclavers, E. Dewulf, I. Van Hove, B. Vanwetswinkel, K. Peeters, S. Wyns, and Centre Commun de Quantimétrie Université de Lyon, Lyon 1, for assistance. We also thank Dr. Baker for providing the Math1CreER mouse line, Dr. J. Rossant for providing the Flk1-LacZ and Flk1-GFP mice, Dr. Livet for providing the Brainbow plasmid, and Dr. D. Karagogeos for providing us the anti-TAG-1 antibody. We thank Dr. D. Schmucker for helpful discussions.
References
- Acker T, Beck H, Plate KH. Cell type specific expression of vascular endothelial growth factor and angiopoietin-1 and -2 suggests an important role of astrocytes in cerebellar vascularization. Mech Dev. 2001;108:45–57. doi: 10.1016/s0925-4773(01)00471-3. [DOI] [PubMed] [Google Scholar]
- Akazawa C, Ishibashi M, Shimizu C, Nakanishi S, Kageyama R. A mammalian helix-loop-helix factor structurally related to the product of Drosophila proneural gene atonal is a positive transcriptional regulator expressed in the developing nervous system. J Biol Chem. 1995;270:8730–8738. doi: 10.1074/jbc.270.15.8730. [DOI] [PubMed] [Google Scholar]
- Borghesani PR, Peyrin JM, Klein R, Rubin J, Carter AR, Schwartz PM, Luster A, Corfas G, Segal RA. BDNF stimulates migration of cerebellar granule cells. Development. 2002;129:1435–1442. doi: 10.1242/dev.129.6.1435. [DOI] [PubMed] [Google Scholar]
- Byzova TV, Goldman CK, Pampori N, Thomas KA, Bett A, Shattil SJ, Plow EF. A mechanism for modulation of cellular responses to VEGF: activation of the integrins. Mol Cell. 2000;6:851–860. [PubMed] [Google Scholar]
- Carmeliet P. Blood vessels and nerves: common signals, pathways and diseases. Nat Rev. 2003;4:710–720. doi: 10.1038/nrg1158. [DOI] [PubMed] [Google Scholar]
- Carmeliet P, Tessier-Lavigne M. Common mechanisms of nerve and blood vessel wiring. Nature. 2005;436:193–200. doi: 10.1038/nature03875. [DOI] [PubMed] [Google Scholar]
- Carmeliet P, Ng YS, Nuyens D, Theilmeier G, Brusselmans K, Cornelissen I, Ehler E, Kakkar VV, Stalmans I, Mattot V, Perriard JC, Dewerchin M, Flameng W, Nagy A, Lupu F, Moons L, Collen D, D'Amore PA, Shima DT. Impaired myocardial angiogenesis and ischemic cardiomyopathy in mice lacking the vascular endothelial growth factor isoforms VEGF164 and VEGF188. Nat Med. 1999;5:495–502. doi: 10.1038/8379. [DOI] [PubMed] [Google Scholar]
- Chédotal A. Should I stay or should I go? Becoming a granule cell. Trends Neurosci. 2010;33:163–172. doi: 10.1016/j.tins.2010.01.004. [DOI] [PubMed] [Google Scholar]
- Chen TT, Luque A, Lee S, Anderson SM, Segura T, Iruela-Arispe ML. Anchorage of VEGF to the extracellular matrix conveys differential signaling responses to endothelial cells. J Cell Biol. 2010;188:595–609. doi: 10.1083/jcb.200906044. [DOI] [PMC free article] [PubMed] [Google Scholar]
- Chen YT, Collins LL, Uno H, Chang C. Deficits in motor coordination with aberrant cerebellar development in mice lacking testicular orphan nuclear receptor 4. Mol Cell Biol. 2005;25:2722–2732. doi: 10.1128/MCB.25.7.2722-2732.2005. [DOI] [PMC free article] [PubMed] [Google Scholar]
- Chow LM, Tian Y, Weber T, Corbett M, Zuo J, Baker SJ. Inducible Cre recombinase activity in mouse cerebellar granule cell precursors and inner ear hair cells. Dev Dyn. 2006;235:2991–2998. doi: 10.1002/dvdy.20948. [DOI] [PubMed] [Google Scholar]
- Dickson BJ. Molecular mechanisms of axon guidance. Science. 2002;298:1959–1964. doi: 10.1126/science.1072165. [DOI] [PubMed] [Google Scholar]
- Ema M, Takahashi S, Rossant J. Deletion of the selection cassette, but not cis-acting elements, in targeted Flk1-lacZ allele reveals Flk1 expression in multipotent mesodermal progenitors. Blood. 2006;107:111–117. doi: 10.1182/blood-2005-05-1970. [DOI] [PubMed] [Google Scholar]
- Ferrara N. Vascular endothelial growth factor: basic science and clinical progress. Endocr Rev. 2004;25:581–611. doi: 10.1210/er.2003-0027. [DOI] [PubMed] [Google Scholar]
- Ferrara N, Gerber HP, LeCouter J. The biology of VEGF and its receptors. Nat Med. 2003;9:669–676. doi: 10.1038/nm0603-669. [DOI] [PubMed] [Google Scholar]
- Friedel RH, Kerjan G, Rayburn H, Schüller U, Sotelo C, Tessier-Lavigne M, Chédotal A. Plexin-B2 controls the development of cerebellar granule cells. J Neurosci. 2007;27:3921–3932. doi: 10.1523/JNEUROSCI.4710-06.2007. [DOI] [PMC free article] [PubMed] [Google Scholar]
- Haigh JJ, Morelli PI, Gerhardt H, Haigh K, Tsien J, Damert A, Miquerol L, Muhlner U, Klein R, Ferrara N, Wagner EF, Betsholtz C, Nagy A. Cortical and retinal defects caused by dosage-dependent reductions in VEGF-A paracrine signaling. Dev Biol. 2003;262:225–241. doi: 10.1016/s0012-1606(03)00356-7. [DOI] [PubMed] [Google Scholar]
- Hatten ME. Neuronal regulation of astroglial morphology and proliferation in vitro. J Cell Biol. 1985;100:384–396. doi: 10.1083/jcb.100.2.384. [DOI] [PMC free article] [PubMed] [Google Scholar]
- Hatten ME. Central nervous system neuronal migration. Annu Rev Neurosci. 1999;22:511–539. doi: 10.1146/annurev.neuro.22.1.511. [DOI] [PubMed] [Google Scholar]
- Hatten ME. New directions in neuronal migration. Science. 2002;297:1660–1663. doi: 10.1126/science.1074572. [DOI] [PubMed] [Google Scholar]
- Hutchings H, Ortega N, Plouët J. Extracellular matrix-bound vascular endothelial growth factor promotes endothelial cell adhesion, migration, and survival through integrin ligation. FASEB J. 2003;17:1520–1522. doi: 10.1096/fj.02-0691fje. [DOI] [PubMed] [Google Scholar]
- Jakobsson L, Kreuger J, Holmborn K, Lundin L, Eriksson I, Kjellén L, Claesson-Welsh L. Heparan sulfate in trans potentiates VEGFR-mediated angiogenesis. Dev Cell. 2006;10:625–634. doi: 10.1016/j.devcel.2006.03.009. [DOI] [PubMed] [Google Scholar]
- Kawaji K, Umeshima H, Eiraku M, Hirano T, Kengaku M. Dual phases of migration of cerebellar granule cells guided by axonal and dendritic leading processes. Mol Cell Neurosci. 2004;25:228–240. doi: 10.1016/j.mcn.2003.10.006. [DOI] [PubMed] [Google Scholar]
- Kerbel RS. Tumor angiogenesis. N Engl J Med. 2008;358:2039–2049. doi: 10.1056/NEJMra0706596. [DOI] [PMC free article] [PubMed] [Google Scholar]
- Kerjan G, Dolan J, Haumaitre C, Schneider-Maunoury S, Fujisawa H, Mitchell KJ, Chédotal A. The transmembrane semaphorin Sema6A controls cerebellar granule cell migration. Nat Neurosci. 2005;8:1516–1524. doi: 10.1038/nn1555. [DOI] [PubMed] [Google Scholar]
- Klein RS, Rubin JB, Gibson HD, DeHaan EN, Alvarez-Hernandez X, Segal RA, Luster AD. SDF-1 alpha induces chemotaxis and enhances Sonic hedgehog-induced proliferation of cerebellar granule cells. Development. 2001;128:1971–1981. doi: 10.1242/dev.128.11.1971. [DOI] [PubMed] [Google Scholar]
- Komuro H, Rakic P. Distinct modes of neuronal migration in different domains of developing cerebellar cortex. J Neurosci. 1998;18:1478–1490. doi: 10.1523/JNEUROSCI.18-04-01478.1998. [DOI] [PMC free article] [PubMed] [Google Scholar]
- Komuro H, Yacubova E. Recent advances in cerebellar granule cell migration. Cell Mol Life Sci. 2003;60:1084–1098. doi: 10.1007/s00018-003-2248-z. [DOI] [PMC free article] [PubMed] [Google Scholar]
- Li S, Qiu F, Xu A, Price SM, Xiang M. Barhl1 regulates migration and survival of cerebellar granule cells by controlling expression of the neurotrophin-3 gene. J Neurosci. 2004;24:3104–3114. doi: 10.1523/JNEUROSCI.4444-03.2004. [DOI] [PMC free article] [PubMed] [Google Scholar]
- Li Y, Jia YC, Cui K, Li N, Zheng ZY, Wang YZ, Yuan XB. Essential role of TRPC channels in the guidance of nerve growth cones by brain-derived neurotrophic factor. Nature. 2005;434:894–898. doi: 10.1038/nature03477. [DOI] [PubMed] [Google Scholar]
- Livet J, Weissman TA, Kang H, Draft RW, Lu J, Bennis RA, Sanes JR, Lichtman JW. Transgenic strategies for combinatorial expression of fluorescent proteins in the nervous system. Nature. 2007;450:56–62. doi: 10.1038/nature06293. [DOI] [PubMed] [Google Scholar]
- Lordkipanidze T, Dunaevsky A. Purkinje cell dendrites grow in alignment with Bergmann glia. Glia. 2005;51:229–234. doi: 10.1002/glia.20200. [DOI] [PubMed] [Google Scholar]
- Lu Q, Sun EE, Klein RS, Flanagan JG. Ephrin-B reverse signaling is mediated by a novel PDZ-RGS protein and selectively inhibits G protein-coupled chemoattraction. Cell. 2001;105:69–79. doi: 10.1016/s0092-8674(01)00297-5. [DOI] [PubMed] [Google Scholar]
- Ma Q, Jones D, Borghesani PR, Segal RA, Nagasawa T, Kishimoto T, Bronson RT, Springer TA. Impaired B-lymphopoiesis, myelopoiesis, and derailed cerebellar neuron migration in CXCR4- and SDF-1-deficient mice. Proc Natl Acad Sci U S A. 1998;95:9448–9453. doi: 10.1073/pnas.95.16.9448. [DOI] [PMC free article] [PubMed] [Google Scholar]
- Maes C, Stockmans I, Moermans K, Van Looveren R, Smets N, Carmeliet P, Bouillon R, Carmeliet G. Soluble VEGF isoforms are essential for establishing epiphyseal vascularization and regulating chondrocyte development and survival. J Clin Invest. 2004;113:188–199. doi: 10.1172/JCI19383. [DOI] [PMC free article] [PubMed] [Google Scholar]
- Maes C, Goossens S, Bartunkova S, Drogat B, Coenegrachts L, Stockmans I, Moermans K, Nyabi O, Haigh K, Naessens M, Haenebalcke L, Tuckermann JP, Tjwa M, Carmeliet P, Mandic V, David JP, Behrens A, Nagy A, Carmeliet G, Haigh JJ. Increased skeletal VEGF enhances beta-catenin activity and results in excessively ossified bones. EMBO J. 2010;29:424–441. doi: 10.1038/emboj.2009.361. [DOI] [PMC free article] [PubMed] [Google Scholar]
- Marín O, Valiente M, Ge X, Tsai LH. Guiding neuronal cell migrations. Cold Spring Harb Perspect Biol. 2010;2:a001834. doi: 10.1101/cshperspect.a001834. [DOI] [PMC free article] [PubMed] [Google Scholar]
- Marko SB, Damon DH. VEGF promotes vascular sympathetic innervation. Am J Physiol. 2008;294:H2646–H2652. doi: 10.1152/ajpheart.00291.2008. [DOI] [PubMed] [Google Scholar]
- Mattot V, Moons L, Lupu F, Chernavvsky D, Gómez RA, Collen D, Carmeliet P. Loss of the VEGF(164) and VEGF(188) isoforms impairs postnatal glomerular angiogenesis and renal arteriogenesis in mice. J Am Soc Nephrol. 2002;13:1548–1560. doi: 10.1097/01.asn.0000013925.19218.7b. [DOI] [PubMed] [Google Scholar]
- McLennan R, Teddy JM, Kasemeier-Kulesa JC, Romine MH, Kulesa PM. Vascular endothelial growth factor (VEGF) regulates cranial neural crest migration in vivo. Dev Biol. 2010;339:114–125. doi: 10.1016/j.ydbio.2009.12.022. [DOI] [PMC free article] [PubMed] [Google Scholar]
- Miquerol L, Gertsenstein M, Harpal K, Rossant J, Nagy A. Multiple developmental roles of VEGF suggested by a LacZ-tagged allele. Dev Biol. 1999;212:307–322. doi: 10.1006/dbio.1999.9355. [DOI] [PubMed] [Google Scholar]
- Miquerol L, Langille BL, Nagy A. Embryonic development is disrupted by modest increases in vascular endothelial growth factor gene expression. Development. 2000;127:3941–3946. doi: 10.1242/dev.127.18.3941. [DOI] [PubMed] [Google Scholar]
- Miyazawa K, Himi T, Garcia V, Yamagishi H, Sato S, Ishizaki Y. A role for p27/Kip1 in the control of cerebellar granule cell precursor proliferation. J Neurosci. 2000;20:5756–5763. doi: 10.1523/JNEUROSCI.20-15-05756.2000. [DOI] [PMC free article] [PubMed] [Google Scholar]
- Moser KV, Schmidt-Kastner R, Hinterhuber H, Humpel C. Brain capillaries and cholinergic neurons persist in organotypic brain slices in the absence of blood flow. Eur J Neurosci. 2003;18:85–94. doi: 10.1046/j.1460-9568.2003.02728.x. [DOI] [PubMed] [Google Scholar]
- Oosthuyse B, Moons L, Storkebaum E, Beck H, Nuyens D, Brusselmans K, Van Dorpe J, Hellings P, Gorselink M, Heymans S, Theilmeier G, Dewerchin M, Laudenbach V, Vermylen P, Raat H, Acker T, Vleminckx V, Van Den Bosch L, Cashman N, Fujisawa H, et al. Deletion of the hypoxia-response element in the vascular endothelial growth factor promoter causes motor neuron degeneration. Nat Genet. 2001;28:131–138. doi: 10.1038/88842. [DOI] [PubMed] [Google Scholar]
- Pan Q, Chathery Y, Wu Y, Rathore N, Tong RK, Peale F, Bagri A, Tessier-Lavigne M, Koch AW, Watts RJ. Neuropilin-1 binds to VEGF121 and regulates endothelial cell migration and sprouting. J Biol Chem. 2007;282:24049–24056. doi: 10.1074/jbc.M703554200. [DOI] [PubMed] [Google Scholar]
- Park HT, Wu J, Rao Y. Molecular control of neuronal migration. Bioessays. 2002;24:821–827. doi: 10.1002/bies.10141. [DOI] [PMC free article] [PubMed] [Google Scholar]
- Rakic P. Principles of neural cell migration. Experientia. 1990;46:882–891. doi: 10.1007/BF01939380. [DOI] [PubMed] [Google Scholar]
- Rakic P. Evolving concepts of cortical radial and areal specification. Prog Brain Res. 2002;136:265–280. doi: 10.1016/s0079-6123(02)36023-0. [DOI] [PubMed] [Google Scholar]
- Renaud J, Kerjan G, Sumita I, Zagar Y, Georget V, Kim D, Fouquet C, Suda K, Sanbo M, Suto F, Ackerman SL, Mitchell KJ, Fujisawa H, Chédotal A. Plexin-A2 and its ligand, Sema6A, control nucleus-centrosome coupling in migrating granule cells. Nat Neurosci. 2008;11:440–449. doi: 10.1038/nn2064. [DOI] [PubMed] [Google Scholar]
- Rocamora N, García-Ladona FJ, Palacios JM, Mengod G. Differential expression of brain-derived neurotrophic factor, neurotrophin-3, and low-affinity nerve growth factor receptor during the postnatal development of the rat cerebellar system. Brain Res Mol Brain Res. 1993;17:1–8. doi: 10.1016/0169-328x(93)90065-w. [DOI] [PubMed] [Google Scholar]
- Rosenstein JM, Mani N, Silverman WF, Krum JM. Patterns of brain angiogenesis after vascular endothelial growth factor administration in vitro and in vivo. Proc Natl Acad Sci U S A. 1998;95:7086–7091. doi: 10.1073/pnas.95.12.7086. [DOI] [PMC free article] [PubMed] [Google Scholar]
- Rubin JB, Choi Y, Segal RA. Cerebellar proteoglycans regulate sonic hedgehog responses during development. Development. 2002;129:2223–2232. doi: 10.1242/dev.129.9.2223. [DOI] [PubMed] [Google Scholar]
- Ruiz de Almodovar C, Lambrechts D, Mazzone M, Carmeliet P. Role and therapeutic potential of VEGF in the nervous system. Physiol Rev. 2009;89:607–648. doi: 10.1152/physrev.00031.2008. [DOI] [PubMed] [Google Scholar]
- Savill RM, Scotting PJ, Coyle B. Strategies to investigate gene expression and function in granule cells. Cerebellum. 2005;4:271–278. doi: 10.1080/14734220500367790. [DOI] [PubMed] [Google Scholar]
- Schwartz PM, Levy RL, Borghesani PR, Segal RA. Cerebellar pathology in BDNF−/− mice: the classic view of neurotrophins is changing. Mol Psychiatry. 1998;3:116–120. doi: 10.1038/sj.mp.4000359. [DOI] [PubMed] [Google Scholar]
- Schwarz Q, Ruhrberg C. Neuropilin, you gotta let me know: should I stay or should I go? Cell Adh Migr. 2010;4:61–66. doi: 10.4161/cam.4.1.10207. [DOI] [PMC free article] [PubMed] [Google Scholar]
- Schwarz Q, Gu C, Fujisawa H, Sabelko K, Gertsenstein M, Nagy A, Taniguchi M, Kolodkin AL, Ginty DD, Shima DT, Ruhrberg C. Vascular endothelial growth factor controls neuronal migration and cooperates with Sema3A to pattern distinct compartments of the facial nerve. Genes Dev. 2004;18:2822–2834. doi: 10.1101/gad.322904. [DOI] [PMC free article] [PubMed] [Google Scholar]
- Schwarz Q, Waimey KE, Golding M, Takamatsu H, Kumanogoh A, Fujisawa H, Cheng HJ, Ruhrberg C. Plexin A3 and plexin A4 convey semaphorin signals during facial nerve development. Dev Biol. 2008;324:1–9. doi: 10.1016/j.ydbio.2008.08.020. [DOI] [PMC free article] [PubMed] [Google Scholar]
- Shibuya M. Vascular endothelial growth factor-dependent and -independent regulation of angiogenesis. BMB Rep. 2008;41:278–286. doi: 10.5483/bmbrep.2008.41.4.278. [DOI] [PubMed] [Google Scholar]
- Solecki DJ, Model L, Gaetz J, Kapoor TM, Hatten ME. Par6alpha signaling controls glial-guided neuronal migration. Nat Neurosci. 2004;7:1195–1203. doi: 10.1038/nn1332. [DOI] [PubMed] [Google Scholar]
- Solecki DJ, Govek EE, Tomoda T, Hatten ME. Neuronal polarity in CNS development. Genes Dev. 2006;20:2639–2647. doi: 10.1101/gad.1462506. [DOI] [PubMed] [Google Scholar]
- Solowska JM, Mazurek A, Weinberger L, Baird DH. Pontocerebellar axon guidance: neuropilin-1- and semaphorin 3A-sensitivity gradients across basilar pontine nuclei and semaphorin 3A variation across cerebellum. Mol Cell Neurosci. 2002;21:266–284. doi: 10.1006/mcne.2002.1187. [DOI] [PubMed] [Google Scholar]
- Sondell M, Lundborg G, Kanje M. Vascular endothelial growth factor has neurotrophic activity and stimulates axonal outgrowth, enhancing cell survival and Schwann cell proliferation in the peripheral nervous system. J Neurosci. 1999;19:5731–5740. doi: 10.1523/JNEUROSCI.19-14-05731.1999. [DOI] [PMC free article] [PubMed] [Google Scholar]
- Sondell M, Sundler F, Kanje M. Vascular endothelial growth factor is a neurotrophic factor which stimulates axonal outgrowth through the flk-1 receptor. Eur J Neurosci. 2000;12:4243–4254. doi: 10.1046/j.0953-816x.2000.01326.x. [DOI] [PubMed] [Google Scholar]
- Sotelo C. Cellular and genetic regulation of the development of the cerebellar system. Prog Neurobiol. 2004;72:295–339. doi: 10.1016/j.pneurobio.2004.03.004. [DOI] [PubMed] [Google Scholar]
- Stalmans I, Ng YS, Rohan R, Fruttiger M, Bouché A, Yuce A, Fujisawa H, Hermans B, Shani M, Jansen S, Hicklin D, Anderson DJ, Gardiner T, Hammes HP, Moons L, Dewerchin M, Collen D, Carmeliet P, D'Amore PA. Arteriolar and venular patterning in retinas of mice selectively expressing VEGF isoforms. J Clin Invest. 2002;109:327–336. doi: 10.1172/JCI14362. [DOI] [PMC free article] [PubMed] [Google Scholar]
- Stalmans I, Lambrechts D, De Smet F, Jansen S, Wang J, Maity S, Kneer P, von der Ohe M, Swillen A, Maes C, Gewillig M, Molin DG, Hellings P, Boetel T, Haardt M, Compernolle V, Dewerchin M, Plaisance S, Vlietinck R, Emanuel B, et al. VEGF: a modifier of the del22q11 (DiGeorge) syndrome? Nat Med. 2003;9:173–182. doi: 10.1038/nm819. [DOI] [PubMed] [Google Scholar]
- Stottmann RW, Rivas RJ. Distribution of TAG-1 and synaptophysin in the developing cerebellar cortex: relationship to Purkinje cell dendritic development. J Comp Neurol. 1998;395:121–135. [PubMed] [Google Scholar]
- Thomas AL, Morgan B, Horsfield MA, Higginson A, Kay A, Lee L, Masson E, Puccio-Pick M, Laurent D, Steward WP. Phase I study of the safety, tolerability, pharmacokinetics, and pharmacodynamics of PTK787/ZK 222584 administered twice daily in patients with advanced cancer. J Clin Oncol. 2005;23:4162–4171. doi: 10.1200/JCO.2005.09.034. [DOI] [PubMed] [Google Scholar]
- Vaillant C, Meissirel C, Mutin M, Belin MF, Lund LR, Thomasset N. MMP-9 deficiency affects axonal outgrowth, migration, and apoptosis in the developing cerebellum. Mol Cell Neurosci. 2003;24:395–408. doi: 10.1016/s1044-7431(03)00196-9. [DOI] [PubMed] [Google Scholar]
- Vlahakis NE, Young BA, Atakilit A, Hawkridge AE, Issaka RB, Boudreau N, Sheppard D. Integrin alpha9beta1 directly binds to vascular endothelial growth factor (VEGF)-A and contributes to VEGF-A-induced angiogenesis. J Biol Chem. 2007;282:15187–15196. doi: 10.1074/jbc.M609323200. [DOI] [PubMed] [Google Scholar]
- Weller M, Krautler N, Mantei N, Suter U, Taylor V. Jagged1 ablation results in cerebellar granule cell migration defects and depletion of Bergmann glia. Dev Neurosci. 2006;28:70–80. doi: 10.1159/000090754. [DOI] [PubMed] [Google Scholar]
- Yamada K, Fukaya M, Shibata T, Kurihara H, Tanaka K, Inoue Y, Watanabe M. Dynamic transformation of Bergmann glial fibers proceeds in correlation with dendritic outgrowth and synapse formation of cerebellar Purkinje cells. J Comp Neurol. 2000;418:106–120. [PubMed] [Google Scholar]
- Zhou P, Porcionatto M, Pilapil M, Chen Y, Choi Y, Tolias KF, Bikoff JB, Hong EJ, Greenberg ME, Segal RA. Polarized signaling endosomes coordinate BDNF-induced chemotaxis of cerebellar precursors. Neuron. 2007;55:53–68. doi: 10.1016/j.neuron.2007.05.030. [DOI] [PMC free article] [PubMed] [Google Scholar]
- Zou YR, Kottmann AH, Kuroda M, Taniuchi I, Littman DR. Function of the chemokine receptor CXCR4 in haematopoiesis and in cerebellar development. Nature. 1998;393:595–599. doi: 10.1038/31269. [DOI] [PubMed] [Google Scholar]