Abstract
Objective:
To determine the optimal gestational age of delivery for women with placenta previa by accounting for both neonatal and maternal outcomes.
Study Design:
A decision-analytic model was designed comparing total maternal and neonatal quality-adjusted life years for delivery of women with previa at gestational ages from 34 to 38 weeks. At each week, we allowed for four different delivery strategies: (1) immediate delivery, without amniocentesis or steroids; (2) delivery 48 hours after steroid administration (without amniocentesis); (3) amniocentesis with delivery if fetal lung maturity (FLM) positive or retesting in one week if FLM negative; (4) amniocentesis with delivery if FLM testing is positive or administration of steroids if FLM negative.
Results:
Delivery at 36 weeks, 48 hours after steroids, for women with previa optimizes maternal and neonatal outcomes. In sensitivity analyses, these results were robust to a wide range of variation in input assumptions. If it is assumed that steroids offer no neonatal benefit at this gestational age, outright delivery at 36 weeks’ gestation is the best strategy.
Conclusion:
Steroid administration at 35 weeks and 5 days followed by delivery at 36 weeks for women with placenta previa optimizes maternal and neonatal outcomes.
Keywords: placenta previa, preterm delivery, pregnancy complications, decision analysis
Introduction
In the United States, 1 in every 200 to 300 singleton births is complicated by placenta previa, and this rate is likely to increase as the cesarean rate increases.1,2,3 Despite the relative infrequency of this condition, it accounts for significant maternal morbidity and mortality, with 6.6% of maternal deaths from 1979 to 1992 due to placenta previa.4 Patients who carry the diagnosis of placenta previa are often scheduled for elective preterm delivery to prevent bleeding complications. The risk of maternal bleeding increases with increasing gestational age, so preterm delivery is in the best maternal interest. However, premature delivery carries a risk of neonatal complications, including respiratory distress syndrome, so prolonging gestation is in the fetus’s best interest. A common plan is to deliver at 36 to 37 weeks after an amniocentesis documenting fetal lung maturity,5 but this recommendation is not based on clear evidence. Thus, we chose to address the question of when these women should be delivered to optimize maternal and infant outcomes.
Answering this question by a randomized controlled trial would be difficult given the large sample size required. Since respiratory distress syndrome (RDS) in a near-term infant is unusual, a study would require thousands of patients in each arm to have adequate power. Thus, our objective was to use the technique of decision analysis to determine the optimal gestational age for delivery of women with placenta previa by accounting for both maternal and neonatal outcomes.
METHODS:
A decision analytic model was designed comparing total maternal and neonatal quality-adjusted life years (QALYs) for delivery of women with placenta previa at gestational ages ranging from 34 to 38 weeks. The model was created with TreeAge Pro 2007 software (TreeAge Software, Williamstown, MA) and began with women with a known previa who had reached 34 weeks gestational age; thus the risk of an intrauterine fetal demise (IUFD) or an emergent bleed requiring delivery was assumed to be zero at 34 weeks.
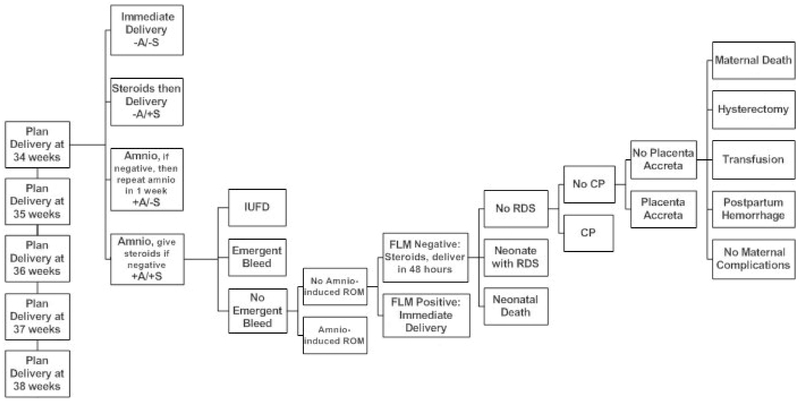
We allowed for four delivery strategies for each week of gestation between 34 and 38 weeks: (1) immediate delivery, without amniocentesis or steroids; (2) delivery 48 hours after steroid administration (without amniocentesis); (3) amniocentesis with delivery if fetal lung maturity (FLM) is positive or retesting in one week if FLM is negative; (4) amniocentesis with delivery if FLM testing is positive or administration of steroids if FLM negative, with delivery 48 hours after steroid administration. Steroid administration entailed a 48-hour wait, during which we modeled the IUFD and emergent bleed risk at 2/7ths of that gestational week’s baseline risk. For the second strategy, steroid administration was modeled 2 days prior to the planned delivery (for example, in the 34-week arm, steroids were given at 33 weeks and 5 days). In the amniocentesis with retesting arm, a woman was delivered at 39 weeks without further testing if FLM was negative at 38 weeks. A simplified decision analytic model is shown in figure 1, with only one strategy at the 34-week branch of the tree shown.
Figure 1:
Simplified decision analytic model, showing one of four delivery strategies. Arms were created for 34, 35, 36, 37 and 38 weeks gestational ages. A= amniocentesis, S = steroid administration, IUFD = intrauterine fetal demise, ROM = rupture of membranes, FLM = fetal lung maturity testing, RDS = respiratory distress syndrome, CP = cerebral palsy.
The primary outcome was total QALYs, which was the summation of both maternal and neonatal QALYs. A QALY is the product of life expectancy and utility, a measure of the quality of the remaining life years. Utility is a measure of the relative happiness or satisfaction of various states of health. It ranges from 0 to 1.0, with 0 being death and 1.0 being perfect health. A QALY is then calculated by multiplying the utility by the number of life years, so 5 years in perfect health is 5 QALYS (5 years with a utility of 1) but 5 QALYs could also be 10 years in 50% health (10 years with a utility of 0.5). In terms of neonatal clinical outcomes, we accounted for respiratory distress syndrome (RDS), neonatal death (NND) and cerebral palsy (CP). The risk of these neonatal outcomes was based on gestational age, and this risk was adjusted appropriately in the setting of receiving an amniocentesis or corticosteroids. Regarding maternal outcomes, we accounted for postpartum hemorrhage, the need for a blood transfusion, hysterectomy and maternal death. The probability of postpartum hemorrhage (PPH), blood transfusion and hysterectomy were stratified by whether or not an emergent bleed had precipitated delivery. Maternal death was considered only for those women who required a hysterectomy and was higher for women with a placenta accreta.
Probability inputs were derived from a variety of sources (table I).6–23 Neonatal death, IUFD, RDS, CP, and the effect of steroids were derived from the literature.5–10,16 The effect of steroids after 34 weeks has not been well-studied, but one randomized (but not placebo-controlled) trial suggested a similar decrease in RDS,17 No data is available on long-term outcomes of near-term steroids, as such, the model did not include any downside of steroid administration, other than the 48 hour delay prior to delivery. Of note, neonatal death (NND) rates were only given up to 36 weeks; we extrapolated the later gestational ages assuming exponential decay. In determining the percentage of cerebral palsy that is severe or moderate, we used data from the UK from 1984–1999 accounting for those children with known moderate/severe intellectual impairment only.10 The sensitivity and specificity of FLM testing were based upon an L/S ratio greater than 2 and/or a PG/S ratio greater than 0.02.18
Table I:
Model inputs
| Probabilities | |||||||
|---|---|---|---|---|---|---|---|
| Gestational Age (weeks) | Source | ||||||
| 34 | 35 | 36 | 37 | 38 | 39 | ||
| Emergent Bleed | 0.0000 | 0.0469 | 0.1504 | 0.2987 | 0.5855 | 0.8723 | Calculated, see text Zlatnik 2007(6) |
| Intrauterine fetal demise | 0.0000 | 0.0004 | 0.0007 | 0.0012 | 0.0017 | 0.0022 | Smith 2000(7) |
| Neonatal death | 0.0130 | 0.0080 | 0.0050 | 0.0044 | 0.0029 | 0.0020 | Copper 1993 (8), see text |
| Respiratory distress syndrome | 0.1350 | 0.0640 | 0.0330 | 0.0040 | 0.0040 | 0.0030 | Robertson 1992(9) |
| Cerebral palsy | 0.0088 | 0.0051 | 0.0031 | 0.0025 | 0.0013 | 0.0009 | Surman 2004(10) |
| No emergent bleed | Emergent bleed | Kohi P, Zlatnik M, Little S, Caughey A. Bleeding previa: what are the risks? [abstract] Am J Obstet Gynecol 2006;195S113. | |||||
| Postpartum hemorrhage | 0.124 | 0.2488 | |||||
| Blood transfusion | 0.0849 | 0.2615 | |||||
| Hysterectomy | 0.0165 | 0.0547 | |||||
| No placenta accreta | Placenta accreta | ||||||
| Maternal death, if hysterectomy | 0.01 | 0.091 | Gielchinsky (11), Clark 1984(12) | ||||
| Placenta accreta | 0.05 | Usta 2005(13), Miller 1997(14) | |||||
| Amniocentesis rupture of membranes | 0.01 | Gordon 2002(15) | |||||
| Reduction in respiratory distress syndrome from steroid administration | 0.34 | Roberts 2006(16), Stutchfield 2005 (17) | |||||
| % of cerebral palsy that is severe | 0.29 | Surman 2004(10) | |||||
| % of cerebral palsy that is moderate | 0.15 | ||||||
| Sensitivity fetal lung maturity testing | 0.851 | Herbert 1986(18) | |||||
| Specificity fetal lung maturity testing | 0.843 | ||||||
| Life expectancies | |||||||
| Maternal | 56 | CDC(19) | |||||
| Neonatal | 77.9 | ||||||
| Neonate with severe cerebral palsy | 28.7 | Life Expectancy Project 2005(20) | |||||
| Neonate with moderate cerebral palsy | 62 | ||||||
| Utilities | |||||||
| Infertility | 0.82 | Hu 2004(21) | |||||
| Having a child with cerebral palsy | 0.81 | Kuppermann 2000(22) | |||||
| Fetal/Neonatal death | 0.92 | ||||||
| Having severe cerebral palsy | 0.3 | Saigal 1999(23) | |||||
| Having moderate cerebral palsy | 0.9 | ||||||
| Having a child with respiratory distress | 0.98 (one year duration) | Assumed | |||||
We attempted to obtain estimates of maternal risks from the existing literature as well. However, this was difficult as we could not identify many of the risks we needed via computerized searches. We did find an attributable risk of maternal death in the setting of cesarean hysterectomy for previa with and without accreta.11,12 Also, we had recently published a paper on emergent bleeding that provided that estimate.6 Therefore, several of the other maternal probabilities, including PPH, blood transfusion, and hysterectomy rates, were calculated from our own institutional data. The rate of PPH, transfusion and hysterectomy were calculated from all women with a placenta previa who delivered at our institution, excluding maternal transports, stratified by whether an emergent bleed had precipitated delivery (n=322). We assumed that women with a previa who delivered at less than 36 weeks gestation had an emergent bleed. Beyond 36 weeks, we extrapolated the risk of emergent bleeding using a best-fit second-order polynomial equation. For PPH, we considered only those classified as severe (estimated blood loss greater than 1,500 mL). The risk of maternal death was higher for women with a placenta accreta. Baseline assumptions included the probability of emergent bleeding in each week of gestation ranging from 4.7% at 35 weeks to 28.7% at 38 weeks (adding up to a 58.6% cumulative risk of bleeding in a patient delivered at 38 wks), with a 1.7% risk of hysterectomy for scheduled deliveries and a 5.5% risk of hysterectomy for deliveries after emergent bleeding.
Quality-adjusted life-year inputs were estimated from available literature. We assumed a 3% discount rate. To calculate maternal life expectancy, we assumed an average maternal age of 25. We estimated utilities of a variety of outcomes using available data in the literature. For example, we estimated the utility of having a child with cerebral palsy at 0.81, which is the published utility of having a child with Down syndrome.22 Maternal utility decreased to 0.92 for either a fetal or neonatal death, using the published utility for women experiencing miscarriage.22 Of note, this may underestimate the disutility of a fetal or neonatal death. However, we felt it was a reasonable baseline as it was a conservative estimate in that it biases against more aggressive intervention. Moreover, we included a broad range in our sensitivity analyses to test the impact of this baseline assumption. For moderate cerebral palsy, we used “a child who can perform the activities of daily living on his/her own, is free of pain, and performs schoolwork more slowly than his peers.”23 For severe cerebral palsy, we used “a child who needs assistance with eating, bathing, or using the toilet, is very slow at schoolwork, in moderate to no physical pain, and is blind, deaf, or unable to talk.”23 Utility values continued for all remaining life-years, except for the utility of having a child with respiratory distress syndrome, which was assumed to be a one-year decrement of 0.02 utilities.
Univariate and multivariate sensitivity analyses were performed with TreeAge Pro 2006 (TreeAge; Cambridge, MA) to test for robustness. Univariate sensitivity analyses were performed over a wide range, from 25% to 400% of baseline estimates. We also created aggregate variables for univariate sensitivity analysis, which varied maternal probabilities (probability of hysterectomy, accreta, and death) and neonatal outcomes (probability of IUFD, CP, neonatal death, and RDS) simultaneously while maintaining baseline proportions.
For multivariate sensitivity analysis we performed a Monte Carlo simulation with 1,000 trials. With each trial a different input probability, utility, life expectancy and discount rate was chosen from a given distribution. For life expectancies, we used normal distributions, with plus or minus 20% as an estimate of the 95% confidence interval. For probabilities and utilities we used beta distributions with the 95% confidence interval again at plus or minus 20% of baseline. Beta distributions are the multivariate equivalent of a binomial distribution and bounded between zero and one, which is necessary for both probability and utility estimates.
Institutional review board approval was obtained from the Committee on Human Research at UCSF (H41147-29451-03).
Results
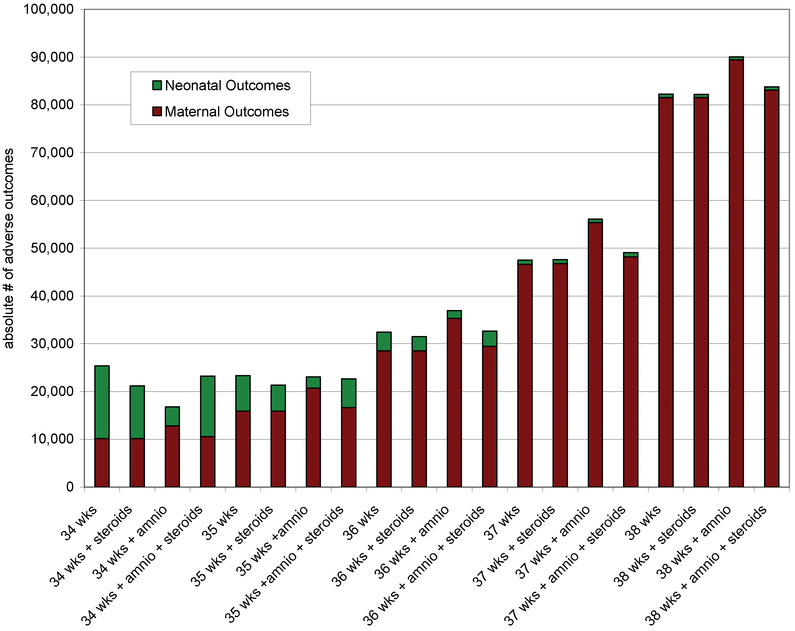
Figure 2 shows the absolute numbers of maternal and neonatal adverse outcomes by delivery strategy and gestational age for a hypothetical cohort of 100,000 women with placenta previa. Adverse maternal outcomes increase with advancing gestational age. Adverse neonatal outcomes are greatest at the earlier gestational ages. These are absolute numbers of complications, with a maternal death and a case of RDS weighted equally in this figure. For example, with outright delivery at 34 weeks, we see about 15,000 neonatal complications (including 13,500 cases RDS and 1,300 deaths) and about 10,000 maternal complications (including 8,490 transfusions and 1,650 hysterectomies). At 38 weeks, with delivery only after amniocentesis and steroids for immature lung indices, we see about 800 neonatal complications and 80,000 maternal complications
Figure 2.
The absolute numbers of maternal and neonatal adverse outcomes by delivery strategy and gestational age per 100,000 women with placenta previa.
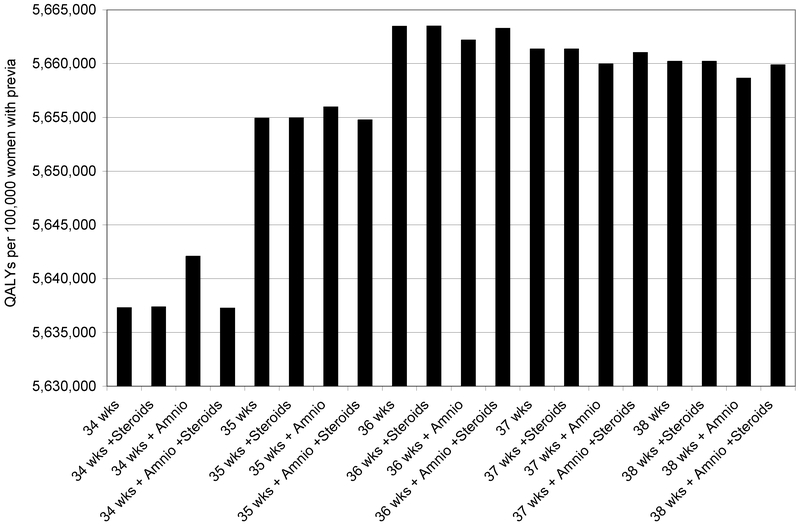
The relative weights of these adverse outcomes were then factored in as quality-adjusted life years (QALYs). In figure 3, a maternal death or a child with CP is weighted more heavily than a case of RDS or postpartum hemorrhage. Instead of total adverse events on the y-axis, we now see total QALYs per 100,000 women with placenta previa. Steroid administration at 35 weeks and 5 days followed by delivery at 36 weeks was the optimal strategy. Immediate delivery at 36 weeks, without amniocentesis or steroids, was the second-best strategy. In general, all four strategies at 36 weeks were good choices, having the four highest expected quality-adjusted life years.
Figure 3.
Total QALYs (maternal and neonatal) per 100,000 women with placenta previa.
Table II shows the differences in several maternal and fetal outcomes. Maternal outcomes were best in those strategies that delivered all women at 34 weeks (either with or without steroids). Adverse maternal outcomes increased with strategies in which more women delivered at increasing gestational ages. Fetal outcomes were improved with steroids and delivery at later gestational ages.
Table II.
Maternal and neonatal outcomes for 100,000 women with placenta previa by gestational age at delivery and strategy.
| Gestational Age/Strategy | IUFD | NND | RDS | CP | Emergent bleeds | Hyster-ectomy | Trans- fusions | Maternal Deaths | Total QALYs |
|---|---|---|---|---|---|---|---|---|---|
| 34 wks | 0 | 1,300 | 13,500 | 382 | 0 | 1,650 | 8,490 | 23 | 5,637,290 |
| 34 wks + Steroids | 0 | 1,300 | 9,339 | 382 | 0 | 1,650 | 8,490 | 23 | 5,637,373 |
| 34 wks + Amnio | 14 | 1,161 | 2,485 | 339 | 2,165 | 1,733 | 8,872 | 24 | 5,642,079 |
| 34 wks + Amnio + Steroids | 3 | 1,298 | 11,003 | 382 | 336 | 1,663 | 8,549 | 23 | 5,637,250 |
| 35 wks | 39 | 800 | 6,397 | 223 | 4,695 | 1,829 | 9,319 | 26 | 5,654,908 |
| 35 wks + Steroids | 39 | 800 | 4,414 | 223 | 4,695 | 1,829 | 9,319 | 26 | 5,654,947 |
| 35 wks + Amnio | 57 | 740 | 1,444 | 206 | 8,617 | 1,979 | 10,012 | 28 | 5,655,966 |
| 35 wks + Amnio + Steroids | 42 | 800 | 5,003 | 224 | 5,290 | 1,852 | 9,424 | 26 | 5,654,758 |
| 36 wks | 72 | 500 | 3,298 | 136 | 15,040 | 2,225 | 11,146 | 31 | 5,663,470 |
| 36 wks + Steroids | 72 | 500 | 2,366 | 136 | 15,040 | 2,225 | 11,146 | 31 | 5,663,489 |
| 36 wks + Amnio | 94 | 488 | 967 | 131 | 20,646 | 2,439 | 12,136 | 34 | 5,662,179 |
| 36 wks + Amnio + Steroids | 74 | 500 | 2,589 | 136 | 15,802 | 2,254 | 11,281 | 32 | 5,663,270 |
| 37 wks | 124 | 441 | 400 | 109 | 29,875 | 2,791 | 13,766 | 39 | 5,661,347 |
| 37 wks + Steroids | 124 | 441 | 305 | 109 | 29,875 | 2,791 | 13,766 | 39 | 5,661,349 |
| 37 wks + Amnio | 144 | 424 | 195 | 103 | 37,079 | 3,066 | 15,038 | 43 | 5,659,954 |
| 37 wks + Amnio + Steroids | 126 | 441 | 322 | 109 | 31,184 | 2,841 | 13,997 | 40 | 5,661,031 |
| 38 wks | 167 | 294 | 399 | 57 | 58,555 | 3,887 | 18,831 | 55 | 5,660,197 |
| 38 wks + Steroids | 167 | 294 | 343 | 57 | 58,555 | 3,887 | 18,831 | 55 | 5,660,198 |
| 38 wks + Amnio | 181 | 287 | 280 | 55 | 65,068 | 4,136 | 19,981 | 58 | 5,658,638 |
| 38 wks + Amnio + Steroids | 169 | 294 | 354 | 57 | 59,864 | 3,937 | 19,062 | 55 | 5,659,880 |
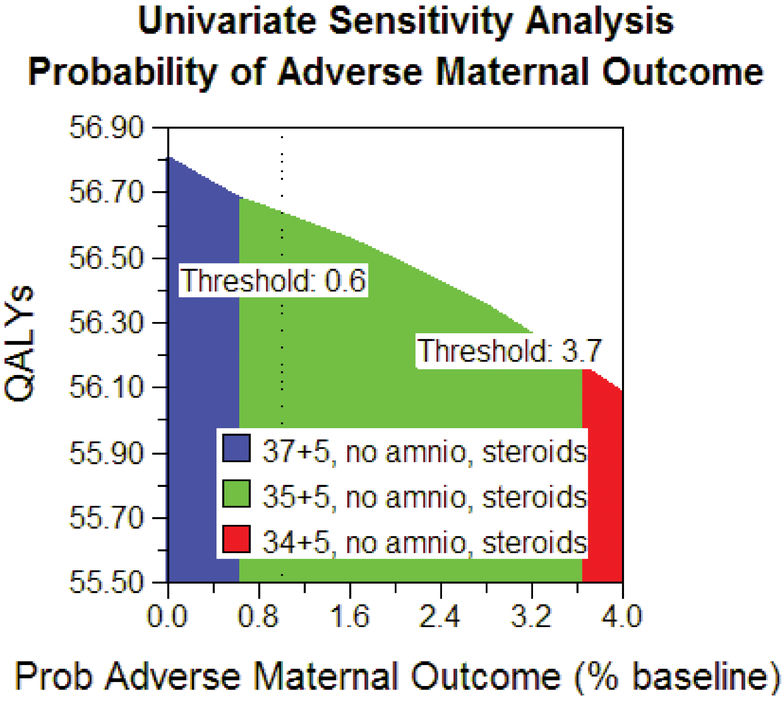
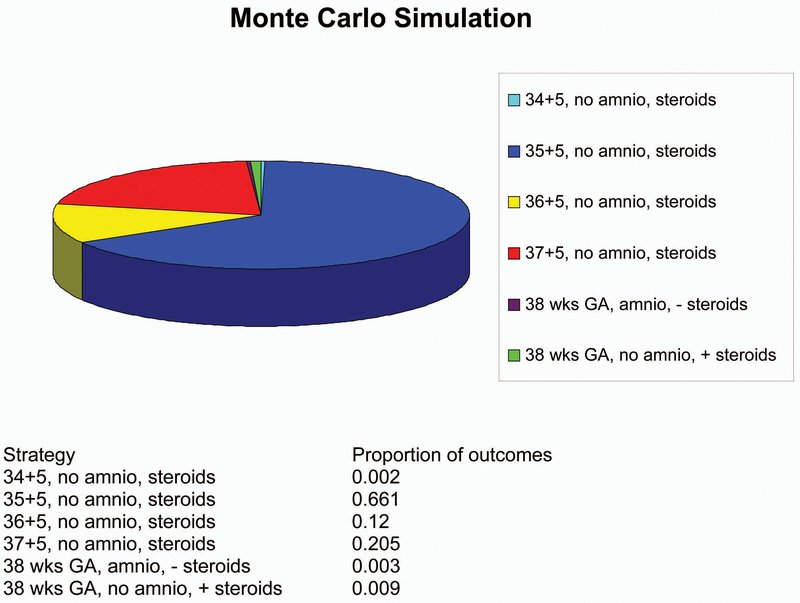
The robustness of the model’s results was tested by varying the baseline probabilities. There was no change in model outcome when varying maternal or neonatal utilities between 25% and 400% of baseline. Additionally, there was no change if the probability of accreta varied down to zero or up to 50%. If the assumption was made that there was no improvement in RDS from betamethasone administration, delivery at 36 weeks’ gestation without amniocentesis or steroids was the best strategy. Steroids at 35 weeks and 5 days, with delivery at 36 weeks, was the best strategy as long as the risk of emergent bleeding was 62% of baseline. In the aggregate univariate sensitivity analysis, steroids at 35 weeks and 5 days, with delivery at 36 weeks was the best strategy as long as the risk of maternal outcomes was between 60% and 370 % of baseline, and the risk of neonatal outcomes was less than 160% of baseline estimates by gestational week (see figure 4). Monte Carlo analysis found that steroid administration at 35 weeks and 5 days with delivery at 36 weeks was the optimal strategy in 66% of trials (see figure 5). Further, we can be 78% confident that delivery at or prior to 37 weeks is optimal and 99% confident that delivery at or prior to 38 weeks is optimal.
Figure 4.
Univariate sensitivity analysis. This figure demonstrates the most cost-effective strategy over a range of possible maternal adverse health outcomes. If the risk of adverse maternal outcomes is less than 60% of the risk used in our baseline model, then 37+5 weeks with no amniocentesis and steroids is the most cost-effective strategy, and if the risk is greater than 370% of our baseline estimate, then 34+5 weeks with no amniocentesis and steroids is the most cost-effective strategy.
Figure 5.
Multivariate sensitivity analysis by Monte Carlo simulation with 1000 trials. This figure demonstrates the proportion of trials in the Monte Carlo Simulation in which each given strategy was found to be the cost-effective solution.
Discussion
Delivery at 36 weeks, 48 hours after steroid administration, for women with placenta previa, optimizes maternal and neonatal outcomes. Interestingly, most of the tested strategies achieve fairly similar results, with the absolute differences in QALYs being fairly minimal, especially between the 36-week options. As such, there is some room for maternal preference in determining the optimal management for the individual patient.
Our model assumed that the administration of steroids would have no downside other than the 48-hour delay prior to delivery. The reduction of RDS with steroids at 36 weeks was modeled consistent with the reduction earlier in pregnancy, consistent with the findings of the Cochrane meta-analysis.16 Although this is based on scant data,9,16,17,24 delivery at 36 weeks is robust to varying the benefits of steroids in reducing RDS. Our analysis does not, however, account for any potential long-term risks of administration of steroids near term (given the paucity of data). For situations in which administration of steroids at term is considered unsafe, or steroids had been previously administered during the pregnancy, outright delivery at 36 weeks remains the optimal strategy. In other words, when more data is available, if near-term steroids are found to be harmful, or if their benefit in reducing RDS is found to be minimal, outright delivery at 36 weeks would be the optimal strategy.
While we determined that delivery at 36 weeks of gestation after administration of betamethasone was the optimal management strategy, a way to consider the tradeoffs of different components of the strategies is number needed to treat (NNT). For example, an NNT of steroids vs. no steroids at 36 weeks of gestation on the risk of RDS would suggest we would need to treat 107 women to prevent one case of RDS in this setting. In comparison, when considering delivery at 36 weeks of gestation vs. waiting another week to 37 weeks, one would need to deliver 38 women at 36 weeks to prevent one transfusion, 177 women to prevent one hysterectomy, and 12,500 women to prevent one maternal death.
Our study has limitations. As with any decision analysis, our model simplifies the clinical situation. We did, however, include many more factors than the typical obstetrician can easily quantify and combine mentally. Additionally, decision analytic techniques rely on accurate inputs for accurate results. Because many of these complications are rare, some of our inputs were based on small sample sizes. With such inputs, one of the strengths of decision analysis is to utilize sensitivity analysis, varying such inputs over wide ranges. Thus, our results were confirmed by univariate and multivariate sensitivity analyses. Of note, while the multivariate Monte Carlo simulation had a greater than 98% certainty that delivery prior to 38 weeks was optimal, it had only approximately 80% certainty that delivery prior to 37 weeks was optimal. Lastly, we used QALYs derived from the literature, typically from large studies, so although they represent typical patients’ values, they may not coincide with an individual’s preferences.
Decision analysis has allowed us to answer a clinical question that has been difficult to address via other research methods, and provides some confirmation of what many clinicians currently practice. For those clinicians who do not use antenatal corticosteroids beyond 34 weeks of gestation, outright delivery at 36 weeks appears the best delivery plan. Given our findings, however, it appears that delivery at 36 weeks of gestation after a course of antenatal corticosteroids optimizes the combined maternal and neonatal outcomes for the typical placenta previa patient.
Synopsis.
Delivery at 36 weeks, 48 hours after steroid administration, for women with placenta previa optimizes maternal and neonatal outcomes.
Footnotes
Presented in oral abstract form at the Society for Maternal-Fetal Medicine, San Francisco, February 2007.
References
- 1.Ananth CV, Demissie K, Smulian JC, Vintzileos AM. Placenta previa in singleton and twin births in the United States, 1989 through 1998: A comparison of risk factor profiles and associated conditions. Am J Obstet Gynecol 2003;188:275–81. [DOI] [PubMed] [Google Scholar]
- 2.Hershkowitz R, Fraser D, Mazor M, Leiberman JR. One or multiple previous cesarean sections are associated with similar increased frequency of placenta previa. Eur J Obstet Gynecol Reprod Biol 1995;62:185–8 [DOI] [PubMed] [Google Scholar]
- 3.Silver RM, Landon MB, Rouse DJ, Leveno KJ, Spong CY, Thom EA, et al. Maternal morbidity associated with multiple repeat cesarean deliveries. Obstet Gynecol 2006;107:1226–32. [DOI] [PubMed] [Google Scholar]
- 4.Chichlakli LO, Atrash HK, Mackay AP, Musani AS, Berg CJ. Pregnancy-related mortality in the United States due to hemorrhage:1979–1992. Obstet Gynecol 1999;721–5. [DOI] [PubMed] [Google Scholar]
- 5.Oyelese Y, Smulian JC. Placenta previa, placenta accreta, and vasa previa. Obstet Gynecol 2006;107:927–41. [DOI] [PubMed] [Google Scholar]
- 6.Zlatnik MG, Cheng YW, Norton ME, Thiet M-P, Caughey AB. Placenta previa and the risk of preterm delivery. J Mat-Fetal & Neo Med. 2007;20:719–23. [DOI] [PubMed] [Google Scholar]
- 7.Smith GC. Sex, birth weight, and the risk of stillbirth in Scotland, 1980–1996. Am J Epidemiol 2000;151(6):614–9. [DOI] [PubMed] [Google Scholar]
- 8.Copper RL, Goldenberg RL, Creasy RK, DuBard MB, Davis RO, Entman SS, et al. A multicenter study of preterm birth weight and gestational age-specific neonatal mortality. Am J Obstet Gynecol 1993;168(1 Pt 1):78–84. [DOI] [PubMed] [Google Scholar]
- 9.Robertson PA, Sniderman SH, Laros RK Jr., Cowan R, Heilbron D, Goldenberg RL, et al. Neonatal morbidity according to gestational age and birth weight from five tertiary care centers in the United States, 1983 through 1986. Am J Obstet Gynecol 1992;166(6 Pt 1):1629–41; discussion 41–5. [DOI] [PubMed] [Google Scholar]
- 10.Surman G, Newdick H, King A, Kurinczuk JJ. 4Child: Four counties database of cerebral palsy, vision loss and hearing loss in children Annual report 2004 including data for births 1984 to 1999 from the National Perinatal Epidemiology Unit UK. In: Oxford: National Perinatal Epidemiology Unit, 2004. [Google Scholar]
- 11.Gielchinsky Y, Rojansky N, Fasouliotis SJ, Ezra Y. Placenta accreta—Summary of 10 years: a survey of 310 cases. Placenta 2002;23:210–4. [DOI] [PubMed] [Google Scholar]
- 12.Clark SL, Yeh S-Y, Phelan J, Bruce S, Paul RH. Emergency hysterectomy for obstetric hemorrhage. Obstet Gynecol 1984;64:376–80. [PubMed] [Google Scholar]
- 13.Usta IM, Hobeika EM, Gabriel GE, Nassar AH. Placenta previa-accreta: risk factors and complications. Am J Obstet Gynecol 2005;193:1045–9. [DOI] [PubMed] [Google Scholar]
- 14.Miller DA, Chollet JA, Goodwin TM. Clinical risk factors for placenta previa-accreta. Am J Obstet Gynecol 1997;177:210–4. [DOI] [PubMed] [Google Scholar]
- 15.Gordon MC, Narula K, O’Shaughnessy R, Barth WH Jr. Complications of third-trimester amniocentesis using continuous ultrasound guidance. Obstet Gynecol 2002;99:255–9. [DOI] [PubMed] [Google Scholar]
- 16.Roberts D, Dalziel S. Antenatal corticosteroids for accelerating fetal lung maturation for women at risk of preterm birth. Cochrane Database Syst Rev 2006;3:CD004454. [DOI] [PubMed] [Google Scholar]
- 17.Stutchfield P, Whitaker R, Russell I, on behalf of the Antenatal Steroids for Term Elective Caesarean Section (ASTECS) Research Team. Antenatal betamethasone and incidence of neonatal respiratory distress after elective caesarean section: pragmatic randomised trial. BMJ 2005;331:1–6. [DOI] [PMC free article] [PubMed] [Google Scholar]
- 18.Herbert WN, Chapman JF. Clinical and economic considerations associated with testing for fetal lung maturity. Am J Obstet Gynecol 1986;155(4):820–3. [DOI] [PubMed] [Google Scholar]
- 19.CDC Website National Center for Health Statistics. Miniño AM, Heron M, Smith BL, Deaths: Preliminary data for 2004. Health E-Stats. Released April 19, 2006. (Accessed August 8, 2007 at http://www.cdc.gov/nchs/products/pubs/pubd/hestats/prelimdeaths04/preliminarydeaths04.htm) [PubMed] [Google Scholar]
- 20.Life expectancy project. (Accessed April 25, 2005, at http://www.lifeexpectancy.com/cp.shtml.) [Google Scholar]
- 21.Hu D, Hook EW III, Goldie SJ. Screening for Chlamydia trachomatis in women 15 to 29 years of age: a cost-effectiveness analysis. Ann Int Med 2004;141:501–13. [DOI] [PubMed] [Google Scholar]
- 22.Kuppermann M, Nease RF, Learman LA, Gates E, Blumberg B, Washington AE. Procedure-related miscarriages and Down syndrome-affected births: implications for prenatal testing based on women’s preferences. Obstet Gynecol 2000;96(4):511–6. [DOI] [PubMed] [Google Scholar]
- 23.Saigal S, Stoskopf BL, Feeny D, Furlong W, Burrows E, Rosenbaum PL, et al. Differences in preferences for neonatal outcomes among health care professionals, parents, and adolescents. JAMA 1999;281(21):1991–7. [DOI] [PubMed] [Google Scholar]
- 24.Joseph KS, Nette F, Scott H, Vincer MJ. Prenatal corticosteroid prophylaxis for women delivering at late preterm gestation. Pediatrics 2009. 124: e835–e843 [DOI] [PubMed] [Google Scholar]


