

Abstract
At the nodes of Ranvier, excitable axon membranes are exposed directly to the extracellular fluid. Cations are accumulated and depleted in the local extracellular nodal region during action potential propagation, but the impact of the extranodal micromilieu on signal propagation still remains unclear. Brain-specific hyaluronan-binding link protein, Bral1, colocalizes and forms complexes with negatively charged extracellular matrix (ECM) proteins, such as versican V2 and brevican, at the nodes of Ranvier in the myelinated white matter. The link protein family, including Bral1, appears to be the linchpin of these hyaluronan-bound ECM complexes. Here we report that the hyaluronan-associated ECM no longer shows a nodal pattern and that CNS nerve conduction is markedly decreased in Bral1-deficient mice even though there were no differences between wild-type and mutant mice in the clustering or transition of ion channels at the nodes or in the tissue morphology around the nodes of Ranvier. However, changes in the extracellular space diffusion parameters, measured by the real-time iontophoretic method and diffusion-weighted magnetic resonance imaging (MRI), suggest a reduction in the diffusion hindrances in the white matter of mutant mice. These findings provide a better understanding of the mechanisms underlying the accumulation of cations due to diffusion barriers around the nodes during saltatory conduction, which further implies the importance of the Bral1-based extramilieu for neuronal conductivity.
Introduction
At the nodes of Ranvier, the myelin sheath is interrupted, and a few micrometers of the axonal membrane are directly exposed to the extracellular fluid, thereby enabling nerve impulse propagation in the myelinated nerves. As demonstrated by computational models of the three-dimensional electrodiffusion method, there is an accumulation and a depletion of ions in the local extracellular nodal region (Lopreore et al., 2008). In addition, CNS nodal molecules are also concerned with action potential conduction (for review, see Poliak and Peles, 2003).
Link protein (LP) is a hyaluronan-binding ECM protein, and cartilage LP (Crtl1) has a critical role in the formation and stability of aggrecan and hyaluronan complexes. The LP family has four distinct members: Bral1, Bral2, Crtl1 and Lp3. There are two kinds of densely organized matrices in the brain: one is Bral1-associated ECM at the nodes of Ranvier and the other is Bral2-binding ECM in perineuronal nets (PNNs) (Oohashi et al., 2002; Bekku et al., 2003; Oohashi and Bekku, 2007). The C-terminal of lecticans, the hyaluronan-binding chondroitinsulphate proteoglycan (CSPGs), can mediate binding to other ECM proteins such as tenascins. Brevican has the highest affinity for tenascin-R (TN-R) among the four lecticans (Aspberg et al., 1997). The ECM of the larger nodes is more likely to be assembled with hyaluronan and Bral1-versican V2 cross-linking with Bral1-brevican and TN-R, which is further associated with phosphacan. In contrast, the hyaluronan-binding ECM at the small diameter nodes is comprised of hyaluronan, versican V2, and Bral1 (Bekku et al., 2009). We thus proposed that the hyaluronan-associated ECM could serve as an “extracellular ion pool” at the perinodal extracellular space (ECS) because both hyaluronan and chondroitin sulfate provide a strong negatively charged environment corresponding to the nodal diameter (Oohashi et al., 2002; Bekku et al., 2009).
Despite the geometric complexity of the ECS, its structure may be fairly accurately revealed by the diffusion of substances in the ECS (Nicholson and Syková, 1998; Syková and Nicholson, 2008), which in turn depends on the ECS diffusion parameters: extracellular volume fraction α, tortuosity λ, reflecting the number of diffusion, and nonspecific cellular uptake (k′). ECM molecules play a role in tissue cytoarchitecture by maintaining the optimal size of intercellular pores and by creating diffusion barriers (Roitbak and Syková, 1999; Zámecník et al., 2004; Syková et al., 2005). Diffusion barriers formed by myelin sheaths, glial processes and the ECM may channel the diffusion of molecules in a certain direction, so that diffusion is anisotropic, i.e., unequal along different axes (Prokopová et al., 1997; Vorísek and Syková, 1997). Since changes in the ECS diffusion parameters and anisotropy significantly affect the accumulation and diffusion of neuroactive substances (Syková, 2004; Syková and Vargová, 2008), it appears that ECM assembly in the extranodal spaces may affect saltatory conduction.
We report here that Bral1 is indispensable for the formation of hyaluronan-bound matrices at the nodes and that its loss results in slower saltatory conduction in the CNS and in concomitant changes in the ECS diffusion parameters.
Materials and Methods
Generation of Bral1-deficient mice.
The targeting construct to disrupt the Bral1 gene was made by using the 20 kb fragment (clone GL1-3) of the mouse Bral1 gene described previously (Hirakawa et al., 2000). A promoterless lacZ gene and a neomycin resistance expression cassette under the control of the phosphoglycerate kinase (PGK) promoter were flanked by a 2.5 kb (SalI)-NotI and an 11 kb XhoI-XhoI fragments, thus introducing, after homologous recombination, the lacZ gene into exon 4. After selection for stable transfectants, homologous recombinants were identified by the digestion of genomic DNA with BglII and Southern blot analysis. The targeting construct was then injected into C57BL/6 blastocysts, and the injected blastocysts were transferred into 129/Sv pseudopregnant foster mothers.
Animals.
Bral1-deficient mice were originally generated on the 129/Sv genetic background, and chimeric offspring were mated with 129/Sv females. The heterozygous mice were mated with wild-type 129/Sv mice to produce homozygous mutants. Bral1-homozygous males were crossed with wild-type ICR female mice. After five intercrosses of male homozygous offspring with wild-type ICR females, the heterozygous offspring were crossed to obtain homozygous animals. F5 generations of 129/Sv and ICR homozygous and littermate control mice were used for the present study. Genotypes of mice were determined by PCR using allele-specific primer sets. These animals, housed under standard laboratory conditions, were used in this study, and ICR mice were purchased from SLC. All animal experiments and animal care were performed in accordance with the guidelines of the Animal Care and Experimentation Committee of each institution and in accordance with the European Communities Council Directive of 24 November 1986 (86/609/EEC). All efforts were made to minimize both the discomfort and the number of animals used.
Northern, Southern, and PCR analyses.
Northern blot analysis was performed as described previously (Hirakawa et al., 2000; Bekku et al., 2003). Nonsaturated autoradiographs were digitalized and analyzed with ImageJ (http://rsbweb.nih.gov/ij/). For Southern blot analysis, Genomic DNA (10 μg) was digested with BglII, separated on 0.7% agarose gels, and then blotted onto Hybound N+ membranes (GE Healthcare). Hybridization was performed with a probe (Fig. 1) in Church buffer (Church and Gilbert, 1984) at 65°C. The membrane was washed at 65°C in 2 × SSC, 0.1% SDS followed by autoradiography for 24 h at −80°C with x-ray film (Kodak). Genotyping analysis of the Bral1 mutants was performed by PCR using the primers SLP5L (5′-GTGAGCACAGGGTAACGCAC-3′), SLGP1 (5′-TACGGCCAACTCTACCAGGGTGA-3′), and NeoPA (5′-CTGCTCTTTACTGAAGGCTCTTT-3′).
Figure 1.

Targeted disruption of the Bral1 gene. A, Bral1 targeting strategy. The wild-type Bral1 gene (top), the targeting vector (middle), and the disrupted Bral1 gene (bottom) are shown. The expected fragment sizes after BglII digestion and hybridization with a probe are 11 kb for the wild-type allele and 7 kb for the recombinant allele. The asterisk indicates the location of the exon encoding the peptide used as the immunogen for the Bral1 antibody. UT, Untranslated region; Sp, signal peptide; Ig, Ig-fold; PTR, proteoglycan tandem repeat. B, Southern blot analysis of genomic DNA from ES cell clones shows the wild-type (11 kb) and the targeted (7 kb) alleles. C, Southern blot analysis of tail DNA isolated from a mouse homozygous for the wild-type allele (+/+), a heterozygous mouse (+/−), and a homozygous mutant mouse (−/−). D, Northern blot analysis of polyA(+) RNA isolated from the brain of wild-type, heterozygous (+/−), and homozygous mutant (−/−) mice. The blot was sequentially hybridized with probes specific for mouse Bral1, Crtl1, Bral2, versican V2, and Gapdh. In quantification of those transcripts, blots were scanned and densitometric analysis was performed using the Gapdh signal to normalize mRNA levels. Data are presented as a percentage of wild-type levels. Error bars indicate ±SD. E, Western blot analysis of crude extracts (80 μg) from wild-type (+/+) and Bral1-deficient (−/−) mouse brains. Samples were resolved on a 2–15% gradient SDS-PAGE gel and immunoblotted with an antibody directed against Bral1.
Electron microscopy analysis.
Mice were deeply anesthetized with diethyl ether and transcardially perfused with 4% paraformaldehyde (PFA) and 2.5% glutaraldehyde in 0.1 m cacodylate buffer (CB), pH7.4. Dissected tissues were immersed in the same fixative overnight, washed with CB, and postfixed with 1% osmium tetroxide in 0.1 m CB. After fixation, the tissue was dehydrated and embedded in Epon.
Antibodies.
The rabbit polyclonal antibodies against Bral1, versican GAG-α (Millipore), brevican (Ab1058), and Bral2, the mouse monoclonal antibodies against Caspr, pan-Na+ channel (Sigma-Aldrich) and phosphacan (6B4; Seikagaku), and the goat polyclonal antibody against TN-R (Santa Cruz Biotechnology) have all been described previously (Zhou et al., 2001; Oohashi et al., 2002; Bekku et al., 2003, 2009). Other antibodies used were as follows: rabbit polyclonal antibodies directed against KCNQ2 (Alomone Labs), Nav1.6 (Sigma-Aldrich), Nav1.2 (Alomone Labs), Caspr (Abcam), NG2 (Millipore), neurofascin (NF) 186 (Millipore), neurofascin 155 (Millipore), GFAP (Dako), and RHAMM (Santa Cruz Biotechnology); goat anti-CRTL1/HAPLN1 (R&D Systems); rat anti-CD44 (eBioscience); and mouse anti-GFAP (Sigma). Hyaluronan was detected using B-HABP (Seikagaku).
Immunohistochemistry.
Immunohistochemistry was performed as described previously (Oohashi et al., 2002; Bekku et al., 2003, 2009). For the quantification of sodium channel clusters, the bound antibodies were visualized with biotinylated goat anti-mouse IgG (1:500; GE Healthcare UK) and streptavidin-HRP complex (Vectastain ABC elite kit, Vector). HRP activity was detected with 0.025% diaminobenzidine (DAB) and 0.03% H2O2 in PBS. Images were captured with an OLYMPUS BX50 light microscopes (Olympus) and an Axio Cam CCD-camera (Carl Zeiss), followed by quantification with NIH Image software (http://rsb.info.nih.gov/nih-image/).
Western blot analysis.
The preparation of the mouse optic nerves and brain and immunoblotting were performed as described previously (Bekku et al., 2003, 2009). Protein concentrations of the extracts were determined by a Bio-Rad Protein Assay (Bio-Rad Laboratories) using bovine serum albumin as a standard. Proteins were separated on 2–15% gradient gels (Cosmo Bio) and transferred onto polyvinylidine difluoride (PVDF) membranes (Bio-Rad Laboratories). Primary antibodies were visualized by HRP-conjugated anti-rabbit, anti-goat IgG (MP Biomedicals), or anti-mouse IgM plus IgG (KPL) and enhanced with the ECL plus detection system (GE Healthcare). Nonsaturated data were analyzed with ImageJ software.
Recording of flash visual evoked potentials.
Flash visual evoked potentials (fVEPs) were recorded as described previously (Goto et al., 2001). Briefly, each mouse was kept in a dark room at least overnight and prepared under dim red illumination. Mice were anesthetized with an intraperitoneal injection of 15 μl/g body weight of a ketamine (1 mg/ml) and xylazine (0.4 mg/ml) mixture. The pupil was dilated with 2.5% phenylephrine HCl, and the animals were placed on a heating pad to maintain body temperature. fVEPs were recorded using a needle electrode placed on the scalp overlying the visual cortex. Similar needle electrodes inserted in the mouth and the tail served as reference and ground leads, respectively. The luminance of the flash device was 200 cd-s/m2 (Mayo). Responses were amplified 1–1000 Hz, and the responses to 100 successive flashes presented at a rate of 1 Hz were averaged in each mouse; the data were acquired using a signal averaging system.
The real-time iontophoretic TMA method.
The ECS diffusion parameters α and λ were determined in brain coronal slices. For measurements in vitro, the brain was quickly removed and placed in ice-cold artificial CSF (aCSF) saturated with 95% O2 and 5% CO2. After dissection, 400-μm-thick slices were hemisected along the midline and maintained at 30–34°C for at least 1 h in a submerged chamber containing aCSF before being transferred to a recording chamber. aCSF, pH 7.4, contained 117 mm NaCl, 3 mm KCl, 35 mm NaHCO3, 1.25 mm Na2HPO4, 1.3 mm MgCl2, 1.5 mm CaCl2, 10 mm glucose, and 0.1 mm TMA+.
Since ECS diffusion is restricted by pore size and ECS geometry, it can only be properly described by a modified version of Fick's diffusion equations (Nicholson and Phillips, 1981) incorporating three diffusion parameters: (1) extracellular volume fraction (α), representing the ratio between the volume of the ECS and the total tissue volume, (2) tortuosity (λ), defined as the square root of D/ADC, where D is the free diffusion coefficient and ADC is the apparent diffusion coefficient, and (3) nonspecific uptake k′. These diffusion parameters were studied in the center of brain slices of wild-type and mutant mice by the real-time iontophoretic method described in detail previously (Nicholson and Phillips, 1981; Syková et al., 1994). In brief, a substance to which cell membranes are relatively impermeable, i.e., tetramethylammonium (TMA+), is administered into the tissue by iontophoresis and mimics the extracellular diffusion of small ions and molecules. Double-barreled TMA+-ISMs, measuring the concentration of TMA+, were prepared by a procedure described in detail previously (Sykova, 1992), using an ion exchanger Corning 477317 and as a backfilling solution 100 mm TMA+. An electrode array was made by gluing together a TMA+-ISM and an iontophoretic micropipette with a tip separation of 100–200 μm (see Fig. 6A). The iontophoresis parameters were +20 nA bias current (continuously applied to maintain a constant electrode transport number) with an +200 nA current step of 24 s duration to generate the diffusion curve. Before tissue measurements, diffusion curves were recorded in 0.3% agar gel (Difco) dissolved in a solution of 150 mm NaCl, 3 mm KCl and 1 mm TMA-chloride to determine the electrode transport number (n) and the free TMA+ diffusion coefficient (D). Knowing n and D, the parameters α, λ and k′ in isotropic regions can be determined by a nonlinear curve-fitting simplex algorithm when the experiment is repeated in a tissue sample (Nicholson and Phillips, 1981) (see Fig. 6B). For measurements in a homogeneous and potentially anisotropic medium, the parameters αx, λx; αy, λy; αz, λz, and k′ were determined from modified diffusion equations (Rice et al., 1993) valid for three orthogonal axes x–z. The real value of the scalar variable α must be calculated using averaged experimental data from each axis (for details see Vorísek and Syková, 1997).
Figure 6.
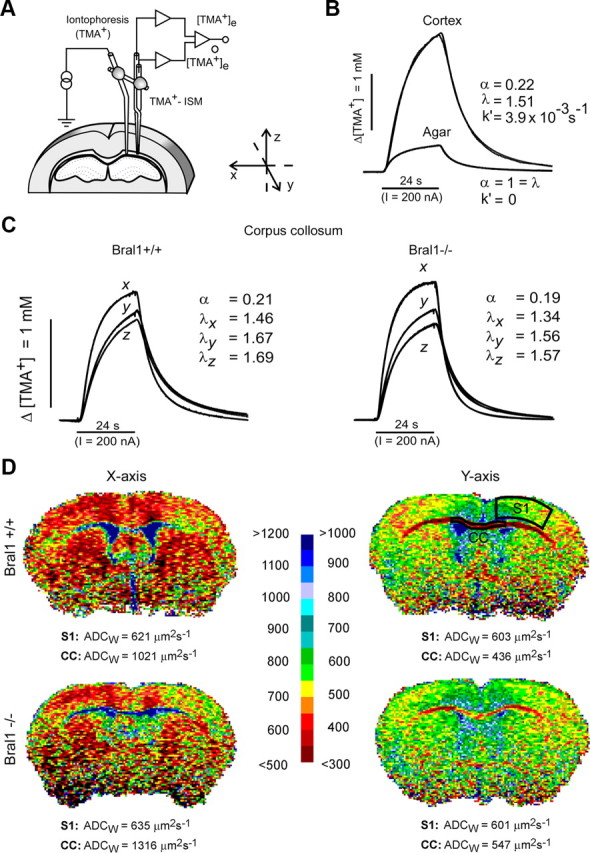
The diffusion properties of the ECS in the corpus callosum. A, Experimental arrangement. Tetramethylammonium ions (TMA+) were iontophoresed into the tissue by an iontophoretic micropipette, and their concentration was measured at a known distance by a TMA+-selective microelectrode. The micropipette and microelectrode were glued together to stabilize the intertip distance. B, Typical diffusion curves evoked by TMA+ iontophoresis in agar and in the cortex. The theoretical diffusion curves generated by a nonlinear curve-fitting simplex algorithm are superimposed on the actual diffusion curves recorded in the tissue or agar. Before tissue measurements, several diffusion curves were recorded in agar, where by definition α = 1 = λ and k′ = 0, thus enabling the transport number of the electrode array to be determined. In the tissue, the resulting increase in concentration was much larger than that in agar due to the restricted volume fraction and increased tortuosity in the brain. C, Examples of the TMA+ diffusion curves recorded in the corpus callosum of Bral1-positive and -negative mice. In contrast to diffusion in the cortex, which is isotropic, meaning that the values of the ECS diffusion parameters are the same along all three orthogonal axes, in the anisotropic corpus callosum, there is preferential diffusion along the myelinated fibers (x-axis). The different diffusion curves resulting from the unequal tortuosity values measured along the three orthogonal axes indicate anisotropic diffusion in both wild-type and knock-out mice; however, tortuosity λ in mutant mice was decreased along all the main axes (values λx, λy, and λz). D, Typical ADCW maps of wild-type and Bral1-deficient mice along the mediolateral (x) and rostrocaudal (y) axes. The mean value of ADCW, given below each map, was calculated in the outlined regions of interest. The calculated ADCW values were significantly higher in Bral1 knock-out mice than in controls in the CC but not in the primary somatosensory cortex (S1). The scale shows the relation between the intervals of ADCW values and the colors used for visualization; the values shown on the left are valid for the x-axis, those on the right for the y-axis.
Diffusion-weighted MRI.
For MRI measurements the animals were anesthetized with isoflurane (1.5% in a mixture consisting of 40% O2 and 60% N2O) and placed in a heated mouse holder. Diffusion-weighted (DW) MRI measurements were performed as described previously (Syková et al., 2005), using an experimental MR spectrometer BIOSPEC 4.7 T system (Bruker) equipped with a 200 mT/m gradient system (190 μs rise time) and a homemade head surface coil. Coronal slices, were acquired using the following parameters: Δ = 30 ms, b-factors = 136, 329, 675, 1035, 1481 and 1825 s/mm2, echo time = 46 ms, repetition time = 1200 ms, field of view 1.92 × 1.92 cm2, matrix size = 256 × 128, four 0.8-mm-thick coronal slices, interslice distance = 1.2 mm. DW images were measured using the stimulated echo sequence. In DW measurements, the diffusion gradient direction pointed along the rostrocaudal or mediolateral direction (x and y axes, respectively).
Apparent diffusion coefficient of water (ADCW) maps (see Fig. 6D) were calculated using custom-made software by a linear least-square algorithm. The results were analyzed using ImageJ software. The evaluated regions of interest were positioned using a mouse brain atlas (Franklin and Paxinos, 1997) and T2-weighted images in the corpus callosum (CC) and bilaterally in the primary somatosensory cortex (S1). We evaluated two adjacent coronal slices (0.8 mm – 2.2 mm caudal to bregma) in each animal. The regions of interest are delineated below (see Fig. 6).
All data acquired by MRI or the real-time iontophoretic method are presented as mean ± SEM. Statistical analysis of the differences between groups was performed using a two-tailed Student's t test (InStat, GraphPad Software). The differences were considered significant if p < 0.05. N represents the number of mice used.
Results
Generation of Bral1-deficient mice
To investigate the physiological role of Bral1 and its binding to ECMs, we generated Bral1-deficient mice. Targeting strategies for the Bral1 gene and genotype analysis of the mice are summarized in Figure 1, A to C. Northern blot analysis of total RNA isolated from an adult brain demonstrated that the LP family is expressed in the brain. Crtl1, Bral2, and versican V2 isoform mRNA were not significantly altered in mutant mice compared with wild-type mice (Fig. 1D). Immunoblotting using anti-Bral1 antibody demonstrated the complete absence of Bral1 protein and the predictable truncated protein (20 kDa) in homozygous mutant mice (Fig. 1E) because the antibody was raised against a peptide located on the Bral1 Ig-fold (A-subdomain) (Oohashi et al., 2002), which is encoded by exon 4 (Fig. 1A) (Hirakawa et al., 2000). Mutant mice were born at the expected Mendelian frequency, survived, and exhibited no gross abnormalities.
Bral1 is indispensable for stabilizing extracellular matrix assembly at the node of Ranvier
LP appears to be the stabilizer of the hyaluronan-lectican complex, but in fact, Crtl1 has been shown to be more important for aggrecan aggregation of cartilage (Watanabe and Yamada, 1999). We therefore investigated the effect of Bral1 deficiency on the nodal matrices in the CNS. We used immunostaining with antibodies directed against versican V2, brevican, TN-R and phosphacan, and labeled hyaluronan with biotinylated hyaluronic acid binding protein (B-HABP) in Bral1-deficient mice. As shown in Figure 2A, versican V2 and brevican could not be detected at the nodes of Ranvier in Bral1-deficient mice. TN-R was weakly and diffusely stained in the optic nerve with the consequence that the immunostaining no longer revealed a dot-like nodal pattern. Moreover, staining for phosphacan, which colocalized with that for brevican and TN-R (Bekku et al., 2009), was also weak and diffuse, similar to the TN-R pattern. Interestingly, hyaluronan labeled with B-HABP also did not show a nodal expression in the optic nerve in Bral1-deficient mice. These patterns were confirmed in the facial nerve tract (Fig. 3A), the white matter of the cerebellum (Fig. 3B) and other white matter regions including the CC (data not shown). In heterozygous mice, the expression levels seemed to be decreased (Fig. 2A,B). Brevican, TN-R, phosphacan and hyaluronan were expressed normally in the PNNs, which contained other LPs (Fig. 2C). Although this result indicates that Bral1 is essential for the localization of these molecules at the nodes, we cannot confirm whether other LP compensate for Bral1 in mutant mice. Crtl1 and Bral2 are LPs that are expressed in PNNs in the brain (Asher et al., 1995; Bekku et al., 2003; Carulli et al., 2007), thus we examined their expression at the node of Ranvier in Bral1-deficient mice. However, they were not detected at the nodes (data not shown), which suggests that Crtl1 and Bral2 did not compensate for the lack of Bral1 at the nodes in mutant mice. Moreover, as for hyaluronan receptors, RHAMM did not appear in nodal patterns (Lynn et al., 2001) (Fig. 2D), while CD44-positive processes, which were found in GFAP-positive astrocytes, projected to some nodal gaps (Fig. 2D,E). However, CD44 did not show any changes in expression in Bral1-deficient mice (Fig. 2D). These observations indicate that Bral1 is indispensable for stabilizing ECM assembly at the nodes of Ranvier, and it appears that an analysis of Bral1-deficient mice could lead to a better understanding of the physiological role of the nodal ECMs in the CNS.
Figure 2.
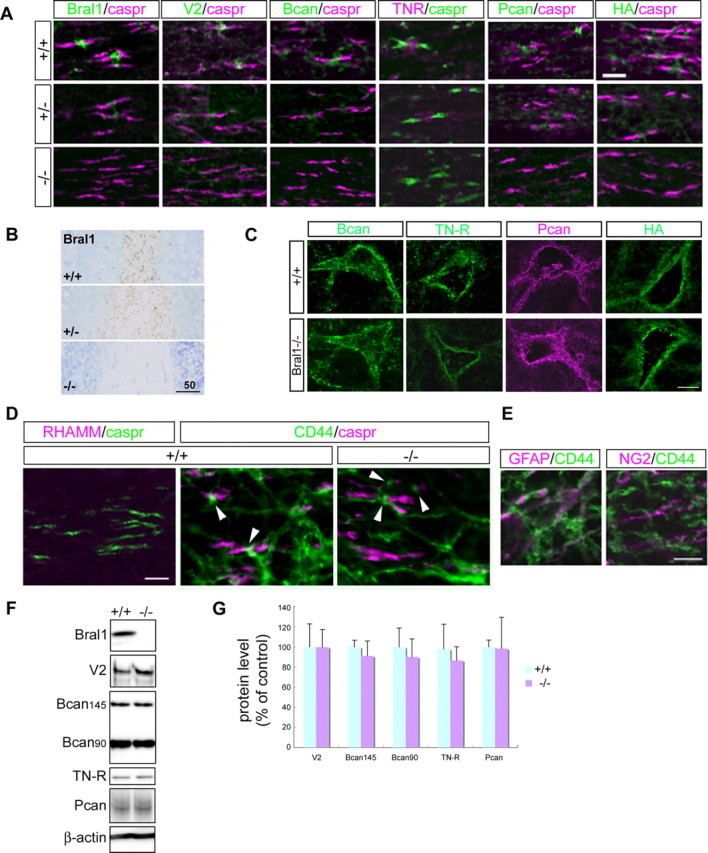
Bral1 is indispensable for stabilizing extracellular matrices at the nodes of Ranvier in the CNS. A, Immunofluorescent labeling of the optic nerve in wild-type mice (+/+; upper column), heterozygous mice (+/−; middle column), and Bral1-deficient mice (−/−; lower column) using antibodies to Bral1 (green), versican V2 (green), brevican (Bcan/green), TN-R (magenta), phosphacan (Pcan/green), and caspr (magenta or green), or labeling with B-HABP (HA/green). Note that all extracellular matrices involving Bral1 no longer show a nodal pattern in the CNS of Bral1-deficient mice. B, Immunolabeling of the white matter in the cerebellum using an antibody to Bral1. Note that the expression level is decreased even though the expression pattern is not affected in the heterozygous mouse. C, Immunolabeling of perineuronal nets (PNN) with antibodies against brevican (Bcan/green), TN-R (green), and phosphacan (Pcan/magenta) or labeling with B-HABP (HA/green). The expression of these molecules in PNN was not affected in Bral1-deficient mice. D, Immunofluorescent labeling of the optic nerves in wild-type mice (+/+) and Bral1-deficient mice (−/−) using antibodies directed against the hyaluronan receptors RHAMM (magenta) and CD44 (green). Note that CD44-positive processes (arrowhead) project to some nodal gaps and that the expression is not affected in Bral1-deficient mice. E, Glial cell type that expresses CD44 in the optic nerve. Note that the GFAP-positive astrocyte (magenta) expresses CD44 (green). F, Western blot analysis of the extracellular matrix in wild-type and Bral1-deficient mice. Crude extracts (15 μg) from wild-type (n = 5) and Bral1-deficient (n = 6) mouse optic nerves were resolved on a 2–15% gradient SDS-PAGE gel and immunoblotted with antibodies to Bral1, versican V2, brevican, and TN-R. G, To quantify the protein levels, densitometric analysis was performed. Data are presented as a percentage of wild-type levels. Error bars indicate ±SD. Scale bars: A, 10 μm; B, 50 μm; C, 20 μm; D, E, 5 μm.
Figure 3.
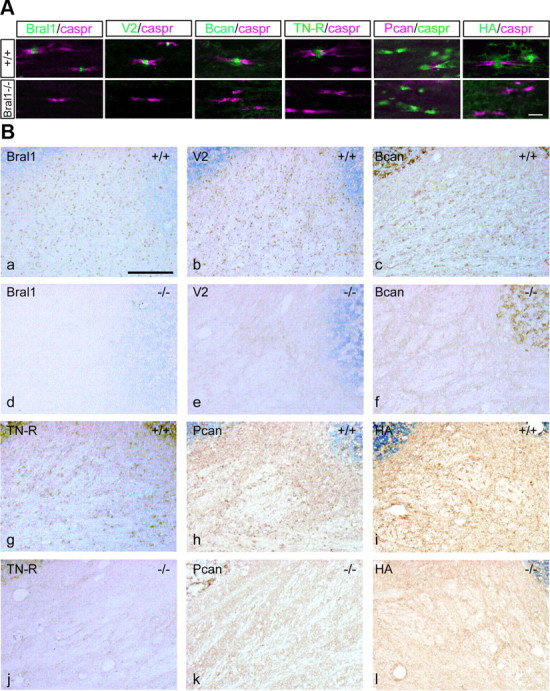
Complete absence of the nodal ECM in the CNS of Bral1-deficient mice. A, Immunofluorescent labeling of the facial nerve tract in wild-type mice (upper column) and Bral1-deficient mice (lower column) using antibodies to Bral1 (green), versican V2 (green), brevican (Bcan/green), TN-R (green), phosphacan (Pcan/magenta), and caspr (magenta or green) or labeling with B-HABP (HA/green). B, Immunohistochemical staining of cerebellar sections from wild-type mice (+/+) and Bral1-deficient mice (−/−) using antibodies against Bral1 (a, d), versican V2 (b, e), brevican (c, f), TN-R (g, j), and phosphacan (h, k) or B-HABP-labeled hyaluronan (i, l). Scale bars: A, 10 μm; B, 100 μm.
To further clarify whether the loss of nodal ECM immunolocalization in Bral1-deficient mice was accompanied by reduced levels of ECM proteins, we examined these protein levels by Western blot analysis. For this experiment, the optic nerve was used, since only this nerve is located in a PNN-free environment and can be reliably dissected without contamination of the parenchymal extracellular matrix aggregates. Despite the lack of nodal ECM in Bral1-deficient mice, Western blot analysis of the mouse optic nerves revealed no significant changes in protein levels in Bral1-deficient mice (n = 6) compared with wild-type mice (n = 5) (Fig. 2F,G).
The ultrastructural organization of myelinated fibers is preserved in Bral1-deficient mice
The expression of Bral1 and versican V2 was detected around postnatal day (P) 20, when myelination has completely finished in the white matter tract of the cerebellum (Oohashi et al., 2002). Therefore, it is possible that their complexes are concerned with the formation of paranodal loops or the attachment of perinodal glia. We examined whether the absence of Bral1 altered the ultrastructural organization of myelinated axons using electron microscopy. The nodal, paranodal, and juxtaparanodal regions appeared to be properly organized in the optic nerve sections of both wild-type mice (n = 21) and mutant mice (n = 27) (Fig. 4A). In ultrathin transverse optic nerve sections, myelin sheath thickness and compaction were similar in wild-type mice and Bral1-deficient mice (Fig. 4B). The projection of perinodal glia, both GFAP-positive astrocytes and NG2 glia, was not affected (Fig. 4C), nor was the expression of other nodal proteins, such as NF 186 and 155, affected (Fig. 4D). These results indicate that Bral1 is not required for myelin sheath formation and the structural organization of distinct axonal domains.
Figure 4.
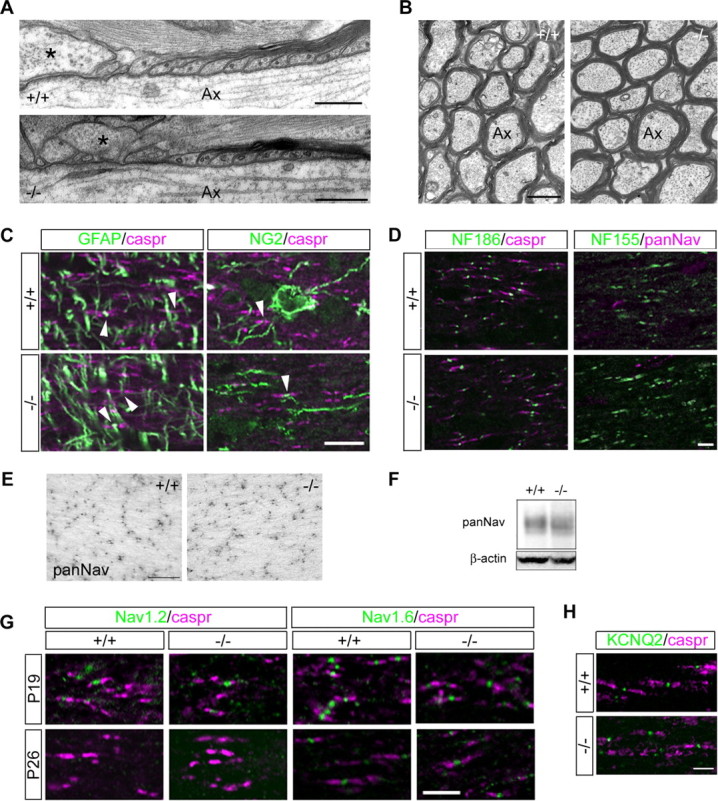
The nodal component structure was not affected in Bral1-deficient mice. A, Ultrastructural analysis of the optic nerves. Longitudinal sections through the optic nerves of 6-month-old wild-type (+/+) and Bral1-deficient (−/−) mice. Note the normal ultrastructure of the paranodal regions of the myelin sheaths and the presence of perinodal astrocyte processes (some marked with asterisk) extending into the nodal regions of the axons. B, Cross sections of wild-type (+/+) and Bral1-deficient (−/−) mice. There are no significant differences in the number of myelinated axons or the ultrastructure of myelin between the two genotypes. Ax, Axon. C, Immunofluorescent analysis of the perinodal glial processes in the optic nerve of wild-type (+/+) and Bral1-deficient (−/−) mice. There are no differences in the projection to nodal gaps of either GFAP-positive astrocytes (arrowhead in left column) or NG2 glia (arrowhead in right column) between wild-type and knock-out animals. D, The distribution of the nodal proteins NF 186 and NF 155 is also not affected in Bral1-deficient mice. E, Immunohistochemical evaluation of sodium channel cluster distribution in the optic nerves of wild-type and Bral1-deficient mice. Representative expression pattern of sodium channel clusters in wild-type (+/+) and Bral1-deficient (−/−) mice. F, Representative data of Western blot, which was performed using crude extracts (15 μg) from the optic nerves of wild-type and Bral1-deficient mice. G, Sodium channel subtype transition occurs normally in Bral1-deficient mice. H, The clustering of KCNQ2 was also not affected in Bral1-deficient mice. Scale bars: A, 300 nm; B, 750 nm; C, E, 10 μm; D, G, H, 5 μm.
Ion channel expression in the optic nerve is normal in Bral1-deficient mice
Sodium channel clustering is also completed around the same time that myelination is finished. To investigate how a lack of Bral1 affects sodium channel clustering, we counted the number of sodium channel clusters in the optic nerve of adult mice using a pan-Na+ channel antibody. The number of sodium channel clusters was counted in 9 fields of view (FOV, each FOV measured 72.9 μm × 87.1 μm) from the optic nerve of wild-type mice and 18 FOVs from Bral1-deficient mice; all mice were 1 year old. As shown in Figure 4E, the number of sodium channel clusters did not differ between wild-type (170.5 ± 12.7, mean ± SD) and mutant mice (159.0 ± 8.9). This result was confirmed by Western blot analysis (n = 3 for each genotype) (Fig. 4F). Moreover, the sodium channel subtype expressed at the nodes undergoes a transition as the nodes mature, from Nav1.2, which is expressed early in development, to Nav1.6, which predominates in adults at approximately the same time that Bral1 is first expressed (Caldwell et al., 2000; Boiko et al., 2001). To verify whether the transition from Nav1.2 to Nav1.6 occurred normally in the mutant mice, we immunostained the optic nerves from Bral1-deficient mice at P19 and P26 using anti-Nav1.2 antibody and anti-Nav1.6 antibody. Almost all of the sodium channel clusters were normally switched to the mature type, Nav1.6, at P26 (Fig. 4G). Furthermore, the clustering of KCNQ2 at the nodes (Devaux et al., 2004) was also not affected in Bral1-deficient mice (Fig. 4H). These results indicate that Bral1 and nodal matrices do not evoke differences in sodium channel clustering and transition or in KCNQ2 channel clustering.
Bral1-deficient mice display slow conduction velocities in the CNS
To investigate whether changes in ECM assembly may affect saltatory conduction even though nodal morphology and ion channel expression were not influenced in Bral1-deficient mice, we examined the electrophysiological properties of the CNS nerves by recording fVEPs. fVEPs have been previously used as a functional measurement of the nerve conduction velocity in the CNS (Strain and Tedford, 1993; Michaelson et al., 1996; Gow et al., 1999). As shown in Figure 5, the latency in Bral1-deficient mice (53.00 ± 0.39 ms, n = 5, p < 0.001) was significantly increased than that in wild-type mice (38.50 ± 0.27 ms, mean ± SD; n = 6). In addition, the amplitude of the fVEPs in mutant mice (4.34 ± 1.37 μV, n = 5, p < 0.001) was significantly smaller than that in wild-type mice (7.01 ± 0.92 μV, n = 6). These results indicate that Bral1 and the nodal ECM complex are involved in saltatory conduction, either directly or indirectly.
Figure 5.

fVEPs were affected in Bral1-deficient mice. A, Representative waveforms of VEP from a wild-type mouse (upper waveform) and a Bral1-deficient mouse (lower waveform). Note that the N1 peak of the Bral1-deficient mouse was lower and prolonged. B, Summary of VEP from wild-type (n = 5) and Bral1-deficient (n = 6) mice. Note that the latency was extremely increased and the amplitude was significantly decreased in Bral1-deficient mice. Significance value was calculated using Student's t test; ***p < 0.001. Error bars indicate ±SD.
Bral1 and its associated extracellular matrices in the CNS contribute to nodal extracellular diffusion barriers
To assess the possibility that the nodal ECM plays a role in the creation of ion diffusion barriers during saltatory conduction, we investigated the diffusion properties of the ECS in the CC of wild-type and Bral1-deficient mice. As a control, the diffusion parameters were also measured in the somatosensory cortex.
The ECS diffusion parameters volume fraction α and the geometrical factor tortuosity λ were determined by the real-time iontophoretic method using ion-selective microelectrodes (Fig. 6A–C), and the ADCW was measured by diffusion-weighted MRI (Fig. 6D). In the cortex of wild-type mice, the ECS diffusion parameters were: α = 0.21 ± 0.01 (mean ± SEM), λ = 1.59 ± 0.01 and ADCW = 633 ± 7 μm2 s−1, with no significant differences in Bral1-deficient animals (Table 1). Due to anisotropy, measurements in the CC were performed along three orthogonal axes, mediolateral (x-axis, along myelinated fibers), rostrocaudal (y-axis), and ventrodorsal (z-axis), as shown in Figure 6A. Diffusion anisotropy, typical of the myelinated CC, was present in both wild-type and Bral1-deficient animals. Tortuosity values in all axes in Bral1-deficient animals was significantly lower (λx = 1.31 ± 0.01; λy = 1.58 ± 0.02; λz = 1.56 ± 0.01) than in wild-type mice (λx = 1.43 ± 0.02; λy = 1.72 ± 0.02; λz = 1.70 ± 0.02) suggesting the facilitated diffusion in mutant mice. The observed decrease in the values of α in the CC, calculated from measurements along all three axes, were not significant (Table 1). Facilitated diffusion in the CC of mutant mice was confirmed by a lower ADCW in wild-type mice (x-axis: 1158 ± 55 μm2 s−1; y-axis: 442 ± 19 μm2 s−1) than in mutant mice (x-axis: 1340 ± 25 μm2 s−1; y-axis: 521 ± 24 μm2 s−1) (Fig. 6D, Table 1). These results indicate that the deletion of Bral1, correlated with a disruption of its associated extracellular complex, results in a reduction of the diffusion barriers formed by ECMs at the nodes of Ranvier, which in turn facilitates diffusion in the white matter. This might be important for neuronal conductivity as well as for extrasynaptic transmission based on the diffusion of neuroactive substances through the ECS.
Table 1.
ECS volume fraction (α), tortuosity (λ), and ADCW in wild-type and Bral1-deficient mice
| Cortex |
Corpus callosum |
|||
|---|---|---|---|---|
| Bral1+/+ | Bral1−/− | Bral1+/+ | Bral1−/− | |
| α | 0.21 ± 0.01 | 0.20 ± 0.01 | 0.21 ± 0.01 | 0.19 ± 0.02 |
| λx | 1.59 ± 0.01 | 1.58 ± 0.03 | 1.43 ± 0.02 | 1.31 ± 0.01*** |
| λy | 1.72 ± 0.02 | 1.58 ± 0.02*** | ||
| λz | 1.70 ± 0.02 | 1.56 ± 0.01*** | ||
| n | 7 | 6 | 5 (x), 5 (y), 11 (z) | 10 (x), 8 (y), 16 (z) |
| N | 5 | 4 | 5 | 7 |
| ADCW (x) (μm2s −1) | 633 ± 7 | 636 ± 15 | 1158 ± 55 | 1340 ± 25** |
| N | 6 | 7 | 6 | 7 |
| ADCW (y) (μm2s −1) | 597 ± 8 | 611 ± 16 | 442 ± 19 | 521 ± 24* |
| N | 11 | 11 | 11 | 11 |
Values are expressed as mean ± SEM; n represents the number of slices; N represents the number of animals; significant differences between wild-type mice (Bral1+/+) and Bral1-deficient mice (Bral1−/−) are marked by asterisks (*p < 0.05,
**p < 0.01,
***p < 0.001). In contrast to the somatosensory cortex, diffusion in the corpus callosum is anisotropic; therefore, the measurements of λ and ADCW in the corpus callosum were performed along three or two orthogonal axes, respectively.
Discussion
We show that the hyaluronan-associated ECM no longer shows a nodal pattern and CNS nerve conduction is markedly decreased even though there are no changes in the nodal components in Bral1-deficient mice; however, the ECS diffusion parameters suggest facilitated diffusion in the white matter of mutant mice. These findings provide a better understanding of the mechanisms underlying the accumulation of cations around the nodes.
Bral1 is indispensable for the stable localization of extranodal matrix assembly in the CNS
This study shows that versican V2, brevican, TN-R, phosphacan and even hyaluronan cannot localize at the nodes in Bral1-deficient mice. Similarly, the immunostaining level of aggrecan was significantly reduced in Crtl1-deficient mice cartilage, confirming an important role for LP in the deposition of proteoglycan aggregates (Watanabe and Yamada, 1999). Our findings further demonstrate that Bral1 is essential for the aggregation of TN-R, phosphacan and hyaluronan in addition to versican V2 and brevican. Our recent study (Bekku et al., 2009) has shown that the localization of Bral1 and versican V2 were not affected at the nodes in brevican-deficient mice, while ECM molecules formed an unusual complex at the nodal gap. Together, current observations indicate that Bral1 is the most important molecule in forming the nodal ECM assembly at the CNS nodes. On the other hand, Western blot analysis of the optic nerves revealed no significant changes in levels of versican V2, brevican, TN-R and phosphacan in Bral1-deficient mice. Therefore, these nodal ECM proteins might exist diffusely throughout the white matter region. In the case of hyaluronan, it may be degraded by hyaluronidase because Crtl1 could retard the degradation of hyaluronan in proteoglycan aggregates in vitro (Rodriguez and Roughley, 2006). Alternatively, the degradation may be secondary to the lack of the nodal lecticans, including versican, in Bral1-deficient mice, because versican may function to maintain hyluronan levels in the ECM (Suwan et al., 2009).
The hyaluronan receptor CD44 was expressed on GFAP-positive astrocytes, which projected to a portion of the nodal gaps in the current study. On the other hand, hyaluronan was expressed in almost all of the nodes, and it did not show a nodal pattern even though CD44 expression was not changed in Bral1-deficient mice. It is not clear whether nodal hyaluronan is bound to CD44 or to hyaluronan synthase, as Carulli et al. (2006) speculated in PNNs. However, it is strongly suggested that Bral1 and/or ECM assemblies are more important for the stable localization of nodal hyaluronan than are cell membrane receptors. A recent study has provided direct evidence that NF 186 recruits brevican to the initial axonal segment (Hedstrom et al., 2007). An even more recent study has proposed that NF plays a role in the assembly of nodal components, e.g., βIV-Spectrin, AnkyrinG, and Contactin (Zonta et al., 2008). The expression of NF 186 was not affected in Bral1-deficient mice. However, the stabilizer of the ECM assembly, Bral1, may also interact with the stabilizer of the cytoskeleton assembly, NF, directly or indirectly.
The role of the hyaluronan binding ECM complex as a diffusion barrier at the node of Ranvier in the CNS
In our previous study, we have proposed that hyaluronan-Bral1-versican V2 complexes could serve as an “extracellular ion pool” in the perinodal ECS (Oohashi et al., 2002). We also have shown that the nodes of axon fibers of a particularly large diameter have a more elaborate ECM assembly than the nodes of smaller axons, as if the ECM could further speed up axonal velocity by a reduction in the resistance of the extracellular medium (Bekku et al., 2009). This study showed that the conduction velocity of Bral1-deficient mice was significantly decreased in comparison with wild-type mice. However, our study did not find any of the changes in ion channels or morphology that are already known to be involved with the generation of an action potential but rather changes in ECM assembly at the nodes. From our previous studies, it is known that changes in the ECM have a strong impact on the diffusion properties of the ECS (Roitbak and Syková, 1999; Syková et al., 2005). In fact, facilitated diffusion, evidenced by a decrease in tortuosity and an increase of ADCW, was also found in the CC of Bral1-deficient mice both along and across the myelinated fibers. On the other hand, diffusion in the neocortex (gray matter) was not significantly different between wild-type and Bral1-deficient mice, since Bral1 is located solely at the nodes of Ranvier. A previous study has shown that anisotropic diffusion in the rat CC is related to myelination. During myelination, λ increases particularly across the myelinated fibers, whereas along the fibers the tortuosity is comparatively lower (Vorísek and Syková, 1997). Bral1 and versican V2 are expressed around P20, when myelination has completely finished in the cerebellum (Oohashi et al., 2002). It seems that the increase in tortuosity across the fibers is, besides the formation of myelin sheaths, also partially affected by an upregulation of the nodal ECM, especially Bral1 and versican V2, at that time.
In contrast to TN-R-negative mice, in which the structure of the ECM was changed throughout the entire cortex, the lack of Bral1 affected the ECM only at the node of Ranvier, while otherwise the ECM in the white matter remained intact. Together, the restricted changes in the ECM in the white matter of Bral1 mutants and the fact that diffusion measurements using the real-time iontophoretic method are averaged over an area of ∼10−3 mm3, it is not surprising that we did not find the expected significant decrease in α in Bral1-deficient mice. However, the destruction of the nodal ECM caused by Bral1 deficiency not only resulted in faster diffusion along the fibers, but might also have created “holes” in which diffusion across the myelinated fibers was much faster, so that the averaged diffusion in those directions was facilitated. Extracellular macromolecules that have a high affinity toward cations such as Na+ (Hunter et al., 1988; Scott, 1989) create little clusters around the nodal ECS. Recent computational modeling of 3D electrodiffusion suggested that the existence of a diffusion barrier, e.g., glial processes, may result in a dramatic effect on the local accumulation of Na+ and K+ ions in the extracellular nodal region (Lopreore et al., 2008). The extranodal matrix assemblies seem to be a potential diffusion barrier that modulates the accumulation of ions in relation to the axonal diameter. Together, our results provide the first evidence of the presence of a diffusion barrier formed by the ECM assemblies at the node of Ranvier and strongly suggest the idea that faster diffusion in mutant mice leads to the leakage of Na+ and K+ from the nodal space, which is normally restricted by the ECM around those locations at which action potentials are generated.
To explore the roles of the nodal ECM, two knock-out mouse studies have been performed, one using TN-R-deficient mice (Weber et al., 1999) and the other using mice deficient in receptor protein tyrosine phosphatases (RPTPβ) (Harroch et al., 2000). RPTPβ have three isoforms, long and short receptor types and phosphacan, which lacks the intracellular and transmembrane domains. TN-R-deficient mice, as well as Bral1-deficient mice, were concomitantly undetectable for nodal phosphacan expression and decreased in axonal conduction velocities without any changes in sodium channel clustering (Weber et al., 1999). On the other hand, the conduction velocity was not altered in RPTPβ-deficient mice (Harroch et al., 2000), although both TN-R and RPTPβ have an ability to interact with the sodium channel (Srinivasan et al., 1998; Xiao et al., 1999; Ratcliffe et al., 2000). Tyrosine phosphorylation on sodium channels was reversed by intracellular catalytic domain of RPTPβ during development. It was speculated that the interaction of the sodium channel β2 subunits with TN-R might be important for placing phosphacan in close proximity to sodium channels, and displacement of RPTPβ by phosphacan would decrease sodium channel activation from depolarized membrane potentials as nodal maturation (Ratcliffe et al., 2000). Recently, we have reported the brevican-dependent, axon-diameter-related localization of TN-R and phosphacan at the node of Ranvier (Bekku et al., 2009), and the current study using Bral1-defecient mice revealed a significant loss of TN-R and phosphacan at the node. Thus, differences in the axonal conduction velocity between the knock-out mice described above may be partially related to the degree of the disorganized nodal matrix barrier in the large myelinated axon as the lack of perineuronal TN-R caused decrease of ECS tortuosity λ in the gray matter (Syková et al., 2005). It appears that Bral1, versican V2, and brevican would not be affected in TN-R- and RPTPβ-deficient mice because Bral1 and versican V2 were not altered in brevican-deficient mice (Bekku et al., 2009). These results thus strongly suggest that Bral1-based ECM association creates a diffusion barrier around the nodes and provide an extranodal micromilieu as an “extracellular ion pool” for saltatory conduction as shown in Figure 7.
Figure 7.

A hypothetical model for the nodal diffusion barrier in the CNS. Hyaluronan-bound gel-like matrices would maintain the microenvironment and function as an ion diffusion barrier around the perinodal ECS in wild-type mice. The ion diffusion barrier would have a dramatic effect on the local accumulation of Na+ and K+ ions in the extracellular nodal region. On the other hand, the destruction of the nodal ECM caused by Bral1 deficiency allows ions to diffuse at the perinodal ECS region.
Footnotes
This work was supported by a Grant-in-Aid for Scientific Research from the Japanese Society for the Promotion of Science (JSPS) (Grants 18791206 and 20791195 to Y.B., and Grants 15591857 and 17046012 to T.O.), the Researcher Exchange Program between the JSPS and the Academy of Sciences of the Czech Republic (ASCR) (to Y.B.), the Ryobi Teien Memory Foundation (to Y.B.), The Ministry of Education, Youth and Sports Grant 1M0538 (to E.S.), ASCR Grant 50390512 (to E.S.), Grant Agency of the Czech Republic Grant 309/09/1597 (to L.V. and E.S.), and Ministry of Health of the Czech Republic Internal Grant Agency Grant NS 9915-4 (to L.V.). We thank Mai Saito for technical assistance; Drs. Wei-Dong Su, Satoshi Hirakawa, and Xiao-Hong Zhou for their help with gene targeting; Dr. Hiroko Baba for kind suggestions; Dr. Yasunori Murakami for helpful comments on this manuscript; Dr. Elior Peles for the gift of anti-Caspr antibody; and James Dutt for editing this manuscript.
References
- Asher RA, Scheibe RJ, Keiser HD, Bignami A. On the existence of a cartilage-like proteoglycan and link proteins in the central nervous system. Glia. 1995;13:294–308. doi: 10.1002/glia.440130406. [DOI] [PubMed] [Google Scholar]
- Aspberg A, Miura R, Bourdoulous S, Shimonaka M, Heinegârd D, Schachner M, Ruoslahti E, Yamaguchi Y. The C-type lectin domains of lecticans, a family of aggregating chondroitin sulfate proteoglycans, bind tenascin-R by protein-protein interactions independent of carbohydrate moiety. Proc Natl Acad Sci U S A. 1997;94:10116–10121. doi: 10.1073/pnas.94.19.10116. [DOI] [PMC free article] [PubMed] [Google Scholar]
- Bekku Y, Su WD, Hirakawa S, Fässler R, Ohtsuka A, Kang JS, Sanders J, Murakami T, Ninomiya Y, Oohashi T. Molecular cloning of Bral2, a novel brain-specific link protein, and immunohistochemical colocalization with brevican in perineuronal nets. Mol Cell Neurosci. 2003;24:148–159. doi: 10.1016/s1044-7431(03)00133-7. [DOI] [PubMed] [Google Scholar]
- Bekku Y, Rauch U, Ninomiya Y, Oohashi T. Brevican distinctively assembles extracellular components at the large diameter nodes of Ranvier in the CNS. J Neurochem. 2009;108:1266–1276. doi: 10.1111/j.1471-4159.2009.05873.x. [DOI] [PubMed] [Google Scholar]
- Boiko T, Rasband MN, Levinson SR, Caldwell JH, Mandel G, Trimmer JS, Matthews G. Compact myelin dictates the differential targeting of two sodium channel isoforms in the same axon. Neuron. 2001;30:91–104. doi: 10.1016/s0896-6273(01)00265-3. [DOI] [PubMed] [Google Scholar]
- Caldwell JH, Schaller KL, Lasher RS, Peles E, Levinson SR. Sodium channel Na(v)1.6 is localized at nodes of ranvier, dendrites, and synapses. Proc Natl Acad Sci U S A. 2000;97:5616–5620. doi: 10.1073/pnas.090034797. [DOI] [PMC free article] [PubMed] [Google Scholar]
- Carulli D, Rhodes KE, Brown DJ, Bonnert TP, Pollack SJ, Oliver K, Strata P, Fawcett JW. Composition of perineuronal nets in the adult rat cerebellum and the cellular origin of their components. J Comp Neurol. 2006;494:559–577. doi: 10.1002/cne.20822. [DOI] [PubMed] [Google Scholar]
- Carulli D, Rhodes KE, Fawcett JW. Upregulation of aggrecan, link protein 1, and hyaluronan synthases during formation of perineuronal nets in the rat cerebellum. J Comp Neurol. 2007;501:83–94. doi: 10.1002/cne.21231. [DOI] [PubMed] [Google Scholar]
- Church GM, Gilbert W. Genomic sequencing. Proc Natl Acad Sci U S A. 1984;81:1991–1995. doi: 10.1073/pnas.81.7.1991. [DOI] [PMC free article] [PubMed] [Google Scholar]
- Devaux JJ, Kleopa KA, Cooper EC, Scherer SS. KCNQ2 is a nodal K+ channel. J Neurosci. 2004;24:1236–1244. doi: 10.1523/JNEUROSCI.4512-03.2004. [DOI] [PMC free article] [PubMed] [Google Scholar]
- Franklin KBJ, Paxinos G. The mouse brain in stereotaxic coordinates. San Diego: Academic; 1997. [Google Scholar]
- Goto Y, Furuta A, Tobimatsu S. Magnesium deficiency differentially affects the retina and visual cortex of intact rats. J Nutr. 2001;131:2378–2381. doi: 10.1093/jn/131.9.2378. [DOI] [PubMed] [Google Scholar]
- Gow A, Southwood CM, Li JS, Pariali M, Riordan GP, Brodie SE, Danias J, Bronstein JM, Kachar B, Lazzarini RA. CNS myelin and sertoli cell tight junction strands are absent in Osp/claudin-11 null mice. Cell. 1999;99:649–659. doi: 10.1016/s0092-8674(00)81553-6. [DOI] [PubMed] [Google Scholar]
- Harroch S, Palmeri M, Rosenbluth J, Custer A, Okigaki M, Shrager P, Blum M, Buxbaum JD, Schlessinger J. No obvious abnormality in mice deficient in receptor protein tyrosine phosphatase beta. Mol Cell Biol. 2000;20:7706–7715. doi: 10.1128/mcb.20.20.7706-7715.2000. [DOI] [PMC free article] [PubMed] [Google Scholar]
- Hedstrom KL, Xu X, Ogawa Y, Frischknecht R, Seidenbecher CI, Shrager P, Rasband MN. Neurofascin assembles a specialized extracellular matrix at the axon initial segment. J Cell Biol. 2007;178:875–886. doi: 10.1083/jcb.200705119. [DOI] [PMC free article] [PubMed] [Google Scholar]
- Hirakawa S, Oohashi T, Su WD, Yoshioka H, Murakami T, Arata J, Ninomiya Y. The brain link protein-1 (BRAL1): cDNA cloning, genomic structure, and characterization as a novel link protein expressed in adult brain. Biochem Biophys Res Commun. 2000;276:982–989. doi: 10.1006/bbrc.2000.3583. [DOI] [PubMed] [Google Scholar]
- Hunter GK, Wong KS, Kim JJ. Binding of calcium to glycosaminoglycans: an equilibrium dialysis study. Arch Biochem Biophys. 1988;260:161–167. doi: 10.1016/0003-9861(88)90437-7. [DOI] [PubMed] [Google Scholar]
- Lopreore CL, Bartol TM, Coggan JS, Keller DX, Sosinsky GE, Ellisman MH, Sejnowski TJ. Computational modeling of 3D electrodiffusion in biological systems: application to the node of Ranvier. Biophys J. 2008;95:2624–2635. doi: 10.1529/biophysj.108.132167. [DOI] [PMC free article] [PubMed] [Google Scholar]
- Lynn BD, Li X, Cattini PA, Turley EA, Nagy JI. Identification of sequence, protein isoforms, and distribution of the hyaluronan-binding protein RHAMM in adult and developing rat brain. J Comp Neurol. 2001;439:315–330. doi: 10.1002/cne.1353. [DOI] [PubMed] [Google Scholar]
- Michaelson MD, Bieri PL, Mehler MF, Xu H, Arezzo JC, Pollard JW, Kessler JA. CSF-1 deficiency in mice results in abnormal brain development. Development. 1996;122:2661–2672. doi: 10.1242/dev.122.9.2661. [DOI] [PubMed] [Google Scholar]
- Nicholson C, Phillips JM. Ion diffusion modified by tortuosity and volume fraction in the extracellular microenvironment of the rat cerebellum. J Physiol. 1981;321:225–257. doi: 10.1113/jphysiol.1981.sp013981. [DOI] [PMC free article] [PubMed] [Google Scholar]
- Nicholson C, Syková E. Extracellular space structure revealed by diffusion analysis. Trends Neurosci. 1998;21:207–215. doi: 10.1016/s0166-2236(98)01261-2. [DOI] [PubMed] [Google Scholar]
- Oohashi T, Bekku Y. Brain Link Proteins: Neuromodulators for scaffolding the specialized hyaluronan-binding extracellular milieu in the brain. In: Maeda N, editor. Neural proteoglycans. India: Research Signpost; 2007. pp. 67–83. [Google Scholar]
- Oohashi T, Hirakawa S, Bekku Y, Rauch U, Zimmermann DR, Su WD, Ohtsuka A, Murakami T, Ninomiya Y. Bral1, a brain-specific link protein, colocalizing with the versican V2 isoform at the nodes of Ranvier in developing and adult mouse central nervous systems. Mol Cell Neurosci. 2002;19:43–57. doi: 10.1006/mcne.2001.1061. [DOI] [PubMed] [Google Scholar]
- Poliak S, Peles E. The local differentiation of myelinated axons at nodes of Ranvier. Nat Rev Neurosci. 2003;4:968–980. doi: 10.1038/nrn1253. [DOI] [PubMed] [Google Scholar]
- Prokopová S, Vargová L, Syková E. Heterogeneous and anisotropic diffusion in the developing rat spinal cord. Neuroreport. 1997;8:3527–3532. doi: 10.1097/00001756-199711100-00022. [DOI] [PubMed] [Google Scholar]
- Ratcliffe CF, Qu Y, McCormick KA, Tibbs VC, Dixon JE, Scheuer T, Catterall WA. A sodium channel signaling complex: modulation by associated receptor protein tyrosine phosphatase beta. Nat Neurosci. 2000;3:437–444. doi: 10.1038/74805. [DOI] [PubMed] [Google Scholar]
- Rice ME, Okada YC, Nicholson C. Anisotropic and heterogeneous diffusion in the turtle cerebellum: implications for volume transmission. J Neurophysiol. 1993;70:2035–2044. doi: 10.1152/jn.1993.70.5.2035. [DOI] [PubMed] [Google Scholar]
- Rodriguez E, Roughley P. Link protein can retard the degradation of hyaluronan in proteoglycan aggregates. Osteoarthritis Cartilage. 2006;14:823–829. doi: 10.1016/j.joca.2006.02.008. [DOI] [PubMed] [Google Scholar]
- Roitbak T, Syková E. Diffusion barriers evoked in the rat cortex by reactive astrogliosis. Glia. 1999;28:40–48. doi: 10.1002/(sici)1098-1136(199910)28:1<40::aid-glia5>3.0.co;2-6. [DOI] [PubMed] [Google Scholar]
- Scott JE. Ion binding: patterns of ‘affinity’ depending on types of acid groups. Symp Soc Exp Biol. 1989;43:111–115. [PubMed] [Google Scholar]
- Srinivasan J, Schachner M, Catterall WA. Interaction of voltage-gated sodium channels with the extracellular matrix molecules tenascin-C and tenascin-R. Proc Natl Acad Sci U S A. 1998;95:15753–15757. doi: 10.1073/pnas.95.26.15753. [DOI] [PMC free article] [PubMed] [Google Scholar]
- Strain GM, Tedford BL. Flash and pattern reversal visual evoked potentials in C57BL/6J and B6CBAF1/J mice. Brain Res Bull. 1993;32:57–63. doi: 10.1016/0361-9230(93)90319-7. [DOI] [PubMed] [Google Scholar]
- Suwan K, Choocheep K, Hatano S, Kongtawelert P, Kimata K, Watanabe H. Versican/PG-M assembles hyaluronan into extracellular matrix and inhibits CD44-mediated signaling toward premature senescence in embryonic fibroblasts. J Biol Chem. 2009;284:8596–8604. doi: 10.1074/jbc.M806927200. [DOI] [PMC free article] [PubMed] [Google Scholar]
- Syková E. Ionic and volume changes in the microenvironment of nerve and receptor cells. In: Otterson D, editor. Progress in sensory physiology. Berlin: Springer; 1992. pp. 1–167. [Google Scholar]
- Syková E. Extrasynaptic volume transmission and diffusion parameters of the extracellular space. Neuroscience. 2004;129:861–876. doi: 10.1016/j.neuroscience.2004.06.077. [DOI] [PubMed] [Google Scholar]
- Syková E, Nicholson C. Diffusion in brain extracellular space. Physiol Rev. 2008;88:1277–1340. doi: 10.1152/physrev.00027.2007. [DOI] [PMC free article] [PubMed] [Google Scholar]
- Syková E, Vargová L. Extrasynaptic transmission and the diffusion parameters of the extracellular space. Neurochem Int. 2008;52:5–13. doi: 10.1016/j.neuint.2007.04.007. [DOI] [PubMed] [Google Scholar]
- Syková E, Svoboda J, Polák J, Chvátal A. Extracellular volume fraction and diffusion characteristics during progressive ischemia and terminal anoxia in the spinal cord of the rat. J Cereb Blood Flow Metab. 1994;14:301–311. doi: 10.1038/jcbfm.1994.37. [DOI] [PubMed] [Google Scholar]
- Syková E, Vorísek I, Mazel T, Antonova T, Schachner M. Reduced extracellular space in the brain of tenascin-R- and HNK-1-sulphotransferase deficient mice. Eur J Neurosci. 2005;22:1873–1880. doi: 10.1111/j.1460-9568.2005.04375.x. [DOI] [PubMed] [Google Scholar]
- Vorísek I, Syková E. Evolution of anisotropic diffusion in the developing rat corpus callosum. J Neurophysiol. 1997;78:912–919. doi: 10.1152/jn.1997.78.2.912. [DOI] [PubMed] [Google Scholar]
- Watanabe H, Yamada Y. Mice lacking link protein develop dwarfism and craniofacial abnormalities. Nat Genet. 1999;21:225–229. doi: 10.1038/6016. [DOI] [PubMed] [Google Scholar]
- Weber P, Bartsch U, Rasband MN, Czaniera R, Lang Y, Bluethmann H, Margolis RU, Levinson SR, Shrager P, Montag D, Schachner M. Mice deficient for tenascin-R display alterations of the extracellular matrix and decreased axonal conduction velocities in the CNS. J Neurosci. 1999;19:4245–4262. doi: 10.1523/JNEUROSCI.19-11-04245.1999. [DOI] [PMC free article] [PubMed] [Google Scholar]
- Xiao ZC, Ragsdale DS, Malhotra JD, Mattei LN, Braun PE, Schachner M, Isom LL. Tenascin-R is a functional modulator of sodium channel beta subunits. J Biol Chem. 1999;274:26511–26517. doi: 10.1074/jbc.274.37.26511. [DOI] [PubMed] [Google Scholar]
- Zámecník J, Vargová L, Homola A, Kodet R, Syková E. Extracellular matrix glycoproteins and diffusion barriers in human astrocytic tumours. Neuropathol Appl Neurobiol. 2004;30:338–350. doi: 10.1046/j.0305-1846.2003.00541.x. [DOI] [PubMed] [Google Scholar]
- Zhou XH, Brakebusch C, Matthies H, Oohashi T, Hirsch E, Moser M, Krug M, Seidenbecher CI, Boeckers TM, Rauch U, Buettner R, Gundelfinger ED, Fässler R. Neurocan is dispensable for brain development. Mol Cell Biol. 2001;21:5970–5978. doi: 10.1128/MCB.21.17.5970-5978.2001. [DOI] [PMC free article] [PubMed] [Google Scholar]
- Zonta B, Tait S, Melrose S, Anderson H, Harroch S, Higginson J, Sherman DL, Brophy PJ. Glial and neuronal isoforms of neurofascin have distinct roles in the assembly of nodes of Ranvier in the central nervous system. J Cell Biol. 2008;181:1169–1177. doi: 10.1083/jcb.200712154. [DOI] [PMC free article] [PubMed] [Google Scholar]