

Abstract
In epilepsy, the cortical network fluctuates between the asymptomatic interictal state and the symptomatic ictal state of seizures. Despite their importance, the network dynamics responsible for the transition between the interictal and ictal states are largely unknown. Here we used multielectrode single-unit recordings from the hippocampus to investigate the network dynamics during the development of seizures evoked by various chemoconvulsants in vivo. In these experiments, we detected a typical network dynamics signature that preceded seizure initiation. The preictal state preceding pilocarpine-, kainate-, and picrotoxin-induced seizures was characterized by biphasic network dynamics composed of an early desynchronization phase in which the tendency of neurons to fire correlated action potentials decreased, followed by a late resynchronization phase in which the activity and synchronization of the network gradually increased. This biphasic network dynamics preceded the initiation both of the initial seizure and of recurrent spontaneous seizures that followed. During seizures, firing of individual neurons and interneuronal synchronization further increased. These findings advance our understanding of the network dynamics leading to seizure initiation and may in future help in the development of novel seizure prediction algorithms.
Introduction
In epilepsy, the neural network fluctuates between two activity states. The cortical network of the “epileptic brain” spends the vast majority of the time in the asymptomatic interictal state. Infrequently, and for the most part unexpectedly, the “epileptic network” enters a second ictal activity state, which manifests clinically as epileptic seizures (Brodie and French, 2000; Browne and Holmes, 2001; Duncan et al., 2006). One of the central goals of epilepsy research is to understand the transition from the interictal state into a seizure, in view of the fact that this transition serves as the main target for almost all antiepileptic treatments. Despite the importance of the interictal-to-ictal-state transition, the network dynamics underlying this process remain largely unknown. Interictal-to-ictal-state transition has been studied previously using either electroencephalogram (EEG) recordings from human patients or intracellular recordings from single neurons in vitro. Studies that used surface and intracranial EEG recordings from human patients with partial epilepsy showed that the transition between the interictal and ictal states does not occur abruptly; rather, there exists a third activity state, the preictal state, which serves as a transitional network activity state between the interictal and ictal states (Martinerie et al., 1998; Le Van Quyen et al., 2001; Litt et al., 2001; Navarro et al., 2002). Studies based on intracellular recordings from brain slices or isolated hippocampi in vitro reported that seizure-like events are preceded by disruption of the inhibition–excitation balance, which can result from either reduction in inhibition or increased excitatory drive. In addition, it has been postulated that inhibitory interneurons participate in seizure initiation either by synchronizing large neuronal populations, via their wide spread and abundant connectivity, or by generating GABAergic-mediated depolarizing postsynaptic potentials (Wendling et al., 2002; Trevelyan et al., 2007; Derchansky et al., 2008).
In this study, we investigated the network dynamics during the development of seizures by monitoring action potential firing from multiple neurons. Simultaneous recording of action potential firing from multiple neurons using multielectrode single-unit recordings allowed us on the one hand to directly record firing of individual neurons and on the other hand to monitor synchronization of firing between the recorded neurons. We found that preictal states preceding pilocarpine-, kainate and picrotoxin-induced seizures were preceded by a typical biphasic network dynamics composed of an early desynchronization phase in which interneuronal synchronization markedly decreased, followed by a later resynchronization phase characterized by a gradual buildup of the activity and synchronization in the network. This network dynamics preceded both the initial seizure and subsequent recurrent seizures, in which the network spontaneously fluctuated between the interictal and ictal states.
Materials and Methods
Animals and surgery.
All experiments were performed on 4- to 6-week-old male Wistar rats. The rats were anesthetized with either intraperitoneal urethane (10 ml/kg 20% urethane) or the gas anesthetic halothane. After the rat was anesthetized, lidocaine (2%) was locally injected into the scalp region. Later, the rats were held with a short metal rod glued to the posterior aspect of the skull with dental cement. The skin covering the skull was opened and the skull was exposed. A small craniotomy was performed 4.8 mm posterior to bregma and 3.6 mm lateral to the midline using a dental drill. The dura covering the cortex was carefully removed using fine forceps. In the awake-rat experiments, rats were first anesthetized with the gas anesthetic halothane and lidocaine (2%) was injected locally. Under this anesthesia, the craniotomy was performed, the dura was removed, and the electrodes were lowered into the CA1 region of the hippocampus and fixated to the skull using dental cement (for details, see following section). After the electrodes were firmly fixated, halothane was discontinued and rats woke up. Before discontinuation of halothane, additional lidocaine was injected locally to avoid pain at the craniotomy site.
Throughout all experiments, body temperature was maintained at 37.5°C using a closed-loop animal blanket system (FHC).
Seizure induction.
We used four different methods to evoke seizures. (1) Systemic application of pilocarpine: pilocarpine (300 mg/kg) dissolved in normal saline was injected intraperitoneally. (2) Local intrahippocampal application of pilocarpine: 0.2 μl of 100 mm pilocarpine [dissolved in artificial CSF (aCSF)] was injected into either the CA1 or CA3 region of the hippocampus by using a metal cannula and a syringe pump (WPI, SP100IZ). The injection site was located ∼0.3–1 mm away from the recording site. At the end of the experiment, the brain was removed and sliced (300-μm-thick slices) to confirm the site of injection. (3) Systemic application of picrotoxin: picrotoxin (30 mg/kg) dissolved in normal saline was injected intraperitoneally. All the chemicals were purchased from Sigma-Aldrich. The existence of seizures was monitored both behaviorally and electrophysiologically (for details, see following section). (4) Local intrahippocampal application of kainate: 0.2 μl of 2 mg/ml kainate (dissolved in aCSF) was injected into the CA3 region of the hippocampus (3.14 mm posterior to the bregma, 2.6 mm lateral to the midline, and depth of ∼3.6 mm) using a metal cannula and a syringe pump (WPI, SP100IZ). At the end of the experiment, the brain was removed and sliced (300-μm-thick slices) to confirm the site of injection.
Electrophysiological recordings.
A bundle of five tungsten metal electrodes was inserted in the CA1 region of the hippocampus (4.8 mm posterior to the bregma, 3.6 mm lateral to the midline, and depth of ∼2.3–2.8 mm). The electrode bundle was lowered to the CA1 hippocampal subfield using a precision stereotactic micromanipulator (TSE-systems). The depth of the CA1 region was determined electrophysiologically. Typically, when the electrode passed the neocortex, single-unit activity was recorded. Later, as the electrode passed through the subcortical white matter and stratum oriens of the hippocampus, no activity was recorded. When the electrode reached the cell body layer of the CA1 region, single-unit activity was again recorded. At the end of each experiment, the location of the recording electrode was confirmed histologically (for details, see below). In anesthetized rats, the electrodes were held by the micromanipulator throughout the experiment. In awake-rat experiments, the electrode bundle was released from the micromanipulator after it was fixated to the skull with dental cement.
The electrode bundle we used for the experiments was composed of five insulated tungsten electrodes (diameter of 200 μm, sharpened at the tip to 2–5 μm) with an impedance of 0.5–2 MΩ. To obtain the electrode bundle, the five separate electrodes were glued in either a circular or a rectangular arrangement. The interelectrode distance was 0.2–0.35 mm. Hence, circular bundles had a diameter of 0.6–1 mm and rectangular bundles had a width of 0.4–0.6 mm and a length of 0.6–1 mm. Typically, we obtained reliable recordings from three to five of the electrodes (Fig. 1). In addition, one or two silver wires were implanted subdurally over the frontal hemispheres bilaterally, and the ground silver electrode was inserted subdurally over the anterior contralateral frontal region.
Figure 1.
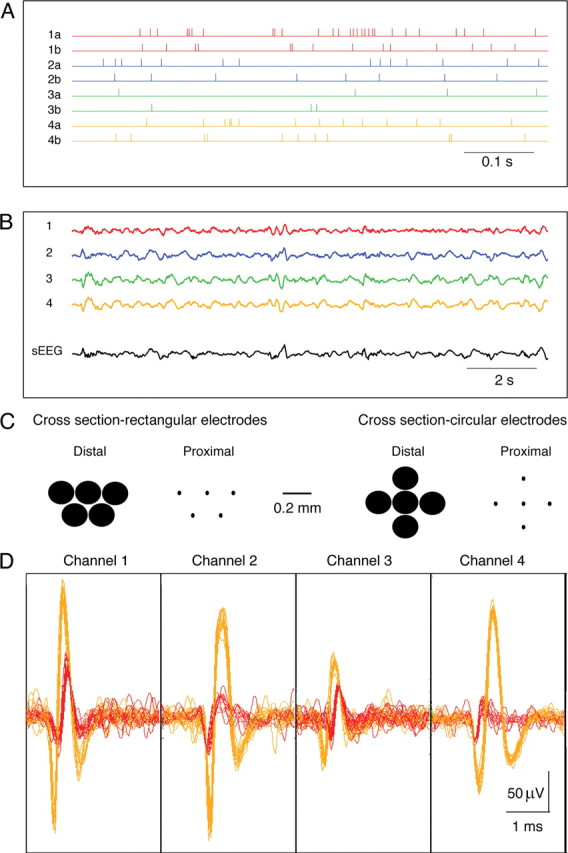
Multielectrode single-unit recordings. A bundle of five insulated tungsten electrodes (diameter of 200 μm, impedance of 0.9–1.5 MΩ) was inserted into the CA1 region of the left hippocampus. For each electrode, we extracted the single-unit activity and the local ECoG. The single-unit activity was obtained by filtering the recording at 1–5 kHz and spike sorting the filtered data. To obtain the ECoG recording, we filtered the data at 0.5–100 Hz. Two additional silver wires were implanted subdurally over the frontal lobes bilaterally to record the EEG [filtered at 0.5–100 Hz, surface EEG (sEEG)]. A, The spike time trains are shown for eight different neurons (2 neurons per electrode from 4 different electrodes). The colors of the traces designate the recording electrode. Hence, traces from two neurons recorded with the same electrode are plotted in the same color. B, The local ECoG recordings from the same four electrodes (upper 4 traces) and the surface EEG from the left frontal region (lower trace). All data recorded from the same electrode (local ECoG and spike trains of 2 neurons) are plotted in the same color. C, Cross-sections through our rectangular and circular recording multielectrodes. We present two cross-sections through our multielectrodes, proximal (far from the recording site) and distal (close to the recording site). The size of the sharpened tips of our electrodes is even smaller (2–5 μm). D, Superimposed single traces of spikes from each electrode. Spikes from the two neurons recorded with each electrode are plotted with different colors (yellow and red).
During the recordings, the recorded signals were amplified (×1000), filtered (0.1–10,000 Hz), and stored in a computer using the ME-16 amplifier and MC-Rack software (MEA). The digital sampling rate of our recordings was 25 kHz.
To confirm the location of the recording electrodes after completing the experiments, brains were removed, sliced, and examined histologically. At the end of the experiments, we either removed the brain and sliced it acutely (200–300 μm thick) using a vibratome as previously described, or removed the brain after heart perfusion first with saline and then with 4% paraformaldehyde in 0.1 m phosphate buffer. Later, the fixed brain was sliced (50–200 μm thick) and stained with Nissl staining.
Analysis.
Analysis of the data was performed for the most part offline, although our software allows real-time analysis as well. After completion of the experiments, the recorded data were replayed and filtered with two different bandpass filters: 0.5–100 Hz to obtain the local EEG/electrocorticograph (ECoG) and 1–5 kHz to obtain spikes. The time of seizure initiation was determined from the local ECoG recordings. The spike data were later sorted into single-unit activity using the MC-Rack software. Single units were sorted according to a combined threshold and shape detector. We carefully performed the sorting of spikes and excluded uncertain neurons from our analysis. Nevertheless, we cannot rule out the possibility that in some cases spikes that were attributed to a single neuron in fact represented multiunit recordings originated from more than one neuron. The spike trains obtained with the MC-Rack software were exported to the NeuroExplorer software (Nex Technologies), which allowed us to calculate the firing rates of individual neurons, the pairwise cross-correlation function, the probability for pairwise simultaneous firing, and the statistical significance levels.
For calculation of the cross-correlation function, we used the following algorithm: the cross-correlogram shows the conditional probability of a spike in the spike train at time t on the condition that there is a reference spike at time 0. For calculating the cross-correlation function, the time axis is divided into bins. The first bin is [XMin, XMin + Bin). The second bin is [XMin + Bin, XMin + Bin · 2), etc. The left end is included in each bin, and the right end is excluded from the bin.
Let ref[i] be the array of timestamps of the reference event, and ts[i] be the spike train (ts, timestamp). (1) For each timestamp ref[k], calculate the distances from this spike to all the spikes in the spike train as follows: d[i] = ts[i] − ref[k]. (2) For each i, if d[i] is inside the first bin, increment the bin counter for the first bin as follows: If d[i] ≥ XMin and d[i] < XMin + Bin then bincount[1] = bincount[1] +1. If d[i] is inside the second bin, increment the bin counter for the second bin as follows: If d[i] ≥ XMin + Bin and d[i] < XMin + Bin · 2 then bincount[2] = bincount[2] +1 and so on.
For normalizing the values for probability of spike occurrence, bin counts are divided by the number reference events.
For calculating the pairwise cross-correlation function corrected for chance correlation, we first calculated the expected rate of chance correlation of spikes from the firing rates of the two neurons and subtracted this value from the cross-correlation function.
Further analysis of the data and plotting of graphs were performed with the Igor software (WaveMetrics).
Analysis of single-unit firing during seizures was associated with special difficulty. First, it was limited to the phases of seizures that enabled reliable identification of single units. Typically, when the ECoG showed sharp spike activity, and when movement and muscle artifacts dominated the recording, single units could not be identified reliably, and hence these seizure phases were excluded from analysis. Second, seizures typically were composed of several phases, as determined by the ECoG recordings. In this project, the results of all seizure phases were averaged together rather than being analyzed separately.
Results
Pilocarpine-induced epileptic seizures
Intraperitoneal application of pilocarpine (300 mg/kg) resulted in the induction of epileptic seizures. Typically, seizures initiated 6–34 min after pilocarpine was injected (average of 13 ± 7 min) and manifested both clinically and electrographically. Following the first seizure, recurrent spontaneous seizures followed, in which spontaneous transitions occurred between the interictal and ictal states. Typically, the duration of the interictal periods between seizures lasted 25 s up to 12 min (average of 4.4 ± 3.1 min) (Fig. 2). To investigate network dynamics during the development of seizures, we simultaneously recorded the single-unit activity from 5 to 12 neurons in the CA1 region of the hippocampus by using an array of five sharp tungsten electrodes (1–2 MΩ) (Fig. 1). The initiation time of seizures in the recorded hippocampal region was determined by simultaneous local intrahippocampal ECoG and surface EEG recordings (Fig. 2). We defined seizure initiation as the appearance of bursts of sharp beta waves, repetitive sharp waves or spikes, and sharp waves with or without accompanying slow waves.
Figure 2.

Local intrahippocampal ECoG and surface EEG recordings during seizure initiation. A bundle of five insulated tungsten electrodes (diameter of 200 μm, impedance of 0.9–1.5 MΩ) was inserted into the CA1 region of the left hippocampus and two silver wires were placed subdurally over the frontal lobes bilaterally. A, Recurrent seizures evoked by intraperitoneal application of pilocarpine, as recorded by a single electrode in the CA1 region. B, Single seizure recorded by multiple electrodes. The upper four traces (black) show the intrahippocampal ECoG recording and the lower two traces (gray) show the surface EEG recordings. All data were filtered at 0.5–100 Hz. Note the initiation of a seizure during the recording (marked by an arrow). Ch, Channel; Lt, left temporal; Rt, right temporal.
During the preictal state between pilocarpine injection and seizure initiation, firing rates of individual neurons gradually increased (Fig. 3). This effect was especially evident during the later stages of the preictal state. The average firing rate of spikes in individual neurons increased by 66.5 ± 16% during the early preictal phase (1–4 min after pilocarpine application) and by 326.4 ± 66% during the late preictal phase (last 3 min preceding seizure initiation). During seizures, the firing rate of spikes further increased and reached an averaged value of 620 ± 101% of the control value.
Figure 3.

Firing rates of individual neurons during the development of pilocarpine-induced seizures. The average (mean ± SEM) firing rates of individual neurons are plotted as a function of time during the development of pilocarpine-induced epileptic seizures. A, B, The data are presented for a single experiment (A, 9 neurons) and for a pool of 25 experiments (B, 176 neurons) during the last 3 min of the control period, the early preictal state (1–4 min after application of pilocarpine), the late preictal state (last 3 min before seizure initiation), and seizures. For the single-experiment data, the average firing rates are presented every minute. For the pooled experiment data, the average firing rates are presented as percentages of the average control firing rate values, which were obtained for each neuron by averaging the firing rates during the 10 min period preceding pilocarpine application. **p < 0.01 compared with control conditions.
We next investigated network synchronization during the development of epileptic seizures. To assess synchronization of firing between different neurons we calculated the pairwise spike train cross-correlation function corrected for chance correlations. This function allowed us to assess the tendency of neuronal pairs to selectively fire correlated spikes. The results of this analysis are presented for a single experiment (Fig. 4) (9 neurons recorded in five electrodes) and a pool of 25 experiments (Fig. 5) (176 neurons). Under control conditions, neurons tended to fire correlated spikes with a peak occurrence at an interneuronal time lag of 0 milliseconds and duration of several hundred milliseconds (average half-width of 190 ± 32 s) (Figs. 4, 5). That is to say, when a neuron fired an action potential, the firing probability of other neurons in the network to fire action potentials increased for several hundred milliseconds around that event, and the maximal probability for correlated firing occurred at a 0 millisecond time lag between the neurons. On average, 98 ± 1% of all neuronal pairs showed a significant tendency to fire correlated spikes during the control period (Figs. 4A,B, 5A), and the average probability for correlated action potential firing in neuronal pairs (time lag of 0 ± 5 ms) was 225 ± 35% greater than the value expected for chance correlation (Figs. 4A,C, 5B) (892 pairs of neurons from 176 neurons in 25 rats). Several potential mechanisms can underlie the correlated firing we observed under control conditions. These mechanisms include a common excitatory input from either the CA3 region, the perforant pathway, or other extrahippocampal structures; synchronization mediated by the inhibitory interneurons; or local connections between the CA1 pyramidal neurons.
Figure 4.
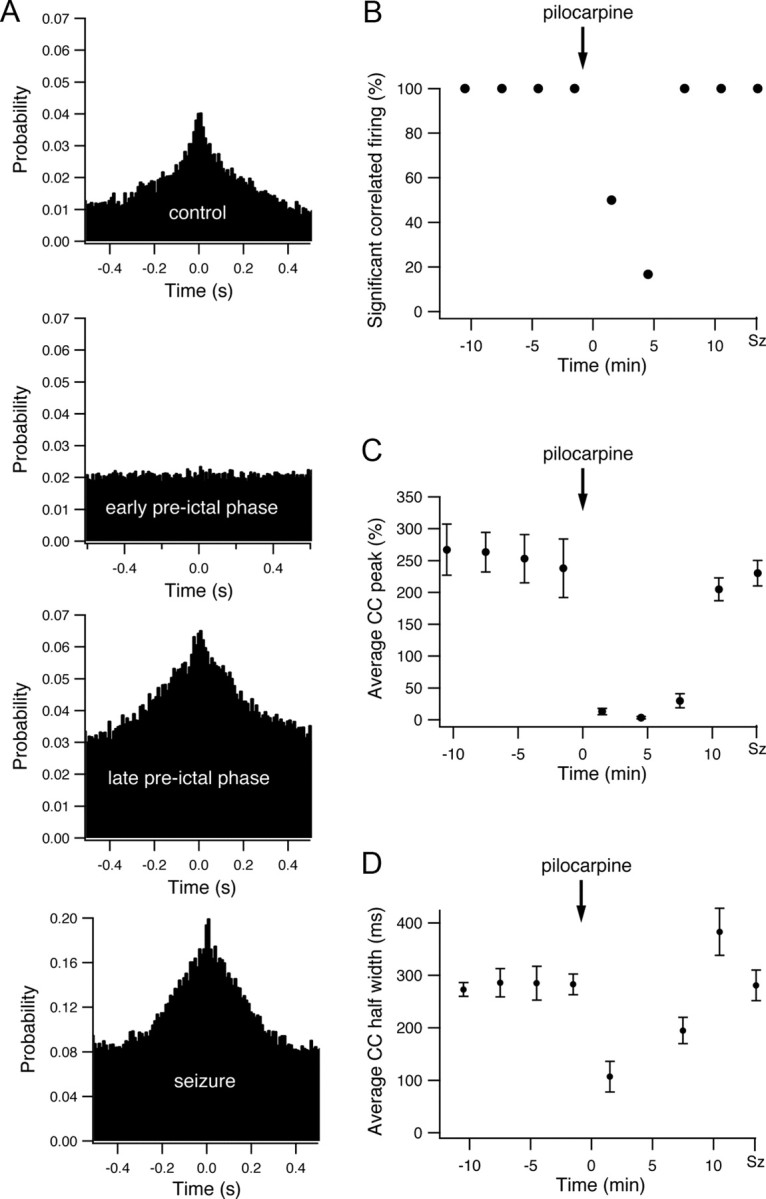
Interneuronal synchronization during the development of pilocarpine-induced seizures. A, The pairwise cross-correlation function (10 ms time bin) obtained from a single pair of neurons during the last 3 min of the control period, the early preictal state (1–4 min after application of pilocarpine), the late preictal state (last 3 min before seizure initiation), and seizures. The x axis designates the time lag of firing between the two neurons in milliseconds, and the y axis designates the probability that the second neuron will fire if the first cell fired at time 0. B, The average percentage of neuronal pairs with significant correlated firing is presented as a function of time during the development of pilocarpine-induced seizures in a single experiment (9 neurons). Significant correlated firing in neuronal pairs was determined by the existence of a significant positive peak in the cross-correlation function, which in turn was defined as at least three consecutive 10 ms bins at time lags of 0 ± 50 ms with cross-correlation value exceeding the p < 0.01 values. C–D, The average peak (C) and half-width (D) of the cross-correlation function are plotted as a function of time during the development of pilocarpine-induced seizures. The data were averaged from all neuronal pairs in a single experiment (9 neurons), and the peak values are presented as the mean ± SEM percentage values above the expected chance correlation values. For averaging the peaks of individual cross-correlograms, the cross-correlation functions were first normalized to the chance correlation values expected from the average firing rates of the two neurons, and the peak values were measured as the percentage difference above the chance correlation value.
Figure 5.

Interneuronal synchronization and probability for instantaneous firing in neuronal pairs during the development of pilocarpine-induced seizures. A, Average percentage of neuronal pairs with significant correlated firing averaged from a pool of 25 experiments (892 pairs of neurons from 176 neurons). Significant correlated firing in neuronal pairs was determined by the existence of a significant positive peak in the cross-correlation function, which in turn was defined as at least three consecutive 10 ms bins at time lags of 0 ± 50 ms with cross-correlation value exceeding the p < 0.01 values. B, C, Average (mean ± SEM) peak (B) and half-width (C) of the cross-correlation (CC) functions averaged from a pool of 25 experiments (892 pairs of neurons from 176 neurons) during the last 3 min of the control period, the early preictal state (1–4 min after application of pilocarpine), the late preictal state (last 3 min before seizure initiation), and seizures. D, E, Probabilities for instantaneous firing in neuronal pairs during a 10 ms time bins in percentage values are plotted as a function of time during the development of pilocarpine-induced seizures. The data are shown for a single experiment (D, 9 neurons) and a pool of 25 experiments (E, 176 neurons). For the single-experiment data, the average (mean ± SEM) probability for instantaneous firing in neuronal pairs is presented every minute, while for the pool of 25 experiments the average (mean ± SEM) probability for instantaneous firing in neuronal pairs is presented for the last 3 min of the control period, the early preictal state (1–4 min after application of pilocarpine), the late preictal state (last 3 min before seizure initiation), and the seizure phase. **p < 0.01 compared with control values.
Interneuronal synchronization markedly changed during the preictal state between pilocarpine application and the initiation of seizures. To our surprise, during the early phase of the preictal state, correlated spike firing between neuronal pairs markedly decreased, and the pairwise cross-correlation function flattened. This is shown for both a single experiment (Fig. 4A–C) and for the average of 25 experiments (Fig. 5A,B). In the early preictal phase (1–4 min after pilocarpine injection), only 10 ± 3% of neuronal pairs showed significant correlated firing, and the average probability for correlated action potential firing between neuronal pairs (time lag 0 ± 5 ms) decreased to 17 ± 12% above chance correlation (p < 0.0001 compared with control conditions; 892 pairs of neurons from 176 neurons in 25 rats).
During the late phase of the preictal state, selective synchronization re-emerged in the network, and the pairwise cross-correlograms again showed a clear positive peak around time lag 0 (Figs. 4A–C, 5A,B). In the late preictal phase (last 3 min before seizure initiation), 67 ± 8% of neuronal pairs showed significant correlated firing, and the average probability for correlated firing between neuronal pairs (time lag 0 ± 5 ms) rose to 96 ± 47% above chance correlation (p < 0.001 compared with both control conditions and early preictal phase).
Once epileptic seizures initiated, as determined by the local intrahippocampal EEG, network synchronization further increased abruptly. During seizures, 99 ± 1% of neuronal pairs showed significant correlated firing, and the average probability for correlated spike firing between neuronal pairs was 330 ± 49% greater than chance correlation (Figs. 4A–C, 5A,B). The duration of correlated firing decreased during seizures compared with control conditions. The average half-width of correlated firing (positive peak in the cross-correlation function) during seizures was 126 ± 38 ms compared with 190 ± 32 ms under control conditions (p < 0.001) (Fig. 5C).
The firing rates of individual neurons and degree of synchronization, i.e., the tendency of neurons to selectively fire correlated spikes, are two parameters that independently influence the probability of neurons to fire simultaneously. During the second half of the preictal state, the probability of neurons to fire simultaneously markedly increased (Fig. 5D,E). The average probability for two neurons to fire simultaneously within a 10 ms time bin (time lag 0 ± 5 ms) increased from 0.016 ± 0.003% in the control period to 0.174 ± 0.032% during the last 3 min preceding seizure initiation (10.9-fold increase, p < 0.001). During seizures, this value further increased and reached an average value of 0.81 ± 0.1% (50.6-fold increase compared with control, p < 0.001 compared with both controls and late preictal phase). Interestingly, during the early preictal state the probability for simultaneous firing of neuronal pairs did not significantly change compared with control conditions (0.016 ± 0.003% in both control conditions and the early preictal period) (Fig. 5D,E).
To control for the possibility that the effect we observed was caused by the intraperitoneal injection, we performed control experiments with intraperitoneal injection of normal saline without pilocarpine. In these experiments, intraperitoneal injection of normal saline devoid of pilocarpine had no significant influence on the firing frequency, cross-correlograms, or probability of simultaneous firing of neuronal pairs (n = 3 rats).
Pilocarpine-induced epileptic seizures: awake rats and local intrahippocampal pilocarpine application
In all experiments described in the previous section, pilocarpine was applied systemically (intraperitoneally) and rats were anesthetized (urethane). To investigate whether anesthesia or the route of pilocarpine application influenced the results, we repeated the experiments in awake rats and in rats in which seizures were induced by local intrahippocampal application of pilocarpine.
In awake-rat experiments, we first anesthetized rats with the gas anesthetic halothane. After the rat was anesthetized, we implanted electrodes into the CA1 region and fixated them with dental cement. Later, we stopped the halothane and the rats woke up. Pilocarpine was applied ∼45 min after the rats were completely awake and normal behavior was restored.
In intrahippocampal pilocarpine application experiments, pilocarpine was injected into either the CA1 or CA3 region of the hippocampus by using a glass pipette and a syringe pump, and the recording electrodes were placed in close proximity to the site of injection (0.3–1 mm away). In this manner we were able to monitor network dynamics during the development of partial seizures at the epileptogenic zone (epileptic focus).
The results of these experiments showed similar network dynamics during the development of seizures in awake and anesthetized rats and in systemic and local application of pilocarpine (Fig. 6). In all cases, the firing rates of individual neurons gradually increased during the preictal state and further increased during seizures (Fig. 6A). In all cases, the preictal state was characterized by biphasic network dynamics with an early desynchronization phase and a late resynchronization phase (Fig. 6B). During the early preictal desynchronization phase, the pairwise cross-correlation function showed a reduction in correlated firing of neurons, as manifested by reduction in the fraction of neuronal pairs with significant correlated firing and reduction of the average cross-correlation function peak (Figs. 6A, 7A). During the late preictal resynchronization phase, there was re-emergence of correlated firing of neurons, which further intensified once seizures initiated (Fig. 6B and 7A). Last, in all cases, the probability for simultaneous firing in neuronal pairs markedly increased during the late preictal and ictal phases (Fig. 6C).
Figure 6.

Network dynamics during the development of pilocarpine-induced seizures in awake and anesthetized rats, following local application of pilocarpine and during the development of kainate-induced seizures. A–C, Average firing rates of individual neurons (A), average peak of the cross-correlation function corrected for chance correlations (B, top), average percentage of pairs with significant correlated firing (B, bottom), and average probabilities for instantaneous firing in neuronal pairs (C) are plotted for three conditions: seizures induced by systemic pilocarpine application in anesthetized rats (white bars, 176 neurons from 25 rats) and awake rats (bars with diagonal lines, 41 neurons from 6 rats), seizures induced by local intrahippocampal application of pilocarpine into the CA1 region (gray bars, 36 neurons from 7 rats), and seizures induced by local kainate application into the CA3 subfield of the hippocampus (dotted bars, 57 neurons from 11 rats). *p < 0.05, **p < 0.01 compared with control values. IP, Intraperitoneal.
Figure 7.
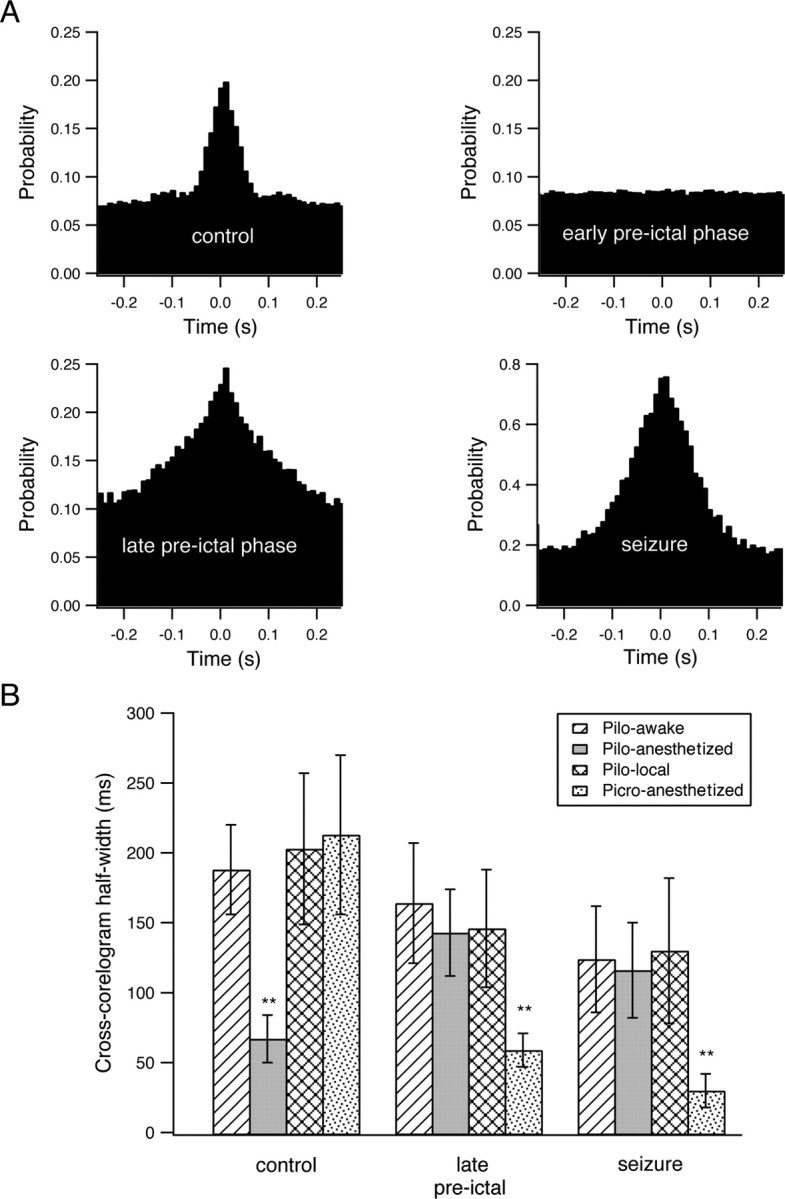
Interneuronal synchronization during the development of picrotoxin-induced seizures and the half-width of the cross-correlation function during the development of seizures. A, Cross-correlation function during the development of picrotoxin-induced seizures in a single neuronal pair. The pairwise cross-correlation function (10 ms time bin) was obtained from a single pair of neurons during the last 3 min of the control period, the early preictal phase (1–4 min after application of picrotoxin), the late preictal phase (last 3 min before seizure initiation), and seizures. The x axis designates the time lag of firing between the two neurons in milliseconds, and the y axis designates the probability that the second neuron will fire if the first cell fired at time 0. B, Average half-width of the cross-correlation function during the development of seizures are plotted for four different conditions: seizures induced by systemic pilocarpine (Pilo) in awake rats (bars with diagonal lines, 41 neurons from 6 rats), seizures induced by systemic pilocarpine in anesthetized rats (gray bars, 176 neurons from 25 rats), seizures induced by local intrahippocampal application of pilocarpine (checkered bars, 29 neurons from 5 rats), and picrotoxin (Picro)-induced seizures (dotted bars, 51 neurons from 7 rats). **p < 0.01 compared with control conditions.
For local pilocarpine injections, Figure 6 presents data for the CA1 injection site. Similar results were also obtained for local pilocarpine injection into the CA3 region (n = 2 rats).
It is interesting to note that despite the fact that awake and anesthetized rats showed similar network dynamics during the development of seizures, anesthesia did affect network synchronization under control conditions. Anesthesia significantly increased the tendency for correlated firing of action potentials between neurons under control conditions. Under anesthesia, the pairwise cross-correlation function had an average peak of 225 ± 35% above chance correlation and a half-width of 190 ± 32 ms (176 neurons in 25 rats) compared with an average peak of 100 ± 13% above chance correlation and a half-width of 69 ± 17 ms in awake rats (41 neurons in 6 rats; p < 0.0001 for comparison of both peak amplitudes and half-widths) (Figs. 6B, 7B). In contrast to control conditions during the late preictal and ictal phases, the half-width of the pairwise cross-correlation function was not significantly affected by anesthesia (126 ± 38 ms in anesthetized rats compared with 118 ± 34 ms in awake rats) (Fig. 7B). The differential effect of anesthesia on the half-width of the cross-correlograms during control conditions and the late preictal and ictal phases suggested that different mechanisms underlie synchronization in control conditions and during developing and ongoing seizures.
Picrotoxin- and kainate-induced epileptic seizures
To further study network dynamics during the development of epileptic seizures, we performed additional experiments with picrotoxin-induced seizures. We chose to study picrotoxin-induced seizures as the pharmacological mechanisms underlying seizure initiation markedly differ between pilocarpine and picrotoxin. While pilocarpine acts as a muscarinic agonist, picrotoxin inhibits GABAA receptors (De Deyn et al., 2007). As for pilocarpine, intraperitoneal application of picrotoxin induced epileptic seizures after a latent period of 14.4 ± 5.4 min (seven rats). These seizures were characterized by recurrent violent generalized clonic jerks. The ECoG during picrotoxin seizures was more intense and consisted of high-amplitude polyspikes with intermittent slow waves.
Despite the different pharmacological mechanisms of the two convulsants, we found similar network dynamics during the development of picrotoxin- and pilocarpine-induced seizures. During the preictal state between picrotoxin injection and seizure initiation, the firing frequency of individual neurons gradually increased (Fig. 8A). On average the firing rate of individual neurons increased by 14.9 ± 11% and 226.8 ± 37% in the early (1–4 min after application of picrotoxin) and late (last 3 min preceding seizure initiation) preictal phases. During seizures, the firing frequency further increased to 636.8 ± 47% of the control value (Fig. 8A) (161 pairs from 51 neurons in seven rats).
Figure 8.

Firing rates of individual neurons and probability for instantaneous firing of neuronal pairs during the development of picrotoxin-induced seizures. A, The average (mean ± SEM) firing rates of individual neurons are plotted as a function of time during the development of picrotoxin-induced epileptic seizures in a single experiment (left, 8 neurons) and for a pool of seven experiments (right, 51 neurons). In the pooled results from seven experiments, the average firing rates are presented as percentages of the average control firing rates, which were obtained by averaging the firing rates during the 10 min period preceding pilocarpine application. B, The probabilities for instantaneous firing of neuronal pairs during a 10 ms time bin in percentage values are plotted as a function of time during the development of pilocarpine-induced seizures. The data are shown for a single experiment (left, 8 neurons) and a pool of seven experiments (right, 51 neurons). In both A and B, the single-experiment data are presented every minute, while the pooled experiment data are presented for the last 3 min of the control period, the early preictal phase (1–4 min after application of pilocarpine), the late preictal phase (last 3 min before seizure initiation), and the seizure phase. *p < 0.05 compared with control values, **p < 0.01 compared with control values.
When we examined network synchronization during the development of picrotoxin-induced seizures, we again found a biphasic network dynamics. The early preictal phase was characterized by network desynchronization, with a reduction in both the average peak of the cross-correlograms and the percentage of neuronal pairs with significant correlated firing (Fig. 9). During the late preictal phase, the network underwent resynchronization, which manifested as an increase in the average peak of the cross-correlation functions and in the percentage of neuronal pairs with significant correlated firing. Network synchronization further intensified during the ictal phase of seizures (Fig. 9).
Figure 9.
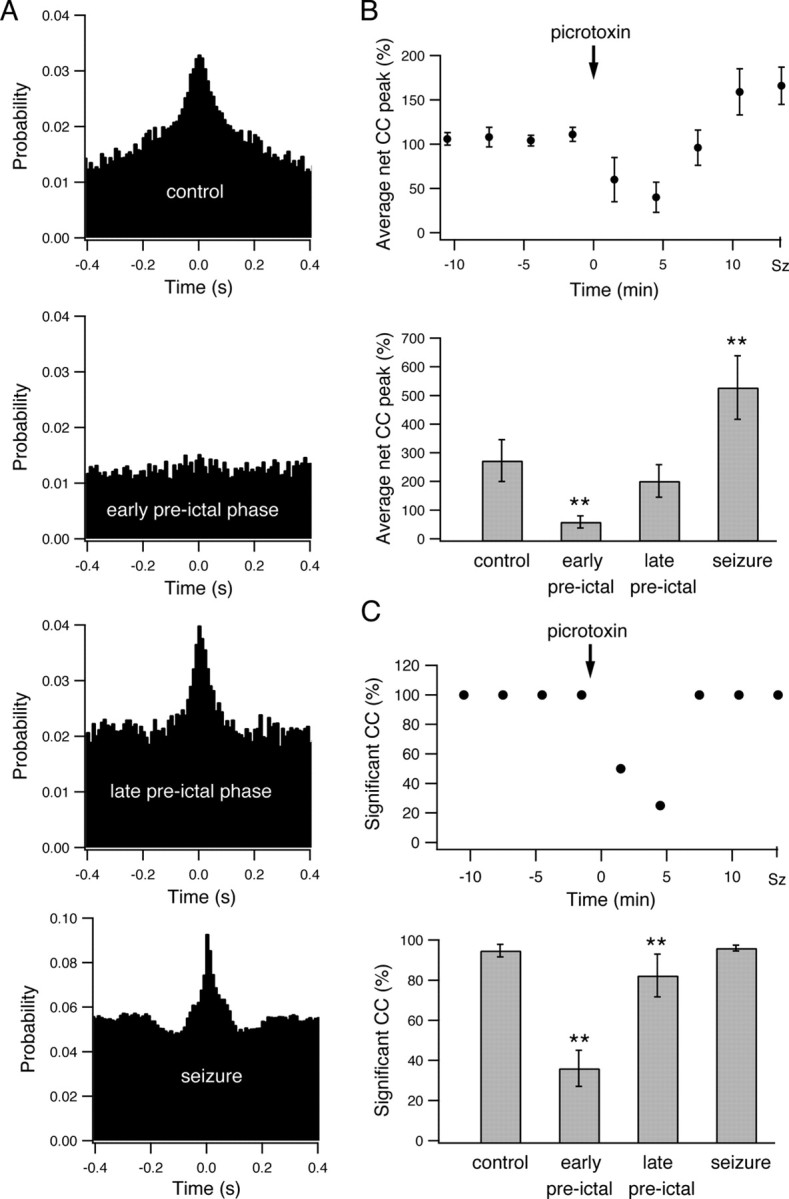
Interneuronal synchronization during the development of picrotoxin-induced seizures. A, Pairwise cross-correlation function (10 ms time bin) obtained from a single pair of neurons during the last 3 min of the control period, the early preictal state (1–4 min after application of picrotoxin), the late preictal state (last 3 min before seizure initiation), and the seizure phase. The x axis designates the time lag of firing between the two neurons in milliseconds, and the y axis designates the probability that the second neuron will fire if the first cell fired at time 0. B, Average peak of the cross-correlation function is plotted as a function of time during the development of picrotoxin-induced seizures. The average peak values (mean ± SEM) of the cross-correlogram above-chance correlations are presented in percentage values for all neuronal pairs in a single experiment (top, 8 neurons) and for a pool of seven experiments (bottom, 51 neurons). For the single-experiment data, the cross-correlograms were obtained every 3 min. For the pooled experiment data, the results are presented for the last 3 min of the control period, the early preictal state (1–4 min after application of picrotoxin), the late preictal state (last 3 min before seizure initiation), and the seizure phase. For averaging the peaks of individual cross-correlograms, the cross-correlation functions were first normalized to the chance correlation values expected from the average firing rates of the two neurons, and the peak values were measured as the percentage difference above the chance correlation value. C, Average percentage of neuronal pairs with significant correlated firing is presented as a function of time during the development of picrotoxin-induced seizures in a single experiment (top, 8 neurons) and in a pool of seven experiments (bottom, 51 neurons). Significantly correlated firing in neuronal pairs was determined by the existence of a significant positive peak in the cross-correlation function, which in turn was defined as at least three consecutive 10 ms bins at time lags of 0 ± 50 ms with cross-correlation value exceeding the p < 0.01 values. **p < 0.01.
The probability of neurons to fire simultaneously also increased during the late preictal and ictal phases (Fig. 8B). The average probability of neuronal pairs to fire simultaneously within a 10 ms time-window increased from 0.015 ± 0.004% under control conditions to 0.149 ± 0.04% in the late preictal phase (9.9-fold increase compared with control, p < 0.0001) and 1.16 ± 0.16% during seizures (77.3-fold increase compared with control, p < 0.0001).
We next examined development of seizures induced by a third convulsant, kainate (De Deyn et al., 2007). As for pilocarpine- and picrotoxin-induced seizures following local intrahippocampal application of kainate (0.2 μl of 2 mg/ml kainate), we observed a gradual increase in the firing frequency of neurons (57 neurons from 11 rats). On average, the firing rate of individual neurons increased by 17.3 ± 14% (p < 0.05) and 302 ± 37% (p < 0.01) in the early (1–4 min after application of picrotoxin) and late (last 3 min preceding seizure initiation) preictal phases (Fig. 6A). In addition, as was the case for pilocarpine- and picrotoxin-induced seizures, the cross-correlograms obtained during the development of kainate-induced seizures revealed early desynchronization followed by a later resynchronization phase (Fig. 6B–D). The average peak of the cross-correlograms was 228 ± 45% under control conditions, 19 ± 15% (p < 0.01) 1–4 min after kainate application and 104 ± 31% (p < 0.01) in the last 3 min preceding seizure initiation (57 neurons from 11 rats).
Together, the similarities of network dynamics during the development of pilocarpine-, kainate-, and picrotoxin-induced seizures suggested our findings reflected a general phenomenon characterizing the preictal state rather than specific effects of the convulsants used to induce seizures.
Network dynamics during development of recurrent spontaneous seizures
Application of pilocarpine (as well as the other convulsants) induced recurrent spontaneous seizures (Fig. 2). Up to this point we described the dynamics during the development of the initial seizure. We next investigated the network dynamics during the development of recurrent spontaneous seizures, in which the hippocampal network spontaneously fluctuated between the interictal and ictal states (Fig. 10A).
Figure 10.

Network dynamics during the development of recurrent spontaneous seizures. A, Top, Local ECoG trace from the CA1 region of the hippocampus after intraperitoneal application of pilocarpine. This trace shows two spontaneous seizures separated by an interictal period. The four lower traces show the cross-correlation functions obtained at different times of the interictal period separating the two seizures, first 20 s after the first seizure terminated (far left) and 170–190 s, 50–70 s, and the last 10 s before initiation of the second seizure. The firing rates of a single neuron (B) and the average firing rates of all neurons in all experiments (84 neurons in 12 rats) are presented for different times of the interictal period separating the two spontaneous seizures shown in the top of A. The averaged net cross-correlation peaks of all pairs in a single experiment (D) and of all experiments (E, 12 rats) are presented for different times of the interictal period separating the two spontaneous seizures shown at the top of A. B, Firing frequency was measured every second. C–E, Each point represents the average of 20 consecutive seconds, aside from the last point, which represents an average of the last 10 s preceding seizure initiation. The dashed lines in B–E represent the termination of the first seizure and the initiation of the second seizure, respectively. Note the desynchronization that was observed during the most of the interictal period preceding the initiation of the second seizure. CC, Cross-correlation; Sz, seizure.
Typically, the duration of the interictal phase preceding recurrent spontaneous seizures was relatively short (25 s-12 min, average of 4.2 ± 3.1 min). Reliable cross-correlograms required numerous events, and hence averaging over longer time periods. To overcome this problem we only analyzed interictal periods that lasted at least 3 min. In addition, we merged the spike trains of all neurons recorded with the same electrode and calculated the cross-correlograms between the spikes recorded in different electrodes. This typically allowed us to generate reliable cross-correlograms for 10–20 s time windows.
We first examined the firing frequency during the interictal periods separating recurrent spontaneous seizures. We found that the firing frequency was markedly depressed during the first few seconds after seizures terminated. It rapidly increased during the first 20–30 s after seizure termination. Typically, after the initial 20–30 s the firing frequency reached steady-state values that remained more or less stable during the remaining interictal period (Fig. 10B,C). On average, 0–20 s after seizures terminated the firing frequency reaches 3.5 ± 2.7 Hz (84 neurons from 12 rats). It increased to 19.7 ± 4.1 Hz 170–190 s before initiation of the next seizure (p < 0.01), and later increased to 26.7 ± 5.3 Hz 110–130 s before initiation of the next seizure (p < 0.01). Beyond that time the firing rates did not further increased significantly up to seizure initiation (Fig. 10B,C). It is interesting to note that this behavior somewhat differs from that of the preictal period preceding the initial seizure. While before the initial seizure the firing frequencies gradually increased throughout the preictal phase (Figs. 3, 6A), in the interictal periods preceding recurrent spontaneous seizures the firing frequencies first increased, but rapidly reached steady-state values and did not further increase up to seizure initiation (Fig. 10B,C).
We next examined the cross-correlation function during the interictal period preceding initiation of recurrent spontaneous seizures (Fig. 10A,D,E). We found that similar to the preictal phase preceding the initial seizure, the network dynamics during the development of recurrent spontaneous seizures also followed biphasic dynamics, with an early desynchronization phase followed by a short late resynchronization phase. Figure 10 presents these data for both a single pair of neurons and for the average of all recorded neurons. During the initial 20 s after seizure termination, the average probability for correlated firing (time lag 0 ± 5 ms) was 155 ± 38% above chance correlation (recordings from 39 electrodes in 12 rats). As time progressed, the network underwent desynchronization with a rapid reduction in the peak of the cross-correlograms. The average probability for correlated firing (time lag 0 ± 5 ms) decreased to only 37 ± 17% above chance correlation (p < 0.01) 2 min before seizure initiation. Later, shortly before seizure initiation, the network underwent resynchronization and the average probability for correlated firing (time lag 0 ± 5 ms) increased to 135 ± 45% in the last 10 s before seizure initiation (Fig. 10A,D,E). Interestingly, compared with the preictal state preceding the initial seizures, the majority of the time the network spent in the desynchronized state, while the late resynchronization phase was short lived and usually occurred shortly before seizures initiated (Fig. 10D,E).
Discussion
In this study, we used multielectrode single-unit recordings to investigate network dynamics during the development of pilocarpine-, picrotoxin-, and kainate-induced epileptic seizures in vivo. The main finding of this study is that the period preceding seizure initiation is characterized by a biphasic network dynamics. Initially, the network undergoes transient desynchronization, which is followed by increased firing rates of individual neurons, resynchronization of the network activity, and increased probability of neurons to fire simultaneously. Once seizures initiated, these three parameters further increased abruptly. All our recordings were performed from the pyramidal cell layer of the CA1 subfield of the hippocampus. Further studies are required to examine whether similar dynamics also occurs in other hippocampal subfields and the neocortex.
The main potential limitation of this study lies in the fact that seizures in our experiments were evoked by chemoconvulsants, in contrast to spontaneously occurring seizures in chronic human epilepsy. Despite this difference, we hypothesize that our findings represent a general phenomenon relevant to seizures in epilepsy patients. This hypothesis is based on four main reasons. First, despite the fact there are numerous different etiologies that cause epilepsy seizures have many common clinical and electrophysiological features. Hence, it is likely that initiation, maintenance and propagation of seizures use common mechanisms that are independent of the specific underlying etiology of epilepsy. Second, in this study seizures were evoked by three convulsants with completely different pharmacological mechanisms, the muscarinic agonist pilocarpine, the GABAA antagonist picrotoxin and the kainate receptor agonist kainate (De Deyn et al., 2007). Despite the different underlying pharmacological mechanisms, the network dynamics were similar during the development of seizures in all three cases. Third, we found similar network dynamics during the development of the initial seizures and the later spontaneous recurrent seizures in which spontaneous transition occurs between the interictal and ictal states. Forth, there are human correlates of pharmacologically induced acute symptomatic seizures, including the case of seizures induced by muscarinic agonists and GABAA antagonists. In future, additional experiments are needed to corroborate our findings in chronic spontaneous seizures in rats and in human patients.
Surface and intracranial EEG recordings obtained from epileptic patients during the period preceding seizure initiation revealed that during the transition between the interictal and ictal states in partial seizures the network enters a third preictal transitional activity state that bridges between the interictal and ictal states (Martinerie et al., 1998; Le Van Quyen et al., 2001; Litt et al., 2001; Navarro et al., 2002).
Presently the data in the literature regarding the preictal state originate almost exclusively from surface and intracranial EEG recordings (Martinerie et al., 1998; Le Van Quyen et al., 2001; Litt et al., 2001; Litt and Echauz, 2002; Navarro et al., 2002; Chaovalitwongse et al., 2005; Mormann et al., 2006, 2007; Haas et al., 2007; Lehnertz et al., 2007; Derchansky et al., 2008). EEG recordings sum the electrical activity from many thousands of neurons and millions of synapses. Hence, our ability to study the finer details of network dynamics with EEG signals is limited. Here we studied the network dynamics leading to seizure initiation at the single-neuron and multineuron level using multielectrode single-unit recordings. These recordings allowed us on the one hand to characterize the firing patterns of individual neurons and on the other hand to monitor synchronization of firing in the cortical network at the single-cell level.
The existence of preictal desynchronization has been suggested previously by studies using EEG recordings, and by a theoretical modeling study. Previous studies have reported a reduction in phase synchronization of the intracranial EEG between different brain regions in the minutes to hours preceding seizures (Mormann et al., 2003). In kainate-treated mice, the coherence between the activities of the two hippocampi has been reported to decrease several seconds before seizures initiated (Meier et al., 2007). A theoretical modeling study even suggested that desynchronization may participate in seizure initiation (Nicolaescu and Mogul, 2004). However, it is important to stress that these EEG-based studies examined long-range synchronization between distant brain regions, and did not assess synchronization within the local network. A prior study that recorded single units from the dentate gyrus of the chronic pilocarpine model reported variable firing rate responses during the preictal phase preceding seizures. Some neurons increased their firing rates while others showed a reduction or no change in the firing rates during the preictal phase (Bower and Buckmaster, 2008). Interestingly, the average response was similar to that reported here in CA1 neurons, increased firing during the preictal phase followed by a further increase during seizures.
Our findings regarding increased firing frequencies and enhanced interneuronal synchronization in the late preictal phase are consistent with the findings of a previous study that examined development of seizure-like events in hippocampal brain slices in vitro (Cohen et al., 2006). In addition, our findings are also consistent with those of a previous study that reported increased synchronization between excitatory neurons in the CA1 region during seizure-like events in vitro (Ziburkus et al., 2006).
In this study, we did not directly address what is the role of the early desynchronized preictal phase to development of seizures. However, we hypothesize that development of seizures requires functional dissociation of the epileptogenic zone from the normal network activity. According to this hypothesis during the interictal phase the rhythm of the normal network suppresses the initiation of seizures in the epileptogenic zone. During the early preictal phase, the epileptogenic zone is functionally dissociated from the normal brain regions. This in turn allows the “epileptogenic network” to generate its pathological activity, which gradually builds up until a seizure initiates.
In our study, we did not directly address the cellular mechanisms underlying the network dynamic leading to seizure initiation. Possible mechanism for the early desynchronization and functional dissociation of the epileptogenic zone from neighboring and distant healthy brain regions include first, suppression of the inhibitory drive, which in turn can disrupt long-range synchronization in the network mediated by the interconnected interneuronal network. Disruption of the inhibitory drive may result from a reduction of the chloride driving force secondary to the increased firing frequency of neurons (Perreault and Avoli, 1988; Kaila et al., 1997; Taira et al., 1997), or alternatively directly by picrotoxin.
A second possible mechanism for early desynchronization and functional dissociation of the epileptogenic zone involves tonic depolarization of the involved neurons by either pilocarpine or kainate. Tonic depolarization of neurons will result in a reduction of the efficacy of phasic excitatory synaptic activation. Under these conditions, long- and short-range excitatory inputs will be less effective in driving the epileptogenic zone, and as a result both network synchrony and the influence of distant healthy brain regions on the epileptogenic zone will decrease.
The late resynchronization phase developing occurring shortly before seizure initiation may result from recruitment of nonlinear active dendritic mechanisms including dendritic NMDA and calcium spikes, which in turn can markedly increase the activity and synchrony of the network (Schiller et al., 1997, 2000; Schiller, 2002; Gordon et al., 2006).
The majority of epilepsy patients are fully controlled with antiepileptic drugs. However, ∼30% of patients suffer from drug-resistant epilepsy, and continue to experience seizures despite appropriate drug therapy. A small minority of these patients can be rendered seizure free by epilepsy surgery, ketogenic diet, or vagus nerve stimulation. However, modern medicine has no good solution to offer the majority of patients suffering from drug-resistant epilepsy, and new treatment modalities are needed to treat this (Brodie and French, 2000; Browne and Holmes, 2001; Deckers et al., 2003; Schmidt and Löscher, 2005; Duncan et al., 2006; French, 2007; Schiller and Najjar, 2008). One of the most promising potential new treatments for drug-resistant epilepsy involves the use of closed-loop neurostimulators. These neurostimulators are planned to detect the preictal state preceding clinical seizures, and in turn automatically generate the appropriate stimulation paradigm to abort impending seizures and prevent initiation of full-blown clinical seizures. One of the significant obstacles for constructing effective closed-loop neurostimulators is the development of reliable seizure prediction algorithms (Kossoff et al., 2004; Theodore and Fisher, 2004; Chaovalitwongse et al., 2005; Morrell, 2006; Mormann et al., 2006, 2007; Fountas and Smith, 2007; Haas et al., 2007; Lehnertz et al., 2007; Salanova and Worth, 2007; Sackellares, 2008; Sun et al., 2008). In this study, we report a novel “network dynamics signature” that characterized the preictal state preceding acute chemoconvulsant-induced seizures. We hypothesize that a similar network dynamics also precedes spontaneous seizures in human patients and hence propose that this biphasic network dynamics signature can be used to construct novel seizure prediction algorithms. To investigate this possibility, further studies are required on spontaneous seizures in chronic animal models of epilepsy and ultimately in human patients.
Footnotes
This study was supported by the Israeli Science Foundation and the Rappaport Foundation.
References
- Bower MR, Buckmaster PS. Changes in granule cell firing rates precede locally recorded spontaneous seizures by minutes in an animal model of temporal lobe epilepsy. J Neurophysiol. 2008;99:2431–2442. doi: 10.1152/jn.01369.2007. [DOI] [PubMed] [Google Scholar]
- Brodie MJ, French JA. Management of epilepsy in adolescents and adults. Lancet. 2000;356:323–329. doi: 10.1016/S0140-6736(00)02515-0. [DOI] [PubMed] [Google Scholar]
- Browne TR, Holmes GL. Epilepsy. N Eng J Med. 2001;344:1145–1151. doi: 10.1056/NEJM200104123441507. [DOI] [PubMed] [Google Scholar]
- Chaovalitwongse W, Iasemidis LD, Pardalos PM, Carney PR, Shiau DS, Sackellares JC. Performance of a seizure warning algorithm based on the dynamics of intracranial EEG. Epilepsy Res. 2005;64:93–113. doi: 10.1016/j.eplepsyres.2005.03.009. [DOI] [PubMed] [Google Scholar]
- Cohen I, Huberfeld G, Miles R. Emergence of disinhibition-induced synchrony in the CA3 region of the guinea pig hippocampus in vitro. J Physiol. 2006;570:583–594. doi: 10.1113/jphysiol.2005.097899. [DOI] [PMC free article] [PubMed] [Google Scholar]
- Deckers CL, Genton P, Sills GJ, Schmidt D. Current limitations of antiepileptic drug therapy: a conference review. Epilepsy Res. 2003;53:1–17. doi: 10.1016/s0920-1211(02)00257-7. [DOI] [PubMed] [Google Scholar]
- De Deyn PP, D'Hooge R, Marescau B, Pei YQ. Chemical models of epilepsy with some reference to their applicability in the development of anticonvulsants. Epilepsy Res. 1992;12:87–110. doi: 10.1016/0920-1211(92)90030-w. [DOI] [PubMed] [Google Scholar]
- Derchansky M, Jahromi SS, Mamani M, Shin DS, Sik A, Carlen PL. Transition to seizures in the isolated immature mouse hippocampus: a switch from dominant phasic inhibition to dominant phasic excitation. J Physiol. 2008;586:477–494. doi: 10.1113/jphysiol.2007.143065. [DOI] [PMC free article] [PubMed] [Google Scholar]
- Duncan JS, Sander JW, Sisodiya SM, Walker MC. Adult epilepsy. Lancet. 2006;367:1087–1100. doi: 10.1016/S0140-6736(06)68477-8. [DOI] [PubMed] [Google Scholar]
- Fountas KN, Smith JR. A novel closed-loop stimulation system in the control of focal, medically refractory epilepsy. Acta Neurochir Suppl. 2007;97:357–362. doi: 10.1007/978-3-211-33081-4_41. [DOI] [PubMed] [Google Scholar]
- French JA. Refractory epilepsy: clinical overview. Epilepsia. 2007;48(Suppl 1):3–7. doi: 10.1111/j.1528-1167.2007.00992.x. [DOI] [PubMed] [Google Scholar]
- Gordon U, Polsky A, Schiller J. Plasticity compartments in basal dendrites of neocortical pyramidal neurons. J Neurosci. 2006;26:12717–12726. doi: 10.1523/JNEUROSCI.3502-06.2006. [DOI] [PMC free article] [PubMed] [Google Scholar]
- Haas SM, Frei MG, Osorio I. Strategies for adapting automated seizure detection algorithms. Med Eng Phys. 2007;29:895–909. doi: 10.1016/j.medengphy.2006.10.003. [DOI] [PMC free article] [PubMed] [Google Scholar]
- Kaila K, Lamsa K, Smirnov S, Taira T, Voipio J. Long-lasting GABA-mediated depolarization evoked by high-frequency stimulation in pyramidal neurons of rat hippocampal slice is attributable to a network-driven, bicarbonate-dependent K+ transient. J Neurosci. 1997;17:7662–7672. doi: 10.1523/JNEUROSCI.17-20-07662.1997. [DOI] [PMC free article] [PubMed] [Google Scholar]
- Kossoff EH, Ritzl EK, Politsky JM, Murro AM, Smith JR, Duckrow RB, Spencer DD, Bergey GK. Effect of an external responsive neurostimulator on seizures and electrographic discharges during subdural electrode monitoring. Epilepsia. 2004;48:1560–1567. doi: 10.1111/j.0013-9580.2004.26104.x. [DOI] [PubMed] [Google Scholar]
- Lehnertz K, Mormann F, Osterhage H, Müller A, Prusseit J, Chernihovskyi A, Staniek M, Krug D, Bialonski S, Elger CE. State-of-the-art of seizure prediction. J Clin Neurophysiol. 2007;24:147–153. doi: 10.1097/WNP.0b013e3180336f16. [DOI] [PubMed] [Google Scholar]
- Le Van Quyen M, Martinerie J, Navarro V, Boon P, D'Havé M, Adam C, Renault B, Varela F, Baulac M. Anticipation of epileptic seizures from standard EEG recordings. Lancet. 2001;357:183–188. doi: 10.1016/S0140-6736(00)03591-1. [DOI] [PubMed] [Google Scholar]
- Litt B, Echauz J. Prediction of epileptic seizures. Lancet Neurol. 2002;1:22–30. doi: 10.1016/s1474-4422(02)00003-0. [DOI] [PubMed] [Google Scholar]
- Litt B, Esteller R, Echauz J, D'Alessandro M, Shor R, Henry T, Pennell P, Epstein C, Bakay R, Dichter M, Vachtsevanos G. Epileptic seizures may begin hours in advance of clinical onset: a report of five patients. Neuron. 2001;30:51–64. doi: 10.1016/s0896-6273(01)00262-8. [DOI] [PubMed] [Google Scholar]
- Martinerie J, Adam C, Le Van Quyen M, Baulac M, Clemenceau S, Renault B, Varela FJ. Epileptic seizures can be anticipated by non-linear analysis. Nat Med. 1998;4:1173–1176. doi: 10.1038/2667. [DOI] [PubMed] [Google Scholar]
- Meier R, Häussler U, Aertsen A, Deransart C, Depaulis A, Egert U. Short-term changes in bilateral hippocampal coherence precede epileptiform events. Neuroimage. 2007;38:138–149. doi: 10.1016/j.neuroimage.2007.07.016. [DOI] [PubMed] [Google Scholar]
- Mormann F, Kreuz T, Andrzejak RG, David P, Lehnertz K, Elger CE. Epileptic seizures are preceded by a decrease in synchronization. Epilepsy Res. 2003;53:173–185. doi: 10.1016/s0920-1211(03)00002-0. [DOI] [PubMed] [Google Scholar]
- Mormann F, Elger CE, Lehnertz K. Seizure anticipation: from algorithms to clinical practice. Curr Opin Neurol. 2006;19:187–193. doi: 10.1097/01.wco.0000218237.52593.bc. [DOI] [PubMed] [Google Scholar]
- Mormann F, Andrzejak RG, Elger CE, Lehnertz K. Seizure prediction: the long and winding road. Brain. 2007;130:314–333. doi: 10.1093/brain/awl241. [DOI] [PubMed] [Google Scholar]
- Morrell M. Brain stimulation for epilepsy: can scheduled or responsive neurostimulation stop seizures? Curr Opin Neurol. 2006;19:164–168. doi: 10.1097/01.wco.0000218233.60217.84. [DOI] [PubMed] [Google Scholar]
- Navarro V, Martinerie J, Le Van Quyen M, Clemenceau S, Adam C, Baulac M, Varela F. Seizure anticipation in human neocortical partial epilepsy. Brain. 2002;125:640–655. doi: 10.1093/brain/awf048. [DOI] [PubMed] [Google Scholar]
- Nicolaescu I, Mogul DJ. A role for desynchronization of neuronal activity in triggering epileptic seizures in the brain. Conf Proc IEEE Eng Med Biol Soc. 2004;6:4006–4008. doi: 10.1109/IEMBS.2004.1404119. [DOI] [PubMed] [Google Scholar]
- Perreault P, Avoli M. A depolarizing inhibitory postsynaptic potential activated by synaptically released γ-aminobutyric acid under physiological conditions in rat hippocampal pyramidal cells. Can J Physiol Pharmacol. 1988;66:1100–1102. doi: 10.1139/y88-180. [DOI] [PubMed] [Google Scholar]
- Sackellares JC. Seizure prediction. Epilepsy Curr. 2008;8:55–59. doi: 10.1111/j.1535-7511.2008.00236.x. [DOI] [PMC free article] [PubMed] [Google Scholar]
- Salanova V, Worth R. Neurostimulators in epilepsy. Curr Neurol Neurosci. 2007;7:315–319. doi: 10.1007/s11910-007-0048-9. [DOI] [PubMed] [Google Scholar]
- Schiller J, Schiller Y, Stuart G, Sakmann B. Calcium action potentials restricted to distal apical dendrites of rat neocortical pyramidal neurons. J Physiol. 1997;505:605–616. doi: 10.1111/j.1469-7793.1997.605ba.x. [DOI] [PMC free article] [PubMed] [Google Scholar]
- Schiller J, Major G, Koester HJ, Schiller Y. NMDA spikes in basal dendrites of cortical pyramidal neurons. Nature. 2000;404:285–289. doi: 10.1038/35005094. [DOI] [PubMed] [Google Scholar]
- Schiller Y. Inter-ictal- and ictal-like epileptic discharges in the dendritic tree of neocortical pyramidal neurons. J Neurophysiol. 2002;88:2954–2962. doi: 10.1152/jn.00525.2001. [DOI] [PubMed] [Google Scholar]
- Schiller Y, Najjar Y. Quantifying the response to antiepileptic drugs: effect of past treatment history. Neurology. 2008;70:54–65. doi: 10.1212/01.wnl.0000286959.22040.6e. [DOI] [PubMed] [Google Scholar]
- Schmidt D, Löscher W. Drug resistance in epilepsy: putative neurobiologic and clinical mechanisms. Epilepsia. 2005;46:858–877. doi: 10.1111/j.1528-1167.2005.54904.x. [DOI] [PubMed] [Google Scholar]
- Sun FT, Morrell MJ, Wharen RE., Jr Responsive cortical stimulation for the treatment of epilepsy. Neurotherapeutics. 2008;5:68–74. doi: 10.1016/j.nurt.2007.10.069. [DOI] [PMC free article] [PubMed] [Google Scholar]
- Taira T, Lamsa K, Kaila K. Posttetanic excitation mediated by GABAA receptors in rat CA1 pyramidal neurons. J Neurophysiol. 1997;77:2213–2218. doi: 10.1152/jn.1997.77.4.2213. [DOI] [PubMed] [Google Scholar]
- Theodore WH, Fisher RS. Brain stimulation for epilepsy. Lancet Neurol. 2004;3:111–118. doi: 10.1016/s1474-4422(03)00664-1. [DOI] [PubMed] [Google Scholar]
- Trevelyan AJ, Sussillo D, Yuste R. Feedforward inhibition contributes to the control of epileptiform propagation speed. J Neurosci. 2007;27:3383–3387. doi: 10.1523/JNEUROSCI.0145-07.2007. [DOI] [PMC free article] [PubMed] [Google Scholar]
- Wendling F, Bartolomei F, Bellanger JJ, Chauvel P. Epileptic fast activity can be explained by a model of impaired GABAergic dendritic inhibition. Eur J Neurosci. 2002;15:1499–1508. doi: 10.1046/j.1460-9568.2002.01985.x. [DOI] [PubMed] [Google Scholar]
- Ziburkus J, Cressman JR, Barreto E, Schiff SJ. Interneuron and pyramidal cell interplay during in vitro seizure-like events. J Neurophysiol. 2006;95:3948–3954. doi: 10.1152/jn.01378.2005. [DOI] [PMC free article] [PubMed] [Google Scholar]