

Abstract
Information integration across different sensory modalities contributes to object recognition, the generation of associations and long-term memory representations. Here, we used functional magnetic resonance imaging adaptation to investigate the presence of sensory integrative effects at cortical levels as early as nonprimary auditory and extrastriate visual cortices, which are implicated in intermediate stages of object processing. Stimulation consisted of an adapting audiovisual stimulus S1 and a subsequent stimulus S2 from the same basic-level category (e.g., cat). The stimuli were carefully balanced with respect to stimulus complexity and semantic congruency and presented in four experimental conditions: (1) the same image and vocalization for S1 and S2, (2) the same image and a different vocalization, (3) different images and the same vocalization, or (4) different images and vocalizations. This two-by-two factorial design allowed us to assess the contributions of auditory and visual stimulus repetitions and changes in a statistically orthogonal manner. Responses in visual regions of right fusiform gyrus and right lateral occipital cortex were reduced for repeated visual stimuli (repetition suppression). Surprisingly, left lateral occipital cortex showed stronger responses to repeated auditory stimuli (repetition enhancement). Similarly, auditory regions of interest of the right middle superior temporal gyrus and sulcus exhibited repetition suppression to auditory repetitions and repetition enhancement to visual repetitions. Our findings of crossmodal repetition-related effects in cortices of the respective other sensory modality add to the emerging view that in human subjects sensory integrative mechanisms operate on earlier cortical processing levels than previously assumed.
Introduction
The ability to process and integrate information from different sensory channels is highly relevant for cognition. Traditional views arguing for sensory integration to occur on levels of higher-order association cortices (Mesulam, 1998) have been increasingly called into question by findings of visual (van Atteveldt et al., 2004; Hein et al., 2007) and tactile (Kayser et al., 2005; Lakatos et al., 2007) modulation of activity in auditory cortices. Thus, a “multisensory interplay” (Driver and Noesselt, 2008) might be more common in various cortical, including early sensory, regions than previously thought (Ghazanfar and Schroeder, 2006).
In humans, tenets of such an early sensory integration are backed mainly by results from neuroimaging studies comparing responses to bimodal [e.g., audiovisual (AV)] versus unimodal (e.g., auditory and visual) stimulation (Giard and Peronnet, 1999; Noesselt et al., 2007). Although different analysis approaches for these comparisons have been discussed (Beauchamp, 2005; Laurienti et al., 2005), they have been criticized as contrasting responses to stimuli with different degrees of complexity (Taylor et al., 2006; Hocking and Price, 2008). In the present study, we examined the presence of early sensory integration effects in human subjects by using only AV stimuli and therefore one degree of complexity.
Importantly, we did so by using the advanced neuroimaging technique of functional magnetic resonance imaging adaptation (fMRIa) (Grill-Spector and Malach, 2001; Weigelt et al., 2008). Based on the observation that repeated stimuli induce decreased amplitudes of the blood oxygen level-dependent (BOLD) signal, fMRIa provides an index of the sensitivity of brain regions for a stimulus feature by comparing BOLD responses to trials containing repetitions or changes of this feature. Because these repetition-related indices of sensitivity can be found even when conventional subtraction-based fMRI studies show no differential activity, fMRIa paradigms have critically contributed to our understanding of object processing in the visual (Vuilleumier et al., 2002; Mahon et al., 2007) and auditory domains (Bergerbest et al., 2004; Doehrmann et al., 2008). Surprisingly, however, these potentially highly sensitive paradigms have not been applied to AV object processing (but for a visuo-haptic approach, see James et al., 2002).
We used a two-factorial fMRIa design to dissociate repetition-related effects in each sensory modality (see Fig. 1A). Stimuli contained either a repetition or change in the auditory, visual, or both stimulus components occurring on the level of different exemplars from the same basic-level category and thereby avoiding variations in semantic congruency. Our design taps into intermediate object processing (before the semantic level), which has been associated with lateral occipital (LO) regions in vision (Malach et al., 1995) and the superior temporal gyrus/sulcus (STG/STS) in audition (Lewis et al., 2005). Searching for crossmodal repetition effects, we therefore examined auditory repetition in LO and visual repetition in STG/STS. Such effects would not only indicate a capability for detection but for discrimination (at least along the dimension “same” vs “different”) of concurrent stimuli in the other sensory modality. We report exactly this type of crossmodal repetition effects and thereby novel neuroimaging evidence for early object-related sensory integration.
Figure 1.

Stimuli and experimental designs. A, fMRIa experiment. Schematic representations of the four different trial types used in the experiment are shown in the left. From the first to the second AV stimulus, the auditory, the visual, or both components changed or no change at all occurred. Note that all changes occurred within the same basic-level category, thereby minimizing the potential influence of semantic congruency. Together, this resulted in a two-factorial design with the factors “sensory modality” and “repetition” (middle). Each experimental trial (right) started in half of the cases with a jitter of 1 s, followed by the rapidly successive presentation of a pair of two AV stimuli. After 3 or 4 s, two volumes of functional data were collected. B, Localizer experiment. Examples of intact and scrambled visual (left) and auditory (right) stimuli are given. The latter are represented by amplitude waveforms and spectrograms. Note that the presentation time of auditory stimuli was 1 s instead of 500 ms as in the fMRIa experiment. Blocks of 10 either intact or scrambled stimuli were presented in the auditory, the visual, or both sensory modalities, thereby generating six different experimental conditions.
Materials and Methods
Subjects
Fifteen healthy volunteers with a mean age of 27.13 years (range of 18–39 years; seven males) participated in two experiments. Three subjects (two males) were left-handed as determined by self-report and an abbreviated form of the Edinburgh Handedness Inventory. Visual acuity for all subjects was normal or corrected to normal. According to self-report, hearing abilities were also in a normal range. Subjects gave their informed consent to participate in the study. The experiments were performed in accordance with the ethical standards laid down in the 1964 Declaration of Helsinki and were approved by the local Ethics Committee of the Frankfurt Medical School.
Adaptation experiment
Stimuli.
Two different color images and sounds of the following 14 animals were created: bird, cat, cow, dog, donkey, duck, elephant, frog, horse, lion, monkey, owl, rooster, and sheep (example stimuli can be found in Fig. 1A). Thus, two exemplars of the images and sounds from these different basic-level categories were selected. Great care was taken to select only those images and sounds that were quite common and easily recognizable even when presented separately. This was especially important because, during the experiments, images and sounds were presented in different combinations. All animal images were taken from a professional database (Hemera Technologies). The background of each image was removed and replaced with light gray (example stimuli can be found in Fig. 1). Furthermore, a white fixation cross was added. When presented on the screen in the scanner bore, all stimuli (including background) had a size of 10.3 × 10.3 cm (22.8 × 22.8° of visual angle). Visual stimuli were presented with a fixed duration of 500 ms.
Twenty-eight animal vocalizations (two for each of the animals mentioned previously) were taken from a collection of professionally recorded sounds (Sound Ideas) and from different Internet websites. The sound stimuli were digitized with a sampling rate of 22,050 Hz. The sounds were trimmed to an average ± SD of 487.5 ± 46 ms length (range of 342–556 ms). However, the average duration of the stimulus sets containing each of the two exemplars differed only by 23 ms (499 vs 476 ms). As in the case of the pictures, an important aspect was to preserve the recognizability of each sound. Accordingly, and likewise for the images, none of the subjects reported problems in recognizing any of the sound stimuli used during this experiment. All sounds were equalized with regard to their root mean square sound intensity.
Procedure.
Subjects were administered four runs of the event-related fMRIa experiment and one run of a high-resolution T1-weighted magnetization-prepared rapid gradient-echo (MP-RAGE) sequence as an anatomical reference.
In line with the general rationale of fMRIa paradigms, the experimental conditions were created solely by the variation of the second of the two successive AV stimuli (Fig. 1A). For an adapting stimulus S1 and a subsequent stimulus S2, this yielded the following four experimental conditions: (1) the same image and vocalizations for S1 and S2, (2) the same image and a different vocalization, (3) different images and the same vocalization, or (4) different images and vocalizations. These four experimental conditions instantiated a two-by-two factorial design with the factors “sensory modality” (levels “auditory” and “visual”) and “repetition” (levels “same” and “different”).
Each trial lasted for 10 s and started with a short nonstimulus delay of 500 ms and in half of the trials with an additional jitter of 1 s. The latter was applied to increase the sampling of different subsections of the BOLD signal and to ensure efficient parameter estimation of the hemodynamic response function (Dale, 1999). Next, the first AV stimulus was presented with an average duration of 487.5 ms. After a short interstimulus interval of 500 ms on average, this adapting stimulus S1 was followed by either exactly the same AV stimulus as an S2 (producing the “same” condition) or one of the three “different” conditions mentioned above. Because stimuli were taken from the same basic-level category such as “cat,” no semantic congruency or incongruency effects were induced either across (from S1 to S2) or within each AV stimulus. Furthermore, because of our randomization procedure, each AV stimulus was equally likely to be presented as S1 and S2.
Each experimental run of the event-related fMRI experiment lasted 12 min and 36 s. Within a single run, 12 trials per condition were presented, intermixed with 12 trials during which only the fixation cross was presented (baseline). Four experimental runs per subject were administered, resulting in 48 trials per experimental condition. Similar to previous studies (Altmann et al., 2004; Doehrmann et al., 2008), the order of presentation was counterbalanced so that trials from each condition were preceded (one trial back) equally often by trials from each of the other conditions.
Behavioral task.
In the adaptation experiment, subjects were instructed to detect a specific target AV stimulus (e.g., “the duck”), which was individually assigned to each participant before the first experimental run. We always assigned the respective basic-level category as the target, because subjects should react as early as possible after the presentation of the first AV stimulus. Because it was equally likely which exemplar of the category would be presented first, subjects were familiarized with all exemplars of the target (i.e., both images and both sounds). Importantly, to avoid contamination with task-related motor activity, the respective target trials were discarded from the fMRI analysis. Target stimuli were presented 12 times per experimental run, resulting in no substantial loss of experimental trials. This task provided efficient attentional control compared with passive perception of the stimuli and reduced the impact of task-related activation on the signal patterns measured during the experiment. Subjects' performance was at ceiling, suggesting that stimuli were indeed perceived attentively.
Localizer experiment
Stimuli.
For the localizer experiment, 18 different animal stimuli were selected from the same sources as for the adaptation experiment; thus, the stimulus set was partly overlapping. One visual and one auditory stimulus were taken from the same set of basic-level categories as reported previously. Additionally, images and sounds of a bear, a chicken, a pig, and a seal were included in this second set of stimuli.
The main purpose of the localizer experiment was to identify brain structures related to object processing. In accordance with other studies on visual object processing (Lerner et al., 2001), we intended to compare fMRI responses to intact images of animals on the one hand and scrambled images on the other hand. If no additional precautions are taken, scrambling of the color images used in the present experiments might result in a loss or at least in a change of the overall color composition. We used a method developed by Nicholaas Prins (University of Mississippi, Oxford, MS; personal communication) that accomplishes scrambling by adding a random phase structure to the existing three phase structures (red, green, and blue) of the original images. Because the relative phases of each layer remained unchanged during phase scrambling, the color composition of intact and scrambled images was essentially the same (for example stimuli, see Fig. 1B). Scrambling of the 18 intact animal vocalizations was performed as described in previous articles from our group (Altmann et al., 2007). Both intact and scrambled sounds had the same average ± SD of 1040 ± 142 ms duration (range of 734–1386 ms), similar to our previous study (Altmann et al., 2007). All sounds used in the localizer experiment were equalized with regard to their root mean square sound intensity in the same manner as for the adaptation experiment.
Procedure.
All subjects except one were scanned for three runs of the localizer and one run of high-resolution MP-RAGE anatomy in a separate session than the adaptation experiment (one subject was only scanned for two runs of the localizer experiment). This fixed procedure (adaptation first, localizer second) was chosen because a substantial portion of the stimuli were used in both sessions. Because it is more likely that subtle adaptation effects might be affected by previous contact with the stimuli in a block-design localizer experiment than the other way around, we decided against the counterbalancing of the experimental sequence.
Ten successive stimuli were presented in each block, followed by a fixation-only interval of equal length. Six different experimental conditions were created involving either intact or scrambled versions of auditory, visual, or combined AV stimuli. Each stimulus was presented for either 1 s (in the visual-only conditions) or the length of the respective sounds (in the auditory-only and the AV conditions; on average, 1040 ms). Stimuli were separated by an interstimulus interval of ∼500 ms, yielding an overall length of each stimulation block and each fixation period of 15 s. Each experimental condition was repeated two times. Together with an initial fixation, each run of the localizer experiment had a length of 9 min and 22 s.
Behavioral task.
In the localizer experiment, subjects performed a one-back task requiring a button-press whenever one stimulus was immediately repeated, which was the case in each block of experimental trials. Again, subjects performed at ceiling, supporting the view that attentional resources were deployed to stimulus processing. For both experiments, subjects were instructed to use only one hand for responding. The assignment of left or right hand was counterbalanced across subjects.
Stimulus presentation
Visual stimuli were projected by a liquid crystal display projector on a screen fixed to the head coil and viewed via a tilted mirror. Auditory stimuli were presented with MR-compatible head phones (Resonance Technology) using wave-guide tubes for sound transmission. The headphones of the MRI audio system contained fluid- and vinyl-sealed cushions to attenuate ambient noise up to 30 dB. For each subject, the applied output volume for the stimulus presentation was adjusted individually to a comfortable level in accordance with previous auditory studies from our laboratory (Altmann et al., 2007; Doehrmann et al., 2008). Stimulus presentation and recordings of behavioral responses were controlled by the software package Presentation (Neurobehavioral Systems) and triggered by the scanner to ensure synchronous stimulus delivery and fMRI measurements.
Imaging and data analysis
Imaging for both experiments was conducted using a 3 T ALLEGRA scanner (Siemens) at the Brain Imaging Center (Frankfurt am Main, Germany). Similar to recent auditory fMRI studies from our and other laboratories (Schwarzbauer et al., 2006; Doehrmann et al., 2008), scanning for the adaptation experiment was conducted with an interleaved silent steady-state echo planar imaging (EPI) sequence to reduce the influences of gradient switching. Each acquisition period lasted 10 s and consisted of a silent interval of 6 s, during which the acoustic stimulus was presented and a data acquisition period of 4 s [two volumes with a repetition time (TR) of 2 s and echo time (TE) of 30 ms]. On the basis of findings from a previous study (Altmann et al., 2007), we derived that this approach is likely to capture the peak of the BOLD response induced by the stimuli. For each run, 152 volumes consisting of 33 axial slices (3 mm thickness with 3.00 × 3.00 mm2 in-plane resolution and an interslice gap of 0.6 mm) were collected with a birdcage head coil. The field of view was 19.2 × 19.2 cm with an in-plane resolution of 64 × 64 pixels. As an anatomical reference, we acquired three-dimensional (3D) volume scans by using an MP-RAGE sequence with 160 slices (TR of 2.3 s).
For the localizer experiment, 281 volumes consisting of 34 axial slices were collected by using a conventional EPI sequence with the following parameters: TR of 2 s; TE of 30 ms; 3 mm slice thickness with 3.00 × 3.00 mm2 in-plane resolution and an interslice gap of 0.3 mm. The field of view was again 19.2 × 19.2 cm with an in-plane resolution of 64 × 64 pixels. Similar continuous sequences had been used previously in our laboratory in both the auditory and the multisensory domain (Altmann et al., 2007; Hein et al., 2007). The same MP-RAGE sequence as in the adaptation experiment was used for the acquisition of anatomical references.
Functional data were preprocessed and analyzed using the Brainvoyager QX (Brain Innovation) software package (version 1.9.10). Preprocessing included head movement correction and linear detrending. Correction of slice scan time using cubic spline interpolation and temporal high-pass filtering with three cycles per time course were only applied to the data of the localizer experiment. These two preprocessing steps require evenly sampled functional data. Because of the silent interval for stimulus presentation, this was not the case for the EPI sequence used in the adaptation experiment. More specifically, this type of unevenly sampled data could require an interpolation of data points before the application of a high-pass filter. However, work from the signal processing domain (Laguna et al., 1998) suggests that such an interpolation might cause artifacts such as a distortion of the temporal structure of our data. Furthermore, slice scan time correction was not applied to the data because this would have required a differential interpolation between consecutive volumes and volumes separated by a 6 s silent period. However, the regions under investigation here were only separated by (on average) four to six slices, which corresponds in our ascending, non-interleaved acquisition scheme to a very moderate temporal delay of 240–360 ms. Thus, the omission of these preprocessing steps attributable to particular features of sparse sampling sequences is unlikely to compromise the quality of the data collected in the present experiment. The 2D functional images were coregistered with the 3D anatomical data, and both 2D and 3D data were spatially normalized into the Talairach and Tournoux stereotactic coordinate system (Talairach and Tournoux, 1988). Functional 2D data were spatially filtered using a Gaussian kernel of 8 mm full-width at half-maximum.
For each experiment, we computed a general linear model (GLM) to estimate the beta weights that model the hemodynamic responses as a combination of two gamma functions (Friston et al., 1998). Whole-brain random-effects (RFX) GLMs across subjects were calculated. For the adaptation experiment, the model included the following eight predictors: (1) four predictors for the experimental conditions involving pairs of AV stimuli, (2) one predictor for the fixation condition, (3) one predictor for the target condition involving task-related motor activation, (4) one predictor for the auditory stimulation resulting from the scanner noise, and (5) one predictor for residual T1-related signal decay. For the localizer experiment, the GLM was constructed based on the six predictors that coded for the experimental conditions.
In a first analysis step, we used the GLM from the localizer experiment to define regions of interest (ROIs) with sensitivities to auditory and visual object stimuli, respectively. To this end, we computed beta-weight-based t tests contrasting responses to intact versus scrambled stimuli. For the auditory contrast, the resulting map was thresholded at t(14) = 4.14, corresponding to an uncorrected statistical value of p < 0.001. This map was then projected onto averaged three-dimensional cortex reconstructions generated from the anatomical datasets of all participants (see below) and submitted to cortex-based cluster threshold estimation based on a Monte Carlo simulation with 500 iterations. This procedure resulted in a statistical map with a minimal cluster size of 94 mm2, which corresponded to a corrected α value of p < 0.05. Similarly, visual ROIs were generated from a contrast of responses to blocks of intact versus scrambled images. A stricter statistical value was set to t(14) = 6.71 or p < 0.00001 to enhance selectivity of the obtained ROIs. The resulting maps were again projected onto the same averaged cortex reconstruction. Furthermore, to control for the fact that subsequent analyses might have been influenced by our ROI definition criteria, we ran additional analyses in which we equalized the size of our auditory ROIs to our visual ROIs with respect to cluster sizes (see supplemental data, available at www.jneurosci.org as supplemental material).
Data from the fMRIa experiment were then analyzed on the basis of these cortex-based auditory and visual ROIs. Because of the use of two datasets from different experiments, this analysis is statistically independent from the analyses that defined the ROIs (Kriegeskorte et al., 2009; Vul et al., 2009). Effects of auditory and visual repetitions were determined by means of ROI-based RFX GLMs in a manner corresponding to a two-factorial design with the factors “sensory modality” and “repetition.” More precisely, to investigate the impact of auditory changes compared with auditory repetitions, we calculated the following contrast, hereafter referred to as the “auditory adaptation contrast”: [(auditory different, visual same) + (auditory different, visual different) > (auditory same, visual different) + (auditory same, visual same)]. Note that the visual component was completely subtracted yielding an effect, which could be attributed solely to responses to auditory stimulation. Analogously, a “visual adaptation contrast” was computed: [(auditory same, visual different) + (auditory different, visual different) > (auditory different, visual same) + (auditory same, visual same)]. Similar to many fMRIa studies, we refer to a significant result in the direction of “different > same” as an effect of repetition suppression. In contrast, an effect in the opposite direction, i.e., “same > different”, could be regarded as reflecting “repetition enhancement” (Henson et al., 2000). Finally, the interaction term was defined in the following manner: [(auditory same, visual same) + (auditory different, visual different) > (auditory different, visual same) + (auditory same, visual different)].
Parameter estimates (beta weights) of responses in the auditory and visual ROIs during the adaptation experiment are visualized as bar plots in Figures 2 and 3 and supplemental Figures 1 and 2 (available at www.jneurosci.org as supplemental material). These response profiles are reported after the subtraction of the fixation condition. Error bars reflect mean SEs, which were corrected for intersubject effects similar to previous studies (Altmann et al., 2007; Doehrmann et al., 2008). In particular, the fMRI responses were calculated individually for each subject by subtracting the mean percentage signal change for all conditions within that subject from the mean percentage signal change for each condition and adding the mean percentage signal change for all the conditions across subjects.
Figure 2.
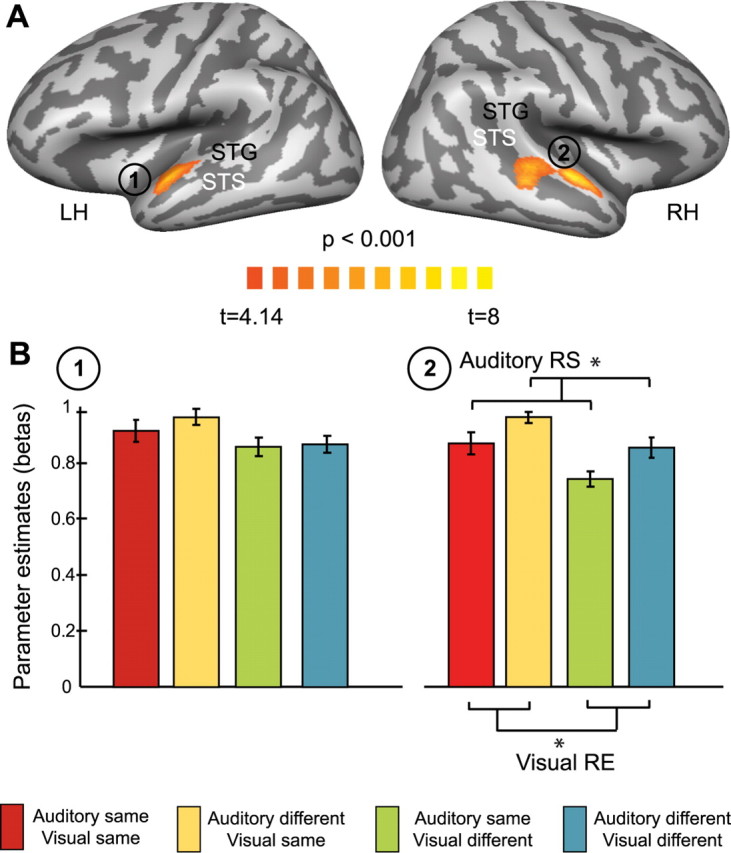
Adaptation effects based on the results of the auditory localizer. A, Group data (n = 15) contrasting intact and scrambled auditory stimuli were derived from the general linear model analysis of the localizer experiment. Results are shown on lateral views of left and right hemispheres of averaged inflated three-dimensional cortex reconstructions generated from the anatomical datasets of all subjects. Light gray represents gyri, and dark gray represents sulci. B, Results of the fMRIa experiment derived from the regions of interests shown in A. Bar plots represent parameter estimates (beta weights) of the four experimental conditions. The responses are reported after subtraction of the beta weights corresponding to the fixation condition on a single-subject basis, and error bars represent mean SEs of the fMRI responses corrected for intersubject effects. For details, see Materials and Methods. *p < 0.05, significant results of contrasts examining repetition effects. The same color conventions as for Figure 1 apply. Color codes are additionally provided at the bottom. LH, RH, Left and right hemisphere; RS, RE, repetition suppression and repetition enhancement.
Figure 3.
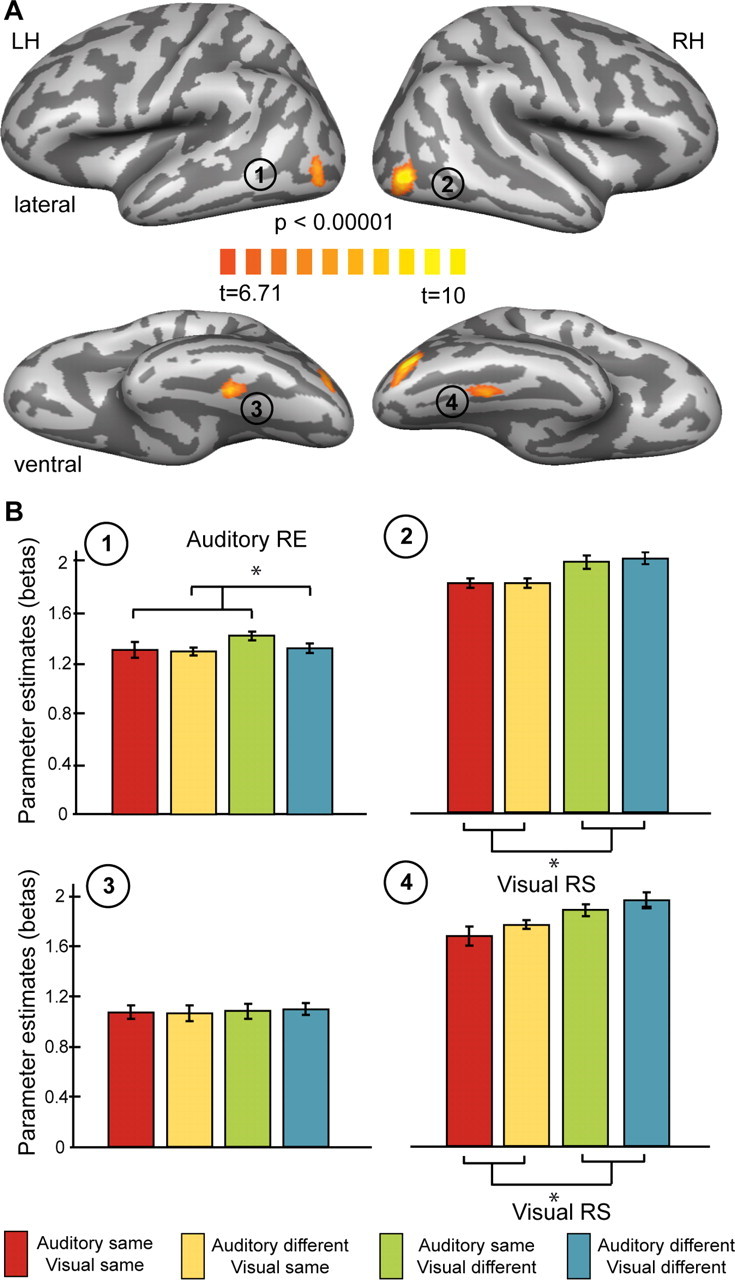
Adaptation effects based on the results of the visual localizer. A, Group data (n = 15) contrasting intact and scrambled visual stimuli were derived from the general linear model analysis of the localizer experiment. Results are shown on lateral (top) and ventral (bottom) views of left and right hemispheres of the same averaged cortex reconstruction used in Figure 2. B, Effects in the regions of interests shown in A are presented as bar plots of beta weights (again after subtraction of the fixation condition). Error bars represent mean SEs after correction for intersubject effects. Color codes are the same as in previous figures and are additionally provided at the bottom. *p < 0.05, significant results of contrasts examining repetition effects. LH, RH, Left and right hemisphere; RS, RE, repetition suppression and repetition enhancement.
We additionally conducted a whole-brain analysis to further corroborate findings from the ROI-based computations. The RFX GLM from the adaptation experiment was used to calculate the same adaptation contrasts as reported previously to search for cortical regions exhibiting repetition effects. Statistical maps were thresholded to an initial value of t(14) = 3.33, corresponding to p < 0.005, uncorrected. Volume-based cluster threshold estimation (Monte Carlo simulation with 1000 iterations) was applied, yielding a cluster size of 5 (125 mm3) voxels for the auditory adaptation contrast and 14 (2744 mm3) voxels for the visual adaptation contrast.
Finally, we were interested in the response patterns of heteromodal regions commonly found in conventional fMRI studies on audiovisual integration (Beauchamp et al., 2004; Hein et al., 2007), particularly the posterior superior temporal sulcus/middle temporal gyrus (pSTS/MTG). We examined several criteria for the definition of ROIs located in the pSTS/MTG and further tested for the presence of repetition-related effects in line with the previously described analyses (supplemental data, available at www.jneurosci.org as supplemental material).
Whenever feasible, group-averaged functional maps were projected onto inflated representations of the left and the right hemispheres of an averaged three-dimensional cortex reconstruction. These reconstructions were generated from the anatomical datasets of all participants by using algorithms from the so-called cortex-based intersubject-alignment procedure (Goebel et al., 2006), which were inflated to permit visualization of statistical activation maps in both gyri and sulci. Because a morphed surface always possesses a link to the folded reference mesh, functional data can be shown at the correct location of folded as well as inflated representations. In case a resulting cluster was comparatively small, we used a volume-based visualization on slices of an averaged anatomical dataset from all subjects of our study. However, to allow a better comparison of the location of this cluster to the other effects, we projected the statistical map to a cortex representation after lowering the threshold only for visualization purposes to an uncorrected level of p < 0.05 (instead of p < 0.05, corrected).
Results
Because we were primarily interested in the response patterns of those cortical regions that are commonly involved in auditory and visual processing of natural objects, we restricted our first analysis to voxels defined by separate localizer runs. For the localizer experiment, a group-based RFX GLM served as the basis for the definition of ROIs that are particularly related to processing of common auditory and visual objects.
We identified ROIs related to auditory object processing by contrasting responses to blocks of intact versus scrambled auditory stimuli. Figure 2A displays the significant (t(14) = 4.14; p < 0.001, uncorrected; corrected by cluster-size threshold to p < 0.05) activations of bilateral STG anterior to primary auditory cortex located in Heschl's gyrus as well as in middle portions of right STS. Similarly, we identified ROIs related to visual object processing by contrasting responses to blocks of intact versus scrambled visual stimuli. Figure 3A shows significant (t(14) = 6.71; p < 0.00001, uncorrected; corrected by cluster-size threshold to p < 0.05) bilateral activations in the LO cortex and fusiform gyrus (FG).
We then analyzed responses from the fMRIa experiment in these separately defined ROIs. Crucially, these analyses are statistically independent from the analyses that led to the definition of the ROIs, because they were based on two different datasets (Kriegeskorte et al., 2009; Vul et al., 2009). Furthermore, our data analysis always involved a two-step approach: first, an examination of the presence of effects of repetition suppression, which were expected to occur in the respective sensory region, usually processing stimuli from this sensory modality (as suggested by previous fMRIa studies with unimodal stimuli) and second, an investigation of crossmodal effects.
Adaptation effects in auditory object-sensitive cortices
The investigation of fMRIa effects in predefined ROIs in auditory temporal cortex revealed suppressed responses (t(14) = 2.261; p < 0.05) to those experimental conditions with repetitions in the auditory component from S1 and S2 compared with those with auditory changes in the right STG/STS (Fig. 2B). This significant auditory repetition suppression was expected for a region that has been shown to discriminate auditory objects, and it thus served as a proof-of-principle for our adaptation approach.
Most interestingly, in the same auditory region, we additionally found significant repetition effects (t(14) = −3.467; p < 0.05) for the comparison of visual repetitions and visual changes (Fig. 2B). In contrast to auditory repetition, however, visual repetition led to an enhanced signal in the right STG/STS (repetition enhancement). To investigate whether these effects were primarily driven by voxels located in either the STG or the STS, we divided the complete ROI into an anterior and a posterior portion. This analysis revealed that the repetition enhancement in the anterior portion (STG) was less pronounced than in the posterior portion (STS), dropping slightly below significance (t(14) = 1.937; p = 0.07). To ensure that this pattern of findings was not attributable to our particular choice of statistical thresholds, we redefined these auditory ROIs by matching the number of included voxels to the number of voxels comprising the visual ROIs (see below). Indeed, the effects detected in the auditory ROIs remained unchanged after controlling for ROI sizes, thereby corroborating the robustness of the previously described findings (supplemental Fig. 1, available at www.jneurosci.org as supplemental material). Again, the posterior cluster located on the STG (extending into STS) showed significant effects both for auditory repetition suppression (t(14) = 2.278; p < 0.05) and for visual repetition enhancement (t(14) = −3.368; p < 0.005). The anterior cluster on the STG still exhibited a significant visual repetition enhancement effect (t(14) = −2.496; p < 0.05), and the auditory repetition suppression effect showed a trend toward significance (t(14) = 1.879; p = 0.08).
No significant differences were detected in the left STG, and also the interaction contrast (see Materials and Methods) was not significant in either of the auditory ROIs.
Adaptation effects in visual object-sensitive cortices
A similar analysis in the visual ROIs revealed significant repetition suppression for visual repetitions in contrast to visual changes (Fig. 3B) in right LO (t(14) = 2.891; p < 0.05) and right FG (t(14) = 3.249; p < 0.05). Again, this result is expected for regions that are involved in the discrimination of visual objects. This finding shows that our adaptation approach was successful.
Importantly, similar to the visual repetition enhancement in the auditory ROI, we also detected auditory repetition enhancement in one of the visual ROIs. Left LO showed a significantly (t(14) = −2.436; p < 0.05) enhanced response to auditory repetitions than auditory changes (Fig. 3B). We did not find repetition effects for visual stimulation in either left LO or left FG, however. Furthermore, no significant interaction was found in the visual ROIs.
In summary, auditory regions seemed to be affected by repetitions in the visual domain, whereas visual regions appeared to be affected by repetitions in the auditory domain. Table 1 provides a summary of these analyses in auditory and visual ROIs. An auditory region in right STG/STS showed both a suppression effect to auditory repetition and an enhancement effect to visual repetition. In visual cortex, however, the effects were separable: both right LO and FG showed a suppression effect to visual repetition, whereas only left LO showed an enhancement effect to auditory repetition.
Table 1.
Coordinates and number of significant voxels in regions of interest generated by the localizer experiment: repetition effects as determined by the data from the adaptation experiment
| Region of interest | x | y | z | Numberof voxels | Auditory adaptation | Visualad aptation |
|---|---|---|---|---|---|---|
| Auditory: intact > scrambled | ||||||
| Left STG | −49 | −11 | 3 | 747 | ||
| Right STG/STS | 51 | −23 | 3 | 1513 | RS | RE |
| Visual: intact > scrambled | ||||||
| Left LO | −43 | −72 | 0 | 260 | RE | |
| Right LO | 44 | −69 | −3 | 581 | RS | |
| Left FG | −38 | −37 | −18 | 232 | ||
| Right FG | 36 | −41 | −18 | 253 | RS |
Regions were determined by the group-based RFX GLM of the localizer experiment by contrasting intact versus scrambled stimuli for the auditory and the visual sensory modalities. Talairach coordinates are derived from the clusters shown in Figures 2 and 3 and are provided in millimeters. The number of voxels is based on the resolution of the anatomical dataset, i.e. 1 × 1 × 1 mm. Significant effects for the two adaptation contrasts were denoted depending on the direction of the respective effect (for details, see Results). RS, Repetition suppression; RE, repetition enhancement.
Whole-brain adaptation effects
To further investigate these response patterns beyond the restriction of predefined ROIs, we computed the visual and auditory adaptation contrasts on a whole-brain level (Fig. 4). The visual adaptation contrast revealed a significant (t(14) = 3.33; p < 0.05, corrected) suppression to visual repetition in the left FG, posterior to our previously examined ROI (Fig. 4A). An additional cluster reached significance in the right FG but did not survive cluster-size correction. Importantly, in line with our ROI analysis, significant enhancement effects for visual repetition were found in right STG/STS. Additional clusters of activation were revealed in the right anterior insula and bilateral medial occipital cortex, close to early visual areas.
Figure 4.

Whole-brain results of the adaptation contrasts. A, Results for adaptation contrasts examining sensitivities to visual changes (different > same; orange map color) and repetitions (same > different, blue map color) as indices of repetition suppression and enhancements are shown on lateral (top), ventral (middle), and medial (bottom) views of the same averaged cortex reconstruction used in Figures 2 and 3. The red circle indicates the effect in right STG/STS. B, A similar contrast as in A was used for the investigation of auditory adaptation effects. Blue color of the map represents stronger effects for auditory repetitions than changes. Data are shown on an axial slice of a volume-based anatomical scan averaged across all subjects. The white circle indicates the effect in left LO. The bottom shows this previous effect on the cortical reconstruction used for the previous figures with a threshold lowered for purposes of visualization to p < 0.05 (uncorrected).
We found significant suppression effects for auditory repetition (t(14) = 3.33; p < 0.05, corrected) in the left precentral gyrus. Again in line with our ROI analysis, enhancement effects for auditory repetitions were statistically significant on the same level of significance in posterior LO of the left hemisphere (Fig. 4B). To allow for a comparison with the results reported in Figure 3A, we projected the cluster shown in the top panel of Figure 4B after lowering the threshold only for visualization purposes to a level corresponding to p < 0.05 (uncorrected). A summary and details of this analysis are provided in Table 2.
Table 2.
Whole-brain analysis of the fMRIa experiment
| Region of interest | x | y | z | Number of voxels |
|---|---|---|---|---|
| Visual: different > same (RS) | ||||
| Left FG | −37 | −54 | −15 | 190 |
| Visual: same > different (RE) | ||||
| Right STG/STS | 47 | −29 | 0 | 702 |
| Right anterior insula | 32 | 22 | 9 | 161 |
| Right lingual gyrus | 3 | −69 | 0 | 105 |
| Left lingual gyrus | −6 | −71 | 5 | 125 |
| −6 | −65 | 0 | 540 | |
| Auditory: different > same (RS) | ||||
| Left precentral gyrus | −45 | 13 | 9 | 520 |
| Auditory: same > different (RE) | ||||
| Left LO | −41 | −82 | 0 | 220 |
Regions were determined by the group-based RFX GLM of the fMRIa experiment. Adaptation contrasts (for details, see Results) for the investigation of repetition effects were calculated on a whole-brain level. Talairach coordinates are derived from the clusters shown in Figure 4. The same conventions apply as in Table 1.
Effects in multisensory regions
Our whole-brain analysis did not reveal effects in lateral temporal regions, which have been repeatedly identified as being critically involved in object-related AV integration (Beauchamp et al., 2004; Hein et al., 2007). On the basis of different criteria, we identified multisensory ROIs in the pSTS/MTG and tested for the same repetition-related effects as in our auditory and visual ROIs (supplemental Fig. 2, available at www.jneurosci.org as supplemental material). Regardless of the criterion in use for the definition of multisensory ROIs, the results of this analysis support our findings from the whole-brain analysis by demonstrating that these cortical regions show no differential pattern for the experimental conditions used in the fMRIa experiment. This was true for both our contrasts for repetition-related effects (repetition suppression and enhancement) and pairwise comparisons between experimental conditions (supplemental Fig. 2, available at www.jneurosci.org as supplemental material). This analysis is in line with our findings from the whole-brain analysis, i.e., no statistically significant differences or trends of any kind were found in pSTS/MTG for our repetition-related effects. Thus, in contrast to our STG/STS and LO region, pSTS/MTG does not seem to differentiate between the conditions used in the adaptation experiment.
Discussion
The aim of the present experiment was to test whether using solely AV stimulation could strengthen previously reported cortical effects of early sensory integration. Using fMRIa for the first time in the domain of AV processing of common objects, we documented an enhancement for repeated visual stimuli in the (auditory) STG/STS and for repeated auditory stimuli in (visual) left LO. Critically, we replicate previously described suppression effects to auditory repetition in auditory regions (Bergerbest et al., 2004; Altmann et al., 2007; Doehrmann et al., 2008) and suppression effects for repeated animal pictures in visual regions (Vuilleumier et al., 2002). Furthermore, the latter were particularly found in the right cortical hemisphere in line with previous reports of a right-hemispheric dominance for within-category repetition suppression (Koutstaal et al., 2001; Simons et al., 2003). Together, our findings are not only consistent with within-modality repetition effects but extend them substantially by showing that object-related visual (auditory) cortex is able to discriminate auditory (visual) signals at least along the dimension of “same” versus “different.” Thus, our results go beyond demonstrating that visual (auditory) cortex is able to detect the presence of visual (auditory) signals. Rather, it suggests interactions of cortices commonly associated with intermediate stages of object processing.
It is still a matter of intense debate which neuronal mechanisms actually mediate these complex crossmodal influences. It has been suggested that these effects might be the result of interactions between early sensory and multisensory cortices such as STS (Ghazanfar et al., 2008). However, a growing number of studies have shown direct connectivity between the auditory and visual cortices without additional connections through mediating neurons in multisensory regions (Falchier et al., 2002; Rockland and Ojima, 2003; Clavagnier et al., 2004). Also, more recently, projections from auditory to visual cortices were found to target not only primary but also extrastriate regions (Clemo et al., 2008).
Thus, accumulating evidence supports the view that interactions between the auditory and visual sensory modalities are probably mediated by various pathways, with direct influences and connections via multisensory regions being only two of several possibilities (Driver and Noesselt, 2008). Some evidence from our study suggests that the response pattern found in our study might be more in line with an account of direct influences. “Classical” multisensory regions such as those described by Beauchamp et al. (2004) located in the pSTS/MTG did not show differential crossmodal repetition effects in our study. This could be attributable to our particular fMRIa paradigm and the use of AV stimuli of common objects. Thus, pSTS/MTG might respond to any type of AV stimulation used during our experiment but, critically, without differentiating between stimuli involving repetitions or changes. Thus, the activity of this commonly reported region might be enhanced by AV stimulation per se, which is suggested by studies comparing responses to bimodal and unimodal stimulation (van Atteveldt et al., 2004; Hein et al., 2007). Also, pSTS/MTG is activated even by quite simple stimuli such as visual flashes and noise bursts as long as they occur synchronously (Noesselt et al., 2007). Consequently, pSTS/MTG had the same level of activity for all experimental conditions used during our study and could, therefore, not be revealed by any of our contrasts.
Furthermore, although this region might actually be responsive to a higher-order feature of AV stimuli, such as semantic congruency versus incongruency (Doehrmann and Naumer, 2008), this would also not be visible on the basis of our contrasts because both types of conditions (changes and repetitions) were always semantically congruent. Thus, future fMRIa paradigms involving variations of semantic congruency might reveal also repetition-related modulations of pSTS/MTG. Because of the variety of reasons that could account for our null effects for this region found in our study, we refrain from additional interpretations here.
Although the exact role of regions such as pSTS/MTG in AV object processing requires additional investigation, the present study offers novel evidence for AV interactions in a set of regions commonly associated with intermediate stages of (unisensory) object processing. AV integration effects have been found in early sensory cortices for comparatively simple stimuli (Noesselt et al., 2007; Martuzzi et al., 2007) and semantically modulated object stimuli (van Atteveldt et al., 2004; Hein et al., 2007). However, we are not aware of studies using AV stimuli of common objects that similarly showed influences on both auditory and visual cortices by a particular type of stimulation in the respective other sensory modality. Our STG/STS ROI is located anterior to commonly reported pSTS/MTG foci (cf. Beauchamp et al., 2004; Hein et al., 2007) in close proximity to higher-order auditory cortices, which have been associated with complex spectrotemporal processing (Lewis et al., 2005). Importantly, although the latter takes place on a pre-semantic level, this could contribute to functions such as the differentiation into different auditory object categories (Murray et al., 2006; Doehrmann et al., 2008; Staeren et al., 2009). Analogously, LO regions (and subregions of the fusiform gyrus) have also been repeatedly associated with object processing on a pre-semantic level, pertaining to shape processing (Malach et al., 1995; Amedi et al., 2001; Kourtzi and Kanwisher, 2001). Thus, it is likely that the suppression effects for unimodal repetitions were attributable to stimulus features such as shape and complex spectrotemporal patterns tapping into these intermediate object-processing stages in associated regions (LO and STG/STS respectively). However, the novelty of our study relates to its finding of additional repetition enhancement effects, which suggest an additional sensitivity of each of these sensory cortices to intermediate stages of object processing in the respective other modality. Additional studies will have to determine whether similar crossmodal repetition enhancement effects could be found with variations of increasingly simpler stimulus features, whether this produces shifts to earlier cortical regions, or whether the cortical correlates of intermediate object processing investigated here are the first to demonstrate these effects.
Furthermore, our finding of crossmodal repetition enhancement instead of repetition suppression needs to be investigated more thoroughly in future work. Generally, repetition enhancement has been found for unfamiliar visual (Henson et al., 2000; Fiebach et al., 2005; Gruber and Müller, 2005) and auditory (Gagnepain et al., 2008) stimuli and has been associated with the generation of novel memory representations of these stimuli (Henson, 2003; Gruber and Müller, 2005). Another account of repetition enhancement is based on studies that have systematically varied the degree of stimulus salience (James and Gauthier, 2006; Turk-Browne et al., 2007). For example, Turk-Browne and coworkers manipulated the contrast of scene stimuli and found repetition suppression effects for high-contrast scenes and repetition enhancement effects for low-contrast scenes. A possible explanation for these results is that repetition suppression occurs when the first stimulus can be successfully processed (as is the case for high-contrast stimuli). In contrast, as soon as the first stimulus is not easily recognizable (as is the case for low-contrast stimuli), an enhanced signal to the repetition of that response might aid recognition.
Our repetition enhancement effects in right STG/STS and in left LO might be similarly interpreted along these lines. For example, an auditory region such as right STG/STS reacts with a suppressed signal for auditory repetition compared with auditory changes (neurons in these regions are particularly tuned to sounds of this type). However, a visual stimulus could be regarded, similar to the low-contrast stimuli in the study by Turk-Browne et al. (2007), as suboptimal for this cortical region. It may therefore elicit repetition enhancement to aid overall object-recognition processes.
Moreover, the exact functional role of crossmodal repetition enhancement has to be determined. Unfortunately, our fMRIa study was not designed to address whether crossmodal repetition enhancement effects did indeed facilitate multisensory object recognition. Our task required only the detection of a target stimulus and, therefore, we might not have tapped into processes of object recognition as studies using a task, which requires access to semantic representations (Noppeney et al., 2008). Similarly, important open questions pertain to the processing of auditory object stimuli in LO regions, which has previously only been found after subjects learned to decode shape information from abstract sounds (Amedi et al., 2007). However, we hope that our results will inspire additional studies using crossmodal fMRIa paradigms. Furthermore, crossmodal transcranial magnetic stimulation (Romei et al., 2007) might shed additional light on the exact functional role of the activation in LO and STG/STS in the course of object recognition.
In summary, the present study used an fMRIa paradigm to investigate how cortical structures were modulated by repetition of the auditory, visual, or both components of two successive AV stimuli. Controlling for stimulus complexity and semantic congruency, our design revealed influences of (repeated) visual stimuli on processing in higher-order auditory cortices and of (repeated) auditory stimuli on extrastriate visual cortex. Findings within these regions are in line with their respective roles in object processing operating on an intermediate level. Furthermore, these effects could be revealed only with an fMRIa paradigm such as the one used here, and they provide additional support for the view that sensory integration occurs on earlier cortical levels as assumed previously.
Footnotes
This study was supported by Bundesministerium für Bildung und Forschung (Brain Imaging Center Frankfurt, Grant DLR 01GO0508), the Frankfurt Medical Faculty Intramural Young Investigator Program (M.J.N.), and Deutsche Forschungsgemeinschaft Grant AL 1074/2-1 (C.F.A.). We thank Steffen Volz for the development of the imaging sequence, Sandra Anti for scanning support, Tim Rohe for assistance during cortex reconstructions, and Benjamin Rahm, Michael L. Waskom, and Satrajit Ghosh for helpful discussions.
References
- Altmann CF, Deubelius A, Kourtzi Z. Shape saliency modulates contextual processing in the human lateral occipital complex. J Cogn Neurosci. 2004;16:794–804. doi: 10.1162/089892904970825. [DOI] [PubMed] [Google Scholar]
- Altmann CF, Doehrmann O, Kaiser J. Selectivity for animal vocalizations in the human auditory cortex. Cereb Cortex. 2007;17:2601–2608. doi: 10.1093/cercor/bhl167. [DOI] [PubMed] [Google Scholar]
- Amedi A, Malach R, Hendler T, Peled S, Zohary E. Visuo-haptic object-related activation in the ventral visual pathway. Nat Neurosci. 2001;4:324–330. doi: 10.1038/85201. [DOI] [PubMed] [Google Scholar]
- Amedi A, Stern WM, Camprodon JA, Bermpohl F, Merabet L, Rotman S, Hemond C, Meijer P, Pascual-Leone A. Shape conveyed by visual-to-auditory sensory substitution activates the lateral occipital complex. Nat Neurosci. 2007;10:687–689. doi: 10.1038/nn1912. [DOI] [PubMed] [Google Scholar]
- Beauchamp MS. Statistical criteria in FMRI studies of multisensory integration. Neuroinformatics. 2005;3:93–113. doi: 10.1385/NI:3:2:093. [DOI] [PMC free article] [PubMed] [Google Scholar]
- Beauchamp MS, Lee KE, Argall BD, Martin A. Integration of auditory and visual information about objects in superior temporal sulcus. Neuron. 2004;41:809–823. doi: 10.1016/s0896-6273(04)00070-4. [DOI] [PubMed] [Google Scholar]
- Bergerbest D, Ghahremani DG, Gabrieli JD. Neural correlates of auditory repetition priming: reduced fMRI activation in the auditory cortex. J Cogn Neurosci. 2004;16:966–977. doi: 10.1162/0898929041502760. [DOI] [PubMed] [Google Scholar]
- Clavagnier S, Falchier A, Kennedy H. Long-distance feedback projections to area V1: implications for multisensory integration, spatial awareness, and visual consciousness. Cogn Affect Behav Neurosci. 2004;4:117–126. doi: 10.3758/cabn.4.2.117. [DOI] [PubMed] [Google Scholar]
- Clemo HR, Sharma GK, Allman BL, Meredith MA. Auditory projections to extrastriate visual cortex: connectional basis for multisensory processing in “unimodal” visual neurons. Exp Brain Res. 2008;191:37–47. doi: 10.1007/s00221-008-1493-7. [DOI] [PMC free article] [PubMed] [Google Scholar]
- Dale AM. Optimal experimental design for event-related fMRI. Hum Brain Mapp. 1999;8:109–114. doi: 10.1002/(SICI)1097-0193(1999)8:2/3<109::AID-HBM7>3.0.CO;2-W. [DOI] [PMC free article] [PubMed] [Google Scholar]
- Doehrmann O, Naumer MJ. Semantics and the multisensory brain: how meaning modulates processes of audio-visual integration. Brain Res. 2008;1242:136–150. doi: 10.1016/j.brainres.2008.03.071. [DOI] [PubMed] [Google Scholar]
- Doehrmann O, Naumer MJ, Volz S, Kaiser J, Altmann CF. Probing category selectivity for environmental sounds in the human auditory brain. Neuropsychologia. 2008;46:2776–2786. doi: 10.1016/j.neuropsychologia.2008.05.011. [DOI] [PubMed] [Google Scholar]
- Driver J, Noesselt T. Multisensory interplay reveals crossmodal influences on “sensory-specific” brain regions, neural responses, and judgments. Neuron. 2008;57:11–23. doi: 10.1016/j.neuron.2007.12.013. [DOI] [PMC free article] [PubMed] [Google Scholar]
- Falchier A, Clavagnier S, Barone P, Kennedy H. Anatomical evidence of multimodal integration in primate striate cortex. J Neurosci. 2002;22:5749–5759. doi: 10.1523/JNEUROSCI.22-13-05749.2002. [DOI] [PMC free article] [PubMed] [Google Scholar]
- Fiebach CJ, Gruber T, Supp GG. Neuronal mechanisms of repetition priming in occipitotemporal cortex: spatiotemporal evidence from functional magnetic resonance imaging and electroencephalography. J Neurosci. 2005;25:3414–3422. doi: 10.1523/JNEUROSCI.4107-04.2005. [DOI] [PMC free article] [PubMed] [Google Scholar]
- Friston KJ, Josephs O, Rees G, Turner R. Nonlinear event-related responses in fMRI. Magn Reson Med. 1998;39:41–52. doi: 10.1002/mrm.1910390109. [DOI] [PubMed] [Google Scholar]
- Gagnepain P, Chételat G, Landeau B, Dayan J, Eustache F, Lebreton K. Spoken word memory traces within the human auditory cortex revealed by repetition priming and functional magnetic resonance imaging. J Neurosci. 2008;28:5281–5289. doi: 10.1523/JNEUROSCI.0565-08.2008. [DOI] [PMC free article] [PubMed] [Google Scholar]
- Ghazanfar AA, Schroeder CE. Is neocortex essentially multisensory? Trends Cogn Sci. 2006;10:278–285. doi: 10.1016/j.tics.2006.04.008. [DOI] [PubMed] [Google Scholar]
- Ghazanfar AA, Chandrasekaran C, Logothetis NK. Interactions between the superior temporal sulcus and auditory cortex mediate dynamic face/voice integration in rhesus monkeys. J Neurosci. 2008;28:4457–4469. doi: 10.1523/JNEUROSCI.0541-08.2008. [DOI] [PMC free article] [PubMed] [Google Scholar]
- Giard MH, Peronnet F. Auditory-visual integration during multimodal object recognition in humans: a behavioral and electrophysiological study. J Cogn Neurosci. 1999;11:473–490. doi: 10.1162/089892999563544. [DOI] [PubMed] [Google Scholar]
- Goebel R, Esposito F, Formisano E. Analysis of functional image analysis contest (FIAC) data with brainvoyager QX: from single-subject to cortically aligned group general linear model analysis and self-organizing group independent component analysis. Hum Brain Mapp. 2006;27:392–401. doi: 10.1002/hbm.20249. [DOI] [PMC free article] [PubMed] [Google Scholar]
- Grill-Spector K, Malach R. fMR-adaptation: a tool for studying the functional properties of human cortical neurons. Acta Psychol (Amst) 2001;107:293–321. doi: 10.1016/s0001-6918(01)00019-1. [DOI] [PubMed] [Google Scholar]
- Gruber T, Müller MM. Oscillatory brain activity dissociates between associative stimulus content in a repetition priming task in the human EEG. Cereb Cortex. 2005;15:109–116. doi: 10.1093/cercor/bhh113. [DOI] [PubMed] [Google Scholar]
- Hein G, Doehrmann O, Müller NG, Kaiser J, Muckli L, Naumer MJ. Object familiarity and semantic congruency modulate responses in cortical audiovisual integration areas. J Neurosci. 2007;27:7881–7887. doi: 10.1523/JNEUROSCI.1740-07.2007. [DOI] [PMC free article] [PubMed] [Google Scholar]
- Henson RN. Neuroimaging studies of priming. Prog Neurobiol. 2003;70:53–81. doi: 10.1016/s0301-0082(03)00086-8. [DOI] [PubMed] [Google Scholar]
- Henson R, Shallice T, Dolan R. Neuroimaging evidence for dissociable forms of repetition priming. Science. 2000;287:1269–1272. doi: 10.1126/science.287.5456.1269. [DOI] [PubMed] [Google Scholar]
- Hocking J, Price CJ. The role of the posterior superior temporal sulcus in audiovisual processing. Cereb Cortex. 2008;18:2439–2449. doi: 10.1093/cercor/bhn007. [DOI] [PMC free article] [PubMed] [Google Scholar]
- James TW, Gauthier I. Repetition-induced changes in BOLD response reflect accumulation of neural activity. Hum Brain Mapp. 2006;27:37–46. doi: 10.1002/hbm.20165. [DOI] [PMC free article] [PubMed] [Google Scholar]
- James TW, Humphrey GK, Gati JS, Servos P, Menon RS, Goodale MA. Haptic study of three-dimensional objects activates extrastriate visual areas. Neuropsychologia. 2002;40:1706–1714. doi: 10.1016/s0028-3932(02)00017-9. [DOI] [PubMed] [Google Scholar]
- Kayser C, Petkov CI, Augath M, Logothetis NK. Integration of touch and sound in auditory cortex. Neuron. 2005;48:373–384. doi: 10.1016/j.neuron.2005.09.018. [DOI] [PubMed] [Google Scholar]
- Kourtzi Z, Kanwisher N. Representation of perceived object shape by the human lateral occipital complex. Science. 2001;293:1506–1509. doi: 10.1126/science.1061133. [DOI] [PubMed] [Google Scholar]
- Koutstaal W, Wagner AD, Rotte M, Maril A, Buckner RL, Schacter DL. Perceptual specificity in visual object priming: functional magnetic resonance imaging evidence for a laterality difference in fusiform cortex. Neuropsychologia. 2001;39:184–199. doi: 10.1016/s0028-3932(00)00087-7. [DOI] [PubMed] [Google Scholar]
- Kriegeskorte N, Simmons WK, Bellgowan PS, Baker CI. Circular analysis in systems neuroscience: the dangers of double dipping. Nat Neurosci. 2009;12:535–540. doi: 10.1038/nn.2303. [DOI] [PMC free article] [PubMed] [Google Scholar]
- Laguna P, Moody GB, Mark RG. Power spectral density of unevenly sampled data by least-square analysis: performance and application to heart rate signals. IEEE Trans Biomed Eng. 1998;45:698–715. doi: 10.1109/10.678605. [DOI] [PubMed] [Google Scholar]
- Lakatos P, Chen CM, O'Connell MN, Mills A, Schroeder CE. Neuronal oscillations and multisensory interaction in primary auditory cortex. Neuron. 2007;53:279–292. doi: 10.1016/j.neuron.2006.12.011. [DOI] [PMC free article] [PubMed] [Google Scholar]
- Laurienti PJ, Perrault TJ, Stanford TR, Wallace MT, Stein BE. On the use of superadditivity as a metric for characterizing multisensory integration in functional neuroimaging studies. Exp Brain Res. 2005;166:289–297. doi: 10.1007/s00221-005-2370-2. [DOI] [PubMed] [Google Scholar]
- Lerner Y, Hendler T, Ben-Bashat D, Harel M, Malach R. A hierarchical axis of object processing stages in the human visual cortex. Cereb Cortex. 2001;11:287–297. doi: 10.1093/cercor/11.4.287. [DOI] [PubMed] [Google Scholar]
- Lewis JW, Brefczynski JA, Phinney RE, Janik JJ, DeYoe EA. Distinct cortical pathways for processing tool versus animal sounds. J Neurosci. 2005;25:5148–5158. doi: 10.1523/JNEUROSCI.0419-05.2005. [DOI] [PMC free article] [PubMed] [Google Scholar]
- Mahon BZ, Milleville SC, Negri GA, Rumiati RI, Caramazza A, Martin A. Action-related properties shape object representations in the ventral stream. Neuron. 2007;55:507–520. doi: 10.1016/j.neuron.2007.07.011. [DOI] [PMC free article] [PubMed] [Google Scholar]
- Malach R, Reppas JB, Benson RR, Kwong KK, Jiang H, Kennedy WA, Ledden PJ, Brady TJ, Rosen BR, Tootell RB. Object-related activity revealed by functional magnetic resonance imaging in human occipital cortex. Proc Natl Acad Sci U S A. 1995;92:8135–8139. doi: 10.1073/pnas.92.18.8135. [DOI] [PMC free article] [PubMed] [Google Scholar]
- Martuzzi R, Murray MM, Michel CM, Thiran JP, Maeder PP, Clarke S, Meuli RA. Multisensory interactions within human primary cortices revealed by BOLD dynamics. Cereb Cortex. 2007;17:1672–1679. doi: 10.1093/cercor/bhl077. [DOI] [PubMed] [Google Scholar]
- Mesulam MM. From sensation to cognition. Brain. 1998;121:1013–1052. doi: 10.1093/brain/121.6.1013. [DOI] [PubMed] [Google Scholar]
- Murray MM, Camen C, Gonzalez Andino SL, Bovet P, Clarke S. Rapid brain discrimination of sounds of objects. J Neurosci. 2006;26:1293–1302. doi: 10.1523/JNEUROSCI.4511-05.2006. [DOI] [PMC free article] [PubMed] [Google Scholar]
- Noesselt T, Rieger JW, Schoenfeld MA, Kanowski M, Hinrichs H, Heinze HJ, Driver J. Audiovisual temporal correspondence modulates human multisensory superior temporal sulcus plus primary sensory cortices. J Neurosci. 2007;27:11431–11441. doi: 10.1523/JNEUROSCI.2252-07.2007. [DOI] [PMC free article] [PubMed] [Google Scholar]
- Noppeney U, Josephs O, Hocking J, Price CJ, Friston KJ. The effect of prior visual information on recognition of speech and sounds. Cereb Cortex. 2008;18:598–609. doi: 10.1093/cercor/bhm091. [DOI] [PubMed] [Google Scholar]
- Rockland KS, Ojima H. Multisensory convergence in calcarine visual areas in macaque monkey. Int J Psychophysiol. 2003;50:19–26. doi: 10.1016/s0167-8760(03)00121-1. [DOI] [PubMed] [Google Scholar]
- Romei V, Murray MM, Merabet LB, Thut G. Occipital transcranial magnetic stimulation has opposing effects on visual and auditory stimulus detection: Implications for multisensory Interactions. J Neurosci. 2007;27:11465–11472. doi: 10.1523/JNEUROSCI.2827-07.2007. [DOI] [PMC free article] [PubMed] [Google Scholar]
- Schwarzbauer C, Davis MH, Rodd JM, Johnsrude I. Interleaved silent steady state (ISSS) imaging: a new sparse imaging method applied to auditory fMRI. Neuroimage. 2006;29:774–782. doi: 10.1016/j.neuroimage.2005.08.025. [DOI] [PubMed] [Google Scholar]
- Simons JS, Koutstaal W, Prince S, Wagner AD, Schacter DL. Neural mechanisms of visual object priming: evidence for perceptual and semantic distinctions in fusiform cortex. Neuroimage. 2003;19:613–626. doi: 10.1016/s1053-8119(03)00096-x. [DOI] [PubMed] [Google Scholar]
- Staeren N, Renvall H, De Martino F, Goebel R, Formisano E. Sound categories are represented as distributed patterns in the human auditory cortex. Curr Biol. 2009;19:498–502. doi: 10.1016/j.cub.2009.01.066. [DOI] [PubMed] [Google Scholar]
- Talairach J, Tournoux P. Co-planar stereotaxic atlas of the human brain. New York: Thieme Medical Publishers; 1988. [Google Scholar]
- Taylor KI, Moss HE, Stamatakis EA, Tyler LK. Binding crossmodal object features in perirhinal cortex. Proc Natl Acad Sci U S A. 2006;103:8239–8244. doi: 10.1073/pnas.0509704103. [DOI] [PMC free article] [PubMed] [Google Scholar]
- Turk-Browne NB, Yi DJ, Leber AB, Chun MM. Visual quality determines the direction of neural repetition effects. Cereb Cortex. 2007;17:425–433. doi: 10.1093/cercor/bhj159. [DOI] [PubMed] [Google Scholar]
- van Atteveldt N, Formisano E, Goebel R, Blomert L. Integration of letters and speech sounds in the human brain. Neuron. 2004;43:271–282. doi: 10.1016/j.neuron.2004.06.025. [DOI] [PubMed] [Google Scholar]
- Vuilleumier P, Henson RN, Driver J, Dolan RJ. Multiple levels of visual object constancy revealed by event-related fMRI of repetition priming. Nat Neurosci. 2002;5:491–499. doi: 10.1038/nn839. [DOI] [PubMed] [Google Scholar]
- Vul E, Harris C, Winkielman P, Pashler H. Puzzlingly high correlations in fMRI studies of emotion, personality, and social cognition. Perspect Psychol Sci. 2009;4:274–290. doi: 10.1111/j.1745-6924.2009.01125.x. [DOI] [PubMed] [Google Scholar]
- Weigelt S, Muckli L, Kohler A. Functional magnetic resonance adaptation in visual neuroscience. Rev Neurosci. 2008;19:363–380. doi: 10.1515/revneuro.2008.19.4-5.363. [DOI] [PubMed] [Google Scholar]