

Abstract
Amyloid-β (Aβ) peptides play a key role in the pathogenesis of Alzheimer's disease and exert various toxic effects on neurons; however, relatively little is known about their influence on glial cells. Astrocytes play a pivotal role in brain homeostasis, contributing to the regulation of local energy metabolism and oxidative stress defense, two aspects of importance for neuronal viability and function. In the present study, we explored the effects of Aβ peptides on glucose metabolism in cultured astrocytes. Following Aβ25-35 exposure, we observed an increase in glucose uptake and its various metabolic fates, i.e., glycolysis (coupled to lactate release), tricarboxylic acid cycle, pentose phosphate pathway, and incorporation into glycogen. Aβ increased hydrogen peroxide production as well as glutathione release into the extracellular space without affecting intracellular glutathione content. A causal link between the effects of Aβ on glucose metabolism and its aggregation and internalization into astrocytes through binding to members of the class A scavenger receptor family could be demonstrated. Using astrocyte-neuron cocultures, we observed that the overall modifications of astrocyte metabolism induced by Aβ impair neuronal viability. The effects of the Aβ25-35 fragment were reproduced by Aβ1-42 but not by Aβ1-40. Finally, the phosphoinositide 3-kinase (PI3-kinase) pathway appears to be crucial in these events since both the changes in glucose utilization and the decrease in neuronal viability are prevented by LY294002, a PI3-kinase inhibitor. This set of observations indicates that Aβ aggregation and internalization into astrocytes profoundly alter their metabolic phenotype with deleterious consequences for neuronal viability.
Introduction
Alzheimer's disease (AD), the most prevalent neurodegenerative disorder, results in the deterioration of selective cognitive performance, including memory and mental processing (McKhann et al., 1984). At the structural level, the brain of AD patients typically exhibits amyloid-β (Aβ) plaques, intracellular neurofibrillary tangles, vascular amyloidosis, and neuronal and synaptic loss. If the exact contribution of these individual lesions in the pathogenesis of AD remains controversial, a central role of Aβ peptides has been proposed (Hardy and Selkoe, 2002). The cascade of molecular and cellular events, referred to as the amyloid hypothesis, is thought to be initiated by the accumulation and aggregation of Aβ peptides, leading to alterations of synaptic function, activation of microglia and astrocytes, and oxidative injury. Altogether, these mechanisms lead to the neuronal dysfunction and degeneration responsible for the cognitive deficits observed in AD.
Aβ peptides are produced by the proteolytic cleavage of the transmembrane amyloid precursor protein (APP) by β- and γ-secretases (Haass and Selkoe, 2007), producing mainly Aβ1-40 and Aβ1-42, peptides of 40 and 42 residues in length, respectively. Aβ peptides exist in multiple assembly states—monomers, oligomers, protofibrils, fibrils, and larger amorphous aggregates such as plaques. Aβ1-42 is more prone to aggregation and fibril formation than Aβ1-40 (Snyder et al., 1994; Dahlgren et al., 2002) and is the predominant form found in amyloid plaques (Younkin, 1998). The amyloid hypothesis is strongly supported by the observation that most familial cases of AD exhibit mutations within APP or its cleaving enzymes, promoting increased Aβ generation and Aβ1-42/Aβ1-40 ratio (Selkoe, 2004).
One of the main features of AD is a severe reduction of the cerebral metabolic rate of glucose, the main energy substrate used by the brain (Zakzanis et al., 2003). Indeed, fluorodeoxyglucose positron emission tomography studies have shown a consistent and progressive reduction of glucose utilization in AD patients that can even precede the onset of symptoms (Mosconi et al., 2008).
Several essential functions have been demonstrated for astrocytes, in particular those related to their cooperation with neurons (Belanger and Magistretti, 2009). For instance, the existence of a tight metabolic interaction between these two cell types in terms of energy metabolism (Magistretti, 2006), defense against oxidative stress (Dringen, 2000), and neurotransmitter reuptake and recycling (Bak et al., 2006) is now well documented (Magistretti, 2008). At the morphological level, astrocytes have specialized processes ensheathing synapses and intraparenchymal capillaries. These features position astrocytes as the prevalent site of glucose entry into the brain and endow them with the capacity to sense synaptic activity and dynamically couple it to substrate distribution to neurons (Magistretti, 2006). Another key feature of astrocytes is that they are virtually the only neural cell type that can store glucose as glycogen (Magistretti, 2008). These observations suggest that astrocytes might participate in the overall modulation of glucose utilization observed in AD and in the development and progression of neurodegeneration in this disease (Rodriguez et al., 2009). This study was therefore undertaken to explore the effects of Aβ peptides on glucose metabolism in cultured astrocytes as well as the possible implications of such metabolic changes on neuronal viability.
Materials and Methods
Reagents.
Amyloid-β and control peptides were purchased from Bachem or synthesized and purified by Dr. James I. Elliott at Yale University (New Haven, CT) and, unless otherwise specified, prepared in sterile deionized water. Unless otherwise specified, Aβ25-35 and Aβ35-25 were used at 25 μm (100× stock solution); human Aβ1-42, human Aβ1-40, and FITC-labeled human Aβ1-42 were used at 6 μm (33× stock solution). When solubilized in dimethylsulfoxide (DMSO), Aβ peptides were prepared as 500× stock solutions.
2-[1,2-3H]Deoxy-d-glucose ([3H]-2-DG) (specific activity, 30–60 Ci/mmol) was obtained from ANAWA. d-[6-14C]Glucose and d-[1-14C]glucose (specific activities, 50–62 mCi/mmol) were from GE Healthcare. [35S]Methionine labeling mix (l-[35S]methionine and l-[35S]cysteine) (specific activity, >1000 Ci/mmol) was from Hartmann Analytic. Enzymes for glycogen, lactate release, and glutathione assays, as well as NAD, NADH, NADP, NADPH, and ATP, were purchased from Roche. Fetal calf serum (FCS) was purchased from BioConcept. U0126 was from Merck, and Neurobasal medium, GlutaMAX, and B27 supplement were provided by Invitrogen. All other chemicals, including DMEM, antibiotic/antimycotic solution (A7292), acivicin, cycloheximide (CHX), polyinosinic acid [poly(I)], polycytidylic acid [poly(C)], LY294002, wortmannin, and SB202190 were obtained from Sigma-Aldrich.
Astrocytic cultures.
Primary cultures of cerebral cortical astrocytes were prepared from newborn (1–2 d old) OF1 mice (Charles River Laboratories) as described previously (Allaman et al., 2004). Briefly, forebrains were removed aseptically from the skulls, the meninges were excised carefully under dissecting microscope, and the cortices were isolated. The cells were dissociated by passing through needles of decreasing diameter (16, 19, and 25 gauge) five times with a 10 ml syringe. The cells were seeded at an average density of 105 cells/cm2 on poly-ornithine-coated dishes (35 mm), glass coverslips (12 mm diameter), or 24-well plates in DMEM (D7777, Sigma-Aldrich) containing 25 mm glucose and supplemented with 44 mm NaHCO3, 10 ml/L antibiotic/antimycotic solution (DMEM25), and 10% FCS and incubated at 37°C in an atmosphere containing 5% CO2 and 95% air. The culture medium was renewed 3–5 d after seeding and subsequently twice a week. Experiments were performed on confluent 21-d-old cultures. These culture conditions yielded >90% glial fibrillary acidic protein (GFAP; astroglial marker) immunoreactive cells and <1% isolectin B4-positive cells (microglial marker). These values were unchanged after 48 h of treatment with Aβ25-35 (data not shown). If not otherwise specified, culture medium was renewed 24 h before Aβ treatment induced by addition of amyloid peptides in the culture medium.
Neuronal cultures.
Primary cultures of cortical neurons were prepared from embryonic day 17 (E17) OF1 mice embryos (Charles River Laboratories). Briefly, cortices were isolated, minced in 2 mm2 pieces, and incubated at 37°C for 30 min in a solution containing papain 20 U/ml (Worthington Biochemical), 1 mm l-cysteine, 0.5 mm EDTA, and 100 U/ml DNAase (Worthington Biochemical). Papain activity was then inhibited by adding fetal calf serum and a single-cell suspension was obtained by gentle trituration in Neurobasal medium supplemented with B27 and GlutaMAX (Invitrogen). Cells were plated at an average density of 4 × 10⁴ cells/cm2 in supplemented Neurobasal medium on poly-ornithine-coated glass coverslips (20 mm diameter). Neurons were maintained at 37°C in a humidified atmosphere containing 5% CO2 and 95% air and were used at day in vitro 14.
Coculture experiments.
Astrocytes cultured in DMEM25 supplemented with 10% fetal calf serum were treated with Aβ peptides, poly(I), or poly(C) for 24 h. When indicated, LY294002 was added 1 h before amyloid peptide and maintained throughout the whole incubation period. Active substances were then removed by aspirating the medium and astrocytes were rinsed with fresh culture medium and then placed in supplemented Neurobasal medium. Cocultures were initiated 4 h after Aβ withdrawal by transferring neurons grown on coverslips on top of the astrocyte layer cultured in 35 mm dish (neurons facing up). At no time were neurons in direct contact with Aβ. Neuronal viability was assessed 24 h following the initiation of cocultures using thiazolyl blue tetrazolium bromide (MTT; Sigma-Aldrich) reduction assay or calcein-AM (see below).
[3H]-2-DG uptake.
[3H]-2-DG uptake experiments were conducted as described previously (Allaman et al., 2004). Two hours before the 2-DG experiment, the medium was removed and cells were incubated in serum-free DMEM (D5030, Sigma-Aldrich) supplemented with 5 mm glucose, 44 mm NaHCO3, and 10 ml/L antibiotic/antimycotic solution (DMEM5) at 37°C in an atmosphere containing 5% CO2 and 95% air. The 2-DG assay was initiated by replacing the medium by 2 ml of DMEM5 containing 1 μCi/ml [3H]-2-DG. The cells were incubated for an additional 20 min at 37°C in an atmosphere containing 5% CO2 and 95% air. The uptake was terminated by aspiration of the culture medium (used for lactate release assay, see below) and by washing the cells three times with 4 ml of ice-cold PBS. Cells were then lysed by addition of 2 ml of 10 mm NaOH containing 0.1% Triton X-100. Five hundred-microliter aliquots, in duplicate, were assayed for radioactivity by liquid scintillation counting. Results, which represent transporter-mediated glucose uptake and subsequent phosphorylation, were calculated by subtracting from total counts the portion that was not inhibited by the glucose transporter inhibitor cytochalasin B (25 μm) added 20 min before and along with [3H]-2-DG incubation. For the signaling pathway experiments the 2 h preincubation in DMEM5 was omitted and the [3H]-2-DG uptake was performed directly after the incubation period to ensure continued action of the inhibitors. When indicated, LY294002, SB202190, wortmannin, and U0126 were applied 30 min and CHX 1 h before Aβ and kept for the whole incubation period. All media used for [3H]-2-DG uptake were pre-equilibrated at 37°C in an atmosphere containing 5% CO2 and 95% air. [3H]-2-DG uptake was expressed as femtomoles per dish.
Protein content determination.
Protein content in cell lysates was determined by the BCA protein assay reagent kit (Pierce) according to manufacturer's instructions. This assay was chosen over the traditional Bradford assay, which mostly detects the presence of arginine and aromatic amino acids (Compton and Jones, 1985), none of which are contained in the Aβ25-35 fragment, thus precluding its detection by this assay. Indeed, in contrast to the BCA assay, no change in cellular protein content could be measured following treatment with Aβ25-35 using the Bradford assay. This was interpreted as an indirect demonstration that the increased protein content seen in astrocytes following Aβ25-35 treatment (see Results) is due to its internalization.
Lactate release.
Lactate release by astrocytes was determined as described previously (Allaman et al., 2004). Briefly, 200 μl aliquots of the culture medium used for [3H]-2-DG incubation were mixed with 2 ml of glycine buffer (0.2 mm), pH 10, containing 2 mg/ml NAD and 7 U/ml lactate dehydrogenase and incubated at 40°C for 1 h. After 20 min at room temperature, the amount of NADH produced was measured in a 100 μl aliquot loaded on a 96-well plate with a spectrophotometer (increased in absorbance at 340 nm) (Safire 2, Tecan), and absolute values were determined from a standard curve. Lactate release into the medium was expressed as nanomoles per dish.
Glycogen assay.
At the end of the incubation period, the cells were rinsed three times with ice-cold PBS and lysed by sonication in 1.5 ml of 30 mm HCl. Glycogen content of the cell extracts was determined enzymatically as described previously (Allaman et al., 2004). Briefly, two 100 μl aliquots were sampled in duplicate. Three hundred microliters of acetate buffer (0.1 m), pH 4.65, was added to the first aliquot, and 300 μl of the same acetate buffer containing 1% (v/v) amyloglucosidase (140 U/ml) was added to the other. After incubation (30 min at room temperature), 2 ml of Tris-HCl buffer (0.1 mm), pH 8.1, containing 3.3 mm MgCl2, 0.2 mm ATP, 25 μg/ml NADP, 0.7 U/ml hexokinase, and 0.35 U/ml glucose-6-phosphate dehydrogenase were added to the aliquots, and the mixture was incubated for 30 min at room temperature. The fluorescence of the NADPH formed was read at 340/450 nm (excitation/emission) with an appropriate standard curve (using glucose as a standard). The first aliquot provides the signal generated by glucose and glucose-6-phosphate, while the second corresponds to the signal generated by glycogen plus glucose and glucose-6-phosphate. The amount of glycogen was determined by the difference between the two. One should pay attention that hereafter “one mole of glycogen” represents one mole of glycosyl unit originating from glycogen. Glycogen cell content was expressed as namomoles per dish.
14CO2 production assay.
Production of 14CO2 from d-[1-14C]glucose and d-[6-14C]glucose was used to determine net glucose utilization via the pentose phosphate pathway (PPP) and tricarboxylic acid cycle (TCA cycle), respectively, according to published procedure (Soucek et al., 2003). After Aβ treatment, the culture medium was removed and cells were incubated for 2 h in serum-free DMEM (D5030, Sigma-Aldrich) containing 2.5 mm glucose, 7.5 mm NaHCO3, 5 mm HEPES, and 10 ml/L antibiotic/antimycotic solution at 37°C in an atmosphere containing 5% CO2 and 95% air. At the end of this incubation period, the medium was replaced by 2 ml of the same medium containing 2.3 μCi/ml d-[1-14C]glucose or d-[6-14C]glucose, and culture dishes were placed in sealed glass containers and incubated for 2 h at 37°C. The reaction was stopped by addition of 500 μl of 0.2 m HCl on the cells, and 1 ml of Carbo-Sorb (PerkinElmer) was placed onto the bottom of the container. After 1 h of equilibration, containers were opened and two 400 μl aliquots of Carbo-Sorb were assayed for radioactivity by liquid scintillation counting (Permafluor E+, PerkinElmer). Production of 14CO2 from d-[1-14C]glucose reflects the total CO2 produced in both PPP and TCA cycle, whereas 14CO2 produced from d-[6-14C]glucose reflects CO2 production in the TCA cycle only (Soucek et al., 2003). CO2 production in the PPP is obtained by subtraction. Total CO2 production from glucose can be calculated from the molar ratio between unlabeled and labeled glucose. Results are expressed in nanomoles of CO2 produced per minute per cell culture dish.
Glutathione assay.
Glutathione levels (reduced form, GSH, or oxidized form, GSSG) were determined as described previously (Gavillet et al., 2008). For these experiments, 24 h before treatment cell culture medium was replaced by a phenol red-free culture medium (D2902, Sigma-Aldrich) supplemented with 44 mm NaHCO3, 10 ml/L antibiotic/antimycotic solution, and 10% FCS and complemented to 25 mm glucose to give rise to a medium that is strictly equivalent to the normal culture medium except for phenol red. At the time of stimulation and at the end of the treatment period, aliquots of culture medium were sampled for extracellular glutathione determination (see below). After the incubation period, cells were rinsed with iced-cold EDTA-phosphate buffer (16 mm NaH2PO4, 54 mm Na2HPO4, 1 mm EDTA, pH 7.5). Then cells were lysed on ice with 1 ml of 1% 5-sulfosalicylic acid (SSA) in H2O. Cell suspension was collected using a cell scraper and centrifuged for 5 min at 12,000 × g at 4°C. To determine total intracellular glutathione content (GSx = GSH + GSSG, where GSx is total glutathione), 10 μl of the supernatant or GSSG standards in 1% SSA (0–200 pmol of GSSG/10 μl, equivalent to 0–400 pmol of GSH/10 μl) were transferred in duplicate onto a microtiter plate, and the volume was adjusted to 100 μl with H2O. In parallel, to determine the amount of oxidized glutathione, GSSG, a 130 μl aliquot of the supernatant was sampled and added to 5 μl of 2-vinylpyridine. pH was adjusted between 5 and 7 with 0.2 m Tris-HCl, pH 6.8, and the mixture was incubated for 1 h at room temperature. A set of GSSG standards (0–200 pmol of GSSG/10 μl in 1% SSA) was treated in the same way. At the end of the incubation period, 10 μl aliquots were loaded, in duplicate, onto a microtiter plate and the volume was adjusted to 100 μl with H2O. Then, 100 μl of a reagent mix solution composed of EDTA-phosphate buffer containing 0.15 mm 5,5′-dithiobis(2-nitrobenzoic acid) (DTNB), 0.2 mm NADPH, and 1 U/ml glutathione reductase was added into each well at room temperature, and the amount of reduced DTNB produced was determined spectrophotometrically (Safire 2, Tecan) at 410 nm every 15 s over a 5 min period. Intracellular glutathione levels (GSx and GSSG) were expressed as nanomoles of GSH equivalent per dish. Extracellular GSx levels were determined in the same way as intracellular GSx levels using 80 μl aliquots of cell culture medium with GSSG standards dissolved in fresh culture medium. In these experimental conditions, glutathione accumulation in the medium was determined during the 48 h treatment period by subtracting glutathione levels measured at the time of stimulation from the levels measured after 48 h of treatment. When indicated, acivicin was added 1 h before Aβ and kept for the whole incubation period. Extracellular glutathione levels (GSx) were expressed as nanomoles of GSH equivalent per dish.
Hydrogen peroxide production assay.
Hydrogen peroxide (H2O2) accumulation in the extracellular space was determined using the Amplex Red fluorescent assay. Briefly, after stimulation cells were rinsed with Krebs–Ringer phosphate glucose (129 mm NaCl, 1.58 mm Na2HPO4, 4.86 mm KCl, 0.54 mm CaCl2, 1.22 mm MgSO4, 5 mm glucose, pH 7.4) and incubated for 2 h in 500 μl of phenol red-free culture medium (D2902, Sigma-Aldrich; supplemented with 44 mm NaHCO3, 10 ml/L antibiotic/antimycotic solution and complemented to 25 mm glucose) containing 10 μm Amplex Red (Invitrogen) and 1 U/ml horseradish peroxidase (type II, Sigma-Aldrich). A standard of H2O2 (100 nm to 10 μm) was treated in parallel. Two hundred-microliter aliquots of supernatant and standards were then sampled and loaded on a black 96-well plate (PerkinElmer), and the amount of resorufin produced by Amplex Red oxidation was determined fluorometrically (Safire 2, Tecan) (excitation 545 nm, emission 590 nm). For these experiments astrocytes were seeded on 24-well plates. Results are expressed as micromolar concentrations of H2O2 in the medium.
MTT reduction test.
After stimulation, culture medium was replaced by DMEM5 and cells were further incubated for 2 h at 37°C in an atmosphere containing 5% CO2 and 95% air. The medium was then replaced by the same DMEM medium containing 0.1 mg/ml MTT, and cells were incubated for 20 min at 37°C in an atmosphere containing 5% CO2 and 95% air. The reaction was stopped by aspiration of the medium and addition of 2 ml of DMSO. For MTT determination in coculture and primary neuronal cultures experiments, a 20× stock solution of MTT was added directly to the culture medium to give rise to a final concentration of 0.2 mg/ml, and cells were incubated for 30 min at 37°C in an atmosphere containing 5% CO2 and 95% air. The medium was then removed by aspiration, the glass coverslips bearing neurons were placed in a new dish, and the reaction was stopped by the addition of 1 ml of DMSO. The amount of reduced MTT (formazan) solubilized in DMSO was then determined spectrophotometrically using absorbance at 560 nm (Safire 2, Tecan). Results are expressed as percentage of control values.
Calcein-AM assay.
After stimulation, cocultures were rinsed with Neurobasal medium to remove extracellular esterases. The neuronal coverslips were then transferred to new wells of fresh Neurobasal medium pre-equilibrated at 37°C in an atmosphere containing 5% CO2 and 95% air and containing 1 μg/ml calcein-AM (Invitrogen). Neurons were incubated in the presence of calcein-AM for 30 min at 37°C, after which the reaction was stopped by rinsing three times with prewarmed (37°C) Neurobasal medium. Cells were lysed by sonication, 200 μl of supernatant was transferred into a black-walled 96-well plate (PerkinElmer), and calcein fluorescence was measured (Safire 2, Tecan) (490 nm excitation; 515 nm emission; 5 nm excitation and emission bandwidth). Results are expressed as percentage of control values.
Cell counting.
After stimulation, cells in culture were rinsed in DMEM25 and dissociated with a solution of 0.05% trypsin-EDTA (Invitrogen) for 10 min at 37°C. Cells in suspension were then centrifuged for 4 min at 200 × g and the pellet was resuspended in DMEM25 with 10% serum. Cell number per dish was determined by counting cells in suspension using a Neubauer cell chamber.
[35S]Methionine incorporation.
Cell cultures were rinsed with DMEM without methionine and cysteine (DMEM-aa) (Invitrogen), and culture medium was replaced by DMEM-aa containing 10% FCS, 1% DMEM5, and 25 μCi/ml [35S]-methionine labeling mix. Cultures were then exposed to Aβ for 24 h. When indicated, CHX was added 1 h before amyloid peptide and maintained throughout the entire incubation period. Cells were then rinsed three times with ice-cold PBS and lysed with 500 μl of a buffer composed of 62.5 mm Tris, pH 6.8, 50 mm DTT, and 0.3% SDS. Cell suspensions were heated for 5 min at 95°C and sonicated for 15 s. Five hundred microliters of BSA (0.1 mg/ml) containing 0.02% NaN3 was added to 50 μl aliquots of cell suspensions, and then proteins were precipitated with 500 μl of ice-cold 20% trichloroacetic acid. The mix was homogenized, incubated for 30 min on ice, and then filtered on glass microfiber filter (GF/B filter, Whatman). Filters were rinsed two times with 5 ml of 10% trichloroacetic acid and two more times with 100% ethanol. Each filter was then placed in 7 ml of scintillation liquid and radioactivity due to 35S incorporation was determined with a beta counter. Results are expressed as percentage of control values.
Confocal microscopy.
Astrocytes seeded on glass coverslips (12 mm diameter) were exposed to human FITC-Aβ1-42 for 2 h at 37°C in an atmosphere containing 5% CO2 and 95% air. When indicated, poly(I) or poly(C) was added 1 h before amyloid peptide and maintained throughout the whole incubation time. Cell membrane labeling was performed with Vybrant DiD dye (Invitrogen) added to a final concentration of 4 μm in the culture medium 15 min before the end of the stimulation. At the end of the incubation period, cells were rinsed two times in ice-cold PBS and fixed for 15 min in an ice-cold solution of 4% paraformaldehyde in PBS. Then cells were rinsed four times in PBS and sealed on a microscope glass slide with 1,4-diazabicyclo(2,2,2)octane (DABCO) mounting medium (24 mg/ml DABCO, 50% glycerol, in 1×PBS, pH 7.5). The three-dimensional (3D) image acquisitions were performed on 25–35 images with 163 nm step size on a confocal microscope (Leica TSC SP2) with a HCx Plan Apo 63×, 1.30 numerical aperture, IMM/CORR glycerol immersion objective. To avoid any cross talk, the images were acquired in sequential mode using laser lines at 488 and 633 nm with a power 10–25% transmission, 4–8 average line method, 800 Hz scan speed, and short bandpass, 495–520 nm for FITC and 650–690 nm for DiD. To obtain a correct resolution, we use a format of 1024 × 1024 with an electronic zoom at 2 corresponding to 116 nm/pixel. The pinhole aperture was 1 Airy unit.
Electron microscopy.
Aβ25-35 was first dissolved as stock solutions either in sterile deionized water or in sterile DMSO. The amyloid preparations were then diluted to the final working concentration (25 μm) in sterile deionized water. Following 4 h of incubation at 37°C, samples were vortexed and 5 μl aliquots of the samples were then applied to formvar-coated grids. After 1 min, excess fluid was withdrawn and the grids were washed with two drops of bidistilled water. The specimens were negatively stained with two drops of 2% (w/v) uranyl acetate, examined in a Philips CM12 electron microscope, and photographed using a Gatan CCD camera (Gloor Instruments).
Thioflavin T binding assay.
Aβ25-35, Aβ1-42, and Aβ1-40 were first dissolved as stock solutions in either sterile deionized water or sterile DMSO. The amyloid preparations were then diluted to the final working concentration in phenol red-free culture medium containing 10% FCS, identical to that used for the glutathione assay, and incubated for different times in cell culture conditions at 37°C in an atmosphere containing 5% CO2 and 95% air. A 10 μl aliquot of each amyloid preparation was then added to 10 μl of 100 μm thioflavin T (ThT) and 80 μl of 50 mm glycine, pH 8.5. A sample of pure culture medium was used as the control. Fluorescence of ThT was determined using a fluorescence spectrometer (Analyst AD, Molecular Devices) with excitation at 450 nm and emission at 485 nm. Results were expressed as fluorescence intensity.
Western blot analysis.
Cells were harvested in 80 μl of lysis buffer (62 mm Tris-HCl, pH 6.8, 50 mm DTT, 0.3% SDS) containing protease (Complete, Roche) and phosphatase (Sigma-Aldrich) inhibitor cocktails. Loading buffer (giving rise to final concentrations of 62 mm Tris-HCl, pH 6.8, 10% glycerol, 1% SDS, 0.1 m DTT, and 0.005% bromophenol blue) was added to protein samples (5 μg) before denaturing at 100°C for 5 min. Proteins were resolved on NuPAGE 10% Bis-Tris minigels using MES SDS running buffer (Invitrogen) and transferred to Immobilon-P polyvinylidene difluoride (PVDF) membranes (Millipore). The membranes were blocked for 1 h in PBS containing 0.1% Tween 20 (PBST) and 2% ECL blocking reagent (GE Healthcare) and then incubated overnight at 4°C with a mouse monoclonal antibody directed against synaphophysin (Synaptic Systems) diluted 1:20,000 in blocking buffer. After washing with PBST, the blots were probed with anti-mouse horseradish peroxidase-conjugated antiserum (GE Healthcare) diluted 1:15,000 in PBST plus 2% ECL blocking reagent. After extensive washing with PBST, the peroxidase activity was detected by chemiluminescence using the ECL detection system (GE Healthcare) and Kodak BioMax MR films. β-Actin expression was used for normalization. The PVDF membranes used for synaptophysin expression were stripped for 30 min at 50°C in buffer containing 62 mm Tris-HCl, pH 6.8, 100 mm β-mercaptoethanol, and 2% SDS. Membranes were washed several times with PBST and probed as described above using a mouse monoclonal antibody against β-actin diluted 1:75,000 (Sigma Aldrich). Western blots films were digitized using a CoolSNAP cf CCD camera (Photometrics) and quantified using the MCID Basic 7.0 imaging software using the density profile function. Background correction was applied to each lane individually and density × area values were used for statistical analyses.
Statistical analysis.
All results are presented as the mean ± SEM. Data were analyzed for statistical significance with Student's t test or by ANOVA with multiple comparisons using either Dunnett's or Bonferroni's test using InStat 3.0 software (GraphPad).
Results
Metabolic effects of Aβ in cultured astrocytes
To explore the impact of Aβ on the main pathways of glucose metabolism in cultured astrocytes, we used the Aβ25-35 fragment. This peptide is known to reproduce the aggregation and toxic properties of the naturally occurring Aβ1-42 isoform and is thus widely used to mimic Aβ1-42 effects in in vitro models (Yankner et al., 1990; Pike et al., 1995; Frozza et al., 2009). Interestingly, Aβ25-35 was also identified in vivo in brains of patients suffering from AD (Kubo et al., 2002, 2003). The proteolytic cleavage pathway leading to Aβ25-35 formation is not known, but some evidence suggest that its occurrence most likely results from Aβ1-40 degradation (Kubo et al., 2003). Since—as will be developed below—Aβ peptide causes an increase in cellular protein content independent of cell counts, all biochemical results are expressed per cell culture dish (see below; protein content is typically 200 μg per control dish).
Aβ peptide increases glucose utilization in cultured mouse cortical astrocytes in a concentration-dependent manner with a maximum effect at 25 μm (Fig. 1A), as revealed by the [3H]-2-DG uptake technique. Quantitatively, after 48 h of treatment with 25 μm Aβ25-35 (the working concentration and treatment duration we chose for subsequent experiments), [3H]-2-DG uptake was increased to 158.0 ± 8.6% of control, whereas in the same conditions the reverse peptide Aβ35-25 did not cause any significant increase in cell glucose utilization (99.5 ± 7.3% of control). The time course experiment shows that Aβ25-35 induces a significant increase in glucose utilization as early as 12 h following stimulation (149.2 ± 10.7% of control) (Fig. 1B). This increase in [3H]-2-DG uptake is sustained up to 48 h, and a further increase in glucose utilization is observed at 72 h (243.9 ± 18.9% of control). The control peptide Aβ35-25 causes no significant increase of glucose utilization after up to 72 h (data not shown). Aβ peptide did not significantly alter astrocytic viability following stimulation for 48 h at a concentration of 25 μm as determined by the MTT reduction assay (data not shown).
Figure 1.
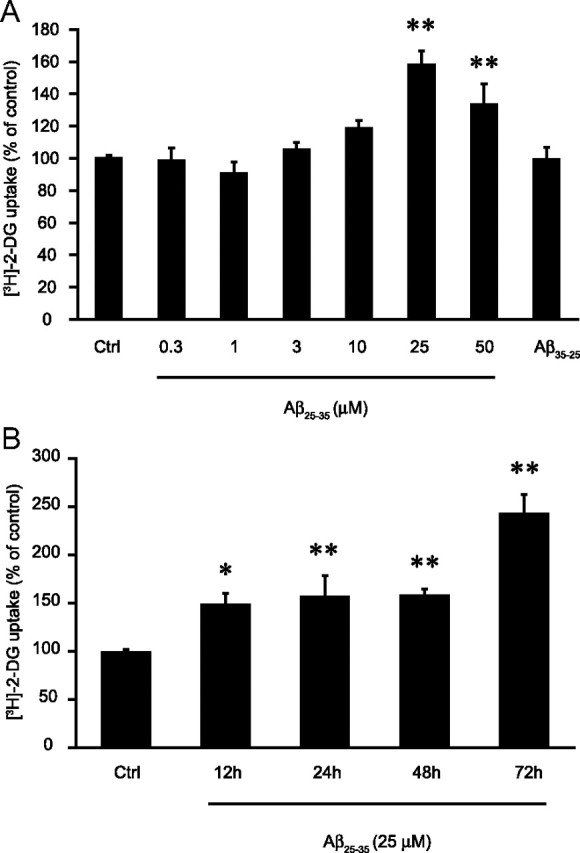
Aβ causes a concentration- and time-dependent increase in glucose utilization. A, Astrocytes were stimulated with Aβ25-35 (0.3, 1, 3, 10, 25, or 50 μm) or Aβ35-25 (25 μm) for 48 h and glucose utilization was determined using the [3H]-2-DG technique. [3H]-2-DG uptake in the control (Ctrl) group was 89.8 ± 12.0 fmol/dish. B, Astrocytes were stimulated with Aβ25-35 (25 μm) for 12, 24, 48, or 72 h and glucose utilization was determined using the [3H]-2-DG technique. [3H]-2-DG uptake in the Ctrl group was 73.8 ± 5.6 fmol/dish. Results obtained in A and B are expressed as percentage of Ctrl values and are means of at least eight determinations from three independent experiments. Data were statistically analyzed with ANOVA followed by Dunett's test (**p < 0.01 vs Ctrl; *p < 0.05 vs Ctrl).
The observed increase in cell glucose utilization is coupled to an increase of glucose metabolism in all its main metabolic pathways. Indeed, Aβ25-35 increases lactate release and glycogen storage by 24.6 ± 6.5 and 27.8 ± 7.9%, respectively (Fig. 2A,B), while Aβ35-25 was without effect on these metabolic parameters (data not shown).
Figure 2.
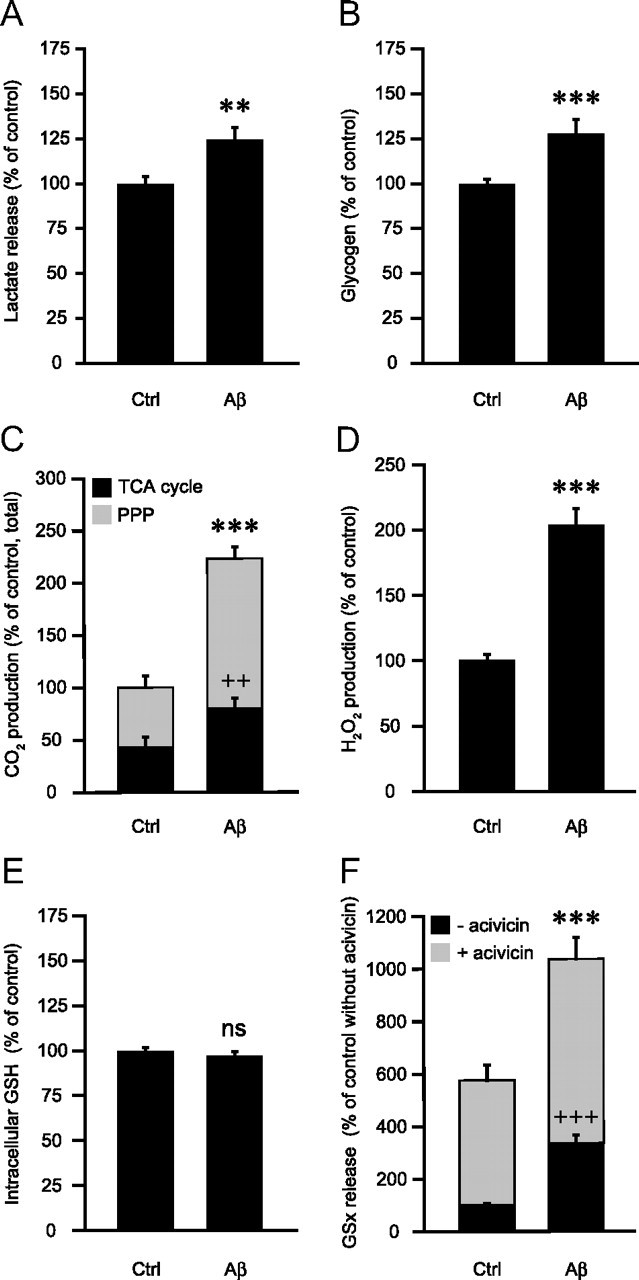
Effects of Aβ on astrocyte metabolism. A–F, Astrocytes were stimulated with 25 μm Aβ25-35 for 48 h and the following metabolic parameters were evaluated: A, Lactate release. Results are expressed as percentage of control (Ctrl) values (140.1 ± 15.2 nmol/dish) and are means ± SEM of at least 23 determinations from at least eight independent experiments. B, Glycogen levels. Results are expressed as percentage of Ctrl values (35.9 ± 2.2 nmol/ dish) and are means ± SEM of at least 12 determinations from at least four independent experiments. C, CO2 production in the PPP and the TCA cycle. Results are expressed as percentage of Ctrl values for the total production of CO2 (0.0302 ± 0.0075 nmol of CO2 per dish per min) and are means ± SEM of at least six determinations from at least three independent experiments. D, Hydrogen peroxide production. Results are expressed as percentage of Ctrl values (0.75 ± 0.08 μm) and are means ± SEM of at least 20 determinations from at least four independent experiments. E, Intracellular glutathione (GSH) content. Results are expressed as percentage of Ctrl values (17.1 ± 1.3 nmol/dish) and are means ± SEM of 12 determinations from four independent experiments. F, Extracellular glutathione (GSx) content. When indicated, the γ-glutamyl-transpeptidase inhibitor acivicin (100 μm) was added 1 h before Aβ25-35 and maintained throughout the whole incubation. Results are expressed as percentage of Ctrl values without acivicin (0.76 ± 0.12 nmol/dish) and are means ± SEM of at least eight determinations from at least three independent experiments. All data were statistically analyzed with t test (** and ++p < 0.01; *** and +++p < 0.001; ns, not significantly different from Ctrl). For C and F, asterisks refer to total CO2 production and acivicin conditions, respectively; cross marks refer to CO2 production in TCA cycle and basal condition (without acivicin), respectively.
Modulation by Aβ of the activities of the TCA cycle and the PPP was determined by measuring CO2 production from 14C-labeled glucose. In basal conditions, astrocytes release 0.0302 ± 0.0075 nmol of CO2/dish/min, 57.1% being produced by PPP activity and the remaining 42.9% through TCA cycle activity (Fig. 2C). As shown in Figure 2C, Aβ25-35 produces an overall increase in glucose oxidation through TCA cycle and PPP, with total CO2 production from glucose being significantly increased to 222.5 ± 10.9% of control values and TCA cycle and PPP activities being increased by 84.7 and 151.0%, respectively.
With regard to the oxidative stress status, we observed that Aβ treatment leads to an increase in reactive oxygen species (ROS) production as shown by the 104% increase in H2O2 production (Fig. 2D). However, 48 h of incubation with Aβ25-35 causes no significant change of intracellular glutathione stores (Fig. 2E), and it was observed that the oxidized form of glutathione, GSSG, is virtually undetectable in the control and amyloid-treated conditions, demonstrating that the amounts of intracellular glutathione represent almost exclusively the reduced form of glutathione, GSH (data not shown). Astrocytes are known to release large amounts of glutathione in the extracellular space where it is metabolized by the ectoenzyme γ-glutamyl transpeptidase (γGT), which gives rise to the production of GSH precursors that can be used by neurons for the synthesis of their own GSH pool (Dringen, 2000). Thus, we next determined the amount of extracellular glutathione released by astrocytes following 48 h of treatment with Aβ25-35 in the presence or absence of acivicin (100 μm), a γGT inhibitor. Acivicin increased the amount of glutathione present in the medium by 5.75-fold, demonstrating an active cleavage of GSH by the ectopeptidase (Fig. 2F). Interestingly, Aβ25-35 treatment increases GSx levels measured in the extracellular space to 332.7 ± 31.0% of control values (Fig. 2F). This increase is also observed in the presence of acivicin but to a lesser extent (1.8-fold increase vs control with acivicin) (Fig. 2F). This result suggests that amyloid treatment effectively increases astrocytic glutathione release in the extracellular space. Nevertheless, since the increase of GSx in the extracellular space is more pronounced in the absence of acivicin, one cannot exclude a partial inhibitory effect of the amyloid peptide on γGT activity, in addition to the stimulation of glutathione release, to fully account for the extracellular increase of GSx levels.
Dependence upon protein synthesis
To determine whether transcriptional events are involved in the metabolic effect of Aβ25-35, we tested the effect of the protein synthesis inhibitor CHX on Aβ25-35-induced glucose utilization. In a first set of experiments, it was established that CHX (10 μm) completely abolished protein synthesis in a 24 h incubation paradigm as assessed by incorporation of [35S]methionine. It does so to a comparable extent in the absence or presence of amyloid-peptide (25 μm) (supplemental Fig. 1A, available at www.jneurosci.org as supplemental material). We observed that the stimulation of astrocyte glucose utilization by Aβ is prevented in the presence of CHX, demonstrating the requirement for the synthesis of specific proteins in this process (supplemental Fig. 1B, available at www.jneurosci.org as supplemental material).
Role of aggregation status
Aβ peptides exert different biological effects based on their aggregation states (Pike et al., 1993; Dahlgren et al., 2002; White et al., 2005; Haass and Selkoe, 2007). To test the role of aggregation, we took advantage of the observation that amyloid peptides are less prone to form fibrillar aggregates in DMSO stock solution, even after further dilution in an aqueous medium (Dahlgren et al., 2002; Stine et al., 2003). For instance, Aβ25-35 at 25 μm concentration in aqueous solution instantly forms typical fibrillar aggregates as assessed by electron microscopy (EM) (Fig. 3A). In contrast, Aβ25-35 first dissolved in DMSO as stock solution and then diluted to 25 μm in deionized water shows mostly monomeric or small oligomeric forms (Fig. 3B).
Figure 3.
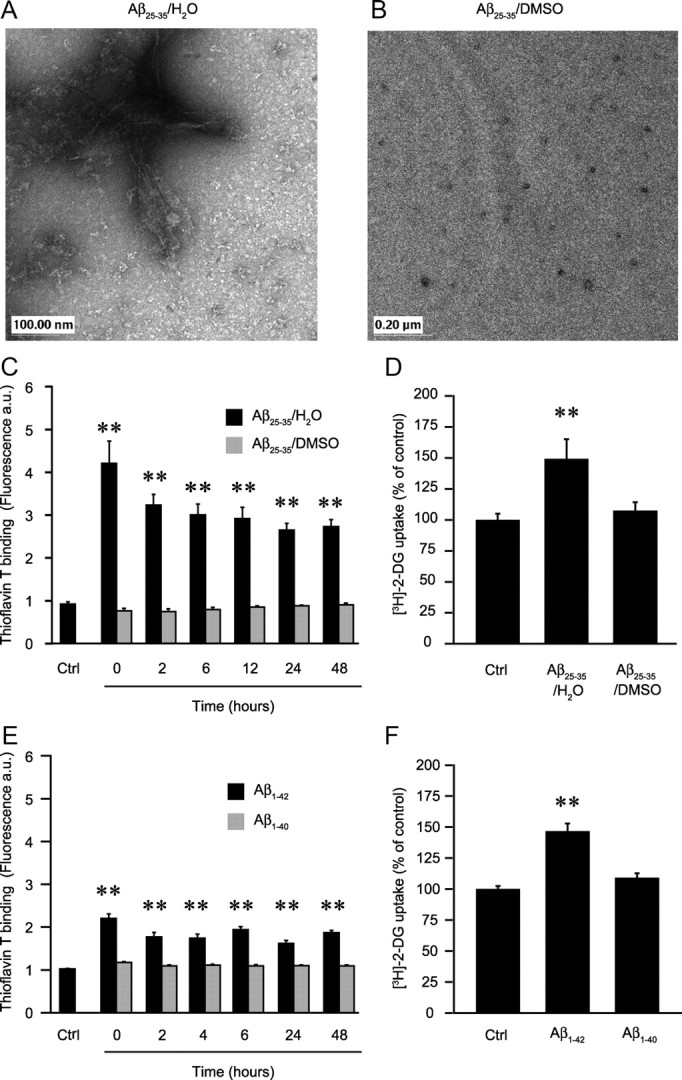
Effect of the aggregation state of amyloid peptides on glucose utilization. A, B, Aggregation state was assessed by EM. Aβ25-35 was first dissolved as stock solution in deionized water (A) or in DMSO (B) and then diluted to a final concentration of 25 μm in deionized water. After 4 h of incubation at 37°C, 5 μl aliquots were processed for EM and observed. Scales are shown in the lower left corner. The pictures exhibited here are representative examples of three independent sets of experiments. C, E, Thioflavin T binding assay. Aβ25-35 was first dissolved in deionized water or DMSO as above (C) and Aβ1-42 or Aβ1-40 peptides were dissolved in deionized water (E). The peptides were then diluted to the final working concentration, 25 μm for Aβ25-35 and 6 μm for Aβ1-42 and Aβ1-40, in the culture medium and incubated in culture conditions for different times. Aliquots of the medium were used to determine amyloid aggregation state using thioflavin T binding assay. A sample of pure culture medium was used as the control (Ctrl). Results are expressed as fluorescence arbitrary units and are means ± SEM of at least nine determinations from at least three independent experiments. D, F, Effect on glucose utilization. Astrocyte cultures were exposed for 48 h to 25 μm Aβ25-35 initially dissolved in deionized water (Aβ25-35/H2O) or DMSO (Aβ25-35/DMSO) (D) or to 6 μm Aβ1-42 or Aβ1-40 initially dissolved in deionized water (F). Glucose utilization was determined using the [3H]-2-DG technique. Results are expressed as percentage of Ctrl values (59.9 ± 4.7 fmol/dish for D and 59.0 ± 5.1 fmol/dish for F) and are means ± SEM of at least seven determinations from three independent experiments. Data obtained in C–F were statistically analyzed with ANOVA followed by Dunett's test (**p < 0.01 vs Ctrl).
These observations were confirmed using the thioflavin T binding assay, which stains β-sheet structure found mostly in amyloid aggregated states (fibrils and protofibrils; fibrillar Aβ) but not in monomeric/small oligomeric structures (nonfibrillar Aβ) (Walsh et al., 1999). Time course determinations indeed show that at 25 μm, Aβ25-35 forms fibrillar aggregates immediately after solubilization in the culture medium as illustrated by in the increase in thioflavin T-associated fluorescence (Fig. 3C). Moreover these aggregates are stable for at least 48 h in culture medium under the cell culture conditions used in the present study. In agreement with EM imaging, DMSO-solubilized Aβ25-35 does not form amyloid aggregates in the same conditions even after 48 h incubation (Fig. 3C). It was also observed that the reverse peptide Aβ35-25, used as a negative control, did not produce any observable aggregate states by EM or by thioflavin T assay experiments, even after 48 h of incubation (data not shown).
When comparing the two types of Aβ25-35 preparations (aqueous or DMSO stock solutions), we observed that Aβ25-35 in the aggregated state caused an increase in glucose utilization (149.2 ± 16.0% of control) whereas the nonfibrillar species are not effective (106.9 ± 6.8 of control), demonstrating that aggregation is an important process to account for the metabolic effect of Aβ (Fig. 3D).
We then explored the metabolic effects of the naturally occurring human amyloid isoforms Aβ1-40 and Aβ1-42. Aβ1-42 was tested at a concentration of 6 μm, which is equivalent in terms of protein weight to the quantity added with 25 μm Aβ25-35. Since both species are known to possess different aggregation properties, we first assessed their aggregation states in our culture conditions using the thioflavin T binding assay as described above (Snyder et al., 1994; Dahlgren et al., 2002; Stine Jr. et al., 2003). As shown in Figure 3E, Aβ1-42 readily forms stable fibrillar aggregates whereas Aβ1-40 does not. Aβ1-42 causes a significant increase in glucose utilization to a similar extent as that observed for Aβ25-35 (146.6 ± 6.2% of control values, Fig. 3F). In contrast, the Aβ1-40 does not stimulate [3H]-2-DG uptake in astrocytes (109.1 ± 3.7% of control, Fig. 3F), demonstrating an isoform specificity of amyloid effect on glucose utilization that is in accordance with its aggregation status. In addition to its effect on glucose utilization, Aβ1-42 also causes, similarly as Aβ25-35, a significant increase in glycogen levels (54%), glutathione release (30%), and hydrogen peroxide production (60%), whereas Aβ1-40 was without any effect on these parameters (supplemental Fig. 2, available at www.jneurosci.org as supplemental material).
Aβ internalization is correlated to its biological effects
Astrocytes can bind and internalize Aβ in vitro and in vivo and in particular in its aggregated forms (Nagele et al., 2003; Wyss-Coray et al., 2003; Alarcon et al., 2005). A first piece of evidence implicating this phenomenon in Aβ effects comes from the observation that Aβ25-35 increases cell protein content in astrocytes, as measured by the BCA assay (see below). For instance, following 48 h of stimulation with 25 μm Aβ25-35, the protein content per dish increases by 51.0 ± 5.0 μg, which correlates with the absolute quantity of peptide added (representing 62.5 μg per cell culture dish) (Fig. 4A). Moreover, we observed that the effect (or lack thereof) of the various Aβ species tested on glucose utilization (Figs. 1A, 3D,F) correlates well with their capacity to increase astrocytic protein content and aggregation propensity. Indeed, Aβ1-42 reproduces the effect of Aβ25-35, both in terms of glucose utilization and protein content, while the control peptide Aβ35-25, Aβ1-40, and Aβ25-35 solubilized in DMSO (all of which have no effects on glucose utilization) did not significantly increase the protein content per dish (Fig. 4A). These observations not only suggest that amyloid activity depends on its internalization but also that when active, internalized amyloid peptides are not degraded for up to 48 h. Nevertheless, to exclude the possibility that this increase in protein content could be the consequence of an increase in the number of cells and/or a global and massive increase in protein synthesis, additional experiments were performed. As a first control, we determined the number of cells per dish following cell dissociation by trypsinization. Results obtained demonstrate that Aβ25-35 treatment at 25 μm for 48 h does not significantly alter cell number [100 ± 8.4% (control) and 93.5 ± 3.4% (Aβ25-35) of control values (409166 ± 51773 cells/dish); mean ± SEM; at least seven determinations from three independent experiments]. In the same conditions, manual cell counting of GFAP-positive cells following immunohistochemistry was also performed with no difference being observed between the two conditions (data not shown). Both methods demonstrate that there is no significant change in cell number after Aβ25-35 exposure in the experimental conditions used in this study and that the increase in protein amount therefore cannot be attributed to an increase in cell number.
Figure 4.
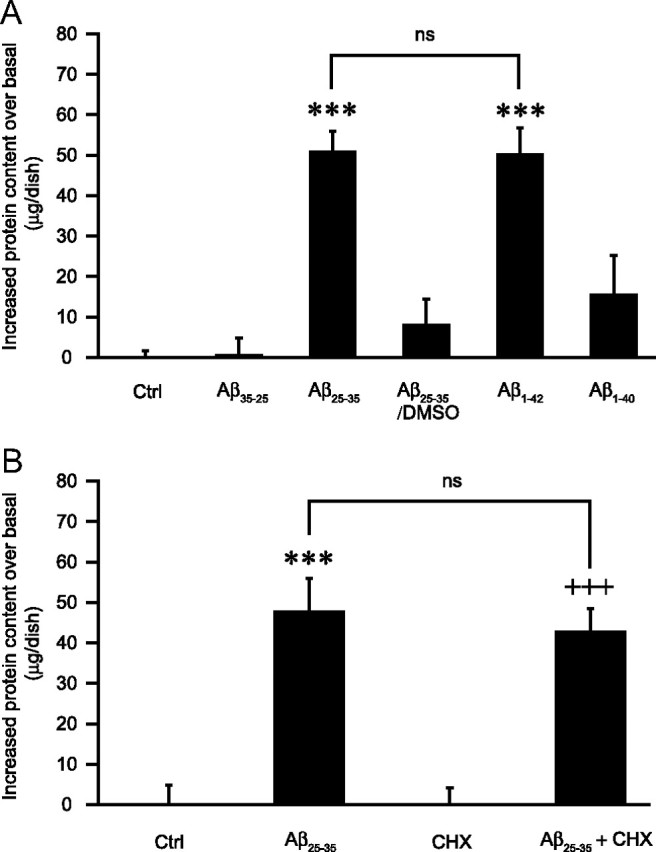
Effects of Aβ peptides on the cellular protein content. A, Isoform specificity. Astrocyte cultures were exposed to Aβ35-25 (25 μm), Aβ25-35 (25 μm), Aβ1-40 (6 μm), Aβ1-42 (6 μm) (stock solutions in water), or Aβ25-35 (25 μm) (stock solution in DMSO) (Aβ25-35/DMSO) for 48 h and cell protein content was determined using the BCA assay. Results are expressed as the difference in micrograms from the mean protein content of control (Ctrl) values and are means ± SEM of at least seven determinations from three independent experiments. Data were statistically analyzed with ANOVA followed by Bonferroni's test (***p < 0.001 vs Ctrl; ns, not significantly different from Aβ25-35; p < 0.001 for Aβ25-35 vs Aβ25-35/DMSO and for Aβ1-42 vs Aβ1-40). The mean protein content in the Ctrl condition was 200.4 ± 12.6 μg/dish. B, Independency of de novo protein synthesis. Astrocyte cell cultures were exposed to Aβ25-35 (25 μm) in presence or absence of CHX (10 μm) for 24 h. When indicated, CHX was added 1 h before amyloid peptide and maintained throughout the entire incubation. Cell protein content was then determined using the BCA assay. Results are expressed as the difference in micrograms from the mean protein content of the respective basal conditions (Ctrl or CHX) and are means ± SEM of at least eight determinations from three independent experiments. Data were statistically analyzed with ANOVA followed by Bonferroni's test (***p < 0.001 vs Ctrl; +++p < 0.001 vs CHX; ns, not significantly different from Aβ25-35). The mean protein content in basal conditions were: 230.9 ± 27.6 μg/dish (Ctrl) and 196.5 ± 22.0 μg/dish (CHX).
Moreover, [35S]methionine incorporation is not significantly altered by Aβ25-35 treatment (supplemental Fig. 1A, available at www.jneurosci.org as supplemental material), indicating that the increase in protein content cannot be attributed to de novo protein synthesis. It was additionally observed that the increase in protein content in amyloid-treated astrocytes in the presence or absence of CHX is equivalent following a 24 h period incubation (Fig. 4B) in conditions in which protein synthesis was shown to be almost completely abolished by CHX (supplemental Fig. 1A, available at www.jneurosci.org as supplemental material). Thus, while the synthesis of selected proteins involved in energy metabolism is induced by Aβ, the considerable increase in protein content in the presence of Aβ is not due to a massive and global synthesis of new proteins but rather to the internalization of Aβ.
Finally, the demonstration that astrocytes internalize the amyloid peptide was obtained by confocal imaging using FITC-labeled Aβ1-42. As shown in Figure 5A, the amyloid peptide (green dots) was clearly shown to be present inside the cellular compartment identified by a cellular membrane dye shown in red (DiD) following a 2 h incubation period. Our results clearly demonstrate that amyloid-treated astrocytes contain significantly more proteins than respective control cells and that this is neither attributable to an increase in cell proliferation nor to an increase in cell protein synthesis, but to the internalization of Aβ.
Figure 5.

Inhibition of Aβ internalization by the SR-A receptor agonist poly(I). A–D, Astrocyte cultures were exposed to 6 μm FITC-labeled Aβ1-42 for 2 h (A, B, C) or to 25 μm Aβ25-35 for 24 h (D), in the presence or absence of 500 μg/ml poly(I) or poly(C). When indicated, poly(I) and poly(C) were added 1 h before amyloid peptide and maintained during the entire incubation period. A, Internalization of FITC-Aβ1-42 in green demonstrated by confocal microscopy using DiD for cell-membrane-labeling (here in red). B, C, Poly(I) completely inhibited FITC-Aβ1-42 internalization (B), whereas poly(C) was without effect (C). At the bottom and the right of pictures (A, B, C), in an orthogonal view, are cross sections of the x and y axes to the z axis, demonstrating that green dots are inside cells (cell membrane in red). Scales are shown in the lower left corner of the pictures (5 μm for A; 10 μm for B and C). D, Inhibition of protein accumulation. Cell protein content was determined using the BCA assay. Results are expressed as difference in micrograms from the mean protein content of the respective basal conditions [control (Ctrl), poly(I) and poly(C)] and are means ± SEM of at least eight determinations from three independent experiments. Data were statistically analyzed with ANOVA followed by Bonferroni's test [***p < 0.001 vs respective basal conditions, Ctrl and poly(C); *p < 0.05 vs poly(I); +p < 0.05 vs Aβ25-35; ns, not significantly different from Aβ25-35]. In this set of experiments the mean protein content in basal conditions were as follows: 109.0 ± 7.7 μg/dish (Ctrl), 81.7 ± 5.4 μg/dish [poly(I)], and 85.0 ± 11.7 μg/dish [poly(C)].
Implication of scavenger receptors for the internalization of Aβ
Previous studies have described a particular role of receptor-mediated endocytosis through the type A scavenger receptors family (SR-A) in the clearance of amyloid aggregates by astrocytes (Wyss-Coray et al., 2003; Alarcon et al., 2005). The scavenger receptor type A family is composed of five different functional receptors: SR-AI, SR-AII, MARCO, SCARA5, and SRCL (Pluddemann et al., 2007). Using quantitative reverse transcription PCR, we confirmed that SR-AI/II, MARCO, and SRCL are expressed in our cultured astrocytes (data not shown). To determine whether this class of receptors is involved in the effects of Aβ, we tested the impact of polyinosinic acid, poly(I), a widely used synthetic ligand of SR-A (Husemann et al., 2002; Alarcon et al., 2005), on the amyloid-induced change in protein content in astrocytes. Figure 5D shows that in the presence of poly(I), the increase in cellular protein content induced by Aβ25-35 after 24 h of incubation is significantly reduced (by 48%), suggesting that poly(I) acts as a competitive inhibitor of amyloid peptides on SR-A receptors. Similar results were obtained with fucoidan, another ligand of the SR-A family (data not shown). In contrast, polycytidylic acid, poly(C), the inactive counterpart of poly(I), did not show any effect (Fig. 5D). The implication of SR-A receptors was further confirmed using confocal microscopy by the observation that Aβ1-42 peptide internalization is prevented by poly(I) but not by poly(C) (Figs. 5B,C). While the internalization of Aβ was completely blocked by poly(I) at 2 h as assessed by confocal microscopy (Fig. 5B), the increase in protein content was only partially inhibited after 24 h (Fig. 5D). This discrepancy may be explained by a decrease in poly(I) availability and/or increased degradation over time.
Intracellular signaling mediating the effects of Aβ
The scavenger receptor family, including SR-A receptors, is linked to several downstream signaling cascades including the p38 and p42/44 mitogen-activated protein kinases (MAP kinases) as well as the phosphoinositide 3-kinase (PI3-kinase) pathways (Hsu et al., 2001; Murphy et al., 2005). To determine whether activation of these pathways could be related to the effect of Aβ on glucose utilization, we used the following inhibitors of these signaling cascades: U0126 (for p42/44-MAP kinase, 20 μm), SB202190 (for p38-MAP kinase, 20 μm), and LY294002 (for PI3-kinase, 10 μm). None of these inhibitors significantly affects basal glucose utilization in astrocytes following a 24 h period of incubation (Fig. 6). However, in the presence of Aβ25-35, it was observed that the stimulating effect on glucose utilization was abolished by LY294002 (Fig. 6) and by another structurally unrelated inhibitor of PI3-kinase, wortmannin (data not shown). In contrast U0126 and SB202190 were without effect.
Figure 6.

Signaling cascades involved in the stimulation of glucose utilization by Aβ. Astrocytes were stimulated with 25 μm Aβ25-35 for 24 h and glucose utilization was determined using the [3H]-2-DG technique. When indicated, U0126 (20 μm), SB202190 (20 μm), and LY294002 (10 μm), inhibitors of the p42/44 MAP kinase, p38 MAP kinase and the PI3-kinase cascades, respectively, were added 30 min before Aβ25-35 and maintained throughout the whole incubation. Results are expressed as percentage of control (Ctrl) values (60.9 ± 5.7 fmol/dish) and are means ± SEM of at least eight determinations from three independent experiments. Data were statistically analyzed with ANOVA followed by Bonferroni's test (***p < 0.001 vs respective basal conditions, Ctrl, U0126, and SB202190; ns, not significantly different from LY294002; U0126, SB202190, and LY294002, not significantly different from Ctrl).
Impact on neuronal viability
Considering the numerous interactions between neurons and astrocytes (Dringen, 2000; Bak et al., 2006; Magistretti, 2006; Barres, 2008), the profound changes in the astrocytic metabolic phenotype observed in response to amyloid peptides could potentially result either in neuroprotection (e.g., via GSH or lactate release) or neurotoxicity (e.g., ROS production) (Schurr et al., 1988, 2006; Ben Yoseph et al., 1996; Izumi et al., 1997; Dringen et al., 1999; Dringen, 2000; Ros et al., 2001).
We thus investigated the impact of the overall change in astrocytic metabolism induced by Aβ on neuronal viability. To this end we used a laminar coculture model in which neurons seeded on glass coverslips lay on a monolayer of astrocytes. Astrocytes were pretreated with different amyloid peptide preparations for 24 h. After changing the culture medium (to remove Aβ peptides), neurons were cocultured for another 24 h period after which cell viability was assessed using the MTT assay. As shown in Figure 7A, in the presence of astrocytes pre-exposed to either Aβ25-35 or Aβ1-42, neuronal viability was significantly decreased (by 17.9 and 25.7% compared to control values, respectively). In contrast, astrocytes pre-exposed to either Aβ1-40 or Aβ1-42 first dissolved in DMSO did not affect neuronal viability (Fig. 7A). Interestingly, these results reproduce the pattern observed for the effect of these amyloid peptide preparations on glucose metabolism (Figs. 3D,F) and amyloid internalization (Fig. 4A), arguing for a correlation between these events. Similar results on neuronal viability were also obtained with a distinct cell viability test, the calcein-AM assay (supplemental Fig. 3, available at www.jneurosci.org as supplemental material). Astrocyte-mediated Aβ toxicity is further supported by the observation that neurotoxicity is exacerbated when neurons are directly exposed to Aβ in the presence of astrocytes (cocultures) compared with neurons in primary cultures (supplemental Fig. 4, available at www.jneurosci.org as supplemental material).
Figure 7.
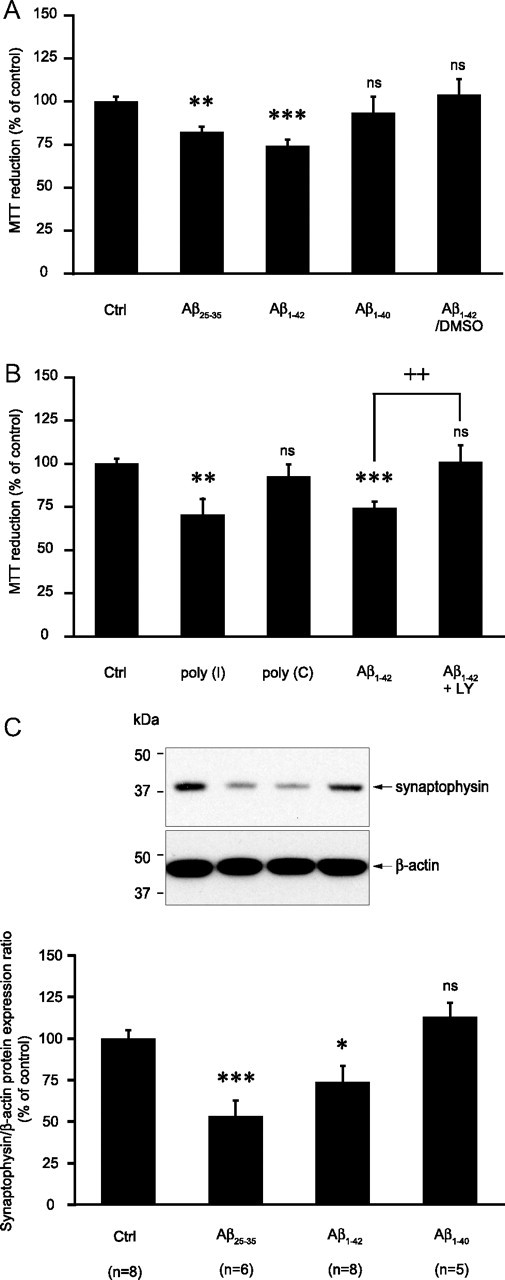
Impact of amyloid peptide treatment in astrocytes on neuronal viability in coculture. A–C, Astrocytes were stimulated with Aβ25-35 (25 μm), Aβ1-40 (10 μm), Aβ1-42 (10 μm), poly(I) (500 μg/ml), or poly(C) (500 μg/ml) (stock solutions in water) or with Aβ1-42 (10 μm) (stock solution in DMSO) (Aβ1-42/DMSO) for 24 h. Cells were then rinsed and the coculture was initiated by adding neurons seeded on glass coverslips on top of the astrocytic layer. Twenty-four hours later neuronal viability was determined using the MTT reduction assay (A, B) or neuronal proteins were harvested and synaptophysin expression was assessed by Western blotting (C). A, Isoform and structure dependency. Results are expressed as percentage of control (Ctrl) values and are means ± SEM of at least eight determinations from three independent experiments. B, Implication of SR-A receptors and the PI3-kinase cascade. When indicated, 10 μm LY294002 (LY) was added 1 h before and maintained throughout the whole incubation with Aβ1-42. Results are expressed as percentage of Ctrl values and are means ± SEM of at least 11 determinations from four independent experiments. C, Impact of amyloid peptides pretreatment in astrocytes on neuronal synaptophysin expression in cocultures. Representative Western blot bands are shown. Optical density measurements were used for quantification and values for synaptophysin were normalized using the corresponding β-actin value for each lane. Results are expressed as percentage of Ctrl values and are means ± SEM of at least five determinations from at least three independent experiments. Data obtained in A–C were statistically analyzed with ANOVA followed by Bonferroni's test (***p < 0.001 vs Ctrl; **p < 0.01 vs Ctrl; *p < 0.05 vs Ctrl; ++p < 0.01 vs Aβ1-42; ns, not significantly different from Ctrl).
In addition, it was observed that in the same conditions pre-exposure of astrocytes to the agonist of the type A scavenger receptors, poly(I), mimicked the effects of Aβ25-35 and Aβ1-42 on neuronal viability (−29.5% compared to control values) whereas its inactive counterpart, poly(C), was without effect (Fig. 7B). Finally, the decrease of neuronal viability induced by pre-exposure of astrocytes to Aβ1-42 is abolished by the PI-3kinase inhibitor LY294002 (Fig. 7B), pointing to a pivotal role of type A scavenger receptors and the PI-3kinase signaling cascade in meditating the deleterious effect of amyloid peptide-treated astrocytes on neuronal viability.
Interestingly, PI3-kinase is known to be a key downstream signaling cascade mediating the effect of insulin in peripheral tissues and in particular those related to glucose metabolism (Saltiel and Kahn, 2001). In line with this, its implication in the control of glucose utilization and glycogen storage has also been demonstrated in astrocytes (Hamai et al., 1999; Vega et al., 2002; Gavillet et al., 2008). This suggests a direct correlation between activation of PI3-kinase and changes of glucose metabolism observed following Aβ treatment. The observed increase in ROS production and the regulation of oxidative stress defense mechanisms with regard to glutathione metabolism may thus be downstream events following increase of glucose oxidation. Alternatively, PI3-kinase activation may also directly lead to an increase in ROS formation (Gao et al., 2004) or to the activation of defense mechanisms against oxidative stress (Bahia et al., 2008).
Finally, we evaluated the possible impact of pre-exposure of astrocytes to Aβ on neuronal functionality by using the protein expression level of synaptophysin, a presynaptic vesicular protein routinely used as a marker of synaptic function (Valtorta et al., 2004). Synaptophysin expression was assessed in neurons following 24 h of coculture with astrocytes that had been pretreated with different Aβ species for 24 h and rinsed. As shown in Figure 7C, in these conditions synaptophysin expression is strongly decreased by Aβ25-35 (−47%) and Aβ1-42 (−27%), whereas Aβ1-40 is without effect.
Discussion
In the present report, we demonstrate that aggregated forms of Aβ strongly modify glucose metabolism and oxidative stress status in astrocytes and that these effects are mediated through their binding to scavenger receptors of the class A family and the PI-3 kinase pathway. Moreover, we provide evidence that these modifications have functional consequences for neighboring neurons, since Aβ-treated astrocytes impaired neuronal viability in a coculture model.
Previous studies evaluating the impact of Aβ on glucose metabolism in cultured neural cells have reported conflicting results (Mark et al., 1997; Parpura-Gill et al., 1997; Patel and Brewer, 2003; Soucek et al., 2003). Here, we report a detailed characterization of the effects of Aβ on glucose metabolism, demonstrating that Aβ25-35—but not the control peptide Aβ35-25—significantly increases astrocyte glucose utilization coupled to an increase in all the main glucose metabolic pathways: glycolysis and lactate release, TCA cycle, PPP, and storage as glycogen. These results contrast with reports showing that Aβ decreases glucose utilization in astrocytes (Parpura-Gill et al., 1997; Soucek et al., 2003; Schubert et al., 2009). Reasons for such discrepancies are unknown but may arise from different stimulation paradigms, notably a rigorous determination of aggregation states of Aβ.
Besides Aβ aggregation, oxidative stress is another hallmark of AD that has been linked to Aβ toxicity (Behl et al., 1994; Miranda et al., 2000; Canevari et al., 2004). Astrocytes have been proposed to take part in this process, since Aβ stimulates ROS production and decreases glutathione levels in these cells (Abramov et al., 2004; Canevari et al., 2004). Indeed, oxidative stress occurs as a consequence of a disequilibrium between the production of ROS and antioxidant processes. PPP represents a direct link between energy metabolism and oxidative stress protection, since it is the main metabolic pathway recycling the reducing cofactor NADPH, which is involved—in a coordinated manner with GSH—in the most important cellular ROS detoxifying pathway in the brain (Dringen, 2000). These observations suggest that Aβ-induced changes in glucose metabolism and the associated increase in PPP activity may be related to an increase in oxidative stress in astrocytes. Interestingly, a similar Aβ-induced upregulation of PPP, but without a concomitant increase in glucose utilization, has previously been observed in cultured astrocytes (Soucek et al., 2003). In agreement with this, we observed an increase in H2O2 production following Aβ treatment. Nevertheless, astrocytes do not show signs of overt oxidative stress in our conditions, since neither an increase in the intracellular oxidized form of GSH, a change in the total intracellular GSH content, nor a loss of cellular viability could be observed. In contrast, these observations argue in favor of a cellular response mounted against pro-oxidative stimuli to provide sufficient NADPH-reducing equivalents (Ben Yoseph et al., 1994; Rahman et al., 2000). Interestingly, we have recently described a similar mechanism following proinflammatory cytokines treatment of astrocytes (Gavillet et al., 2008).
Aβ toxicity has been initially attributed to its aggregation state (Pike et al., 1995; Hardy and Selkoe, 2002). However, evidence also shows that soluble oligomers may exert neurotoxic effects (Dahlgren et al., 2002; Haass and Selkoe, 2007). Our results clearly demonstrate that aggregation of Aβ is necessary to promote its effect on glucose metabolism in astrocytes (Fig. 3).
Astrocytes, along with microglia, are involved in the clearance of Aβ from the extracellular space. These cells have the capacity to internalize and degrade Aβ peptides and thus may exert a protective mechanism by preventing accumulation of extracellular Aβ (Rogers et al., 2002; Wyss-Coray et al., 2003; Pihlaja et al., 2007). Compared to shorter forms of the peptide such as Aβ1-40, Aβ1-42 is particularly resistant to degradation as exemplified by the observation that intracellular deposits of Aβ1-42 are stable for at least 3 d in cell cultures (Burdick et al., 1997; Chung et al., 1999). In line with this, accumulation of Aβ1-42-positive material in astrocytes can be observed in vivo in AD brains (Akiyama et al., 1999; Nagele et al., 2004). Our results demonstrating the internalization of Aβ1-42 and associated increase in cellular protein content are in good agreement with these observations. Moreover, they show that similarly as Aβ1-42, Aβ25-35 accumulates in astrocytes and is not degraded for up to 48 h in our cell culture preparation.
Aβ1-42 internalization in glial cells is mediated through the binding of a variety of cell surface receptors (LaDu et al., 2000; Husemann et al., 2002; Verdier et al., 2004), several of which are expressed by astrocytes (Koistinaho et al., 2004; Alarcon et al., 2005; Nakamura et al., 2006). Among them, SR-A type receptors appear to play a central role in the clearance of amyloid aggregates by astrocytes (Wyss-Coray et al., 2003; Alarcon et al., 2005). Scavenger receptors are integral membrane proteins that bind a wide variety of ligands, including modified or oxidized low-density lipoproteins, apoptotic cells, pathogens, and fibrillar Aβ (Murphy et al., 2005; Pluddemann et al., 2007). Our results using the SR-A agonists poly(I) and fucoidan clearly identify this class of receptor as the mediator of the internalization and accumulation of Aβ (Aβ25-35 and Aβ1-42) (Wyss-Coray et al., 2003; Alarcon et al., 2005).
In agreement with the role of SR-A in host defense against pathogens, ligand binding to SR-A engages a wide range of cellular responses, including cytokine secretion and ROS production (El Khoury et al., 1996; Murphy et al., 2005)—the latter observation being consistent with the increased production of H2O2 observed in this study. This raises the question of the impact of the Aβ-induced metabolic changes observed in astrocytes on neuronal viability. Using an astrocyte-neuron coculture model in which astrocytes are pretreated with Aβ and are not in direct contact with neurons (thus avoiding any direct exposure of neurons to Aβ), we demonstrate that treatment of astrocytes with fibrillar forms of Aβ (either Aβ1-42 or Aβ25-35) significantly impairs neuronal viability and functionality (as assessed by synaptophysin expression). Moreover, we provide evidence that activation of the SR-A receptors by poly(I) is sufficient per se to reproduce the deleterious effects of Aβ, demonstrating the crucial role played by SR-A activation in these processes. This view is further strengthened by our observation that both Aβ-induced increase in glucose utilization and the deleterious effects on neuronal survival are prevented by pharmacological inhibition of the PI3-kinase pathway, one of the downstream signaling cascades of the SR-A receptor family (Hsu et al., 2001; Murphy et al., 2005), suggesting a direct correlation between SR-receptor activation, PI3-kinase activation, phenotypic metabolic changes, and neurotoxicity.
Hypometabolism of glucose in specific brain regions has been shown to be a hallmark of AD, appearing as early as preclinical stages (Mosconi et al., 2008). How can these observations be reconciled with our data showing increased astrocytic glucose metabolism? A current explanation for the decrease of glucose metabolism in AD is that glucose utilization by neural cells in the affected brain areas is impaired (Blass, 2001; Gibson, 2002), as supported by observations of deficient activity of some enzymes involved in energy metabolism in AD brain extracts (Rapoport, 1999; Blass et al., 2000; Liang et al., 2008). In contrast, other reports have described an increase in the activity of enzymes linked to glucose metabolism (Bigl et al., 1999; Soucek et al., 2003). If these observations appear antagonistic, it is of interest to note that these changes generally appear to affect distinct glucose metabolic pathways: decreased enzymatic activities consistently involve enzymes related to mitochondrial activity, whereas increases in enzymatic activities are more related to glycolysis and the PPP. A possible way to reconcile these apparent discrepancies is to interpret them either as compensatory mechanisms taking place in the same cellular compartment or as opposite regulation of glucose metabolism in different cell types (e.g., neurons and astrocytes) differentially contributing to the overall hypometabolism observed in AD. In support of the latter hypothesis, an increase in phosphofructokinase activity in brains of patients with AD, correlating with the severity of the disease, has been attributed to the astroglial compartment (Bigl et al., 1996, 1999). Interestingly, the same authors, using an animal model of AD, demonstrated an upregulation of phosphofructokinase expression in astrocytes surrounding Aβ deposits while plaque-associated neurons had decreased phosphofructokinase expression (Bigl et al., 2003), suggesting that two opposite metabolic processes may occur in AD brains: a reduction of neuronal glucose metabolism and an increase of astroglial metabolism.
As a whole, the present report demonstrates that in astrocytes, the process of Aβ aggregation and fibrillogenesis initiates a deleterious cascade of events through its internalization and modulation of astrocyte metabolism, which impacts neuronal viability and functionality. Interestingly, the amount of Aβ1-42-positive material accumulated in astrocytes in AD brain appears both spatially and temporally correlated to the extent of local AD pathology (Nagele et al., 2003, 2004). Our observations place astrocytes as a target of Aβ action, and support the notion that Aβ-astrocyte interaction adversely affects neurons and may contribute to neuronal cell damage observed in AD.
Footnotes
This work was supported by a grant from the Swiss National Science Foundation (FNRS) to P.J.M. (3100AO-108336/1). M.G. was supported by a FNRS M.D.-Ph.D. fellowship (3235-68′931). M.B. was supported by the Fonds de la Recherche en Santé du Québec. We express our gratitude to Dr. Patrick Fraering for helpful discussions and to Maude Marti Favre, Joël Gyger, Henri Magistretti, and Cendrine Barrière for expert technical assistance.
References
- Abramov AY, Canevari L, Duchen MR. β-Amyloid peptides induce mitochondrial dysfunction and oxidative stress in astrocytes and death of neurons through activation of NADPH oxidase. J Neurosci. 2004;24:565–575. doi: 10.1523/JNEUROSCI.4042-03.2004. [DOI] [PMC free article] [PubMed] [Google Scholar]
- Akiyama H, Mori H, Saido T, Kondo H, Ikeda K, McGeer PL. Occurrence of the diffuse amyloid beta-protein (Abeta) deposits with numerous Abeta-containing glial cells in the cerebral cortex of patients with Alzheimer's disease. Glia. 1999;25:324–331. doi: 10.1002/(sici)1098-1136(19990215)25:4<324::aid-glia2>3.0.co;2-5. [DOI] [PubMed] [Google Scholar]
- Alarcon R, Fuenzalida C, Santibanez M, von Bernhardi R. Expression of scavenger receptors in glial cells: comparing the adhesion of astrocytes and microglia from neonatal rats to surface-bound beta-amyloid. J Biol Chem. 2005;280:30406–30415. doi: 10.1074/jbc.M414686200. [DOI] [PubMed] [Google Scholar]
- Allaman I, Pellerin L, Magistretti PJ. Glucocorticoids modulate neurotransmitter-induced glycogen metabolism in cultured cortical astrocytes. J Neurochem. 2004;88:900–908. doi: 10.1046/j.1471-4159.2003.02235.x. [DOI] [PubMed] [Google Scholar]
- Bahia PK, Rattray M, Williams RJ. Dietary flavonoid (-)epicatechin stimulates phosphatidylinositol 3-kinase-dependent anti-oxidant response element activity and up-regulates glutathione in cortical astrocytes. J Neurochem. 2008;106:2194–2204. doi: 10.1111/j.1471-4159.2008.05542.x. [DOI] [PubMed] [Google Scholar]
- Bak LK, Schousboe A, Waagepetersen HS. The glutamate/GABA-glutamine cycle: aspects of transport, neurotransmitter homeostasis and ammonia transfer. J Neurochem. 2006;98:641–653. doi: 10.1111/j.1471-4159.2006.03913.x. [DOI] [PubMed] [Google Scholar]
- Barres BA. The mystery and magic of glia: a perspective on their roles in health and disease. Neuron. 2008;60:430–440. doi: 10.1016/j.neuron.2008.10.013. [DOI] [PubMed] [Google Scholar]
- Behl C, Davis JB, Lesley R, Schubert D. Hydrogen peroxide mediates amyloid beta protein toxicity. Cell. 1994;77:817–827. doi: 10.1016/0092-8674(94)90131-7. [DOI] [PubMed] [Google Scholar]
- Belanger M, Magistretti PJ. The role of astroglia in neuroprotection. Dialogues Clin Neurosci. 2009;11:281–295. doi: 10.31887/DCNS.2009.11.3/mbelanger. [DOI] [PMC free article] [PubMed] [Google Scholar]
- Ben Yoseph O, Boxer PA, Ross BD. Oxidative stress in the central nervous system: monitoring the metabolic response using the pentose phosphate pathway. Dev Neurosci. 1994;16:328–336. doi: 10.1159/000112127. [DOI] [PubMed] [Google Scholar]
- Ben Yoseph O, Boxer PA, Ross BD. Assessment of the role of the glutathione and pentose phosphate pathways in the protection of primary cerebrocortical cultures from oxidative stress. J Neurochem. 1996;66:2329–2337. doi: 10.1046/j.1471-4159.1996.66062329.x. [DOI] [PubMed] [Google Scholar]
- Bigl M, Bleyl AD, Zedlick D, Arendt T, Bigl V, Eschrich K. Changes of activity and isozyme pattern of phosphofructokinase in the brains of patients with Alzheimer's disease. J Neurochem. 1996;67:1164–1171. doi: 10.1046/j.1471-4159.1996.67031164.x. [DOI] [PubMed] [Google Scholar]
- Bigl M, Bruckner MK, Arendt T, Bigl V, Eschrich K. Activities of key glycolytic enzymes in the brains of patients with Alzheimer's disease. J Neural Transm. 1999;106:499–511. doi: 10.1007/s007020050174. [DOI] [PubMed] [Google Scholar]
- Bigl M, Apelt J, Eschrich K, Schliebs R. Cortical glucose metabolism is altered in aged transgenic Tg2576 mice that demonstrate Alzheimer plaque pathology. J Neural Transm. 2003;110:77–94. doi: 10.1007/s00702-002-0772-x. [DOI] [PubMed] [Google Scholar]
- Blass JP. Brain metabolism and brain disease: is metabolic deficiency the proximate cause of Alzheimer dementia? J Neurosci Res. 2001;66:851–856. doi: 10.1002/jnr.10087. [DOI] [PubMed] [Google Scholar]
- Blass JP, Sheu RK, Gibson GE. Inherent abnormalities in energy metabolism in Alzheimer disease: interaction with cerebrovascular compromise. Ann NY Acad Sci. 2000;903:204–221. doi: 10.1111/j.1749-6632.2000.tb06370.x. [DOI] [PubMed] [Google Scholar]
- Burdick D, Kosmoski J, Knauer MF, Glabe CG. Preferential adsorption, internalization and resistance to degradation of the major isoform of the Alzheimer's amyloid peptide, A beta 1-42, in differentiated PC12 cells. Brain Res. 1997;746:275–284. doi: 10.1016/s0006-8993(96)01262-0. [DOI] [PubMed] [Google Scholar]
- Canevari L, Abramov AY, Duchen MR. Toxicity of amyloid beta peptide: tales of calcium, mitochondria, and oxidative stress. Neurochem Res. 2004;29:637–650. doi: 10.1023/b:nere.0000014834.06405.af. [DOI] [PubMed] [Google Scholar]
- Chung H, Brazil MI, Soe TT, Maxfield FR. Uptake, degradation, and release of fibrillar and soluble forms of Alzheimer's amyloid beta-peptide by microglial cells. J Biol Chem. 1999;274:32301–32308. doi: 10.1074/jbc.274.45.32301. [DOI] [PubMed] [Google Scholar]
- Compton SJ, Jones CG. Mechanism of dye response and interference in the Bradford protein assay. Anal Biochem. 1985;151:369–374. doi: 10.1016/0003-2697(85)90190-3. [DOI] [PubMed] [Google Scholar]
- Dahlgren KN, Manelli AM, Stine WB, Jr, Baker LK, Krafft GA, LaDu MJ. Oligomeric and fibrillar species of amyloid-beta peptides differentially affect neuronal viability. J Biol Chem. 2002;277:32046–32053. doi: 10.1074/jbc.M201750200. [DOI] [PubMed] [Google Scholar]
- Dringen R. Metabolism and functions of glutathione in brain. Prog Neurobiol. 2000;62:649–671. doi: 10.1016/s0301-0082(99)00060-x. [DOI] [PubMed] [Google Scholar]
- Dringen R, Kussmaul L, Gutterer JM, Hirrlinger J, Hamprecht B. The glutathione system of peroxide detoxification is less efficient in neurons than in astroglial cells. J Neurochem. 1999;72:2523–2530. doi: 10.1046/j.1471-4159.1999.0722523.x. [DOI] [PubMed] [Google Scholar]
- El Khoury J, Hickman SE, Thomas CA, Cao L, Silverstein SC, Loike JD. Scavenger receptor-mediated adhesion of microglia to beta-amyloid fibrils. Nature. 1996;382:716–719. doi: 10.1038/382716a0. [DOI] [PubMed] [Google Scholar]
- Frozza RL, Horn AP, Hoppe JB, Simao F, Gerhardt D, Comiran RA, Salbego CG. A comparative study of beta-amyloid peptides Abeta1-42 and Abeta25-35 toxicity in organotypic hippocampal slice cultures. Neurochem Res. 2009;34:295–303. doi: 10.1007/s11064-008-9776-8. [DOI] [PubMed] [Google Scholar]
- Gao N, Shen L, Zhang Z, Leonard SS, He H, Zhang XG, Shi X, Jiang BH. Arsenite induces HIF-1alpha and VEGF through PI3K, Akt and reactive oxygen species in DU145 human prostate carcinoma cells. Mol Cell Biochem. 2004;255:33–45. doi: 10.1023/b:mcbi.0000007259.65742.16. [DOI] [PubMed] [Google Scholar]
- Gavillet M, Allaman I, Magistretti PJ. Modulation of astrocytic metabolic phenotype by proinflammatory cytokines. Glia. 2008;56:975–989. doi: 10.1002/glia.20671. [DOI] [PubMed] [Google Scholar]
- Gibson GE. Interactions of oxidative stress with cellular calcium dynamics and glucose metabolism in Alzheimer's disease. Free Radic Biol Med. 2002;32:1061–1070. doi: 10.1016/s0891-5849(02)00802-x. [DOI] [PubMed] [Google Scholar]
- Haass C, Selkoe DJ. Soluble protein oligomers in neurodegeneration: lessons from the Alzheimer's amyloid beta-peptide. Nat Rev Mol Cell Biol. 2007;8:101–112. doi: 10.1038/nrm2101. [DOI] [PubMed] [Google Scholar]
- Hamai M, Minokoshi Y, Shimazu T. L-Glutamate and insulin enhance glycogen synthesis in cultured astrocytes from the rat brain through different intracellular mechanisms. J Neurochem. 1999;73:400–407. doi: 10.1046/j.1471-4159.1999.0730400.x. [DOI] [PubMed] [Google Scholar]
- Hardy J, Selkoe DJ. The amyloid hypothesis of Alzheimer's disease: progress and problems on the road to therapeutics. Science. 2002;297:353–356. doi: 10.1126/science.1072994. [DOI] [PubMed] [Google Scholar]
- Hsu HY, Chiu SL, Wen MH, Chen KY, Hua KF. Ligands of macrophage scavenger receptor induce cytokine expression via differential modulation of protein kinase signaling pathways. J Biol Chem. 2001;276:28719–28730. doi: 10.1074/jbc.M011117200. [DOI] [PubMed] [Google Scholar]
- Husemann J, Loike JD, Anankov R, Febbraio M, Silverstein SC. Scavenger receptors in neurobiology and neuropathology: their role on microglia and other cells of the nervous system. Glia. 2002;40:195–205. doi: 10.1002/glia.10148. [DOI] [PubMed] [Google Scholar]
- Izumi Y, Benz AM, Katsuki H, Zorumski CF. Endogenous monocarboxylates sustain hippocampal synaptic function and morphological integrity during energy deprivation. J Neurosci. 1997;17:9448–9457. doi: 10.1523/JNEUROSCI.17-24-09448.1997. [DOI] [PMC free article] [PubMed] [Google Scholar]
- Koistinaho M, Lin S, Wu X, Esterman M, Koger D, Hanson J, Higgs R, Liu F, Malkani S, Bales KR, Paul SM. Apolipoprotein E promotes astrocyte colocalization and degradation of deposited amyloid-beta peptides. Nat Med. 2004;10:719–726. doi: 10.1038/nm1058. [DOI] [PubMed] [Google Scholar]
- Kubo T, Nishimura S, Kumagae Y, Kaneko I. In vivo conversion of racemized beta-amyloid ([D-Ser 26]A beta 1-40) to truncated and toxic fragments ([D-Ser 26]A beta 25-35/40) and fragment presence in the brains of Alzheimer's patients. J Neurosci Res. 2002;70:474–483. doi: 10.1002/jnr.10391. [DOI] [PubMed] [Google Scholar]
- Kubo T, Kumagae Y, Miller CA, Kaneko I. Beta-amyloid racemized at the Ser26 residue in the brains of patients with Alzheimer disease: implications in the pathogenesis of Alzheimer disease. J Neuropathol Exp Neurol. 2003;62:248–259. doi: 10.1093/jnen/62.3.248. [DOI] [PubMed] [Google Scholar]
- LaDu MJ, Shah JA, Reardon CA, Getz GS, Bu G, Hu J, Guo L, Van Eldik LJ. Apolipoprotein E receptors mediate the effects of beta-amyloid on astrocyte cultures. J Biol Chem. 2000;275:33974–33980. doi: 10.1074/jbc.M000602200. [DOI] [PubMed] [Google Scholar]
- Liang WS, Reiman EM, Valla J, Dunckley T, Beach TG, Grover A, Niedzielko TL, Schneider LE, Mastroeni D, Caselli R, Kukull W, Morris JC, Hulette CM, Schmechel D, Rogers J, Stephan DA. Alzheimer's disease is associated with reduced expression of energy metabolism genes in posterior cingulate neurons. Proc Natl Acad Sci U S A. 2008;105:4441–4446. doi: 10.1073/pnas.0709259105. [DOI] [PMC free article] [PubMed] [Google Scholar]
- Magistretti PJ. Neuron-glia metabolic coupling and plasticity. J Exp Biol. 2006;209:2304–2311. doi: 10.1242/jeb.02208. [DOI] [PubMed] [Google Scholar]
- Magistretti PJ. Brain energy metabolism. In: Squire LR, Berg D, Bloom FE, du Lac S, Ghosh A, Spitzer NC, editors. Fundamental neuroscience. San Diego: Academic; 2008. pp. 271–293. [Google Scholar]
- Mark RJ, Pang Z, Geddes JW, Uchida K, Mattson MP. Amyloid beta-peptide impairs glucose transport in hippocampal and cortical neurons: involvement of membrane lipid peroxidation. J Neurosci. 1997;17:1046–1054. doi: 10.1523/JNEUROSCI.17-03-01046.1997. [DOI] [PMC free article] [PubMed] [Google Scholar]
- McKhann G, Drachman D, Folstein M, Katzman R, Price D, Stadlan EM. Clinical diagnosis of Alzheimer's disease: report of the NINCDS-ADRDA Work Group under the auspices of Department of Health and Human Services Task Force on Alzheimer's Disease. Neurology. 1984;34:939–944. doi: 10.1212/wnl.34.7.939. [DOI] [PubMed] [Google Scholar]
- Miranda S, Opazo C, Larrondo LF, Munoz FJ, Ruiz F, Leighton F, Inestrosa NC. The role of oxidative stress in the toxicity induced by amyloid beta-peptide in Alzheimer's disease. Prog Neurobiol. 2000;62:633–648. doi: 10.1016/s0301-0082(00)00015-0. [DOI] [PubMed] [Google Scholar]
- Mosconi L, Pupi A, de Leon MJ. Brain glucose hypometabolism and oxidative stress in preclinical Alzheimer's disease. Ann NY Acad Sci. 2008;1147:180–195. doi: 10.1196/annals.1427.007. [DOI] [PMC free article] [PubMed] [Google Scholar]
- Murphy JE, Tedbury PR, Homer-Vanniasinkam S, Walker JH, Ponnambalam S. Biochemistry and cell biology of mammalian scavenger receptors. Atherosclerosis. 2005;182:1–15. doi: 10.1016/j.atherosclerosis.2005.03.036. [DOI] [PubMed] [Google Scholar]
- Nagele RG, D'Andrea MR, Lee H, Venkataraman V, Wang HY. Astrocytes accumulate A beta 42 and give rise to astrocytic amyloid plaques in Alzheimer disease brains. Brain Res. 2003;971:197–209. doi: 10.1016/s0006-8993(03)02361-8. [DOI] [PubMed] [Google Scholar]
- Nagele RG, Wegiel J, Venkataraman V, Imaki H, Wang KC, Wegiel J. Contribution of glial cells to the development of amyloid plaques in Alzheimer's disease. Neurobiol Aging. 2004;25:663–674. doi: 10.1016/j.neurobiolaging.2004.01.007. [DOI] [PubMed] [Google Scholar]
- Nakamura K, Ohya W, Funakoshi H, Sakaguchi G, Kato A, Takeda M, Kudo T, Nakamura T. Possible role of scavenger receptor SRCL in the clearance of amyloid-beta in Alzheimer's disease. J Neurosci Res. 2006;84:874–890. doi: 10.1002/jnr.20992. [DOI] [PubMed] [Google Scholar]
- Parpura-Gill A, Beitz D, Uemura E. The inhibitory effects of beta-amyloid on glutamate and glucose uptakes by cultured astrocytes. Brain Res. 1997;754:65–71. doi: 10.1016/s0006-8993(97)00043-7. [DOI] [PubMed] [Google Scholar]
- Patel JR, Brewer GJ. Age-related changes in neuronal glucose uptake in response to glutamate and beta-amyloid. J Neurosci Res. 2003;72:527–536. doi: 10.1002/jnr.10602. [DOI] [PubMed] [Google Scholar]
- Pihlaja R, Koistinaho J, Malm T, Sikkila H, Vainio S, Koistinaho M. Transplanted astrocytes internalize deposited beta-amyloid peptides in a transgenic mouse model of Alzheimer's disease. Glia. 2007;56:154–163. doi: 10.1002/glia.20599. [DOI] [PubMed] [Google Scholar]
- Pike CJ, Burdick D, Walencewicz AJ, Glabe CG, Cotman CW. Neurodegeneration induced by beta-amyloid peptides in vitro: the role of peptide assembly state. J Neurosci. 1993;13:1676–1687. doi: 10.1523/JNEUROSCI.13-04-01676.1993. [DOI] [PMC free article] [PubMed] [Google Scholar]
- Pike CJ, Walencewicz-Wasserman AJ, Kosmoski J, Cribbs DH, Glabe CG, Cotman CW. Structure-activity analyses of beta-amyloid peptides: contributions of the beta 25-35 region to aggregation and neurotoxicity. J Neurochem. 1995;64:253–265. doi: 10.1046/j.1471-4159.1995.64010253.x. [DOI] [PubMed] [Google Scholar]
- Pluddemann A, Neyen C, Gordon S. Macrophage scavenger receptors and host-derived ligands. Methods. 2007;43:207–217. doi: 10.1016/j.ymeth.2007.06.004. [DOI] [PubMed] [Google Scholar]
- Rahman B, Kussmaul L, Hamprecht B, Dringen R. Glycogen is mobilized during the disposal of peroxides by cultured astroglial cells from rat brain. Neurosci Lett. 2000;290:169–172. doi: 10.1016/s0304-3940(00)01369-0. [DOI] [PubMed] [Google Scholar]
- Rapoport SI. Functional brain imaging in the resting state and during activation in Alzheimer's disease. Implications for disease mechanisms involving oxidative phosphorylation. Ann N Y Acad Sci. 1999;893:138–153. doi: 10.1111/j.1749-6632.1999.tb07823.x. [DOI] [PubMed] [Google Scholar]
- Rodriguez JJ, Olabarria M, Chvatal A, Verkhratsky A. Astroglia in dementia and Alzheimer's disease. Cell Death Differ. 2009;16:378–385. doi: 10.1038/cdd.2008.172. [DOI] [PubMed] [Google Scholar]
- Rogers J, Strohmeyer R, Kovelowski CJ, Li R. Microglia and inflammatory mechanisms in the clearance of amyloid beta peptide. Glia. 2002;40:260–269. doi: 10.1002/glia.10153. [DOI] [PubMed] [Google Scholar]
- Ros J, Pecinska N, Alessandri B, Landolt H, Fillenz M. Lactate reduces glutamate-induced neurotoxicity in rat cortex. J Neurosci Res. 2001;66:790–794. doi: 10.1002/jnr.10043. [DOI] [PubMed] [Google Scholar]
- Saltiel AR, Kahn CR. Insulin signalling and the regulation of glucose and lipid metabolism. Nature. 2001;414:799–806. doi: 10.1038/414799a. [DOI] [PubMed] [Google Scholar]
- Schubert D, Soucek T, Blouw B. The induction of HIF-1 reduces astrocyte activation by amyloid beta peptide. Eur J Neurosci. 2009;29:1323–1334. doi: 10.1111/j.1460-9568.2009.06712.x. [DOI] [PMC free article] [PubMed] [Google Scholar]
- Schurr A. Lactate: the ultimate cerebral oxidative energy substrate? J Cereb Blood Flow Metab. 2006;26:142–152. doi: 10.1038/sj.jcbfm.9600174. [DOI] [PubMed] [Google Scholar]
- Schurr A, West CA, Rigor BM. Lactate-supported synaptic function in the rat hippocampal slice preparation. Science. 1988;240:1326–1328. doi: 10.1126/science.3375817. [DOI] [PubMed] [Google Scholar]
- Selkoe DJ. Alzheimer disease: mechanistic understanding predicts novel therapies. Ann Intern Med. 2004;140:627–638. doi: 10.7326/0003-4819-140-8-200404200-00047. [DOI] [PubMed] [Google Scholar]
- Snyder SW, Ladror US, Wade WS, Wang GT, Barrett LW, Matayoshi ED, Huffaker HJ, Krafft GA, Holzman TF. Amyloid-beta aggregation: selective inhibition of aggregation in mixtures of amyloid with different chain lengths. Biophys J. 1994;67:1216–1228. doi: 10.1016/S0006-3495(94)80591-0. [DOI] [PMC free article] [PubMed] [Google Scholar]
- Soucek T, Cumming R, Dargusch R, Maher P, Schubert D. The regulation of glucose metabolism by HIF-1 mediates a neuroprotective response to amyloid beta peptide. Neuron. 2003;39:43–56. doi: 10.1016/s0896-6273(03)00367-2. [DOI] [PubMed] [Google Scholar]
- Stine WB, Jr, Dahlgren KN, Krafft GA, LaDu MJ. In vitro characterization of conditions for amyloid-beta peptide oligomerization and fibrillogenesis. J Biol Chem. 2003;278:11612–11622. doi: 10.1074/jbc.M210207200. [DOI] [PubMed] [Google Scholar]
- Valtorta F, Pennuto M, Bonanomi D, Benfenati F. Synaptophysin: leading actor or walk-on role in synaptic vesicle exocytosis? Bioessays. 2004;26:445–453. doi: 10.1002/bies.20012. [DOI] [PubMed] [Google Scholar]
- Vega C, Pellerin L, Dantzer R, Magistretti PJ. Long-term modulation of glucose utilization by IL-1 alpha and TNF-alpha in astrocytes: Na+ pump activity as a potential target via distinct signaling mechanisms. Glia. 2002;39:10–18. doi: 10.1002/glia.10080. [DOI] [PubMed] [Google Scholar]
- Verdier Y, Zarandi M, Penke B. Amyloid beta-peptide interactions with neuronal and glial cell plasma membrane: binding sites and implications for Alzheimer's disease. J Pept Sci. 2004;10:229–248. doi: 10.1002/psc.573. [DOI] [PubMed] [Google Scholar]
- Walsh DM, Hartley DM, Kusumoto Y, Fezoui Y, Condron MM, Lomakin A, Benedek GB, Selkoe DJ, Teplow DB. Amyloid beta-protein fibrillogenesis: structure and biological activity of protofibrillar intermediates. J Biol Chem. 1999;274:25945–25952. doi: 10.1074/jbc.274.36.25945. [DOI] [PubMed] [Google Scholar]
- White JA, Manelli AM, Holmberg KH, Van Eldik LJ, LaDu MJ. Differential effects of oligomeric and fibrillar amyloid-beta 1-42 on astrocyte-mediated inflammation. Neurobiol Dis. 2005;18:459–465. doi: 10.1016/j.nbd.2004.12.013. [DOI] [PubMed] [Google Scholar]
- Wyss-Coray T, Loike JD, Brionne TC, Lu E, Anankov R, Yan F, Silverstein SC, Husemann J. Adult mouse astrocytes degrade amyloid-beta in vitro and in situ. Nat Med. 2003;9:453–457. doi: 10.1038/nm838. [DOI] [PubMed] [Google Scholar]
- Yankner BA, Duffy LK, Kirschner DA. Neurotrophic and neurotoxic effects of amyloid beta protein: reversal by tachykinin neuropeptides. Science. 1990;250:279–282. doi: 10.1126/science.2218531. [DOI] [PubMed] [Google Scholar]
- Younkin SG. The role of A beta 42 in Alzheimer's disease. J Physiol Paris. 1998;92:289–292. doi: 10.1016/s0928-4257(98)80035-1. [DOI] [PubMed] [Google Scholar]
- Zakzanis KK, Graham SJ, Campbell Z. A meta-analysis of structural and functional brain imaging in dementia of the Alzheimer's type: a neuroimaging profile. Neuropsychol Rev. 2003;13:1–18. doi: 10.1023/a:1022318921994. [DOI] [PubMed] [Google Scholar]