

Abstract
It is generally thought that the signal-to-noise ratio, the bandwidth, and the information content of neural data acquired via noninvasive scalp electroencephalography (EEG) are insufficient to extract detailed information about natural, multijoint movements of the upper limb. Here, we challenge this assumption by continuously decoding three-dimensional (3D) hand velocity from neural data acquired from the scalp with 55-channel EEG during a 3D center-out reaching task. To preserve ecological validity, five subjects self-initiated reaches and self-selected targets. Eye movements were controlled so they would not confound the interpretation of the results. With only 34 sensors, the correlation between measured and reconstructed velocity profiles compared reasonably well to that reported by studies that decoded hand kinematics from neural activity acquired intracranially. We subsequently examined the individual contributions of EEG sensors to decoding to find substantial involvement of scalp areas over the sensorimotor cortex contralateral to the reaching hand. Using standardized low-resolution brain electromagnetic tomography (sLORETA), we identified distributed current density sources related to hand velocity in the contralateral precentral gyrus, postcentral gyrus, and inferior parietal lobule. Furthermore, we discovered that movement variability negatively correlated with decoding accuracy, a finding to consider during the development of brain–computer interface systems. Overall, the ability to continuously decode 3D hand velocity from EEG during natural, center-out reaching holds promise for the furtherance of noninvasive neuromotor prostheses for movement-impaired individuals.
Introduction
In the last decade, research into the neural coding of movement has generated enthusiasm for its potential to restore function to movement-impaired individuals. The field of brain–computer interface (BCI) systems deals with interpreting the neural code and generating commands to control an assistive device. To this end, researchers have extracted hand trajectories or velocity profiles from neuronal signals acquired with electrodes seated directly into cortical tissue and, in some cases, used these kinematics to command a robotic arm in real time (Wessberg et al., 2000; Serruya et al., 2002; Taylor et al., 2002; Hochberg et al., 2006; Kim et al., 2006; Mulliken et al., 2008; Truccolo et al., 2008; Velliste et al., 2008). Investigators have also extracted hand kinematics from intracranial local field potentials obtained through less invasive electrocorticography (Schalk et al., 2007; Pistohl et al., 2008; Sanchez et al., 2008).
In contrast to decoding studies that acquired intracranial neural activity, little work has been done to continuously decode natural, multijoint hand kinematics from neural signals acquired noninvasively. Only a few studies report continuous decoding of two-dimensional (2D) hand and tool kinematics from magnetoencephalography (MEG) (Georgopoulos et al., 2005, Jerbi et al., 2007, Bradberry et al., 2008, 2009a). Although MEG demonstrates a proof of concept, it is immobile and therefore unsuitable for practical BCI systems. However, electroencephalography (EEG) is suitable for practical BCI systems, but, with the exception of our preliminary study (Bradberry et al., 2009b), researchers have not demonstrated continuous decoding of hand kinematics from EEG. Instead, most EEG studies have discretely classified the direction/speed of 2D hand/wrist movements or different motor imagery tasks on a single-trial basis (Mellinger et al., 2007; Hammon et al., 2008; Waldert et al., 2008; Gu et al., 2009), or they have demonstrated 2D continuous control of a cursor through biofeedback training (Wolpaw and McFarland, 2004). The lack of attention to reconstructing kinematics of natural hand movements from EEG could be because some researchers consider training subjects to modulate EEG activity, independent of reconstructing hand kinematics, to suffice for 2D control (Wolpaw and McFarland, 2004). The lack of attention could also be due to the assumption that EEG signals lack sufficient signal-to-noise ratio, bandwidth, and information content to decode hand kinematics (Lebedev and Nicolelis, 2006).
To examine our hypothesis that kinematics of natural hand movements are decodable from EEG signals and, hence, may serve as new signals for controlling neuromotor prostheses, we aimed to continuously extract hand velocity from signals collected during a three-dimensional (3D) center-out reaching task. To assure a realistic task, subjects were not cued: they chose which target to acquire and when to initiate movement. Since EEG coupled with our decoding method facilitated the investigation of sensor contributions to decoding with high temporal resolution, we examined the location of salient sensors across time lags. Using standardized low-resolution brain electromagnetic tomography (sLORETA) (Pascual-Marqui, 2002), we further estimated the sources most involved in encoding hand velocity. Moreover, we investigated the relationship between decoding accuracy and movement variability.
Materials and Methods
See supplemental Materials and Methods for more details, available at www.jneurosci.org as supplemental material.
Experimental procedure.
Five healthy, right-handed subjects sat upright in a chair and executed self-initiated, center-out reaches to self-selected push-button targets near eye level (Fig. 1). We instructed subjects to attempt to make uniformly distributed random selections of the eight targets without counting. Subjects were instructed to fixate an LED on the center target throughout data collection and to only blink when their hand was resting at the center target. To ensure the minimization of eye movements, a researcher monitored the subjects' eyes during data collection, and the correlation between electroocular activity and hand kinematics was analyzed off-line (supplemental Fig. 1, available at www.jneurosci.org as supplemental material). For each subject, the experiment concluded after each target was acquired at least 10 times.
Figure 1.

Experimental setup and finger paths. The reaching apparatus is shown in the middle along with the Cartesian coordinate system we used. The distance from the center position to each of the targets was ∼22 cm. Mean finger paths for center-to-target (black) and target-to-center (gray) movements exhibited movement variability among subjects.
Data collection.
A 64-sensor Electro-Cap was placed on the heads of subjects according to the extended International 10–20 system with ear-linked reference and used to collect 58 channels of EEG activity. Continuous EEG signals were sampled at 1000 Hz, bandpass filtered from 0.5 to 100 Hz, and notch filtered at 60 Hz. Horizontal and vertical electroocular activity was measured with bipolar sensor montages. Hand position was sampled at 100 Hz using a motion-sensing system that tracked an infrared LED secured to the fingertip.
Signal preprocessing.
The EEG data were decimated from 1 kHz to 100 Hz by applying a low-pass, antialiasing filter with a cutoff frequency of 40 Hz and then downsampling by a factor of 10. A zero-phase, fourth-order, low-pass Butterworth filter with a cutoff frequency of 1 Hz was then applied to the kinematic and EEG data. Next, the temporal difference of the EEG data was computed. To examine relative sensor contributions in the scalp map analysis described in a section below, data from each EEG sensor were standardized according to Equation 1, as follows:
 |
for all n from 1 to N, where Sn[t] and vn[t] are, respectively, the standardized and differenced voltage at sensor n at time t, μvn and σvn are, respectively, the mean and SD of vn, and N is the number of sensors.
Decoding method.
To continuously decode hand velocity from the EEG signals, the following linear decoding model was used:
 |
 |
 |
where x[t] − x[t − 1], y[t] − y[t − 1], and z[t] − z[t − 1] are, respectively, the horizontal, vertical, and depth velocities of the hand at time sample t, N is the number of EEG sensors, L (=10) is the number of time lags, Sn [t − k] is the standardized difference in voltage measured at EEG sensor n at time lag k, and the a and b variables are weights obtained through multiple linear regression. The three most frontal sensors were excluded from the analysis to further mitigate the influence of any eye movements on reconstruction, resulting in an N of 55 sensors.
For each subject, the collected continuous data contained ∼80 trials. All continuous data were used in an 8 × 8-fold cross-validation procedure to assess the decoding accuracy. The cross-validation procedure was considered complete when all of the eight combinations of training and testing data were exhausted, and the mean Pearson correlation coefficient (r) between measured and reconstructed kinematics was computed across folds. Before computing r, the kinematic signals were smoothed with a zero-phase, fourth-order, low-pass Butterworth filter with a cutoff frequency of 1 Hz.
Sensor sensitivity curves.
Curves depicting the relationship between decoding accuracy and the number of sensors used in the decoding method were plotted for the x, y, and z dimensions of hand velocity. First, for each subject, each of the 55 sensors was assigned a rank according to the following:
 |
for all n from 1 to N, where Rn is the rank of sensor n, and the b variables are the best regression weights. This ranking procedure is similar to the one described by Sanchez et al. (2004). Next, the decoding method with cross-validation as described above and ranking method were iteratively executed using backward elimination with a decrement step of three. The mean and SEM of r values computed across subjects were plotted against the number of sensors.
Scalp maps of sensor contributions.
To graphically assess the relative contributions of scalp regions to the reconstruction of hand velocity, the across-subject mean of the magnitude of the best b vectors (from Eqs. 2–4) was projected onto a time series (−100–0 ms in increments of 10 ms) of scalp maps. These spatial renderings of sensor contributions were produced by the topoplot function of EEGLAB [Delorme and Makeig, 2004 (http://sccn.ucsd.edu/eeglab/)]. To examine which time lags were the most important for decoding, for each scalp map, the percentage of reconstruction contribution was defined as follows:
 |
for all i from 0 to L, where %Ti is the percentage of reconstruction contribution for a scalp map at time lag i.
Source estimation with sLORETA.
To better estimate the sources of hand-velocity encoding, we used sLORETA [Pascual-Marqui, 2002 (http://www.uzh.ch/keyinst/loreta.htm)]. Preprocessed EEG signals from all 55 channels for each subject were fed to sLORETA to estimate current sources. These EEG signals had been preprocessed in the same manner as that for decoding. First, r values were computed between the squared time series of each of the 55 sensors with the 6239 time series from the sLORETA solution and then averaged across subjects. Second, the maximum r value was assigned to each voxel after being multiplied by the regression weight b (from Eqs. 2–4) of its associated sensor. The regression weights had been pulled from the regression solution at time lag −60 ms, which had the highest percentage of reconstruction contribution. Third, for visualization purposes, the highest 5% of the voxels (r values weighted by b) were set to the value 1, and the rest of the r values were set to zero. Finally, these binary-thresholded r values were plotted onto axial slices of the brain from the Colin27 volume (Holmes et al., 1998). All reported coordinates of regions of interest are in MNI (Montreal Neurological Institute) space.
Movement variability.
For each subject, three measures of movement variability were computed: the coefficient of variation (CV) for movement time (MT), the CV for movement length (ML), and the kurtosis of movement. MT and ML were computed on a trial basis with a trial defined as the release of a push button to the press of a push button (center-to-target or target-to-center). The mean and SD of the measures were then computed, and the SD was divided by the mean to produce the CV. Kurtosis was defined as follows:
 |
where k is the kurtosis, E() is the expected value operator, h is the hand velocity, and μh and σh are, respectively, the mean and SD of the hand velocity. Single trials of velocity profiles for x, y, and z dimensions were resampled to normalize for length and then concatenated before computing kurtosis. The relationship between movement variability and decoding accuracy was examined by computing the r value between the quantities. The sample sizes were small (n = 5) for decoding accuracy and each measure of movement variability, so 10,000 r values were bootstrapped for each comparison, and the median and confidence intervals of the resultant non-Gaussian distributions were calculated using the bias-corrected and accelerated percentile method (Efron and Tibshirani, 1998).
Results
Our EEG decoding method reconstructed 3D hand-velocity profiles reasonably well. We quantified the decoding accuracy by computing the mean of Pearson's r between measured and reconstructed hand velocity across cross-validation folds. For y and z velocities, the decoding accuracy peaked at 0.38 and 0.32, respectively, with only 34 sensors (Fig. 2A,B). For x velocity with 34 sensors, the decoding accuracy of 0.19 remained relatively unaffected by the number of sensors. Thus, we used 34 sensors for subsequent analyses. In addition to quantitatively analyzing decoding accuracy, visually comparing reconstructed and measured velocity profiles confirmed their similarities (Fig. 2C).
Figure 2.
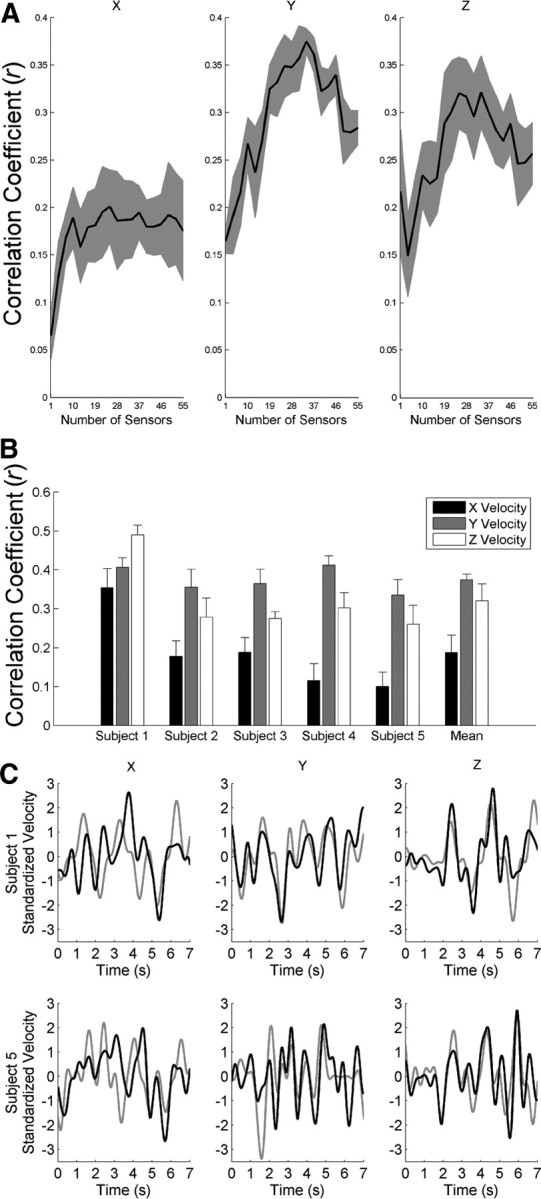
EEG decoding accuracy of hand velocity. A, The mean (black) ± SEM (gray) of the r values across subjects (n = 5) versus the number of sensors exhibited a peak at 34 sensors. B, With 34 sensors, we computed the mean ± SEM of the r values across cross-validation folds (n = 8) for each subject for x (black), y (gray), and z (white) velocities. C, Reconstructed (black) and measured (gray) velocity profiles demonstrated similarities. Exemplar velocity profiles from the subjects with the best (subject 1, top row) and worst (subject 5, bottom row) decoding accuracies are shown.
Scalp maps depicted the contributions of the 34 sensors as a network of frontal, central, and parietal regions (Fig. 3A). Within this network, sensor CP3 made the greatest contribution. Interestingly, CP3 lies roughly above the primary sensorimotor cortex that is contralateral to the reaching hand. Concerning time lags, EEG data from 60 ms in the past supplied the most information with 16.0% of the total contribution. At 60 ms, we localized the EEG sources to confirm that the primary sensorimotor cortex (precentral gyrus and postcentral gyrus) was indeed a major contributor along with the inferior parietal lobule (IPL) (Fig. 3B).
Figure 3.

Scalp and current sources that encoded hand velocity. A, Mean (n = 5) scalp maps of the best 34 sensors revealed a network of frontal, central, and parietal involvement along with a large individual contribution from sensor CP3. Light and dark colors represent high and low contributors, respectively. Each scalp map with its percentage contribution is displayed above its associated 10 ms time lag, revealing the 16.0% maximal contribution of EEG data at 60 ms in the past. B, We overlaid localized sources (yellow) from 60 ms in the past onto MRI structural images to reveal the involvement of the precentral gyrus (x = −30, y = −30, z = 52), postcentral gyrus (x = −35, y = −30, z = 47), and IPL (x = −35, y = −36, z = 42).
Additionally, we compared the relationship between decoding accuracy, shown in Figure 2B, and movement variability. To quantify movement variability, we computed the CV for MT and ML (Fig. 4A) and the kurtosis of the velocity profiles (Fig. 4B). The high kurtosis values indicated outlier-prone, super-Gaussian distributions (kurtosis, >0). We found that movement variability negatively correlated with decoding accuracy (Fig. 4C). Figure 1 aids in visually depicting this relationship by showing that subject 1, with the best decoding accuracy, performed straighter reaches.
Figure 4.
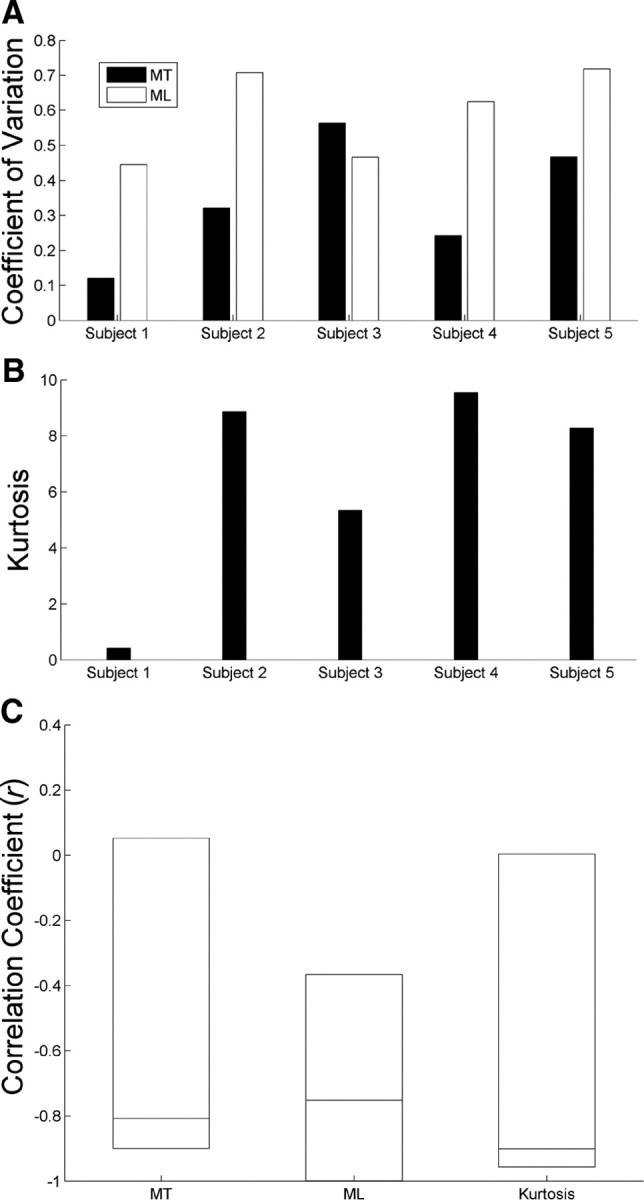
Relationship between movement variability and decoding accuracy. A, The CVs for MT (black) and ML (white) ranged across subjects. B, The kurtosis of the velocity profiles also varied across subjects. C, All movement variability measures demonstrated high negative correlations with the decoding accuracy shown in Figure 2B. Rectangles demarcate the confidence intervals for the bootstrapped r values, with each rectangle possessing a horizontal line at the median. The confidence intervals are 70, 90, and 70%, respectively, for MT, ML, and kurtosis.
Discussion
In the last decade, researchers have pushed the boundaries of noninvasive neural decoding in the interest of developing BCI systems for the movement impaired. To further stretch the limits, we continuously reconstructed 3D hand velocity of natural, multijoint, center-out movements from only 34 channels of EEG data. A sensorimotor network composed of frontal, central, and parietal scalp regions encoded for hand velocity, with the strongest contributions coming from cortical regions of the precentral gyrus, postcentral gyrus, and IPL at 60 ms in the past. Furthermore, the intersubject variability in movement may explain the intersubject variability in decoding accuracy due to their negative correlation.
The sensor sensitivity curves for y and z velocities peak at ∼0.35 for 34 sensors before they begin decreasing. A common occurrence in machine learning is that, as the number of input features increases, prediction increases up to a point, then prediction may decrease due to overfitting the model to the training data, which is likely the case here (Alpaydin, 2004). The curve for x velocity remains nearly flat ∼0.20 after an initial rapid increase (Fig. 2A). We made the common assumption that the brain employs a hand-centered Cartesian coordinate system. However, the possibility exists that the brain could represent a different coordinate system (e.g., joint space or multiple interacting frames of reference) or desired muscular activity (Gourtzelidis et al., 2001; Wu and Hatsopoulos, 2006, 2007). The dimensions of an alternate representation could correlate better with y and z velocities than x velocity, potentially explaining the uniqueness of the sensitivity curve for x velocity. Nonetheless, in future studies when subjects are asked to use motor imagery to control a cursor or virtual arm in 3D via our decoder, we expect their neural activity to adapt to overcome an initial imperfect choice of representation framework, as Ganguly and Carmena (2009) observed in an invasive BCI experiment.
To our knowledge, apart from our preliminary study (Bradberry et al., 2009b), studies on continuously decoding hand kinematics from EEG do not exist. Therefore, we cannot directly compare our results to the literature. However, two studies report off-line, continuous reconstruction of 3D hand kinematics from intracranial neuronal activity (Wessberg et al., 2000; Kim et al., 2006), and several studies report off-line, continuous reconstruction of 2D hand and tool kinematics from MEG (Georgopoulos et al., 2005, Jerbi et al., 2007, Bradberry et al., 2008, 2009a). Of the MEG investigations, Bradberry et al. (2008, 2009a) exclusively employs a center-out movement paradigm, the de facto standard for comparison among decoding studies with BCI implications. These other studies report slightly higher r values (supplemental Table 1, available at www.jneurosci.org as supplemental material), but uniquely our study involves more ambitious experimental settings, such as more reaching targets, greater extent of multijoint movements, self-initiated movements, and self-selected targets.
Strengthening the validity of our decoding results, scalp maps and estimated current sources indicate involvement of the contralateral primary sensorimotor region and the IPL. Other studies confirm that the primary sensorimotor cortex encodes hand kinematics at a microscale (Georgopoulos et al., 1986; Moran and Schwartz, 1999; Wessberg et al., 2000; Serruya et al., 2002; Schwartz et al., 2004; Kim et al., 2006), mesoscale (Schalk et al., 2007; Pistohl et al., 2008; Sanchez et al., 2008), and macroscale (Kelso et al., 1998; Jerbi et al., 2007). Several MEG studies report that the IPL also encodes hand kinematics (Jerbi et al., 2007; Bradberry et al., 2009a). Regardless of scale, decoding methods like the one we report here rely on a subsecond history of neural data to reconstruct hand kinematics (Serruya et al., 2002, Sanchez et al., 2008; Bradberry et al., 2009a). Our choice of a 100 ms lag aligns with this convention as well as the rationale that these lags consist of planning activity of the brain associated with the current kinematic sample of the hand. Furthermore, across lags the sensor contributions initially increase, peak at 60 ms, and then decrease, possibly revealing a temporal tuning curve for our task. Since only low-frequency components of the EEG signals seem to carry information about hand velocity, slow cortical potentials emerge as the best candidates for a neurophysiological interpretation of these findings (Birbaumer et al., 1990).
An important topic in BCI research involves how decoding methods may adapt or facilitate user adaptation to novel environments or cognitive states. To evaluate adaptation, the user of a BCI system must receive feedback (e.g., visual or kinesthetic) of imagined movements while manipulating a brain-controlled device in real time. In the future, it will be essential to provide subjects with real-time feedback to investigate their ability to adapt their EEG activity to a fixed decoder (i.e., test the ability of our decoder to generalize). To improve performance, it is expected that subjects will “modify” regression weights by modulating their EEG activity. Decoder generalization has recently been demonstrated and analyzed in monkeys by Ganguly and Carmena (2009). Regarding humans, researchers have not thoroughly analyzed generalization; regardless, comparably impressive 2D control has been demonstrated by sensorimotor rhythms derived from EEG (Wolpaw and McFarland, 2004) and single neurons (Hochberg et al., 2006). Given this evidence, we expect our decoding method for EEG to permit 3D brain control by humans in real time.
Regarding the negative correlation between movement variability and decoding accuracy, we offer two potential explanations. For the more technical explanation, increased movement variability could degrade decoding accuracy due to less similar pairs of EEG–kinematic exemplars. Conversely, less movement variability results in more similar exemplars for training. A more neural related explanation is that subjects differ in their ability to perform the task without practice; hence, the strengths of a priori neural representations of the required movements differ. These differing strengths could directly relate to the accuracy with which the representations can be extracted. Indeed, a previous study confirms that motor learning produces more accurate predictions of movement direction from an ensemble of neuronal activity in primary motor cortex (Cohen and Nicolelis, 2004). This finding is important to consider as real-time BCI systems based on our decoder are investigated in the future.
In conclusion, despite the common assumption that EEG signals do not possess decodable information about detailed, complex hand movements, we demonstrate otherwise. The locations of the most important sensors to decoding are interpretable in light of previous studies and corroborate our claims. In the near future, the question should be addressed of how well subjects can adapt to our decoder of 3D kinematics when feedback of the decoder output is provided.
Footnotes
This work was financially supported by La Fondation Motrice (Paris, France) (R.J.G.).
References
- Alpaydin E. Introduction to machine learning. Cambridge, MA: MIT; 2004. p. 254. [Google Scholar]
- Birbaumer N, Elbert T, Canavan AG, Rockstroh B. Slow potentials of the cerebral cortex and behavior. Physiol Rev. 1990;70:1–41. doi: 10.1152/physrev.1990.70.1.1. [DOI] [PubMed] [Google Scholar]
- Bradberry TJ, Contreras-Vidal JL, Rong F. Decoding hand and cursor kinematics from magnetoencephalographic signals during tool use. Conf Proc IEEE Eng Med Biol Soc. 2008;2008:5306–5309. doi: 10.1109/IEMBS.2008.4650412. [DOI] [PubMed] [Google Scholar]
- Bradberry TJ, Rong F, Contreras-Vidal JL. Decoding center-out hand velocity from MEG signals during visuomotor adaptation. Neuroimage. 2009a;47:1691–1700. doi: 10.1016/j.neuroimage.2009.06.023. [DOI] [PubMed] [Google Scholar]
- Bradberry TJ, Gentili RJ, Contreras-Vidal JL. Decoding three-dimensional hand kinematics from electroencephalographic signals. Conf Proc IEEE Eng Med Biol Soc. 2009b;2009:5010–5013. doi: 10.1109/IEMBS.2009.5334606. [DOI] [PubMed] [Google Scholar]
- Cohen D, Nicolelis MA. Reduction of single-neuron firing uncertainty by cortical ensembles during motor skill learning. J Neurosci. 2004;24:3574–3582. doi: 10.1523/JNEUROSCI.5361-03.2004. [DOI] [PMC free article] [PubMed] [Google Scholar]
- Delorme A, Makeig S. EEGLAB: an open source toolbox for analysis of single-trial EEG dynamics including independent component analysis. J Neurosci Methods. 2004;134:9–21. doi: 10.1016/j.jneumeth.2003.10.009. [DOI] [PubMed] [Google Scholar]
- Efron B, Tibshirani RJ. An introduction to the bootstrap. Boca Raton, FL: CRC; 1998. [Google Scholar]
- Ganguly K, Carmena JM. Emergence of a stable cortical map for neuroprosthetic control. PLoS Biol. 2009;7:e1000153. doi: 10.1371/journal.pbio.1000153. [DOI] [PMC free article] [PubMed] [Google Scholar]
- Georgopoulos AP, Langheim FJ, Leuthold AC, Merkle AN. Magnetoencephalographic signals predict movement trajectory in space. Exp Brain Res. 2005;167:132–135. doi: 10.1007/s00221-005-0028-8. [DOI] [PubMed] [Google Scholar]
- Gourtzelidis P, Smyrnis N, Evdokimidis I, Balogh A. Systematic errors of planar arm movements provide evidence for space categorization effects and interaction of multiple frames of reference. Exp Brain Res. 2001;139:59–69. doi: 10.1007/s002210100767. [DOI] [PubMed] [Google Scholar]
- Gu Y, Farina D, Murguialday AR, Dremstrup K, Montoya P, Birbaumer N. Offline identification of imagined speed of wrist movements in paralyzed ALS patients from single-trial EEG. Front Neuroprosth. 2009;1:1–7. doi: 10.3389/neuro.20.003.2009. [DOI] [PMC free article] [PubMed] [Google Scholar]
- Hammon PS, Makeig S, Poizner H, Todorov E, de Sa VR. Predicting reaching targets from human EEG. IEEE Signal Proc Mag. 2008;25:69–77. [Google Scholar]
- Hochberg LR, Serruya MD, Friehs GM, Mukand JA, Saleh M, Caplan AH, Branner A, Chen D, Penn RD, Donoghue JP. Neuronal ensemble control of prosthetic devices by a human with tetraplegia. Nature. 2006;442:164–171. doi: 10.1038/nature04970. [DOI] [PubMed] [Google Scholar]
- Holmes CJ, Hoge R, Collins L, Woods R, Toga AW, Evans AC. Enhancement of MR images using registration for signal averaging. J Comput Assist Tomogr. 1998;22:324–333. doi: 10.1097/00004728-199803000-00032. [DOI] [PubMed] [Google Scholar]
- Jerbi K, Lachaux JP, N′Diaye K, Pantazis D, Leahy RM, Garnero L, Baillet S. Coherent neural representation of hand speed in humans revealed by MEG imaging. Proc Natl Acad Sci U S A. 2007;104:7676–7681. doi: 10.1073/pnas.0609632104. [DOI] [PMC free article] [PubMed] [Google Scholar]
- Kelso JA, Fuchs A, Lancaster R, Holroyd T, Cheyne D, Weinberg H. Dynamic cortical activity in the human brain reveals motor equivalence. Nature. 1998;392:814–818. doi: 10.1038/33922. [DOI] [PubMed] [Google Scholar]
- Kim SP, Sanchez JC, Rao YN, Erdogmus D, Carmena JM, Lebedev MA, Nicolelis MA, Principe JC. A comparison of optimal MIMO linear and nonlinear models for brain–machine interfaces. J Neural Eng. 2006;3:145–161. doi: 10.1088/1741-2560/3/2/009. [DOI] [PubMed] [Google Scholar]
- Lebedev MA, Nicolelis MA. Brain-machine interfaces: past, present and future. Trends Neurosci. 2006;29:536–546. doi: 10.1016/j.tins.2006.07.004. [DOI] [PubMed] [Google Scholar]
- Mellinger J, Schalk G, Braun C, Preissl H, Rosenstiel W, Birbaumer N, Kübler A. An MEG-based brain-computer interface (BCI) Neuroimage. 2007;36:581–593. doi: 10.1016/j.neuroimage.2007.03.019. [DOI] [PMC free article] [PubMed] [Google Scholar]
- Moran DW, Schwartz AB. Motor cortical activity during drawing movements: population representation during spiral tracing. J Neurophysiol. 1999;82:2693–2704. doi: 10.1152/jn.1999.82.5.2693. [DOI] [PubMed] [Google Scholar]
- Mulliken GH, Musallam S, Andersen RA. Decoding trajectories from posterior parietal cortex ensembles. J Neurosci. 2008;28:12913–12926. doi: 10.1523/JNEUROSCI.1463-08.2008. [DOI] [PMC free article] [PubMed] [Google Scholar]
- Pascual-Marqui RD. Standardized low-resolution brain electromagnetic tomography (sLORETA): technical details. Methods Find Exp Clin Pharmacol. 2002;24(Suppl D):5–12. [PubMed] [Google Scholar]
- Pistohl T, Ball T, Schulze-Bonhage A, Aertsen A, Mehring C. Prediction of arm movement trajectories from ECoG-recordings in humans. J Neurosci Methods. 2008;167:105–114. doi: 10.1016/j.jneumeth.2007.10.001. [DOI] [PubMed] [Google Scholar]
- Sanchez JC, Carmena JM, Lebedev MA, Nicolelis MA, Harris JG, Principe JC. Ascertaining the importance of neurons to develop better brain-machine interfaces. IEEE Trans Biomed Eng. 2004;51:943–953. doi: 10.1109/TBME.2004.827061. [DOI] [PubMed] [Google Scholar]
- Sanchez JC, Gunduz A, Carney PR, Principe JC. Extraction and localization of mesoscopic motor control signals for human ECoG neuroprosthetics. J Neurosci Methods. 2008;167:63–81. doi: 10.1016/j.jneumeth.2007.04.019. [DOI] [PubMed] [Google Scholar]
- Schalk G, Kubánek J, Miller KJ, Anderson NR, Leuthardt EC, Ojemann JG, Limbrick D, Moran D, Gerhardt LA, Wolpaw JR. Decoding two-dimensional movement trajectories using electrocorticographic signals in humans. J Neural Eng. 2007;4:264–275. doi: 10.1088/1741-2560/4/3/012. [DOI] [PubMed] [Google Scholar]
- Schwartz AB, Moran DW, Reina GA. Differential representation of perception and action in the frontal cortex. Science. 2004;303:380–383. doi: 10.1126/science.1087788. [DOI] [PubMed] [Google Scholar]
- Serruya MD, Hatsopoulos NG, Paninski L, Fellows MR, Donoghue JP. Instant neural control of a movement signal. Nature. 2002;416:141–142. doi: 10.1038/416141a. [DOI] [PubMed] [Google Scholar]
- Taylor DM, Tillery SI, Schwartz AB. Direct cortical control of 3D neuroprosthetic devices. Science. 2002;296:1829–1832. doi: 10.1126/science.1070291. [DOI] [PubMed] [Google Scholar]
- Truccolo W, Friehs GM, Donoghue JP, Hochberg LR. Primary motor cortex tuning to intended movement kinematics in humans with tetraplegia. J Neurosci. 2008;28:1163–1178. doi: 10.1523/JNEUROSCI.4415-07.2008. [DOI] [PMC free article] [PubMed] [Google Scholar]
- Velliste M, Perel S, Spalding MC, Whitford AS, Schwartz AB. Cortical control of a prosthetic arm for self-feeding. Nature. 2008;453:1098–1101. doi: 10.1038/nature06996. [DOI] [PubMed] [Google Scholar]
- Waldert S, Preissl H, Demandt E, Braun C, Birbaumer N, Aertsen A, Mehring C. Hand movement direction decoded from MEG and EEG. J Neurosci. 2008;28:1000–1008. doi: 10.1523/JNEUROSCI.5171-07.2008. [DOI] [PMC free article] [PubMed] [Google Scholar]
- Wessberg J, Stambaugh CR, Kralik JD, Beck PD, Laubach M, Chapin JK, Kim J, Biggs SJ, Srinivasan MA, Nicolelis MA. Real-time prediction of hand trajectory by ensembles of cortical neurons in primates. Nature. 2000;408:361–365. doi: 10.1038/35042582. [DOI] [PubMed] [Google Scholar]
- Wolpaw JR, McFarland DJ. Control of a two-dimensional movement signal by a noninvasive brain-computer interface in humans. Proc Natl Acad Sci U S A. 2004;101:17849–17854. doi: 10.1073/pnas.0403504101. [DOI] [PMC free article] [PubMed] [Google Scholar]
- Wu W, Hatsopoulos N. Evidence against a single coordinate system representation in the motor cortex. Exp Brain Res. 2006;175:197–210. doi: 10.1007/s00221-006-0556-x. [DOI] [PubMed] [Google Scholar]
- Wu W, Hatsopoulos NG. Coordinate system representations of movement direction in the premotor cortex. Exp Brain Res. 2007;176:652–657. doi: 10.1007/s00221-006-0818-7. [DOI] [PubMed] [Google Scholar]