

Abstract
Previous animal research has revealed neuronal activity underlying short-term retention of vibrotactile stimuli, providing evidence for a parametric representation of stimulus frequency in primate tactile working memory (Romo et al., 1999). Here, we investigated the neural correlates of vibrotactile frequency processing in human working memory, using noninvasive electroencephalography (EEG). Participants judged the frequencies of vibrotactile stimuli delivered to the fingertip in a delayed match-to-sample frequency discrimination task. As expected, vibrotactile stimulation elicited pronounced steady-state evoked potentials, which were source-localized in primary somatosensory cortex. Furthermore, parametric analysis of induced EEG responses revealed that the frequency of stimulation was reflected by systematic modulations of synchronized oscillatory activity in nonprimary cortical areas. Stimulus processing was accompanied by frequency-dependent alpha-band responses (8–12 Hz) over dorsal occipital cortex. The critical new finding was that, throughout the retention interval, the stimulus frequency held in working memory was systematically represented by a modulation in prefrontal beta activity (20–25 Hz), which was source-localized to the inferior frontal gyrus. This modulation in oscillatory activity during stimulus retention was related to successful frequency discrimination, thus reflecting behaviorally relevant information. Together, the results complement previous findings of parametric working memory correlates in nonhuman primates and suggest that the quantitative representation of vibrotactile frequency in sensory memory entails systematic modulations of synchronized neural activity in human prefrontal cortex.
Introduction
Sensory working memory accomplishes the short-term storage of behaviorally relevant sensory information (for review, see Pasternak and Greenlee, 2005). In the tactile domain, the neuronal basis of sensory working memory has been extensively studied in nonhuman primates performing delayed discrimination of vibrotactile stimuli (for review, see Romo and Salinas, 2003). A particularly intriguing finding from this line of research is the notion of parametric working memory for vibrotactile frequency, as reflected by the graded firing of neurons in prefrontal cortex (PFC) during stimulus retention (Romo et al., 1999). Similar, albeit less pronounced memory-related activity was recorded in premotor cortex and secondary somatosensory cortex (SII) (Romo et al., 2002; Romo and Salinas, 2003).
Only few neuroimaging studies have examined vibrotactile working memory in human subjects, using functional imaging (Preuschhof et al., 2006) and, recently, magnetoencephalography (MEG) (Haegens et al., 2010). The activation patterns found in these studies were in reasonable agreement with the previous animal work, consistently showing memory-related activations in human PFC, and recently also SII (Haegens et al., 2010). However, different strategies have been pursued in the studies of animals and humans; whereas Romo et al. (1999) were able to identify neurons which monotonically encode in their firing rate the contents of somatosensory working memory (i.e., the stimulus frequency), the recent studies of humans have isolated memory-related brain activity by contrasting conditions of high versus no (or failed) working memory function (for critical discussion, see Pasternak and Greenlee, 2005). As yet, no neuroimaging study has reported independent evidence for a parametric representation of vibrotactile frequency in human working memory.
A priori, neural indices of such parametric representation may be difficult to detect using brain imaging techniques. Only approximately one-half of the neurons found to encode vibrotactile frequency in macaque PFC actually increased their firing rate as a function of frequency; the firing rates of almost equally many neurons systematically decreased with increasing stimulation frequency (Romo et al., 1999; Romo and Salinas, 2003). On the population level, such complex changes in neuronal firing may not affect the net metabolism of the region, which is assessed in functional imaging. However, the modulations in neuronal firing may be accompanied by systematic changes in the large-scale oscillatory dynamics of the population [e.g., in terms of neuronal (de-)synchronization], which can be assessed noninvasively by analysis of the spectral power evolution in electroencephalography (EEG)/MEG signals (Pfurtscheller and Aranibar, 1977).
Human EEG/MEG studies have shown that vibrotactile stimulation evokes frequency-specific responses in primary somatosensory cortex (Giabbiconi et al., 2007), but no noninvasive evidence for a sustained frequency representation in nonprimary cortical areas exists. Here, we probed the notion of Romo et al. (1999) of parametric working memory by analysis of human EEG responses during vibrotactile frequency discrimination. In particular, we examined to what extent oscillatory activity reflects the stimulus frequency being processed in working memory. Thus, in contrast to previous neuroimaging studies describing the broad networks involved in tactile stimulus retention, we specifically focused on neural correlates reflecting the task-relevant contents of a somatosensory memory trace.
Materials and Methods
Participants.
Fourteen healthy volunteers (21–39 years; five females, nine males) participated in the experiment with written informed consent. The study was approved by the Ethical Committee of the Charité University Hospital Berlin and corresponded to the Human Subjects Guidelines of the Declaration of Helsinki.
Stimuli and behavioral task.
Vibrotactile stimulation of the left index finger was delivered by a 16-dot piezoelectric braille display (4 × 4 quadratic matrix; 2.5 mm spacing) controlled by a programmable stimulator (Piezostimulator; QuaeroSys). The pins of the braille display were driven by a constant 144 Hz sinusoidal carrier signal that was amplitude-modulated by one of six fixed-amplitude sinus functions (16, 21, 26, 31, 36, or 41 Hz). Although the power spectrum of the driving signal contains only frequency components >100 Hz, the resulting tactile stimulation is perceived as a “flutter” in the modulation frequency, corresponding to the envelope curve of the signal (Tobimatsu et al., 1999). The sound of the stimulator was masked by white noise (∼90 dB) presented through a loudspeaker. None of the participants reported hearing any sound attributable to the tactile stimulation.
On each trial, after a variable prestimulus interval (1000–1500 ms), two flutter stimuli of 1250 ms duration were sequentially presented, separated by a 1750 ms retention interval (see Fig. 1A). The base stimulus frequency (f1) was varied between 21 and 36 Hz in steps of 5 Hz; the comparison stimulus frequency (f2) was randomly chosen to be either 5 Hz higher or 5 Hz lower than the base frequency. After comparison stimulus offset, responses were given with the right hand by pressing a response button either once or twice to indicate whether the base or the comparison stimulus was “faster.” Response assignment was counterbalanced (i.e., one-half of the subjects were instructed to indicate which of the two stimuli was “slower”). After a few practice trials, each participant completed five blocks of 100 frequency discrimination trials.
Figure 1.

A, Experimental paradigm. Vibrotactile stimuli of varying frequencies (16–41 Hz) were presented at the left index finger for subsequent frequency discrimination. B, C, Overview of stimulus-evoked responses observed during the task. B, Grand average evoked power for exemplary stimulus condition (f1, 26 Hz; f2, 31 Hz). For illustration, data were pooled over a representative set of channels (F1, Fz, F2, F4, FC1, FCz, FC2, FC4), in which both evoked and induced responses were observed (compare Fig. 2). The dashed rectangle highlights the time–frequency window of the steady-state evoked response to f1. C, Topography and SPM source reconstruction of the steady-state response in primary somatosensory cortex. Source rendering shows statistical parametric map of narrowband evoked activity at 26 Hz, compared with a condition in which f1 was 36 Hz. D, Steady-state evoked responses pooled over representative channels (see Results), expressed as the average narrow-band evoked power around the frequencies of the base (f1) and comparison (f2) stimuli, respectively. Data from equal-numbered subsets of correct and incorrect trials are shown; the gray shading indicates time window of a significant difference. E, Schematic of EEG electrode setup.
EEG recording and analysis.
EEG was recorded using a 64-channel active electrode system (ActiveTwo; BioSemi), with electrodes placed in an elastic cap according to the 10–20 system. Individual electrode locations were registered using an electrode positioning system (Zebris Medical). Vertical and horizontal eye movements were recorded from four additional channels. Signals were digitized at a sampling rate of 2048 Hz, off-line bandpass filtered (0.5–100 Hz), downsampled to a sampling rate of 512 Hz, and referenced against average reference. The EEG data were corrected for eye movements using calibration data to generate individual artifact coefficients, and the algorithm implemented in BESA (MEGIS Software; BESA, version 5.1.8). Remaining artifacts were excluded from analysis by careful visual inspection.
Spectral analysis.
All additional analyses were performed using SPM8 for MEG/EEG (Wellcome Department of Cognitive Neurology, London, UK; www.fil.ion.ucl.ac.uk/spm/) and custom MATLAB code (The MathWorks). The artifact-free EEG data were segmented into 7500 ms epochs ranging from 1500 ms before base stimulus onset to 1750 ms after comparison stimulus offset. Time–frequency (TF) representations of spectral power between 4 and 40 Hz were obtained by applying a tapered sliding window fast Fourier transform (FFT) using a single Hanning taper and an adaptive time window of seven cycles length. Analysis of higher frequency bands (>40 Hz), using a multitapered FFT on the undecimated data, yielded no significant effects. To avoid edge effects at lower frequencies, the TF data were analyzed only within −600 and 5000 ms relative to onset of f1. Evoked power was computed for each stimulus condition by applying the TF transform to the average waveform, effectively retaining only phase-locked activity (see Fig. 1B). For analysis of induced power, for each stimulus condition, the average waveform was subtracted from the waveform of each individual trial before applying the TF transform to the single trial data. The averaged TF spectra then yielded an estimate of purely induced (non-phase-locked) oscillatory power, uncontaminated by evoked (phase-locked) responses (see Fig. 2A). Evolution of spectral power over time was expressed as percentage amplitude changes relative to a prestimulus baseline period (600–200 ms before base stimulus onset), effecting a standardization of power levels across frequencies. Changes in standardized induced power over time were referred to as event-related desynchronization/synchronization (ERD/ERS) (Pfurtscheller and Aranibar, 1977), denoting relative power decreases or increases, respectively.
Figure 2.

Overview of induced responses observed during the task (A). Grand average induced power for the same stimulus condition and channels as in Figure 1B. The dashed rectangles highlight the time–frequency windows of the event-related beta ERD (left), subsequent beta rebound (right), and sustained alpha ERS (bottom). B–D, Scalp topographies and SPM source reconstructions for the TF windows outlined in A. Blue indicates a decrease (ERD), and red indicates an increase (ERS) in source power relative to prestimulus baseline. In D, results for a representative 500 ms time window are shown (750–1250 ms FWHM) (see Materials and Methods, Source localization).
Statistical analysis.
Parametric modulations of oscillatory activity were analyzed by weighting the induced spectra across conditions with a zero-centered parametric contrast vector expressing a linear relationship to the stimulation frequency. This approach is comparable with computing for each time–frequency bin the slope of a linear fit. Under the null hypothesis of no linear relationship, the parametric contrast is expected to be zero. The contrast spectra were subjected to mass-univariate statistical analysis on the group level, using one-sample t tests as implemented in SPM (for details, see Kiebel et al., 2005). This involved convolution of the individual TF contrasts with a 3 Hz × 300 ms [full width at half-maximum (FWHM)] Gaussian kernel (see below) and computing for each TF bin a t value that reflected the significance of the contrast. Time–frequency bins in which the linear contrast was significantly different from zero were considered “significantly monotonic” (cf. Romo et al., 1999). Family-wise errors (FWEs) in time–frequency space were controlled using random field theory (RFT). RFT approximates the probability that a multidimensional statistical map exceeds some height or extent by chance, under the assumption that the error terms approximate a smooth random field with a Gaussian distribution (Worsley et al., 1996; Brett et al., 2003). Convolving the map with a Gaussian smoothing kernel before analysis ensures this assumption. The RFT method is routinely used in statistical analysis of functional imaging data and has been shown to be readily applicable to parametric EEG statistics in time–frequency space (Kilner et al., 2005). We used RFT as implemented in SPM8 to determine at each channel the FWE-corrected probability that a cluster of significantly monotonic TF bins may have been obtained by chance. A cluster was thereby defined as a group of adjacent TF bins that all exceed a threshold of p < 0.01 (cluster-defining threshold) (Kilner et al., 2005). The FWE-corrected significance (pcluster) of a cluster of a given size was then determined using the distribution of the expected Euler characteristic, given the smoothness of the map, under the null hypothesis of a continuous random field. To account for multiple comparisons across channels, only clusters exceeding a conservative FWE-corrected threshold of pcluster < 0.005 were considered significant. If a significant TF cluster was identified, cluster-based inference was complemented by conventional linear trend analysis of the average ERD/ERS in the respective frequency band, pooled over those neighboring channels in which a similar effect was observed.
Source localization.
The sources of oscillatory EEG activity were modeled using source reconstruction as implemented in SPM8 (Friston et al., 2006). For each participant, a forward model was constructed, using a 8196 vertex template cortical mesh coregistered to the individual electrode positions via three fiducial markers. The lead field of the forward model was computed using the three-shell BEM EEG head model available in SPM8. Before model inversion, the raw data were bandpass filtered around the frequency band of interest. Source estimates were then computed on the canonical mesh using multiple sparse priors (Friston et al., 2008) under group constraints (Litvak and Friston, 2008), including the data from all conditions of interest. TF contrasts were used to summarize oscillatory source power for specific frequency bands, and at specific times, as three-dimensional images. This entailed convolving the single-trial source activity with a series of Morlet projectors and weighting the average power from each condition with a Gaussian window centered on the time interval of interest. For evoked power, the projectors were applied to the averaged trials. Representative time–frequency windows for source analysis were chosen on the basis of the individual channel level results. Event-related increases/decreases in oscillatory source power were expressed relative to source power during a prestimulus baseline, the length of which was adjusted to match the length of the poststimulus periods of interest. For these analyses, because of the length of the available prestimulus interval, time windows of interest (i.e., size of the Gaussian weighting window) were restricted to a maximum of 500 ms (FWHM). Source power increases/decreases, and parametric modulations of source power across conditions, were statistically analyzed on the group level, using conventional SPM t tests and regression statistics, respectively. Statistical parametrical maps were thresholded at p < 0.001, using RFT on the cluster level to control for FWE in source space (pcluster < 0.05, whole-brain FWE). The SPM anatomy toolbox (Eickhoff et al., 2005) was used to establish cytoarchitectonic reference where possible.
Analysis of performance-related differences.
Only correct discrimination trials were included in the main analyses. For additional analysis of performance-related differences, for each subject and stimulation frequency pairing, an equal (i.e., the minimum) number of correct and incorrect trials were randomly selected. The above analyses were then applied to the equal-numbered subsets of correct and incorrect trials, respectively. Given relatively high performance levels (see Results, Behavioral results), these analyses were based on only a fraction of the original trials, which implies considerably reduced statistical power. For statistical comparisons, the data were collapsed over those channels and frequency bins exhibiting a significant effect in the main analyses.
Results
Behavioral results
On average, 80.4% of the stimulus pairs were correctly discriminated. The average response time was 188 ms after comparison stimulus offset. The accuracy levels/response times for the different base stimulus frequencies (21, 26, 31, and 36 Hz) were 81.3%/188 ms, 84.0%/177 ms, 81.3%/178 ms, and 74.8%/209 ms, respectively. Linear trend analysis revealed no evidence for a systematic relationship between base stimulus frequency and accuracy or response times (both values of p > 0.05). Also, no systematic relationship between the frequency of the comparison stimulus (16–41 Hz) and the behavioral measures was found (both values of p > 0.05).
Stimulus-evoked EEG responses
Figure 1B illustrates the stimulus-evoked EEG activity over somatosensory areas during the discrimination task, for an exemplary stimulus condition (base, 26 Hz; comparison, 31 Hz). Vibrotactile stimulation evoked prominent frequency-specific “steady-state” responses, which were source-localized focally in primary somatosensory cortex (SI) contralateral to the stimulated hand (Fig. 1C, source cluster covers Brodmann areas 3b, 1, and 2). Properties of such vibrotactile evoked steady-state responses have been described in detail previously (Tobimatsu et al., 1999; Nangini et al., 2006; Giabbiconi et al., 2007). We examined to what extent the frequency-specific evoked responses were related to subjects' performance in the frequency discrimination task. Figure 1D illustrates for equal-sized subsets of correct and false discrimination trials (see Materials and Methods) the average narrowband evoked activity at the frequencies of base (f1) and comparison (f2) stimulation, respectively, pooled across all stimulus conditions. The data were collapsed over those channels exhibiting the strongest steady-state responses overall (F2, F4, FC2, CP2, CP4, P2, P4). Statistical analysis showed that the steady-state responses evoked by the base (f1) stimuli were of comparable size for correct and incorrect trials (0–1250 ms; all time bins, p > 0.05). In contrast, between 3100 and 4250 ms, the steady-state responses evoked by the comparison (f2) stimuli were significantly stronger for correct than for incorrect trials (all time bins, p < 0.05).
Also evident in the evoked EEG activity (Fig. 1B) were broadband transient responses (4–15 Hz) after the onsets of f1 and f2. These transient responses showed a similar, albeit more widespread, source distribution over sensorimotor cortex as the steady-state responses (including contralateral SI and bilateral SII) (data not shown) but were invariant to the frequency of stimulation and were unrelated to frequency discrimination performance (4–15 Hz; 0–400 and 3000–400 ms; all time bins, p > 0.30). Central to the present study, no transient or steady-state evoked activity was evident during the retention interval.
Induced EEG responses
The overall ERD/ERS responses observed during the task are summarized in Figure 2A, for the same stimulus condition and channels as in Figure 1B. Subtracting the average waveform effectively eliminated transient and steady-state evoked responses. Tactile stimulation induced a power decrease (ERD) in the beta band (15–25 Hz) in bilateral sensorimotor areas (Fig. 2B), followed by a rebound (ERS) of beta power in contralateral sensorimotor cortex after stimulation offset (Fig. 2C). Moreover, we observed a sustained increase (ERS) in occipital alpha power (8–12 Hz) (Fig. 2D) throughout the retention interval. No performance-related differences in the overall ERD/ERS responses during correct compared with incorrect discrimination trials were observed (paired t test, all pcluster > 0.05, FWE).
Parametric modulations of induced activity by f1
The main focus of the present analysis was on possible parametric modulations of oscillatory EEG activity as a function of the (base-)stimulus frequency held in working memory. Statistical analysis of parametric contrasts (see Materials and Methods) revealed significant TF clusters (pcluster < 0.005, FWE) of induced power modulations in the alpha band (8–12 Hz) and in the upper beta frequency range (20–25 Hz).
The modulation in the alpha band was significant between 400 and 2300 ms after stimulus onset (Fig. 3A) (pcluster < 0.005, FWE) and was strongest over posterior channels (Fig. 3B). Figure 3C shows the average posterior alpha-band ERS (8–12 Hz) for the different stimulus frequencies (f1), together with the significance of the linear trend analysis across conditions. A significant linear relationship between the average alpha-band ERS and the base stimulus frequency was evident during late encoding and early retention (450–1500; all time bins, p < 0.05). During that time window, the linear modulation accounted for 34% (η2) of the ERS variance (p < 0.05). Parametric analysis of alpha source power estimates for the time window of the strongest effect (750–1250 ms) allocated the linear modulation to dorsal occipitoparietal cortex (BA 18 and superior parietal lobe) (Fig. 3B). Analysis of equal-numbered subsets of correct and incorrect discrimination trials suggested a by tendency stronger alpha power modulation during correct discrimination, but the difference failed to reach statistical significance (all time bins, p > 0.05) (see supplemental Fig. 1, available at www.jneurosci.org as supplemental material).
Figure 3.
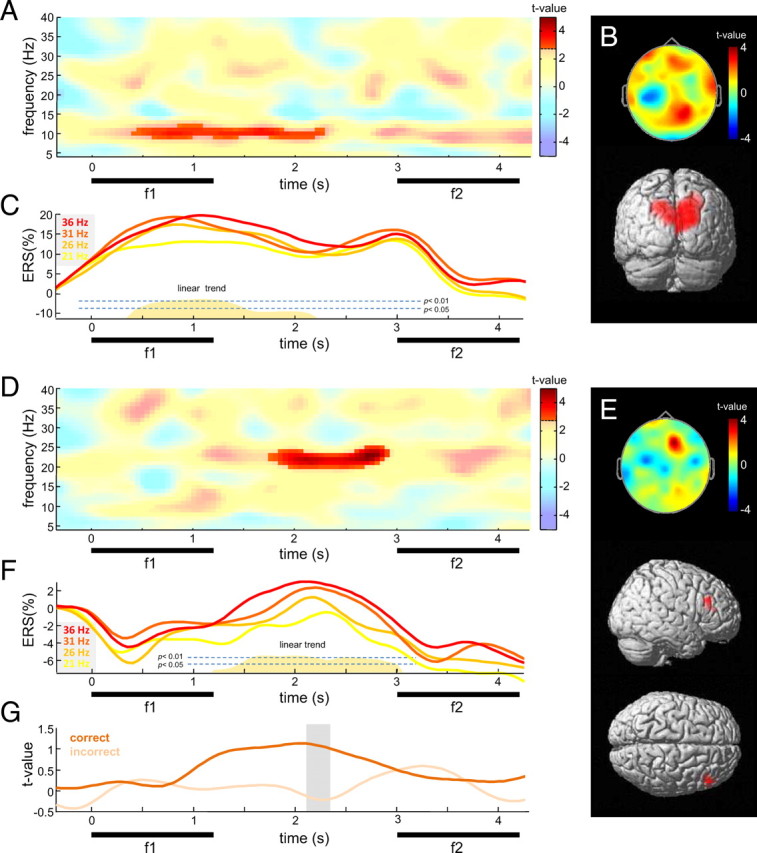
Modulations of induced activity by f1. A, Statistical parametric TF map reflecting a linear relationship between induced power and f1 (see Materials and Methods, Statistical analysis) for representative posterior electrode P4. Saturated colors delineate time–frequency cluster exceeding a FWE-corrected cluster threshold of pcluster < 0.005. B, Scalp topography and source reconstruction of the parametric alpha power modulation (750–1250 ms FWHM) (see Materials and Methods). C, Average posterior alpha-band ERS (8–12 Hz) for the different base stimulus frequencies. The height of the orange shading indicates significance of a linear relationship to f1. D, Same as in A, for representative frontal electrode F2. E, Scalp topography and source reconstruction of the parametric beta power modulation (2000–2500 ms FWHM) (see Materials and Methods). F, Average frontal beta-band ERS (20–25 Hz) for each of the four base stimulus frequencies. The height of the orange shading indicates significance of a linear relationship to f1. G, Linear contrast statistics for the modulation of frontal beta power, for equal-numbered subsets of correct and incorrect trials (see Materials and Methods). The gray shading indicates time window of a significant difference.
The modulation in beta power was significant between 1750 and 2950 ms after base stimulus onset (Fig. 3D) (pcluster < 0.005, FWE) and was most pronounced over right frontal recording sites (Fig. 3E). Notably, the average frontal beta ERD/ERS (Fig. 3F) preserved a significantly monotonic representation of the previously encoded stimulus frequency throughout the retention interval, as confirmed by linear trend analysis (1450–2950 ms; all time bins, p < 0.05). During that time window, the linear modulation accounted for 42% (η2) of the ERS variance (p < 0.01). Parametric analysis of beta source power estimates (20–25 Hz) in a representative time window (2000–2500 ms) allocated the modulation to a focal source in the right inferior frontal gyrus (IFG) (BA 45) (Fig. 3E). Figure 3G displays the linear regression statistics for the modulation in beta power (20–25 Hz, pooled over F2, F4, FC2, FC4) for equal-sized subsets of correct and incorrect trials, respectively. The beta power modulation was significantly stronger for correct than for incorrect trials from 2150 to 2350 ms after stimulus onset (all time bins, p < 0.05).
Parametric modulations of induced activity by f2
We further examined to what extent oscillatory activity was modulated by the frequency of the comparison stimulus (f2, 16–41 Hz), using the same analysis strategy as above for f1. The parametric analysis revealed a significant modulation in posterior alpha power during late encoding of the comparison stimulus (Fig. 4A) (pcluster < 0.005, FWE), which was strongest over posterior sites. Figure 4B shows the average posterior alpha ERD/ERS during presentation of the comparison stimulus (f2) for each of the six comparison frequencies (16–41 Hz). To exclude a contribution of residual differences attributable to the earlier modulation by f1 (compare Fig. 3C), the ERD/ERS data were baseline-corrected with respect to a time window preceding onset of f2 (2800–3000 ms, note y-axis). Across the six comparison stimulus frequencies (16–41 Hz), a significant linear relationship was evident from 700 ms after onset of the comparison stimulus until 250 ms after stimulus offset (all time bins, p < 0.05). During that time window, the linear modulation accounted for 27% (η2) of the ERS variance (p < 0.05). Note that a strictly monotonic order was observed across all comparison stimulus frequencies except for the 41 Hz condition. In addition to the modulation in posterior alpha, the analysis revealed no indications of any additional modulations of induced activity in response to f2.
Figure 4.

Modulations of induced activity by f2. A, Statistical parametric TF map reflecting a linear relationship between induced power and f2 (see Materials and Methods, Statistical analysis) for representative electrode P4. Saturated colors delineate significant time–frequency cluster (pcluster < 0.005, FWE), for which scalp topography is shown. B, Average posterior alpha ERS (8–12 Hz) for the different comparison stimulus frequencies. The height of the orange shading indicates significance of a linear relationship to f2.
Discussion
The present study focused on identifying human EEG correlates that reflect parametric processing of vibrotactile frequency in a somatosensory working memory task. During stimulation, vibrotactile frequency was mirrored by the frequency of steady-state evoked responses, which were reliably source-localized in contralateral SI. Later, toward stimulus offset, frequency-dependent modulations in induced alpha activity were evident over dorsal occipital areas. Most important for the present study, throughout the retention interval, the frequency of the previously encoded vibrotactile stimulus was systematically reflected by a graded prefrontal beta-band response, which preserved a monotonic representation of the stimulus frequency held in working memory. Overall, whereas early processing of vibrotactile frequency in SI was accompanied by stimulus-locked (i.e., evoked) EEG responses, frequency processing in nonprimary cortical areas was reflected by non-stimulus-locked (i.e., induced) oscillatory activity.
Vibrotactile stimulation can drive neuronal populations in primary somatosensory cortex (Mountcastle et al., 1990; Salinas et al., 2000) and this has routinely been detected in the form of steady-state evoked responses in human EEG/MEG (Tobimatsu et al., 1999; Nangini et al., 2006; Giabbiconi et al., 2007). However, as in each of the previous studies, we found that these stimulus-evoked responses were clearly restricted to the duration of the stimulus and thus are highly unlikely to reflect memory-related activity. In addition to stimulus-evoked (i.e., phase-locked) activity, early sensorimotor areas also showed a well known sequence of induced (i.e., non-phase-locked) responses, consisting of a beta-band ERD (15–25 Hz) during stimulation, and a subsequent rebound (ERS) after stimulus offset (Bauer et al., 2006; Neuper et al., 2006; Trenner et al., 2008). The induced responses in early sensorimotor areas were, however, not modulated by the frequency of stimulation. In line with a large body of previous work (for review, see Romo and Salinas, 2003; but see Harris et al., 2002), our results yield no evidence for a sustained representation of vibrotactile frequency in early somatosensory areas.
Although previous MEG work has pointed to a role of human SII activity during vibrotactile frequency retention, the present EEG analysis showed no significant effects in the frequency range in which SII activity has previously been observed (100–150 Hz) (Haegens et al., 2010). This difference in finding might be explained by differences in the sensitivity of the two techniques to sulcal versus gyral sources (Malmivuo and Plonsey, 1995). In particular, high-frequency (i.e., low-amplitude) oscillations from SII, which is hidden in the lateral sulcus, may be more difficult to detect using EEG than MEG.
Like the previous MEG work, however, we found that stimulus retention was accompanied by a sustained increase (ERS) of oscillatory alpha activity over occipital areas. Such posterior alpha ERS during nonvisual task demands has been assumed to reflect the top–down controlled inhibition or disengagement of task-irrelevant areas (Haegens et al., 2010) (for review, see Klimesch et al., 2007), but the precise role of cortical alpha is still debated. Interestingly, the present parametric analysis showed that the alpha ERS over dorsal visual areas was stronger during processing of higher vibrotactile frequencies. This finding may suggest that “faster” vibrations recruited increased tactile attention, and thereby stronger inhibition of task-irrelevant visual areas. Alternatively, as no systematic differences in behavioral performance were observed, the parametric effect may point to an additional, more direct computational role of cortical alpha (Hummel and Gerloff, 2005; Palva and Palva, 2007) and may indicate that extrastriate areas are actively involved in processing of vibrotactile frequency. Such interpretation would be in line with a number of recent functional imaging studies reporting responses to tactile stimuli in regions traditionally regarded as purely visual (Amedi et al., 2001; Beauchamp et al., 2007; but see Cate et al., 2009, for evidence that cross-modal activations in extrastriate areas can be mediated by attentional factors). Central to the present study, however, modulations in posterior alpha were observed not only in response to the to-be-memorized stimulus (f1) but also in response to the comparison stimulus (f2). Thus, the frequency-dependent extrastriate activity is likely related to processing, but not necessarily to maintenance of the frequency information in working memory.
The central finding of the present study is a sustained modulation of prefrontal beta activity throughout the retention interval. Although we are aware of the limited spatial resolution of EEG source reconstructions, the modulation was source-localized focally to the IFG. This area corresponds architectonically to the inferior convexity of macaque PFC, in which so far the clearest electrophysiological correlates of parametric somatosensory working memory have been found (for review, see Romo and Salinas, 2003). The IFG has further been shown to be crucially involved in human somatosensory processing (Hagen et al., 2002) and tactile memory (Kostopoulos et al., 2007). In particular, in the recent functional imaging study by Kostopoulos et al., IFG activity was specifically related to memory for certain attributes of vibrotactile stimuli, like frequency or duration. Extending the recognized role of the region in somatosensory memory processing, the present study for the first time yields evidence for parametric coding of vibrotactile frequency in human IFG, which complements previous reports of parametric working memory in nonhuman primates (Romo et al., 1999).
Whereas in the seminal work by Romo et al. (1999) a complex pattern of concomitant increases and decreases in the firing of individual PFC neurons has been identified, a monotonic increase of large-scale oscillatory beta activity was observed in the present study. We can only speculate to what extent these different types of parametric activity are possibly related, as the precise link between oscillatory EEG responses and the underlying neural activity remains poorly understood. Only very recently, low (<8 Hz) and high (>30 Hz), but not midrange, frequency power in the EEG has been found to correlate with the mean firing rate in the underlying neural population (Whittingstall and Logothetis, 2009). In this light, both the present finding of a systematic modulation in such midrange activity, and the complex modulations in single-cell activity reported by Romo et al. (1999), appear compatible with a large-scale mechanism that may operate independently of changes in mean firing rate.
Given the established interpretation of oscillatory power changes in terms of population (de-)synchronization (Pfurtscheller and Aranibar, 1977), our results join growing evidence for a functional role of neuronal synchrony in short-term memory (for review, see Jensen et al., 2007; Klimesch et al., 2009). Most relevant to the present discussion, a very recent study by Siegel et al. (2009) has demonstrated stimulus-dependent synchronization of prefrontal beta oscillations during visual object retention. Expanding the previous evidence, the present results demonstrate dynamic beta synchronization during retention of a quantitative stimulus attribute in somatosensory working memory. As such effect was not evident in response to the comparison stimulus (f2), the frequency-dependent modulation of prefrontal beta during retention of the base stimulus (f1) can be assumed to reflect active working memory processing rather than merely stimulation-induced sensorimotor activity.
Importantly, no modulation in prefrontal delay activity was evident when frequency discrimination failed. Thus, the graded beta response associated with successful discrimination is likely to reflect behaviorally relevant information. Moreover, we found no performance-related differences in the overall somatosensory evoked or induced responses elicited by the to-be-memorized stimuli (f1), indicating that the degraded modulation of oscillatory activity on incorrect trials cannot be easily attributed to deficient stimulus representations in sensory areas. Notably, however, on incorrect trials, the strength of the somatosensory steady-state responses evoked by the comparison stimuli (f2) was reduced. This effect can be interpreted in terms of a difference in stimulus-directed attention (Giabbiconi et al., 2007), suggesting that, on incorrect trials, in the absence of a modulation in prefrontal beta, the comparison stimuli were less attended. Overall, this pattern of results is indeed what one may expect if the modulation in prefrontal delay activity reflects task-relevant contents of a sensory memory trace; without a proper representation of the base stimulus in working memory, careful evaluation of the comparison stimulus, in a delayed-match-to-sample task, is pointless. Such interpretation is supported by an additional analysis of response time-related differences (see supplemental material, available at www.jneurosci.org), indicating that the evoked, but not the induced frequency-specific activity covaried with attentional/motivational factors. Together, these findings highlight the role of sensory working memory as a potential source of failure in two-interval frequency discrimination, which may add to known accuracy limits of vibrotactile frequency coding in SI (Luna et al., 2005).
In sum, our results suggest that in a delayed-match-to-sample task, stimulus-locked EEG responses relate to early stages of vibrotactile frequency processing in primary somatosensory cortex, whereas non-stimulus-locked oscillatory activity can reflect frequency processing in nonprimary cortical areas. Thereby, active processing of a tactile presented stimulus attribute may also involve systematic modulations of alpha activity over occipitoparietal areas. Most importantly, we report evidence for a parametric representation of vibrotactile frequency in human working memory, as reflected by graded synchronization of beta oscillations in prefrontal cortex, during stimulus maintenance. The findings complement previous evidence for parametric somatosensory working memory in nonhuman primates and promote the study of content-specific sensory memory processing in human subjects.
Footnotes
This work was supported by a grant from the German Federal Ministry of Education and Research (Bundesministerium für Bildung und Forschung) (F.B.). We thank V. Litvak and K. Friston for technical support, and S. Hanslmayr and R. Auksztulewicz for helpful advice.
References
- Amedi A, Malach R, Hendler T, Peled S, Zohary E. Visuo-haptic object-related activation in the ventral visual pathway. Nat Neurosci. 2001;4:324–330. doi: 10.1038/85201. [DOI] [PubMed] [Google Scholar]
- Bauer M, Oostenveld R, Peeters M, Fries P. Tactile spatial attention enhances gamma-band activity in somatosensory cortex and reduces low-frequency activity in parieto-occipital areas. J Neurosci. 2006;26:490–501. doi: 10.1523/JNEUROSCI.5228-04.2006. [DOI] [PMC free article] [PubMed] [Google Scholar]
- Beauchamp MS, Yasar NE, Kishan N, Ro T. Human MST but not MT responds to tactile stimulation. J Neurosci. 2007;27:8261–8267. doi: 10.1523/JNEUROSCI.0754-07.2007. [DOI] [PMC free article] [PubMed] [Google Scholar]
- Brett M, Penny W, Kiebel S. Human brain function II. London: Academic; 2003. An introduction to random field theory. [Google Scholar]
- Cate AD, Herron TJ, Yund EW, Stecker GC, Rinne T, Kang X, Petkov CI, Disbrow EA, Woods DL. Auditory attention activates peripheral visual cortex. PLoS One. 2009;4:e4645. doi: 10.1371/journal.pone.0004645. [DOI] [PMC free article] [PubMed] [Google Scholar]
- Eickhoff SB, Stephan KE, Mohlberg H, Grefkes C, Fink GR, Amunts K, Zilles K. A new SPM toolbox for combining probabilistic cytoarchitectonic maps and functional imaging data. Neuroimage. 2005;25:1325–1335. doi: 10.1016/j.neuroimage.2004.12.034. [DOI] [PubMed] [Google Scholar]
- Friston K, Henson R, Phillips C, Mattout J. Bayesian estimation of evoked and induced responses. Hum Brain Mapp. 2006;27:722–735. doi: 10.1002/hbm.20214. [DOI] [PMC free article] [PubMed] [Google Scholar]
- Friston K, Harrison L, Daunizeau J, Kiebel S, Phillips C, Trujillo-Barreto N, Henson R, Flandin G, Mattout J. Multiple sparse priors for the M/EEG inverse problem. Neuroimage. 2008;39:1104–1120. doi: 10.1016/j.neuroimage.2007.09.048. [DOI] [PubMed] [Google Scholar]
- Giabbiconi CM, Trujillo-Barreto NJ, Gruber T, Müller MM. Sustained spatial attention to vibration is mediated in primary somatosensory cortex. Neuroimage. 2007;35:255–262. doi: 10.1016/j.neuroimage.2006.11.022. [DOI] [PubMed] [Google Scholar]
- Haegens S, Osipova D, Oostenveld R, Jensen O. Somatosensory working memory performance in humans depends on both engagement and disengagement of regions in a distributed network. Hum Brain Mapp. 2010;31:26–35. doi: 10.1002/hbm.20842. [DOI] [PMC free article] [PubMed] [Google Scholar]
- Hagen MC, Zald DH, Thornton TA, Pardo JV. Somatosensory processing in the human inferior prefrontal cortex. J Neurophysiol. 2002;88:1400–1406. doi: 10.1152/jn.2002.88.3.1400. [DOI] [PubMed] [Google Scholar]
- Harris JA, Miniussi C, Harris IM, Diamond ME. Transient storage of a tactile memory trace in primary somatosensory cortex. J Neurosci. 2002;22:8720–8725. doi: 10.1523/JNEUROSCI.22-19-08720.2002. [DOI] [PMC free article] [PubMed] [Google Scholar]
- Hummel F, Gerloff C. Larger interregional synchrony is associated with greater behavioral success in a complex sensory integration task in humans. Cereb Cortex. 2005;15:670–678. doi: 10.1093/cercor/bhh170. [DOI] [PubMed] [Google Scholar]
- Jensen O, Kaiser J, Lachaux JP. Human gamma-frequency oscillations associated with attention and memory. Trends Neurosci. 2007;30:317–324. doi: 10.1016/j.tins.2007.05.001. [DOI] [PubMed] [Google Scholar]
- Kiebel SJ, Tallon-Baudry C, Friston KJ. Parametric analysis of oscillatory activity as measured with EEG/MEG. Hum Brain Mapp. 2005;26:170–177. doi: 10.1002/hbm.20153. [DOI] [PMC free article] [PubMed] [Google Scholar]
- Kilner JM, Kiebel SJ, Friston KJ. Applications of random field theory to electrophysiology. Neurosci Lett. 2005;374:174–178. doi: 10.1016/j.neulet.2004.10.052. [DOI] [PubMed] [Google Scholar]
- Klimesch W, Sauseng P, Hanslmayr S. EEG alpha oscillations: the inhibition-timing hypothesis. Brain Res Rev. 2007;53:63–88. doi: 10.1016/j.brainresrev.2006.06.003. [DOI] [PubMed] [Google Scholar]
- Klimesch W, Freunberger R, Sauseng P Advance online publication. Oscillatory mechanisms of process binding in memory. Neurosci Biobehav Rev. 2009 doi: 10.1016/j.neubiorev.2009.10.004. Retrieved March 6, 2010. [DOI] [PubMed] [Google Scholar]
- Kostopoulos P, Albanese MC, Petrides M. Ventrolateral prefrontal cortex and tactile memory disambiguation in the human brain. Proc Natl Acad Sci U S A. 2007;104:10223–10228. doi: 10.1073/pnas.0700253104. [DOI] [PMC free article] [PubMed] [Google Scholar]
- Litvak V, Friston K. Electromagnetic source reconstruction for group studies. Neuroimage. 2008;42:1490–1498. doi: 10.1016/j.neuroimage.2008.06.022. [DOI] [PMC free article] [PubMed] [Google Scholar]
- Luna R, Hernández A, Brody CD, Romo R. Neural codes for perceptual discrimination in primary somatosensory cortex. Nat Neurosci. 2005;8:1210–1219. doi: 10.1038/nn1513. [DOI] [PubMed] [Google Scholar]
- Malmivuo J, Plonsey R. Bioelectromagnetism. New York: Oxford UP; 1995. [Google Scholar]
- Mountcastle VB, Steinmetz MA, Romo R. Frequency discrimination in the sense of flutter: psychophysical measurements correlated with postcentral events in behaving monkeys. J Neurosci. 1990;10:3032–3044. doi: 10.1523/JNEUROSCI.10-09-03032.1990. [DOI] [PMC free article] [PubMed] [Google Scholar]
- Nangini C, Ross B, Tam F, Graham SJ. Magnetoencephalographic study of vibrotactile evoked transient and steady-state responses in human somatosensory cortex. Neuroimage. 2006;33:252–262. doi: 10.1016/j.neuroimage.2006.05.045. [DOI] [PubMed] [Google Scholar]
- Neuper C, Wörtz M, Pfurtscheller G. ERD/ERS patterns reflecting sensorimotor activation and deactivation. Prog Brain Res. 2006;159:211–222. doi: 10.1016/S0079-6123(06)59014-4. [DOI] [PubMed] [Google Scholar]
- Palva S, Palva JM. New vistas for alpha-frequency band oscillations. Trends Neurosci. 2007;30:150–158. doi: 10.1016/j.tins.2007.02.001. [DOI] [PubMed] [Google Scholar]
- Pasternak T, Greenlee MW. Working memory in primate sensory systems. Nat Rev Neurosci. 2005;6:97–107. doi: 10.1038/nrn1603. [DOI] [PubMed] [Google Scholar]
- Pfurtscheller G, Aranibar A. Event-related cortical desynchronization detected by power measurements of scalp EEG. Electroencephalogr Clin Neurophysiol. 1977;42:817–826. doi: 10.1016/0013-4694(77)90235-8. [DOI] [PubMed] [Google Scholar]
- Preuschhof C, Heekeren HR, Taskin B, Schubert T, Villringer A. Neural correlates of vibrotactile working memory in the human brain. J Neurosci. 2006;26:13231–13239. doi: 10.1523/JNEUROSCI.2767-06.2006. [DOI] [PMC free article] [PubMed] [Google Scholar]
- Romo R, Salinas E. Flutter discrimination: neural codes, perception, memory and decision making. Nat Rev Neurosci. 2003;4:203–218. doi: 10.1038/nrn1058. [DOI] [PubMed] [Google Scholar]
- Romo R, Brody CD, Hernández A, Lemus L. Neuronal correlates of parametric working memory in the prefrontal cortex. Nature. 1999;399:470–473. doi: 10.1038/20939. [DOI] [PubMed] [Google Scholar]
- Romo R, Hernández A, Zainos A, Lemus L, Brody CD. Neuronal correlates of decision-making in secondary somatosensory cortex. Nat Neurosci. 2002;5:1217–1225. doi: 10.1038/nn950. [DOI] [PubMed] [Google Scholar]
- Salinas E, Hernandez A, Zainos A, Romo R. Periodicity and firing rate as candidate neural codes for the frequency of vibrotactile stimuli. J Neurosci. 2000;20:5503–5515. doi: 10.1523/JNEUROSCI.20-14-05503.2000. [DOI] [PMC free article] [PubMed] [Google Scholar]
- Siegel M, Warden MR, Miller EK. Phase-dependent neuronal coding of objects in short-term memory. Proc Natl Acad Sci U S A. 2009;106:21341–21346. doi: 10.1073/pnas.0908193106. [DOI] [PMC free article] [PubMed] [Google Scholar]
- Tobimatsu S, Zhang YM, Kato M. Steady-state vibration somatosensory evoked potentials: physiological characteristics and tuning function. Clin Neurophysiol. 1999;110:1953–1958. doi: 10.1016/s1388-2457(99)00146-7. [DOI] [PubMed] [Google Scholar]
- Trenner MU, Heekeren HR, Bauer M, Rössner K, Wenzel R, Villringer A, Fahle M. What happens in between? Human oscillatory brain activity related to crossmodal spatial cueing. PLoS One. 2008;3:e1467. doi: 10.1371/journal.pone.0001467. [DOI] [PMC free article] [PubMed] [Google Scholar]
- Whittingstall K, Logothetis NK. Frequency-band coupling in surface EEG reflects spiking activity in monkey visual cortex. Neuron. 2009;64:281–289. doi: 10.1016/j.neuron.2009.08.016. [DOI] [PubMed] [Google Scholar]
- Worsley KJ, Marrett S, Neelin P, Vandal AC, Friston KJ, Evans AC. A unified statistical approach for determining significant signals in images of cerebral activation. Hum Brain Mapp. 1996;4:58–73. doi: 10.1002/(SICI)1097-0193(1996)4:1<58::AID-HBM4>3.0.CO;2-O. [DOI] [PubMed] [Google Scholar]