

Abstract
It has been suggested that the caudate nucleus, the input stage of the basal ganglia, facilitates and suppresses saccade initiation based on its anatomical characteristics. Although the involvement of the caudate nucleus in saccade facilitation has been shown previously, it is still unclear whether the caudate nucleus is also involved in saccade suppression. Here, we revealed the direct involvement of the caudate nucleus in saccade suppression by electrical microstimulation in behaving monkeys. We delivered microstimulation to the caudate nucleus while monkeys performed the prosaccade (look toward a peripheral visual stimulus) and antisaccade (look away from the stimulus) paradigm. The reaction times of contralateral saccades were prolonged on both prosaccade and antisaccade trials. The suppression effects on reaction times were stronger on prosaccade trials compared with antisaccade trials. The analysis of reaction time distributions using the linear approach to threshold with ergodic rate model (LATER model) revealed that microstimulation prolonged reaction times by reducing the rate of rise to the threshold for saccade initiation. Microstimulation also worsened correct performance rates for contralateral saccades. The same microstimulation prolonged and/or shortened the reaction times of ipsilateral saccades, although the effects were not as consistent as those on contralateral saccades. We conclude that caudate signals are sufficient to suppress contralateral saccades and influence saccadic decision by controlling contralateral and ipsilateral saccade commands at the same time.
Introduction
It has been shown that the caudate nucleus, the major input stage of the basal ganglia (BG), is involved in saccade control (Hikosaka et al., 2000). The caudate nucleus integrates input from a number of cortical areas involved in saccade control, processes the incoming information by its intrinsic circuits, and sends signals to the output stage of the BG through multiple BG pathways before influencing structures tightly related to saccade control, such as the superior colliculus (SC) and frontal eye field (FEF). The following physiological findings are consistent with the idea that signals issued by the caudate nucleus facilitate saccade initiation. The activity of individual caudate neurons is stronger when saccade reaction times are shorter (Itoh et al., 2003; Watanabe et al., 2003; Watanabe and Munoz, 2009). Microstimulation delivered to the caudate nucleus evokes contralateral saccades (Kitama et al., 1991). These observations are consistent with the existence of BG pathways originating from the caudate nucleus that facilitate saccade initiation (facilitation pathway, also known as direct pathway) (Hikosaka et al., 2000). However, despite the consistency of the multiple lines of evidence, it is highly unlikely that saccade facilitation is the only function that the caudate nucleus is involved in for saccade control.
It has been hypothesized that saccade suppression is one of the key functions of the caudate nucleus because of the following anatomical structures. In addition to BG pathways that facilitate saccade initiation, a subset of projection neurons in the caudate nucleus give rise to BG pathways that could potentially suppress saccade initiation (suppression pathways, also known as indirect pathways) (Hikosaka et al., 2000). Furthermore, recent physiological experiments have shown that GABAergic intrinsic circuits within the caudate nucleus, including recurrent connections of GABAergic projection neurons and inhibitory interneurons, control the output of projection neurons (Tepper et al., 2004).
Despite the well known extrinsic and intrinsic caudate neural circuits that could contribute to saccade suppression, it has never been established whether such neural circuits are actually involved in behavioral control. Furthermore, we have hypothesized previously that a subset of caudate neurons might be specialized for saccade suppression (Watanabe and Munoz, 2009, see also Ford and Everling, 2009) that could be critical to perform the antisaccade paradigm (look away from a visual stimulus) (Hallett, 1978). In this study, we used electrical microstimulation to show direct evidence supporting the caudate involvement in saccade suppression while monkeys performed a prosaccade (look toward a peripheral visual stimulus) and antisaccade paradigm (Fig. 1A).
Figure 1.
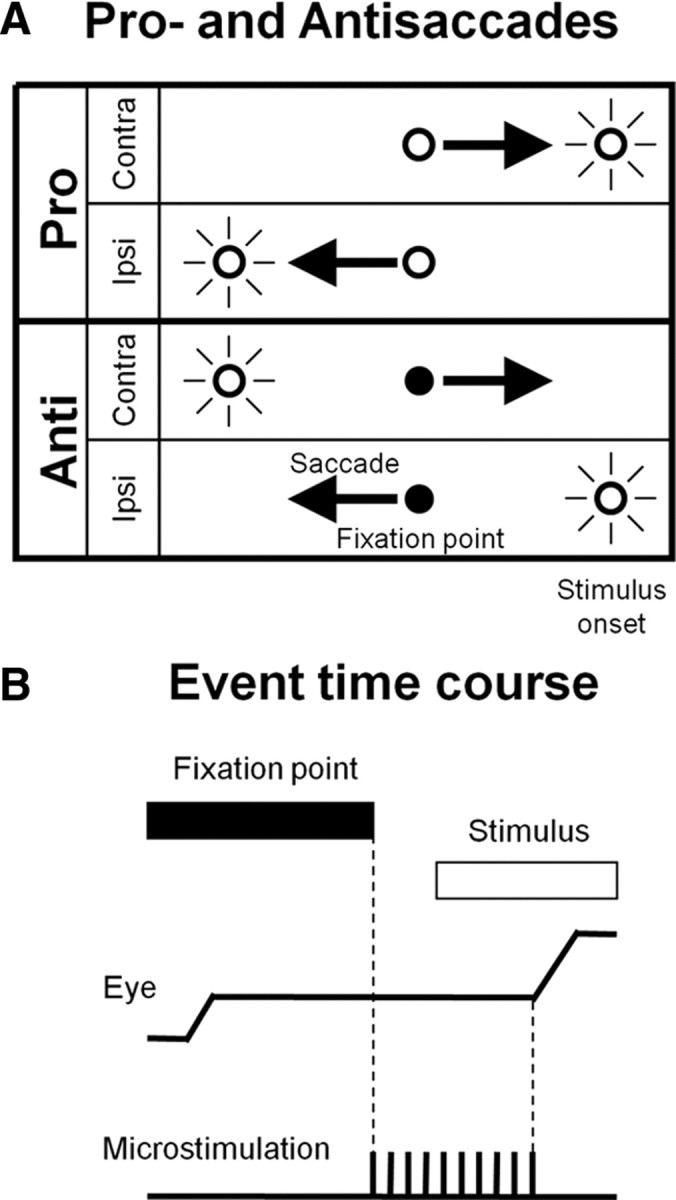
Prosaccade and antisaccade paradigm. A, Four task conditions. Fixation point color indicates monkeys to perform a prosaccade (look toward a stimulus) or an antisaccade (look away from the stimulus). “Contra” and “Ipsi” indicate saccade directions. B, Event time course. After fixation point appearance, monkeys acquire the fixation point and generate a saccade in response to stimulus appearance. The fixation point disappeared 200 ms before stimulus appearance. On randomly chosen 50% of trials, microstimulation was delivered from 200 ms before stimulus appearance to saccade initiation.
Materials and Methods
General.
All experimental procedures were conducted in accordance with the Canadian Council on Animal Care policy on the use and care of laboratory animals and approved by the Queen's University Animal Care Committee. Surgical and electrophysiological procedures were described previously (Marino et al., 2008). Briefly, two male monkeys (Macaca mulatta), weighing 13.5 and 10 kg, were implanted with scleral search coils, a head-restraining device and a recording chamber under the gaseous isofluorane (2–2.5%) anesthesia with the analgesic buprenorphine (0.01–0.02 mg/kg i.m.). Horizontal and vertical eye positions were sampled at 1 kHz using the search coil technique (Robinson, 1963; Fuchs and Robinson, 1966; Judge et al., 1980). The onset and end of saccades were identified by radial eye velocity criteria (threshold: 30 °/s). Trials with reaction times shorter than 70 ms or longer than 600 ms were excluded from the subsequent data analyses. The recording chamber (circular, 19 mm inside diameter, tilted by 34 degrees laterally and 13 degrees anteriorly in monkey O and 36 degrees laterally in monkey E) was placed on the left hemisphere in both monkeys to cover the head and body of the caudate nucleus. Using the grid system (Crist et al., 1988), we mapped the caudate nucleus as widely as possible in the area allowed by each chamber.
Behavioral paradigm.
We trained the monkeys to perform a randomly interleaved prosaccade (look toward a stimulus) and antisaccade paradigm (Fig. 1A) (Bell et al., 2000). Each trial was preceded by a 600 ms intertrial interval during which the screen was illuminated with a diffuse light. After the removal of the background light, a fixation point appeared and the monkeys were required to direct eyes toward the fixation point within 30 s. After they maintained fixation for 900–1200 ms, a red stimulus was presented either 15° left or right from the fixation point and the monkeys generated a saccade either toward the stimulus (prosaccade) or to the opposite direction of the stimulus (antisaccade) within 600 ms based upon fixation point color (red: pro, green: anti). The task instruction (pro/anti) was given from fixation point appearance. Following the saccade initiation, another 150–350 ms fixation was required on the peripheral red stimulus on prosaccade trials or on a peripheral green stimulus that appeared at the mirror position of the peripheral red stimulus only after saccade onset on antisaccade trials. The red and green peripheral stimuli remained visible until the end of the trial. The monkeys received a liquid reward after each correct performance. A 200 ms gap was introduced before stimulus appearance during which the fixation point disappeared and the monkeys maintained fixation on the blank screen. We adopted this temporal gap to increase direction error saccades toward the opposite of the required direction defined by the current instruction and stimulus location (Bell et al., 2000) for the analysis of correct performance rates. Microstimulation (see below) was delivered from 200 ms before stimulus appearance until saccade initiation on half of the trials (Fig. 1B). The pro/anti instructions, left/right stimulus locations and microstimulation/control trials were randomly interleaved in each block of trials.
Electrical microstimulation.
Constant-current charge-balanced biphasic pulses (anode first, 500 μs pulse width, 50 μA, 100 Hz) were delivered to the caudate nucleus via a monopolar tungsten microelectrode (impedance: 0.1–1 MΩ, Frederick Haer) using a stimulator (Grass S88, Grass Tech) attached to a pair of constant current stimulus isolation units (Grass PSIU6). We chose the stimulation parameters based on previous reports (Kitama et al., 1991; Nakamura and Hikosaka, 2006). Current was measured by the voltage drop across a 1 kΩ resistor in series with the return lead of the stimulator. The current amplitude was lowered when microstimulation occasionally evoked saccades during the prosaccade and antisaccade paradigm (5 and 1 sites among 85 and 94 sites for data analyses in monkeys O and E, respectively) or when the suppression effect of microstimulation was too strong to record enough correct trials for the analyses of reaction times (2 sites in monkey E). We confirmed similar results when we excluded these stimulation sites from data analyses. Microstimulation with different frequencies (50 – 333 Hz) induced similar effects on the reaction times of prosaccades and antisaccades (see supplemental Fig. 1, available at www.jneurosci.org as supplemental material). Stimulation sites in which microstimulation influenced saccade reaction times in at least one of the four conditions during the prosaccade and antisaccade paradigm (t test p < 0.05 with Bonferroni correction) were reconstructed in Figure 2 and confirmed by magnetic resonance imaging (MRI, 3 tesla, Siemens) in one monkey (monkey O) whose implant was compatible with MRI. For each penetration, we identified the caudate nucleus electrophysiologically and determined stimulation sites evenly along the penetration. The average distance of consecutive stimulation sites was 1100 ± 500 μm (mean ± SD). We confirmed similar results at a subset of stimulation sites in which we encountered task related neurons (supplemental Fig. 2, available at www.jneurosci.org as supplemental material).
Figure 2.
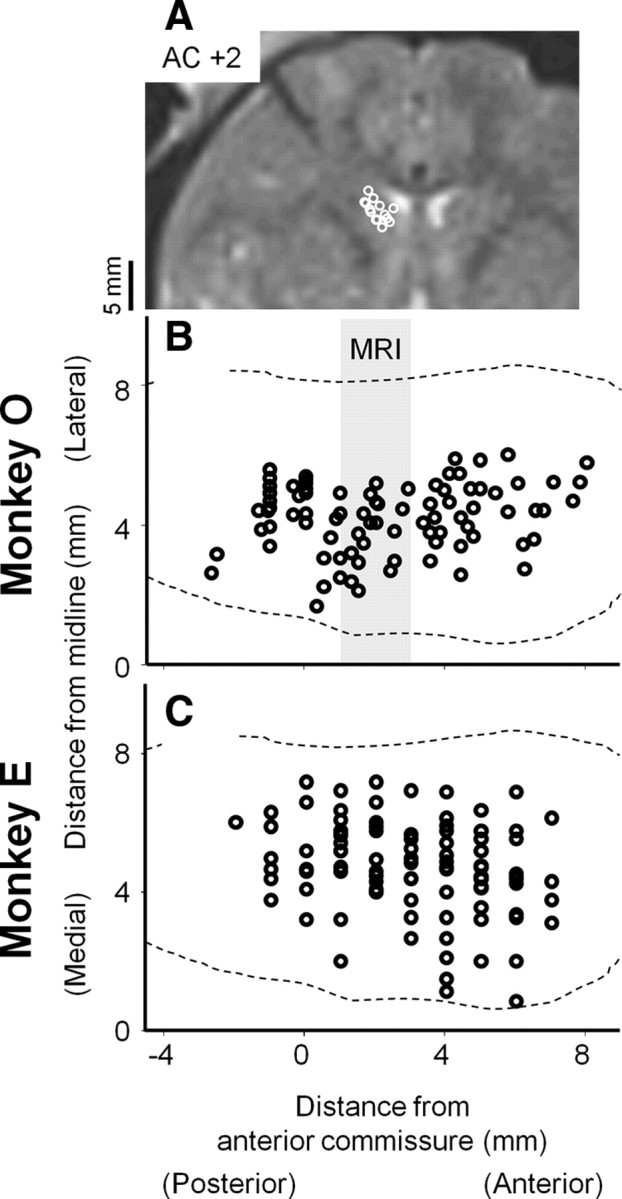
Reconstructed stimulation sites. A, MRI image at 2 mm anterior from the anterior commissure in monkey O. B, C, reconstructed site projected on the horizontal plane in monkey O (n = 85) (B) and E (n = 94) (C), respectively. Sites included in the gray stripes labeled as MRI in B are superimposed on the MRI image (A). Broken lines indicate the boundaries of the caudate nucleus (François et al., 1996). In monkey E, the level of the anterior commissure is estimated at 19 mm anterior from the intermeatal line (Mikula et al., 2007).
Reaction time index.
To quantify the effect of microstimulation on saccade reaction times, we calculated the following index (DeAngelis and Uka, 2003):
 |
and
where M and C stands for microstimulation and control trials, respectively. Both M and C indicate average reaction times. RMSerror was calculated using Equation 2. SSE is the squared sum error around the averages on control and microstimulation trials. N indicates the total number of trials. The absolute value of this index is close to 1 if the difference between the average reaction times on microstimulation and control trials (M-C) is much larger than the variance in reaction times (RMSerror), while it is close to zero when the difference between the average reaction times is negligible compared with the variance in reaction times. Positive and negative indices indicate that microstimulation prolonged and shortened reaction times, respectively.
Linear approach to threshold with ergodic rate model.
To infer the effects of microstimulation on the saccadic initiation process, we fit the linear approach to threshold with ergodic rate model (LATER model) (Carpenter and Williams, 1995) to reaction time distributions on correct trials. The probability density function of the LATER model is given by the following equation (Nakahara et al., 2006):
 |
and
 |
where μr and σr2 denote the mean and variance of the rate of rise to the threshold of saccade initiation, which obeys a Gaussian distribution, respectively, and s denotes the distance from the baseline to the threshold.
In parallel with the main LATER unit given by Equation 3, we adopted a secondary LATER unit, whose mean of the rate of rise to the threshold (μr) was fixed to zero, to explain short reaction time distributions (Carpenter and Williams, 1995). The probability density function of the two parallel LATER units is given by the following equation:
where subscripts m and s denote the main and secondary LATER units, respectively, and F(t) denotes a cumulative distribution function.
We fit the models to the reaction time distributions of correct responses on control and microstimulation trials at the same time using the following two constraints: alteration in the rate of rise (μr) or distance (s) of the main LATER unit (Carpenter and Williams, 1995; Reddi et al., 2003). Under the constraint of alteration in the rate of rise, μ0 was allowed to change independently while σ0 was fixed to the same value on control and microstimulation trials. On the other hand, under the constraint of alteration in the distance, ether μ0 or σ0 was allowed to change independently while the ratio of these parameters (μ0/σ0 = μr/σr), which does not depend on the distance s, was fixed to the same value on control and microstimulation trials. σ0 in the secondary LATER unit was allowed to change independently on control and microstimulation trials. The same conclusion was obtained when σ0 in the secondary LATER unit was fixed to the same value on control and microstimulation trials.
We searched for a set of parameters by a simplex algorithm to maximize the logarithm of maximum likelihood estimates calculated using Equation 5. We applied this optimization procedure to the same reaction time distributions repeatedly with a number of different starting points to ensure the global maximum likelihood solution. We judged which constraint (alteration in the rate of rise or distance) fit to reaction time distributions better by subtracting the maximum log likelihood estimates of each constraint (ΔLL) (Reddi et al., 2003). Positive and negative values of ΔLL support alterations in the rate of rise and distance, respectively. Using ΔLL, we also calculated the posterior probabilities of a Bayesian information criterion by the following equation (Wagenmakers, 2007):
 |
If the probability is close to 1, it supports the alteration in the rate of rise to the threshold for saccade initiation. On the other hand, if the probability is close to zero, it supports the alternative hypothesis of alteration in the distance between the baseline and threshold. We also calculated Pearson's χ2 values with parameters optimized by the procedure described above. We set the quantiles of 0.1, 0.3, 0.5, 0.7, and 0.9 for the calculation of χ2 values (Ratcliff and Tuerlinckx, 2002).
Δ correct performance rate.
To evaluate the effects of microstimulation on the performance of monkeys, we quantified behavioral outcome by calculating correct performance rates (the number of correct trials divided by the sum of the numbers of correct, direction error and no saccade trials, no saccade trials are defined as trials without saccade initiation before stimulus disappearance) on both control and microstimulation trials separately. We then defined Δ correct performance rates by subtracting correct performance rates on microstimulation trials from those on control trials. Positive and negative values of Δ correct performance rates indicate worsened and improved performance by microstimulation, respectively. We confirmed similar results when we calculated direction error rates (the number of direction error trials divided by the sum of the numbers of correct, direction error and no saccade trials) instead of correct performance rates. This is because no saccade trials were observed rarely at the majority of stimulation sites so that correct performance rates and direction error rates were determined mostly by the numbers of correct and direction error trials.
Results
We delivered microstimulation at 238 sites in the caudate nucleus (117 and 121 in monkeys O and E, respectively) when monkeys performed the randomly interleaved prosaccade and antisaccade paradigm (Fig. 1). Of these, we identified 185 stimulation sites (89 and 96 in monkeys O and E, respectively) in which microstimulation influenced saccade reaction times in at least one of the four conditions (Fig. 1A) (t test p < 0.05 with Bonferroni correction). We focus on 179 of the 185 stimulation sites (85 and 94 in monkeys O and E, respectively) in which the numbers of correct trials were sufficient for analyses (five trials at least) on both control and microstimulation trials in all the four conditions.
During experiments performed at the 179 stimulation sites that were analyzed, the behavior of our monkeys on control trials was consistent with previous reports in both humans (Hallett, 1978; Fischer and Weber, 1992; Dafoe et al., 2007) and monkeys (Bell et al., 2000; Watanabe and Munoz, 2009). Antisaccade reaction times were longer than prosaccade reaction times (average reaction times ± SD in monkey O; pro: 210 ± 45 ms, anti: 246 ± 68 ms, t test: df = 13,970, t = −36.4, p < 0.0001, monkey E; pro: 207 ± 54 ms, anti: 242 ± 69 ms, t test: df = 14,856, t = −38.8, p < 0.0001). Correct performance rates were worse on antisaccade trials compared with prosaccade trials (monkey O; pro: 95%, anti: 87%, χ2 test, df = 2, χ2 = 326, p < 0.0001, monkey E; pro: 95%, anti: 93%, χ2 test, df = 2, χ2 = 28.0, p < 0.0001).
Example stimulation site
Figure 3 shows the effects of microstimulation on contralateral antisaccades at an example stimulation site in monkey O. Microstimulation delayed the initiation of correct antisaccades toward the contralateral direction (upward deflections). Furthermore, it also worsened behavioral performance by increasing direction error saccades toward the stimulus presented on the ipsilateral side.
Figure 3.

Effects of microstimulation on contralateral antisaccades at an example stimulation site in monkey O. A, Control trials. B, Microstimulation trials. Each trace indicates the time course of horizontal eye positions. Upward and downward deflections indicate correct (contralateral) and direction error (ipsilateral) saccades, respectively. The eye position traces are aligned with stimulus appearance.
Figure 4 quantifies the effects of microstimulation on contralateral and ipsilateral antisaccades at the same stimulation site. We confirmed that, when contralateral antisaccade were required, reaction times were longer (Fig. 4A) (t test: df = 130, t = −8.2, p < 0.0001) and correct performance rates were lower (Fig. 4B) (χ2 test, df = 1, χ2 = 34, p < 0.001) on microstimulation trials compared with control trials. In contrast with contralateral antisaccades, microstimulation shortened the reaction times of ipsilateral antisaccades (Fig. 4C) (t test: df = 111, t = 3.4, p < 0.005) without influencing the rate of correct trials (Fig. 4D) (χ2 test, df = 1, χ2 = 2.0, p > 0.1). Similar results were observed on prosaccade trials at the same stimulation site (data not shown).
Figure 4.

Quantitative analyses of microstimulation effects on antisaccades at the same stimulation site in Figure 3. A, B, Cumulative reaction time distributions (A) and correct and direction error rates (B) on contralateral antisaccade trials. C, D, Ipsilateral antisaccade trials. Dotted and continuous lines in A and C indicate control and microstimulation trials, respectively. White and black bars in B and D indicate control and microstimulation trials, respectively. “Error” in B and D indicates direction error trials. No saccade trials are not included in this figure because they were not observed during this experiment.
In the following analyses, we show that the suppression effects of microstimulation on contralateral saccades (prolonged reaction times and worsened correct performance rates) were replicated at the majority of stimulation sites. However, the effects of microstimulation on ipsilateral saccades were not consistent across stimulation sites.
Contralateral saccade reaction times
Figure 5 summarizes the effects of microstimulation on reaction times. On both prosaccade and antisaccade trials, the distributions of reaction time indices were biased toward positive values in both monkeys (Fig. 5A,B) (t test results in monkey O; pro: df = 84, t = 14.3, p < 0.0001, anti: t = 14.4, p < 0.0001, monkey E; pro: df = 93, t = 13.3, p < 0.0001, anti: t = 9.6, p < 0.0001), indicating that microstimulation prolonged the reaction times of both prosaccade and antisaccades toward the contralateral direction. The effects were stronger on prosaccades compared with antisaccades in monkey E (Fig. 5B) (paired t test; df = 93, t = 2.2, p < 0.05). We confirmed this result when we focused on the majority of stimulation sites in which reaction time indices were positive on both prosaccade and antisaccade trials (paired t test; df = 72, t = 2.9, p < 0.01). In monkey O, we also found the stronger suppression effects of microstimulation on prosaccades compared with antisaccades when we focused on the majority of stimulation sites in which reaction time indices were positive on both prosaccade and antisaccade trials (Fig. 5A) (df = 72, t = 2.4, p < 0.05), although the difference did not reach statistical significance when the remaining stimulation sites were included in the analysis (df = 84, t = 0.18, p > 0.8). These results suggest that microstimulation recruited neural circuits suppressing contralateral saccade and the circuits influence prosaccade initiation more strongly than antisaccade initiation.
Figure 5.

Summary of microstimulation effects on saccade reaction times. A, Contralateral saccades in monkey O (n = 85). B, Contralateral saccades in monkey E (n = 94). C, Ipsilateral saccades in monkey O (n = 85). D, Ipsilateral saccades in monkey E (n = 94). x- and y-axes indicate reaction time indices for prosaccades and antisaccades, respectively. Positive and negative values of reaction time indices indicate prolonged and shortened reaction times by microstimulation, respectively.
Ipsilateral saccade reaction times
The effects of microstimulation on ipsilateral saccades were not as consistent as those on contralateral saccades. In monkey E (Fig. 5D), we found that microstimulation prolonged reaction times on both prosaccade and antisaccade trials (pro: df = 93, t = 10.4, p < 0.0001, anti: t = 6.9, p < 0.0001). The suppression effects of microstimulation on the reaction times of ipsilateral saccades were not different between prosaccade and antisaccade trials regardless of whether we focused on the majority of stimulation sites in which reaction time indices were positive on both prosaccade and antisaccade trials (df = 62, t = −1.4, p > 0.1) or all stimulation sites were included (df = 93, t = 1.4, p > 0.1).
In monkey O (Fig. 5C), the effects of microstimulation on ipsilateral saccade reaction times were inconsistent across stimulation sites. At the population level, microstimulation prolonged reaction times on prosaccade trials (df = 84, t = 2.7, p < 0.01), while reaction times were shortened on antisaccade trials (df = 84, t = −2.9, p < 0.01). The data points in Figure 5C were distributed below the equality line (df = 84, t = 7.4, p < 0.0001). We confirmed similar results when we focused on data points for which reaction time indices were positive (df = 26, t = 2.1, p < 0.05) and negative (df = 31, t = 6.0, p < 0.0001) on both prosaccade and antisaccade trials. These results indicate that the suppression effects of microstimulation were stronger on prosaccade trials compared with antisaccade trials and/or the facilitation effects of microstimulation were stronger on antisaccade trials compared with prosaccade trials in this monkey.
LATER model for saccade reaction times
The LATER model has been used to infer the saccadic decision process by quantifying reaction time distributions (Carpenter and Williams, 1995; Reddi et al., 2003). The model assumes a constant baseline activity and linear rise of a decision signal. Saccades are triggered when the decision signal reaches a threshold. According to this model, reaction times can be prolonged or shortened by changing the rate of rise in the decision signal and/or the distance between the baseline and threshold.
To understand how microstimulation influenced saccadic decision processes for saccade initiation, we fit the LATER model to the distributions of reaction times on control and microstimulation trials under the following two constraints: (1) alteration only in the rate of rise to the threshold and (2) alteration only in the distance between the baseline and threshold by microstimulation. The two constraints can be judged qualitatively by plotting reaction time distributions on the reciprobit (Fig. 6) (Carpenter and Williams, 1995; Reddi et al., 2003; Nakahara et al., 2006). If microstimulation changed the rate of rise to the threshold, the distributions of reaction times on control and microstimulation trials should shift along the x-axis. In contrast, if microstimulation changed the distance between the baseline and threshold for saccade initiation, the two distributions of reaction times should swivel at a common y-intercept (Carpenter and Williams, 1995; Reddi et al., 2003; Nakahara et al., 2006).
Figure 6.

LATER model for contralateral saccades with alteration in rate of rise. A, Prosaccade trials in monkey O. B, Antisaccade trials in monkey O. C, Prosaccade trials in monkey E. D, Antisaccade trials in monkey E. Stimulation sites in which microstimulation prolonged reaction times (t test p < 0.05) were collapsed. Circles and triangles indicate cumulative distributions of reaction times with 10 ms bin width on control and microstimulation trials, respectively. Continuous lines indicate the results of LATER model fittings under the constraint of alteration in the rate of rise to the threshold for saccade initiation. Fitting results under the constraint of alteration in the distance between the baseline and threshold are shown in supplemental Figure 3, available at www.jneurosci.org as supplemental material. The summary of fitting results is shown in Table 1. See also supplemental Figures 4 and 5, available at www.jneurosci.org as supplemental material, for the fitting results of ipsilateral saccades.
Figure 6A shows an example of a fitting result for contralateral prosaccades in monkey O. For this analysis, we collapsed stimulation sites in which microstimulation prolonged the reaction times of contralateral prosaccades (t test p < 0.05). As shown on the reciprobit, microstimulation caused parallel shift rather than swiveling, suggesting that microstimulation prolonged reaction times by attenuating the rate of rise to the threshold. This qualitative observation is supported by the fact that the maximum log likelihood was higher under the first constraint of alteration only in the rate of rise to the threshold compared with the second constraint of alteration only in the distance between the baseline and threshold (ΔLL = 93). We confirmed similar results for the rest of the datasets for contralateral saccades in which microstimulation prolonged reaction times (Fig. 6) (see Table 1 for the summary of fitting results and supplemental Fig. 3, available at www.jneurosci.org as supplemental material, for fittings with alteration in the distance between the baseline and threshold). These results suggest that microstimulation prolonged the reaction times of both prosaccades and antisaccades toward the contralateral direction by attenuating the rate of rise to the threshold for saccade initiation. As for ipsilateral saccades, the results of LATER model fittings were inconsistent across datasets (Table 1; supplemental Figs. 4, 5, available at www.jneurosci.org as supplemental material).
Table 1.
Summary of LATER model fittings
| Dir | Monk | Inst | Sites (n) | Control (n) | Stim (n) | χ2 Rate | χ2 Dist | ΔLL | BIC prob. |
|---|---|---|---|---|---|---|---|---|---|
| Contra | O | P | 70 | 4392 | 2809 | 85 | 273 | 93 | 1.0 |
| Contra | O | A | 54 | 2287 | 1486 | 124 | 281 | 81 | 1.0 |
| Contra | E | P | 73 | 2772 | 2572 | 33 | 179 | 75 | 1.0 |
| Contra | E | A | 60 | 2260 | 1985 | 32 | 130 | 45 | 1.0 |
| Ipsi | O | P | 27 | 1894 | 1293 | 159 | 226 | 46 | 1.0 |
| Ipsi | O | A | 36 | 2050 | 1865 | 111 | 90 | −14 | 1.3e-6 |
| Ipsi | E | P | 54 | 2377 | 2151 | 161 | 127 | −16 | 1.0e-7 |
| Ipsi | E | A | 46 | 1787 | 1462 | 74 | 148 | 28 | 1.0 |
″Dir,″ ″Monk,″ and ″Inst″ indicate saccade directions (Contra: contralateral, Ipsi: ipsilateral), monkeys, and task instructions (P: prosaccade, A: antisaccade), respectively. ″Sites (n),″ ″Control (n),″ and ″Stim (n)″ indicate the numbers of stimulation sites, control trials, and stimulation trials, respectively. ″χ2 Rate″ and ″χ2 Dist″ indicate Pearson χ2 statistics for the constraints of alteration in the rate of rise to the threshold and alteration in the distance between the baseline and threshold for saccade initiation, respectively. ″BIC Prob.″ indicates the posterior probabilities of a Bayesian information criterion.
Correct performance rates
As shown in Figures 3 and 4, microstimulation influenced behavioral outcome (ratio of correct and error responses) by controlling the saccade initiation process. We confirmed the effects of microstimulation on correct performance rates at the population level (Fig. 7). In the following analysis, we collapsed data from two monkeys because we confirmed similar results when analyzed them separately.
Figure 7.

Summary of microstimulation effects on correct performance rates. A, Correlation between Δ correct performance rates and reaction time indices on contralateral antisaccade trials. B, Contralateral prosaccade trials. C, Ipsilateral antisaccade trials. D, Ipsilateral prosaccade trials. The number of data points in all panels is 179 (85 and 94 in monkeys O and E, respectively). Positive and negative values of Δ correct performance rates indicate worsened and improved performance by microstimulation, respectively. Positive correlation between Δ correct performance rates and reaction time indices indicates that correct performance rates were worsened when microstimulation prolonged saccade reaction times. We found the same positive correlations using Spearman's (nonparametric) correlation coefficients (data not shown). We confirmed similar results when data from two monkeys were analyzed separately.
On contralateral antisaccade trials, we found a significant positive correlation between Δ correct performance rates and reaction time indices on contralateral antisaccade trials (Fig. 7A) (Pearson's r = 0.48, p < 0.0001). This indicates that antisaccade performance was worsened (higher Δ correct performance rates) when microstimulation suppressed contralateral antisaccade initiation (higher reaction time indices). Similar effects of microstimulation on correct performance rates were observed on contralateral prosaccade trials (Fig. 7B) (Pearson's r = 0.39, p < 0.0001), ipsilateral antisaccade trials (Fig. 7C) (Pearson's r = 0.45, p < 0.0001), and ipsilateral prosaccade trials (Fig. 7D) (Pearson's r = 0.24, p < 0.001).
It has been suggested that antisaccade performance is determined not only by required antisaccade commands toward the opposite direction of the stimulus, but also by inappropriate saccade commands toward the stimulus (Trappenberg et al., 2001; Munoz and Everling, 2004). Indeed, we found that correct performance rates for contralateral antisaccades were worsened when microstimulation shortened the reaction times of ipsilateral prosaccades in response to the same stimulus (Fig. 8A) (Pearson's r = −0.57, p < 0.0001). Similar results were observed for contralateral prosaccades (Fig. 8B) (r = −0.39, p < 0.0001), ipsilateral antisaccades (Fig. 8C) (r = −0.34, p < 0.0001) and ipsilateral prosaccades (Fig. 8D) (r = −0.39, p < 0.0001). These results indicate that microstimulation influenced behavioral outcome by controlling contralateral and ipsilateral saccades at the same time.
Figure 8.

Relationships between microstimulation effects on correct performance rates and reaction times for saccades toward the opposite directions in response to the same stimulus. A, Correlation between Δ correct performance rates on contralateral antisaccade trials and reaction times indices on ipsilateral prosaccade trials. B, Correct performance rates for contralateral prosaccades and reaction time indices for ipsilateral antisaccades. C, Correct performance rates for ipsilateral antisaccades and reaction time indices for contralateral prosaccades. D, Correct performance rates for ipsilateral prosaccades and reaction time indices for contralateral antisaccades. The number of data points in all panels is 179 (85 and 94 in monkeys O and E, respectively). Negative correlation between Δ correct performance rates and reaction time indices indicates that correct performance rates were worsened when microstimulation facilitated saccades toward the opposite direction. We confirmed the results using Spearman's correlation coefficients (data not shown). We also confirmed similar results when data from two monkeys were analyzed separately.
Saccade gains
In addition to reaction times and correct performance rates, microstimulation also influenced saccade gains. We quantified the effects of microstimulation on horizontal and vertical saccade gains using the same equation as reaction time indices (Eq. 1). We found that horizontal saccade gains were decreased when microstimulation prolonged reaction times in all conditions (Pearson's correlation coefficients, monkey O; anti–contra: r = 0.55, p < 0.0001, anti–ipsi: r = −0.23, p < 0.05, monkey E; pro–contra: r = −0.58, p < 0.0001, pro–ipsi: r = −0.31, p < 0.0005, anti–contra: r = −0.62, p < 0.0001, anti–ipsi: r = −0.49, p < 0.0001), except for contralateral and ipsilateral prosaccade trials in monkey O (pro–contra: r = −0.20, p > 0.05, pro–ipsi: r = −0.00, p > 0.9) (supplemental Fig. 6, available at www.jneurosci.org as supplemental material). We did not observe significant relationships between the effects of microstimulation on reaction times and vertical saccade gains in all conditions (p > 0.2), except for contralateral antisaccade trials in monkey O (r = 0.24, p < 0.05). We did not analyze saccade peak velocities because they change with saccade gains (Bahill et al., 1975), although it has been shown that the activity of caudate neurons is correlated with saccade peak velocities on trial-by-trial basis (Itoh et al., 2003).
These results indicate that microstimulation influenced the saccade execution process in addition to the saccade initiation process, even though it was terminated at saccade initiation (Fig. 1B).
Discussion
By activating caudate neurons artificially with electrical microstimulation, we demonstrated that BG signals are sufficient to suppress contralateral saccades on both prosaccade and antisaccade trials (Figs. 5A,B 7A,B). The same microstimulation also influenced ipsilateral saccades, although the effects were not as consistent as those on contralateral saccades (Figs. 5C,D, 7C,D). In line with our hypothesis based on single neuron recordings in the caudate nucleus (Ford and Everling, 2009; Watanabe and Munoz, 2009), we conclude that signals issued by the caudate nucleus are sufficient to suppress contralateral saccade initiation and control both contralateral and ipsilateral saccade commands at the same time.
Contralateral saccade suppression
Microstimulation prolonged the reaction times of contralateral saccades on both prosaccade and antisaccade trials (Fig. 5A,B). The suppression effects of microstimulation were stronger on prosaccade trials compared with antisaccade trials (Fig. 5A,B). To account for these findings, we extend a hypothetical model we have suggested previously based on single neuron recordings (Fig. 9) (Watanabe and Munoz, 2009).
Figure 9.

Hypothetical schematic diagram for contralateral saccades. There are three types of caudate neurons encoding different saccade signals. ANs encode predominantly automatic saccade commands toward the contralateral stimulus. VNs encode predominantly voluntary saccade commands toward the contralateral direction regardless of stimulus locations. SNs encode similar saccade commands with VNs, except that they show strong activation on ipsilateral antisaccade trials. ANs and VNs give rise to the facilitation (direct) pathway and suppress the tonic activity of SNr neurons to release the SC for contralateral saccade initiation. In contrast, SNs give rise to the suppression (indirect) pathway and activate SNr neurons to suppress contralateral saccade initiation. To account for the suppression effects of microstimulation on contralateral saccades, we speculate that (A) signals carried by the suppression pathway originated from SNs (indicated by red arrows) are stronger than those carried by the facilitation pathways originated from ANs and VNs. B, Another possibility is that microstimulation activated lateral inhibitory interactions within the caudate nucleus and suppressed the activity of ANs and VNs remote from the stimulation site. To account for the stronger suppression effects of microstimulation on prosaccade reaction times compared with antisaccade reaction times, we hypothesize that the suppression effects on ANs are stronger than those on VNs in both A and B, described by the thickness of the arrows. The suppression pathways are shown by single arrows for simplicity even though they are polysynaptic. Pathways from the SNr to cortex are omitted for simplicity.
In this model (Fig. 9A), there are three types of saccade related neurons in the caudate nucleus. Automatic neurons (ANs) encode saccade commands toward the contralateral stimulus. They give rise to the facilitation pathway, suppress the tonic activity of GABAergic neurons in the substantia nigra pars reticulata (SNr) and facilitate the activity of neurons in the superior colliculus (SC) for saccades initiation. Volitional neurons (VNs) encode contralateral saccade commands regardless of stimulus locations. They also give rise to the facilitation pathway and facilitate saccade initiation. Suppression neurons (SNs) encode saccade commands similar to VNs, but they show strong activation on ipsilateral antisaccade trials. In contrast to ANs and VNs, SNs give rise to the suppression pathway and activate SNr neurons to suppress saccade initiation.
It is reasonable to speculate that microstimulation enhanced the inhibitory signals from the SNr to the SC to account for its suppression effects on contralateral saccades. Such enhanced activity of SNr neurons could be achieved by signals carried by the suppression pathway. However, a simple assumption would be that microstimulation activated all three types of caudate neurons equally. Accordingly, we speculate that artificial signals carried by the suppression pathway are amplified before they reach to the SNr. This amplification might be achieved by complicated neural circuits within the suppression pathway (Smith et al., 1998) and/or direct cortical input to the suppression pathway (Nambu et al., 2002). Another possibility is that microstimulation suppressed caudate neurons giving rise to the facilitation pathway located remote from the stimulation site by lateral inhibitory interactions (Fig. 9B) (Tepper et al., 2004).
To account for the stronger suppression effects of microstimulation on prosaccades compared with antisaccades (Fig. 5A,B), we hypothesize that the suppression effects of microstimulation on the facilitation pathway originated from ANs are stronger than those on the facilitation pathway originated from VNs (Fig. 9A,B). This idea might be consistent with previous reports in which neurons in structures belonging to the suppression pathway show activity consistent with stronger suppression on automatic saccade commands compared with volitional ones (Isoda and Hikosaka, 2008; Yoshida and Tanaka, 2009). This asymmetric suppression is advantageous because suppression of automatic saccades is critical to perform the antisaccade paradigm. This result does not support another possibility that microstimulation mimicked the situation of a dual task paradigm by introducing task irrelevant signals because we should have observed stronger effects on antisaccades compared with prosaccades (Roberts et al., 1994; Stuyven et al., 2000).
The LATER model revealed that microstimulation attenuated the rate of rise to the threshold for saccade initiation (Fig. 6). This result is consistent with our hypotheses described above. It has been suggested that SC neurons integrate cortical excitatory input and BG inhibitory input and accumulate the integrated signal by recurrent excitatory connections until their activity reaches the threshold for saccade initiation (Trappenberg et al., 2001; Saito and Isa, 2003). Assuming that SC neurons correspond to the LATER unit, the integrated signal is one of the major determinants of the rate of rise. We speculate that microstimulation attenuated the integrated signal by enhancing SNr signals. Because microstimulation was delivered until saccade initiation, the integrated signal could be attenuated throughout the accumulation process.
Although it has been shown that microstimulation applied to the caudate nucleus evokes contralateral saccades in cats during free viewing (Kitama et al., 1991), our results cannot be compared with this observation directly because behavioral constraints are very different between these studies. Indeed, in preliminary studies, we found that microstimulation applied to the caudate nucleus biased the vector endpoints of spontaneous saccades toward the contralateral direction at several stimulation sites in which microstimulation also prolonged the reaction times of contralateral saccades during the prosaccade and antisaccade paradigm (manuscript in preparation). We speculate that these results can be explained by interactions between artificial signals created by microstimulation and endogenous signals dependent upon task requirements.
Ipsilateral saccade suppression and facilitation
The effects of microstimulation on ipsilateral saccades were not as consistent as those on contralateral saccades. Although the anatomical locations of the stimulation sites were not different between the two monkeys (Fig. 2), we cannot exclude a possibility that functional architectures at the stimulation sites in the caudate nucleus might differ significantly between the two monkeys. Another possibility that might explain the inconsistency is that strategies controlling antisaccades by redundant neural circuits were different between the two monkeys.
The ipsilateral saccade suppression in monkey E (Fig. 5D) could be the result of activation of BG pathways that control the SC and thalamus in the opposite hemisphere (Jiang et al., 2003; Cebrián et al., 2005). We speculate that mechanisms that suppress contralateral and ipsilateral saccades were recruited independently in monkey E because reaction time indices were not correlated between contralateral and ipsilateral saccades (Pearson's correlation coefficients; pro: r = 0.12, p > 0.2, anti: r = 0.12, p > 0.2, n = 94).
The facilitation of ipsilateral saccades on antisaccade trials in monkey O (Fig. 5C) might be explained by another potential BG pathway that facilitates the SC and/or FEF via thalamus in the opposite hemisphere. However, we suggest another possibility based on the following observation. We found a significant negative correlation between the reaction time indices of prosaccades and antisaccades in response to the contralateral stimulus (pro–contra and anti–ipsi, Pearson's r = −0.24, p < 0.05, n = 85). This suggests that microstimulation facilitated ipsilateral antisaccades when the same microstimulation suppressed prosaccades toward the contralateral stimulus. Accordingly, the facilitation of ipsilateral antisaccades might be caused by the same mechanisms responsible for the suppression of contralateral prosaccades. Assuming competitive inhibitory interactions between different saccade commands (Trappenberg et al., 2001), the suppression of the SC and/or FEF in the same hemisphere with respect to the stimulation site controlling contralateral saccades could facilitate the SC and/or FEF in the opposite hemisphere controlling ipsilateral saccades. This mechanism could explain ipsilateral saccade facilitation, although the site responsible for the competitive interactions is still controversial (e.g., Watanabe et al., 2005; Dorris et al., 2007).
Clinical implications
It has been shown that patients with a wide variety of BG disorders that influence the caudate nucleus show antisaccade deficits (Briand et al., 1999; LeVasseur et al., 2001; Raemaekers et al., 2002; Chan et al., 2005; van der Wee et al., 2006; Peltsch et al., 2008). In contrast, patients with caudate lesions have intact antisaccade performance (Condy et al., 2004). As established by the present study, signals issued by the caudate nucleus are sufficient to control antisaccade performance. However, the following potential mechanism is still possible to reconcile the discrepancy between the clinical studies. In patients with BG disorders, signals issued by dysfunctional BG circuits are strong enough to interfere with action selection processes occurring outside the BG. However, in the intact brain, BG signals might be too weak to contribute to antisaccade control so that caudate lesions do not influence antisaccade performance. However, as suggested by microstimulation, some of the neural mechanisms controlling antisaccade performance could vary between subjects. Patients with caudate lesions might have developed a strategy relying predominantly on action selection mechanisms outside the BG. This is consistent with a recent neuroimaging study in which siblings of schizophrenia patients show intact antisaccade performance without caudate activation (Raemaekers et al., 2002). On the other hand, caudate activation in normal human subjects during antisaccades (Raemaekers et al., 2002) suggests that several BG pathways are recruited to control antisaccade performance.
In addition to the BG pathways originating from the caudate nucleus, there are other potential neural mechanisms, such as fixation neurons in the rostral SC (Everling et al., 1999) and the hyperdirect pathway in the BG (Nambu et al., 2000; Frank et al., 2007), which could contribute to saccade suppression during the antisaccade paradigm. In future research, it will be critical to disentangle this redundant system to understand the causes of antisaccade deficits observed in a wide variety of clinical disorders.
Footnotes
This work was supported by the Canadian Institutes of Health Research (MOP-77734). D.P.M. was supported by the Canadian Research Chair Program. We thank A. Lablans and R. Cranham for animal care, F. Paquin, S. Hickman, R. Pengelly, and M. Lewis for technical assistance, and members in Munoz lab for comments.
References
- Bahill AT, Clark MR, Stark L. The main sequence, a tool for studying human eye movements. Math Biosci. 1975;24:191–204. [Google Scholar]
- Bell AH, Everling S, Munoz DP. Influence of stimulus eccentricity and direction on characteristics of pro- and antisaccades in non-human primates. J Neurophysiol. 2000;84:2595–2604. doi: 10.1152/jn.2000.84.5.2595. [DOI] [PubMed] [Google Scholar]
- Briand KA, Strallow D, Hening W, Poizner H, Sereno AB. Control of voluntary and reflexive saccades in parkinson's disease. Exp Brain Res. 1999;129:38–48. doi: 10.1007/s002210050934. [DOI] [PubMed] [Google Scholar]
- Carpenter RH, Williams ML. Neural computation of log likelihood in control of saccadic eye movements. Nature. 1995;377:59–62. doi: 10.1038/377059a0. [DOI] [PubMed] [Google Scholar]
- Cebrián C, Parent A, Prensa L. Patterns of axonal branching of neurons of the substantia nigra pars reticulata and pars lateralis in the rat. J Comp Neurol. 2005;492:349–369. doi: 10.1002/cne.20741. [DOI] [PubMed] [Google Scholar]
- Chan F, Armstrong IT, Pari G, Riopelle RJ, Munoz DP. Deficits in saccadic eye-movement control in parkinson's disease. Neuropsychologia. 2005;43:784–796. doi: 10.1016/j.neuropsychologia.2004.06.026. [DOI] [PubMed] [Google Scholar]
- Condy C, Rivaud-Péchoux S, Ostendorf F, Ploner CJ, Gaymard B. Neural substrate of antisaccades: role of subcortical structures. Neurology. 2004;63:1571–1578. doi: 10.1212/01.wnl.0000142990.44979.5a. [DOI] [PubMed] [Google Scholar]
- Crist CF, Yamasaki DS, Komatsu H, Wurtz RH. A grid system and a microsyringe for single cell recording. J Neurosci Methods. 1988;26:117–122. doi: 10.1016/0165-0270(88)90160-4. [DOI] [PubMed] [Google Scholar]
- Dafoe JM, Armstrong IT, Munoz DP. The influence of stimulus direction and eccentricity on pro- and anti-saccades in humans. Exp Brain Res. 2007;179:563–570. doi: 10.1007/s00221-006-0817-8. [DOI] [PubMed] [Google Scholar]
- DeAngelis GC, Uka T. Coding of horizontal disparity and velocity by MT neurons in the alert macaque. J Neurophysiol. 2003;89:1094–1111. doi: 10.1152/jn.00717.2002. [DOI] [PubMed] [Google Scholar]
- Dorris MC, Olivier E, Munoz DP. Competitive integration of visual and preparatory signals in the superior colliculus during saccadic programming. J Neurosci. 2007;27:5053–5062. doi: 10.1523/JNEUROSCI.4212-06.2007. [DOI] [PMC free article] [PubMed] [Google Scholar]
- Everling S, Dorris MC, Klein RM, Munoz DP. Role of primate superior colliculus in preparation and execution of anti-saccades and pro-saccades. J Neurosci. 1999;19:2740–2754. doi: 10.1523/JNEUROSCI.19-07-02740.1999. [DOI] [PMC free article] [PubMed] [Google Scholar]
- Fischer B, Weber H. Characteristics of “anti” saccades in man. Exp Brain Res. 1992;89:415–424. doi: 10.1007/BF00228257. [DOI] [PubMed] [Google Scholar]
- Ford KA, Everling S. Neural activity in primate caudate nucleus associated with pro- and anti-saccades. J Neurophysiol. 2009;102:2334–2341. doi: 10.1152/jn.00125.2009. [DOI] [PubMed] [Google Scholar]
- François C, Yelnik J, Percheron G. A stereotaxic atlas of the basal ganglia in macaques. Brain Res Bull. 1996;41:151–158. doi: 10.1016/0361-9230(96)00161-x. [DOI] [PubMed] [Google Scholar]
- Frank MJ, Samanta J, Moustafa AA, Sherman SJ. Hold your horses: impulsivity, deep brain stimulation, and medication in parkinsonism. Science. 2007;318:1309–1312. doi: 10.1126/science.1146157. [DOI] [PubMed] [Google Scholar]
- Fuchs AF, Robinson DA. A method for measuring horizontal and vertical eye movement chronically in the monkey. J Appl Physiol. 1966;21:1068–1070. doi: 10.1152/jappl.1966.21.3.1068. [DOI] [PubMed] [Google Scholar]
- Hallett PE. Primary and secondary saccades to goals defined by instructions. Vision Res. 1978;18:1279–1296. doi: 10.1016/0042-6989(78)90218-3. [DOI] [PubMed] [Google Scholar]
- Hikosaka O, Takikawa Y, Kawagoe R. Role of the basal ganglia in the control of purposive saccadic eye movements. Physiol Rev. 2000;80:953–978. doi: 10.1152/physrev.2000.80.3.953. [DOI] [PubMed] [Google Scholar]
- Isoda M, Hikosaka O. Role for subthalamic nucleus neurons in switching from automatic to controlled eye movement. J Neurosci. 2008;28:7209–7218. doi: 10.1523/JNEUROSCI.0487-08.2008. [DOI] [PMC free article] [PubMed] [Google Scholar]
- Itoh H, Nakahara H, Hikosaka O, Kawagoe R, Takikawa Y, Aihara K. Correlation of primate caudate neural activity and saccade parameters in reward-oriented behavior. J Neurophysiol. 2003;89:1774–1783. doi: 10.1152/jn.00630.2002. [DOI] [PubMed] [Google Scholar]
- Jiang H, Stein BE, McHaffie JG. Opposing basal ganglia processes shape midbrain visuomotor activity bilaterally. Nature. 2003;423:982–986. doi: 10.1038/nature01698. [DOI] [PubMed] [Google Scholar]
- Judge SJ, Richmond BJ, Chu FC. Implantation of magnetic search coils for measurement of eye position: an improved method. Vision Res. 1980;20:535–538. doi: 10.1016/0042-6989(80)90128-5. [DOI] [PubMed] [Google Scholar]
- Kitama T, Ohno T, Tanaka M, Tsubokawa H, Yoshida K. Stimulation of the caudate nucleus induces contraversive saccadic eye movements as well as head turning in the cat. Neurosci Res. 1991;12:287–292. doi: 10.1016/0168-0102(91)90118-i. [DOI] [PubMed] [Google Scholar]
- LeVasseur AL, Flanagan JR, Riopelle RJ, Munoz DP. Control of volitional and reflexive saccades in tourette's syndrome. Brain. 2001;124:2045–2058. doi: 10.1093/brain/124.10.2045. [DOI] [PubMed] [Google Scholar]
- Marino RA, Rodgers CK, Levy R, Munoz DP. Spatial relationships of visuomotor transformations in the superior colliculus map. J Neurophysiol. 2008;100:2564–2576. doi: 10.1152/jn.90688.2008. [DOI] [PubMed] [Google Scholar]
- Mikula S, Trotts I, Stone JM, Jones EG. Internet-enabled high-resolution brain mapping and virtual microscopy. Neuroimage. 2007;35:9–15. doi: 10.1016/j.neuroimage.2006.11.053. [DOI] [PMC free article] [PubMed] [Google Scholar]
- Munoz DP, Everling S. Look away: the anti-saccade task and the voluntary control of eye movement. Nat Rev Neurosci. 2004;5:218–228. doi: 10.1038/nrn1345. [DOI] [PubMed] [Google Scholar]
- Nakahara H, Nakamura K, Hikosaka O. Extended LATER model can account for trial-by-trial variability of both pre- and post-processes. Neural Netw. 2006;19:1027–1046. doi: 10.1016/j.neunet.2006.07.001. [DOI] [PubMed] [Google Scholar]
- Nakamura K, Hikosaka O. Facilitation of saccadic eye movements by postsaccadic electrical stimulation in the primate caudate. J Neurosci. 2006;26:12885–12895. doi: 10.1523/JNEUROSCI.3688-06.2006. [DOI] [PMC free article] [PubMed] [Google Scholar]
- Nambu A, Tokuno H, Hamada I, Kita H, Imanishi M, Akazawa T, Ikeuchi Y, Hasegawa N. Excitatory cortical inputs to pallidal neurons via the subthalamic nucleus in the monkey. J Neurophysiol. 2000;84:289–300. doi: 10.1152/jn.2000.84.1.289. [DOI] [PubMed] [Google Scholar]
- Nambu A, Tokuno H, Takada M. Functional significance of the cortico-subthalamo-pallidal ‘hyperdirect’ pathway. Neurosci Res. 2002;43:111–117. doi: 10.1016/s0168-0102(02)00027-5. [DOI] [PubMed] [Google Scholar]
- Peltsch A, Hoffman A, Armstrong I, Pari G, Munoz DP. Saccadic impairments in huntington's disease. Exp Brain Res. 2008;186:457–469. doi: 10.1007/s00221-007-1248-x. [DOI] [PubMed] [Google Scholar]
- Raemaekers M, Jansma JM, Cahn W, Van der Geest JN, van der Linden JA, Kahn RS, Ramsey NF. Neuronal substrate of the saccadic inhibition deficit in schizophrenia investigated with 3-dimensional event-related functional magnetic resonance imaging. Arch Gen Psychiatry. 2002;59:313–320. doi: 10.1001/archpsyc.59.4.313. [DOI] [PubMed] [Google Scholar]
- Ratcliff R, Tuerlinckx F. Estimating parameters of the diffusion model: approaches to dealing with contaminant reaction times and parameter variability. Psychon Bull Rev. 2002;9:438–481. doi: 10.3758/bf03196302. [DOI] [PMC free article] [PubMed] [Google Scholar]
- Reddi BA, Asrress KN, Carpenter RH. Accuracy, information, and response time in a saccadic decision task. J Neurophysiol. 2003;90:3538–3546. doi: 10.1152/jn.00689.2002. [DOI] [PubMed] [Google Scholar]
- Roberts RJ, Hager LD, Heron C. Prefrontal cognitive processes: working memory and inhibition in the antisaccade task. J Exp Psychol Gen. 1994;123:374–393. [Google Scholar]
- Robinson DA. A method of measuring eye movement using a scleral search coil in a magnetic field. IEEE Trans Biomed Eng. 1963;10:137–145. doi: 10.1109/tbmel.1963.4322822. [DOI] [PubMed] [Google Scholar]
- Saito Y, Isa T. Local excitatory network and NMDA receptor activation generate a synchronous and bursting command from the superior colliculus. J Neurosci. 2003;23:5854–5864. doi: 10.1523/JNEUROSCI.23-13-05854.2003. [DOI] [PMC free article] [PubMed] [Google Scholar]
- Smith Y, Bevan MD, Shink E, Bolam JP. Microcircuitry of the direct and indirect pathways of the basal ganglia. Neuroscience. 1998;86:353–387. doi: 10.1016/s0306-4522(98)00004-9. [DOI] [PubMed] [Google Scholar]
- Stuyven E, Van der Goten K, Vandierendonck A, Claeys K, Crevits L. The effect of cognitive load on saccadic eye movements. Acta Psychol (Amst) 2000;104:69–85. doi: 10.1016/s0001-6918(99)00054-2. [DOI] [PubMed] [Google Scholar]
- Tepper JM, Koós T, Wilson CJ. GABAergic microcircuits in the neostriatum. Trends Neurosci. 2004;27:662–669. doi: 10.1016/j.tins.2004.08.007. [DOI] [PubMed] [Google Scholar]
- Trappenberg TP, Dorris MC, Munoz DP, Klein RM. A model of saccade initiation based on the competitive integration of exogenous and endogenous signals in the superior colliculus. J Cogn Neurosci. 2001;13:256–271. doi: 10.1162/089892901564306. [DOI] [PubMed] [Google Scholar]
- van der Wee NJ, Hardeman HH, Ramsey NF, Raemaekers M, Van Megen HJ, Denys DA, Westenberg HG, Kahn RS. Saccadic abnormalities in psychotropic-naive obsessive-compulsive disorder without co-morbidity. Psychol Med. 2006;36:1321–1326. doi: 10.1017/S0033291706007926. [DOI] [PubMed] [Google Scholar]
- Wagenmakers EJ. A practical solution to the pervasive problems of p values. Psychon Bull Rev. 2007;14:779–804. doi: 10.3758/bf03194105. [DOI] [PubMed] [Google Scholar]
- Watanabe K, Lauwereyns J, Hikosaka O. Neural correlates of rewarded and unrewarded eye movements in the primate caudate nucleus. J Neurosci. 2003;23:10052–10057. doi: 10.1523/JNEUROSCI.23-31-10052.2003. [DOI] [PMC free article] [PubMed] [Google Scholar]
- Watanabe M, Munoz DP. Neural correlates of conflict resolution between automatic and volitional actions by basal ganglia. Eur J Neurosci. 2009;30:2165–2176. doi: 10.1111/j.1460-9568.2009.06998.x. [DOI] [PubMed] [Google Scholar]
- Watanabe M, Kobayashi Y, Inoue Y, Isa T. Effects of local nicotinic activation of the superior colliculus on saccades in monkeys. J Neurophysiol. 2005;93:519–534. doi: 10.1152/jn.00558.2004. [DOI] [PubMed] [Google Scholar]
- Yoshida A, Tanaka M. Enhanced modulation of neuronal activity during antisaccades in the primate globus pallidus. Cereb Cortex. 2009;19:206–217. doi: 10.1093/cercor/bhn069. [DOI] [PubMed] [Google Scholar]