

Abstract
Our capacity to learn movement sequences is fundamental to our ability to interact with the environment. Although different brain networks have been linked with different stages of learning, there is little evidence for how these networks change across learning. We used functional magnetic resonance imaging to identify the specific contributions of the cerebellum and primary motor cortex (M1) during early learning, consolidation, and retention of a motor sequence task. Performance was separated into two components: accuracy (the more explicit, rapidly learned, stimulus–response association component) and synchronization (the more procedural, slowly learned component). The network of brain regions active during early learning was dominated by the cerebellum, premotor cortex, basal ganglia, presupplementary motor area, and supplementary motor area as predicted by existing models. Across days of learning, as performance improved, global decreases were found in the majority of these regions. Importantly, within the context of these global decreases, we found specific regions of the left M1 and right cerebellar VIIIA/VIIB that were positively correlated with improvements in synchronization performance. Improvements in accuracy were correlated with increases in hippocampus, BA 9/10, and the putamen. Thus, the two behavioral measures, accuracy and synchrony, were found to be related to two different sets of brain regions—suggesting that these networks optimize different components of learning. In addition, M1 activity early on day 1 was shown to be predictive of the degree of consolidation on day 2. Finally, functional connectivity between M1 and cerebellum in late learning points to their interaction as a mechanism underlying the long-term representation and expression of a well learned skill.
Introduction
Motor skill learning is the process that mediates the transition from effortful to effortless movement with practice (Willingham, 1998). It includes at least three behaviorally relevant stages: early learning, late learning, and consolidation (Korman et al., 2003; Doyon and Benali, 2005). Early learning is characterized by rapid within-session improvements in performance (Penhune and Doyon, 2005; Bapi et al., 2006), whereas late learning is the slow incremental improvement seen across multiple days of practice (Karni et al., 1995; Penhune and Doyon, 2002). Consolidation is the process that fixes the motor skill in memory and is identified by behavioral improvement without practice after a period of rest (Krakauer and Shadmehr, 2006). To our knowledge, there is no neuroimaging study that tests all three stages of learning in the same group of participants.
Different stages of motor sequence learning have been linked with different patterns of activity in motor regions of the brain. Previous work in animals has identified the primary regions involved in skill acquisition (Hikosaka et al., 1995; Nakamura et al., 1999) and has led to a model of how these regions interact as learning progresses (Hikosaka et al., 1999, 2002). Information from animal studies has been combined with recent behavioral and neuroimaging work in humans to create another, more general, model of motor sequence learning (Doyon and Benali, 2005). Early learning is characterized by a network of activity in cerebellum (CB), basal ganglia (BGs), and motor cortical regions. Later learning is characterized by decreasing activity in the cerebellum, along with increases in primary motor cortex (M1) and BGs as performance improves (Karni et al., 1995; Penhune and Doyon, 2002, 2005; Floyer-Lea and Matthews, 2004, 2005; Lehéricy et al., 2005). M1 has been linked with long-term retention but may also play a role in consolidation. Repetitive transcranial magnetic stimulation over M1 directly after training has been shown to disrupt skill retention (Muellbacher et al., 2002; Baraduc et al., 2004). In addition, there is complementary evidence that direct current stimulation can result in enhanced consolidation when applied during motor sequence learning (Reis et al., 2009). However, no neuroimaging study has yet shown a direct link between M1 activity and consolidation. Cerebellar activity is present in most studies, but its functional role is less clear. Activity has been interpreted as follows: (1) error-related processing (Ohyama et al., 2003), (2) the site for internal models of learned skills (Imamizu et al., 2000), and (3) a result of task performance rather than learning (Seidler et al., 2005; Orban et al., 2010). Recent work from our laboratory showed an inverse correlation between M1 and CB activity during early learning—implying that these regions dynamically interact to create sequence memory (Penhune and Doyon, 2005). Therefore, the primary goal of the present study was to identify the specific contributions and interactions of the cerebellum and M1 in all three stages of motor sequence learning.
There is evidence that motor sequence learning is not a unitary phenomenon, but involves optimizing multiple parameters. Hikosaka et al. (2002) describes two parameters, spatial and motor, that can be differentiated on both behavioral and neurobiological grounds. Optimization of these parameters follows different time courses, is reflected in different behavioral measures, and is correlated with different brain areas. Similar parameters have been identified in other paradigms and include the following: feedforward and feedback control (Grafton et al., 2008), spatial accuracy and error (Ghilardi et al., 2009), and accuracy and sensorimotor integration (Savion-Lemieux et al., 2009). The present study separates sequence performance into two different components: accuracy (a measure of the correct order of long and short elements that make up the sequence) and synchronization (the ratio of participants' key press onset and offset relative to the onset and offset of the stimuli). Therefore, the secondary goal of this study was to examine the contributions of the cerebellum and M1 to these different components of performance.
Materials and Methods
Participants
Fifteen participants (five females) between the ages of 18 and 35 [mean (M), 22.80; SD, 2.91 years] participated in this study. All participants were right-handed [assessed using a handedness questionnaire adapted from the study by Crovitz and Zener (1962)], neurologically normal, and had <3 years of musical experience [assessed using the Index of Musical Training and Experience (Penhune et al., 1999)]. Participants were either recruited from the Montreal community via advertisements posted on the McGill University classifieds website or via word of mouth. All participants gave informed consent and completed a magnetic resonance (MR) safety screening form to assess their suitability for study in the MR environment. Participants were asked to refrain from drinking alcohol 24 h before each session. The experimental protocol was approved by the Montreal Neurological Institute and Hospital Research Ethics Board and the Concordia University Human Research Ethics Committee. At the completion of the study, participants were debriefed and compensated for their time.
Apparatus
Stimulus delivery and response recordings were controlled by software developed in house with Microsoft Visual C#. Behavioral responses were collected via a standard PC mouse during training and non-MR sessions, and via a custom-designed fiber optic mouse and signal processing box during MR sessions (Hollinger et al., 2007). The fiber optic mouse was fashioned from a PC mouse to retain the same feedback characteristics as the PC mouse. During training and non-MR sessions, participants were seated 60 cm from a notebook computer screen, whereas in the MR scanner, participants viewed a projected image by way of a mounted mirror.
Task and stimuli
The task used in this experiment was a temporal motor sequencing task (TMST) used in a number of previous behavioral and neuroimaging experiments (Penhune and Doyon, 2002, 2005; Savion-Lemieux and Penhune, 2005). The TMST requires that participants produce a precisely timed sequence of finger taps in synchrony with visual stimuli and is sensitive to changes in accuracy and timing that occur with learning.
Stimuli were sequences of colored squares (100 × 100 pixels) presented sequentially in the center of the screen on a neutral gray background (for a depiction of stimuli and trial types, see Fig. 1A). Sequences were made up of short (300 ms) and long (600 ms) elements with a constant interstimulus interval of 300 ms. They were arranged into six trial types—three used for training and three for training and task. Trial types were as follows: long (10 long elements), short (10 short elements), mixed (two long and two short repeated three times), simple baseline (SMP) (five long followed by five short), perceptual baseline (PER) (five long followed by five short), and learn (LRN) (a complex temporal sequence of five long and five short). Long, short, and mixed stimuli were used only during training, whereas SMP, PER, and LRN stimuli made up the task conditions. LRN, SMP, and PER were designed to have the same number of elements, and thus deliver the same visual stimulation and require the same motor output. A rest condition (RST) of 40 s of fixation was also included during testing. The LRN sequence was created to conform to a temporally regular, although nonstandard, musical rhythm—having no more than two repeated elements with seven transitions from short to long. Each trial was preceded by a trial cue (40 × 40 pixel black square of 500 ms duration) and had a total length of 10 s, with a 2.5 s cue window and 7.5 s of stimuli presentation. Trials were grouped into blocks of four identical trials preceded by a block cue before the first trial cue. Block cues were presented within the 2.5 s cueing window of the first trial and were the words “practice,” “attend,” “learn,” and “rest” for SMP, PER, LRN, and RST, respectively.
Figure 1.

Experimental stimuli, procedure, and behavioral scoring. A, Schematic display of stimuli as they appeared on the computer screen along with the sequences and fixation cross used during the experiment. B, Participants followed a similar procedure of familiarization and training and three runs of testing during each day of the experiment. The three runs were conducted in the scanner on days 1, 2, and 5 and in a testing room on the third and fourth days. Sequence blocks were randomly arranged about the three rest blocks for each participant and run. C, Behavioral scoring was calculated in three steps to construct the two behavioral measures—sequence ordering accuracy as percentage correct and sensorimotor integration as percentage synchrony.
Procedure
Day 1
At the beginning of the first day of testing, participants were familiarized with the general procedure for the day and completed the first day of the Sleep Questionnaire. Quality and duration of sleep data was collected to assess their possible impact on learning performance. Figure 1B shows the general outline of training and testing for each day of the experiment.
Training: stage I.
Participants were seated in front of the computer and placed their right hand on the mouse. Participants were shown an example presentation of the long practice trial, and then asked to “synchronize your mouse button presses with the onset and offset of the squares for four more trials.” This procedure was repeated for the short, mixed, and SMP trials. The M and SD for responses to the long and short elements were calculated on-line, filtered to remove responses 2 SDs above or below the mean, and then used to score both the second stage of training and the behavioral results obtained from the testing sessions.
Training: stage II.
During the second stage of training, participants performed LRN trials until their accuracy reached a criterion of 80% over three consecutive trials. Accuracy was calculated on-line by the computer on a per element basis by comparing button press duration to the baseline mean long or short element response from the first stage of training. A response was considered correct if it fell between 2 SDs above or below the individual participant's mean for the short or long element. LRN trials were presented individually, and feedback indicating which part(s) of the trial were correct/not correct was provided when necessary. After reaching criterion, participants were shown examples of the SMP, PER, LRN, and RST conditions. They were instructed to “press the mouse button in synchrony” with SMP and LRN, to “watch and concentrate on the timing” during PER, and to “fixate on the cross” during RST. Participants were then given an overview of the testing session and prepared for the MR environment.
Testing.
Participants were placed in the scanner and a high-resolution anatomical scan was collected. The fiber-optic mouse assembly was then placed at the participants right hand and their arm fixed in a fully extended, although comfortable, position. They were again shown examples of the SMP, PER, LRN, and RST trials and reminded of the instructions. Three runs of functional images were then acquired. Each run was composed of four blocks each of LRN, SMP, and PER arranged randomly about three rest blocks as depicted in Figure 1B.
Days 2–5
The subsequent days of the experiment were very similar to the first. Participants filled out the Sleep Questionnaire, were reminded of the experimental task, completed the first stage of training (identical with that done on day 1), were presented with examples of all testing sequences, and entered the magnetic resonance imaging scanner (days 2 and 5) or stayed at the computer (days 3 and 4). Anatomical images were collected on scanning days, followed by the three functional runs as on day 1. Participants performed the three runs of testing on a notebook computer on days 3 and 4.
Image acquisition
Images were acquired using the Montreal Neurological Institute's Brain Imaging Centre's Siemens 3 tesla TRIO whole-body magnetic resonance imaging scanner equipped with an eight-channel head coil. A whole-brain anatomical image of 160 slices, giving a 1 mm3 resolution, was acquired [time to repeat (TR), 23 ms; time to echo (TE), 7.4 ms; field of view (FOV), 256 mm; flip angle, 30°; matrix, 256 × 256] on the first day, and lower resolution 1 × 1 × 2 mm anatomical scans were collected on subsequent scanning days to reduce scan time. A total of 265 T2*-weighted frames were acquired for each functional imaging run. Functional data were acquired in 36 interleaved slices with an isotropic resolution of 4 mm (TR, 2500 ms; TE, 30 ms; FOV, 256 mm; flip angle, 90°; matrix, 64 × 64). Slices were acquired at an angle of ∼30° to the anterior commissure–posterior commissure line. Angulation was adjusted individually, although maintained for each participant across runs and days, to maintain full brain coverage while attempting to reduce artifact caused by the eyes, orbital socket, and nasal cavities.
Data analysis
Behavioral
Many motor sequence learning tasks use decreases in reaction time as the primary measure for the behavioral assessment of learning. However, the TMST emphasizes the synchronization of key presses with the onset and offset of the stimulus. As such, learning was assessed by changes in accuracy and synchrony. Accuracy reflects the more explicit component of the task—learning the correct order of long and short elements that make up the sequence; whereas synchrony is a measure of the more procedural sensorimotor integration component of the task—learning the precise timing of key press and release relative to the visual stimuli. For each day, individual participants' performance on the short, long, and mixed training trials was used to score their performance on the SMP and LRN conditions. Each participant's M and SD for the long and short elements was first calculated, and then all response durations that fell between M ± 2SD were used to calculate the baseline mean and SD for each element type. The baseline mean and SDs were then used in the second criterion described below.
A custom-designed scoring program was developed to calculate accuracy and synchrony (Fig. 1C). Accuracy was defined as the percentage of key press responses that passed two criteria: (1) the key press was initiated between 300 ms before the stimulus and the end of the stimulus and (2) the duration of the key press was less than M + 2SD (for short elements) or greater than M − 2SD (for long elements). The first criterion allowed the inclusion of anticipatory responses, and the second ensured that, if participants polarized the durations of short and long elements during the task, their responses would still be scored correctly. Only correct responses were used in the calculation of synchrony and all scores were calculated on a per-element basis. Synchrony was defined as 100 minus the percentage of the sum of the absolute lag between stimulus on and key press on and stimulus off and key press release, divided by the actual stimulus duration (Fig. 1C). Accuracy and synchrony measures were calculated for each trial of both LRN and SMP and averaged across runs and days. Learning across the 5 d of the experiment was assessed using repeated-measures ANOVA with Greenhouse–Geisser correction for the LRN and SMP conditions separately. LRN and SMP were also compared across learning to assess differential learning of the two sequences. Significant interactions and main effects were further analyzed using post hoc tests, Bonferroni corrected for multiple comparisons (p < 0.05).
Consolidation was defined as the change in performance between the last run of day 1 and the first run of day 2. Although consolidation is commonly operationalized as an observable improvement or maintenance in performance after a period of rest after which the learned skill becomes resistant to interference (Robertson et al., 2004), it can also be considered (somewhat less strictly) as the across-day transition from early to later learning. Consolidation measures were calculated for PCOR and PSYN and used in the functional correlation described below.
Imaging
The last 11 frames of functional data were discarded as they corresponded to frames acquired after the completion of the experiment. Functional runs were realigned to the third frame of the series, motion corrected, and smoothed with an 8 mm full-width half-maximum isotropic Gaussian kernel with fmr_preprocess (available with the MINC software package at http://www.math.mcgill.ca/keith/fmristat/). Each participant's daily anatomical and functional images were transformed into common Talairach and Tournoux stereotaxic space with an affine transformation to the ICBM 152 template (Collins et al., 1994). Statistical analyses were conducted using the general linear model as instantiated in fMRISTAT, with the time course of each condition (PER, SMP, LRN) used as predictors of blood oxygen level-dependent (BOLD) signal change (Worsley et al., 2002) (available at www.math.mcgill.ca/keith/fmristat/). PER, SMP, and LRN served as the active conditions in the contrasts, whereas RST was used as the baseline for all conditions. PER was included as a predictor in the model, but not included in the analyses. Individual statistical maps of each condition and contrast of interest were calculated, analyzed within each participant with fixed effects, and then combined across participants using a mixed-effects model (Worsley, 2005a,b). Locations of peak activity were identified using the SPM anatomy toolbox, atlases, and established criteria (Talairach and Tournoux, 1988; Yousry et al., 1997; Schmahmann et al., 1999, 2000; Picard and Strick, 2001; Mayka et al., 2006; Eickhoff et al., 2007).
Basic network.
The initial network of brain areas involved in the learning of the TMST was identified by contrasting LRN with SMP on day 1 (LRN–SMP). LRN and SMP were designed to be identical except for the arrangement of the long and short elements within the sequence; therefore, the LRN–SMP contrast represents the brain activity in LRN that is unique to the sequencing or complex timing of the sequence. A corrected threshold of p < 0.05, corresponding to t ≥ 4.67 was used for this analysis.
Changes in the basic network.
Across-day changes were assessed by contrasting the average of all three runs on each day for the LRN condition. Changes in brain activity during early learning were assessed by contrasting the LRN condition on successive runs within the first day. In both analyses, LRN was compared with RST (LRN–RST) before averaging. The validity of similar within- and between-session comparisons has been confirmed with a previous study comparing within- and between-session variability (Smith et al., 2005). These contrasts represent the specific changes that occur over the course of learning on the LRN sequence. A significance threshold of p < 0.001 (uncorrected and corresponding to t ≥ 3.17) and a minimum cluster size of 100 mm3 was used for this and all subsequent analyses.
Different components of learning.
Correlation analyses were conducted to identify the changes in BOLD response directly related to changes in accuracy and synchrony. Accuracy and synchrony were averaged separately within each run for all participants. Each participant's LRN–SMP effect maps were then correlated with their respective behavioral scores on each of the nine functional runs to produce a single t statistic map for each behavioral measure. In the resulting maps, positive t values represent voxels in which activity increased with improvements in performance and negative t values represent voxels in which activity decreased with improvements in performance.
Consolidation.
To determine the brain areas where activity predicted between-day improvement, participants' BOLD signal from the LRN–RST contrast on the first run of the first day was correlated with our consolidation measures. With this design, each participant contributed a single point to the between-subjects correlation. The positive t maps from this analysis represent those areas where BOLD magnitude predicts consolidation.
Stimulus-modulated functional connectivity.
A functional connectivity analysis was used to identify the brain regions that contribute to the production of the well learned LRN sequence. This analysis is used to identify correlated activity between a selected region of interest (seed voxel) and other regions of the brain. A variant of the psychophysical interactions method of Friston et al. (1997) was conducted with fMRISTAT on the data from the LRN condition (see http://www.math.mcgill.ca/keith/fmristat/#connect). The seed voxel time course is first extracted and then combined with the stimulus presentation model to create a set of interaction terms. The interaction term of seed voxel*LRN is selected and all other terms are controlled for. As a result, regions identified using this method are correlated with the seed region over and above activity driven by the experimental design. This method is repeated for each run of each participant on day 1 and day 5. Subtractions (day 5 − day 1) are performed for each individual and then combined using a mixed-effects model. In this analysis, positive t values represent voxels whose temporal correlation (connectivity) with the seed voxel is greater during the LRN condition on day 5 than on day 1.
Results
Behavioral
As no sex differences were found in performance, all results and analyses were collapsed across this variable. All participants reached the 80% criterion level for performance on the LRN sequence within the second stage of training. On average, performance reached criterion after 41 trials (SD, 24). Participants reported no sleep problems, slept an average of 7.67 ± 1.05 h, and were alert during testing [current state rated on a scale from 1 (alert/active/wide awake) to 8 (asleep); M, 2.35; SD, 0.99]. One participant's data were excluded for days 3–5 and another for day 5 because of technical difficulties.
LRN and SMP across days
Accuracy, as measured by the percentage of correct responses, for the LRN sequence significantly improved across days on percentage correct (PCOR: F(4,48) = 9.80, p < 0.01, η2 = 0.45). Performance on the percentage synchrony performance measure was not significantly different across days but showed a statistical trend toward significance consistent with improved performance (PSYN: F(4,48), p = 0.10, η2 = 0.17). As expected, performance on the simple baseline sequence condition, SMP, did not differ significantly across days on either behavioral measure (PCOR: F(4,48) = 1.52, p = 0.24; PSYN: F(4,48) = 1.38, p = 0.27). Figure 2A depicts LRN and SMP performance on PCOR and PSYN across the experiment.
Figure 2.

Behavioral results and the basic learning network. A, PCOR (left) and PSYN (right) by day presented for LRN (blue) and SMP (green) conditions. LRN PCOR improved significantly across days while PSYN showed an increasing trend. There was no change in SMP performance across days. Error bars indicate SEM. B, Average of LRN-SMP conditions on day 1 defined the basic network for this task. Activity was found bilaterally in extensive regions of the cerebellar cortex, motor cortical regions (PMC, pre-SMA, SMA), and bilateral caudate nucleus.
LRN versus SMP across days
LRN and SMP behavioral measures were compared across days of learning. For PCOR, there was a significant condition by day interaction (condition by day: F(4,48) = 7.02, p < 0.01, η2 = 0.37) such that SMP was greater than LRN on day 1 (LRN, 84.34; SMP, 91.60; p < 0.05) but not on any other day. In combination with the observed improvement on LRN, these results show that performance accuracy on LRN improved quickly across days to reach the same level of accuracy as SMP. Although there were no significant differences between LRN and SMP on the PSYN measure, the two conditions show a visually diverging trend that indicates that LRN improves at a greater rate than SMP. To further investigate, the difference between participants' PSYN score on the last run and their overall mean score was calculated for both conditions and submitted to a two-tailed paired t test. There was a significant difference such that participants' improvement relative to their mean performance was greater during the LRN than the SMP sequence condition (t(12) = 2.60; p < 0.05).
Imaging
Basic network
To assess the network of regions involved in early learning, we compared the LRN and SMP conditions on day 1, collapsed across block and run. As LRN was the condition of interest, only areas that show greater activity relative to the SMP motor baseline condition are reported. Note that the SMP condition is a simple sequence, with identical sensory and motor requirements to LRN, that behavioral results indicate is very well performed early in learning. Thus, this contrast effectively removes simple performance effects and represents the network underlying the early stage of motor sequence learning. This network was characterized by greater activity in cortical and subcortical areas including bilateral cerebellar cortex (VI, VIIIA/B), premotor cortex (PMC), bilateral caudate nucleus of the BGs, presupplementary motor area (pre-SMA), and supplementary motor area (SMA) (Fig. 2B). The network of regions active during early learning closely replicates our findings in previous studies using the same task and is consistent with that seen in other studies of motor learning (Penhune and Doyon, 2002, 2005; Floyer-Lea and Matthews, 2004; Doyon and Benali, 2005). Activity in this network has been interpreted as representing the enhanced need for error correction (cerebellar cortex) and planning (PMC) during early learning. A complete list of peak coordinates and t values can be found in supplemental Table 1 (available at www.jneurosci.org as supplemental material).
Changes in the basic network
LRNd2–LRNd1.
Contrasting activity in the LRN condition across days revealed changes in the basic learning network as practice continued and performance improved. The most striking changes were decreases in bilateral cerebellar (X/VIII, VIIIA/B) and motor cortical (PMC, SMA) regions (Fig. 3). Interestingly, BA 9 and hippocampal regions increased in activity between days 1 and 2 but were not part of the early learning network identified on day 1. These results indicate that, as learning progressed, activity in the classic motor regions of the learning network decreased as the need for basic error correction and motor planning requirements declined, but that activity in areas thought to be involved in monitoring information in working memory (Petrides, 2000) and memory (Schendan et al., 2003; Albouy et al., 2008) increased. A complete list of positive and negative peaks and their t values can be found in supplemental Table 2 (available at www.jneurosci.org as supplemental material).
Figure 3.

Across-day changes in the basic learning network. The contrasts between LRN on days 2 and 1, 5 and 2, and 5 and 1 are shown for two slices in Montreal Neurological Institute coordinates. Across-day changes were dominated by decreasing activity. Decreasing M1/S1, M1/PMC, and cerebellar cortical activity can be most easily identified in the contrast between days 5 and 1.
LRNd5–LRNd2.
Similar to the comparison between day 1 and day 2, activity in most regions of the original learning network continued to decrease, including the cerebellum and PMC, as basic error correction and motor planning requirements continued to decline with learning. Activity in the caudate nucleus also decreased between day 2 and day 5. However, the left putamen, a region of the BGs that was not active in the early learning network, showed a specific increase in this contrast (cluster size marginally below threshold). These results are in accordance with the observed shift from caudate nucleus early in learning to putamen as performance improves (Graybiel, 2008). Finally, similar to the previous contrast, frontal and hippocampal regions showed increased activity between days 2 and 5 indicative of increased working memory monitoring and memory. The complete list of peak coordinates and t values can be found in supplemental Table 3 (available at www.jneurosci.org as supplemental material).
LRNd5–LRNd1.
In addition to the areas identified in the separate across-day analyses, the day 5–day 1 contrast was used to capture those areas that may have been missed in the previous two contrasts. Additional decreases were found in two left CB cortical regions, left M1, and right caudate nucleus. As can been seen in Figure 3, this contrast shows the same general areas as the previous two—although with increased sensitivity.
Different components of learning
PCOR.
To identify brain regions whose activity was related to changes in accuracy—the more explicit, stimulus–response component of the task—each participant's LRN–SMP contrast for each run was correlated with their corresponding PCOR score. As performance improved, negative correlations were seen in extensive regions of bilateral cerebellar cortex, bilateral PMC/M1 (peak located near the anterior bank of the precentral gyrus with the cluster extending posteriorly), and pre-SMA/SMA (Fig. 4). Positive correlations were found in a number of areas including BA 9 and 10, the hippocampus, and putamen. These regions are very similar to those seen in the across-day contrasts, indicating that these changes are likely related to the rapid changes in performance seen for the accuracy measure. If accuracy is conceptualized as the more explicit component of the task, it suggests that these regions are more involved in the ability to learn and recall the sequence of stimulus–response associations required. A complete list of peak coordinates and t values can be found in supplemental Table 4 (available at www.jneurosci.org as supplemental material).
Figure 4.
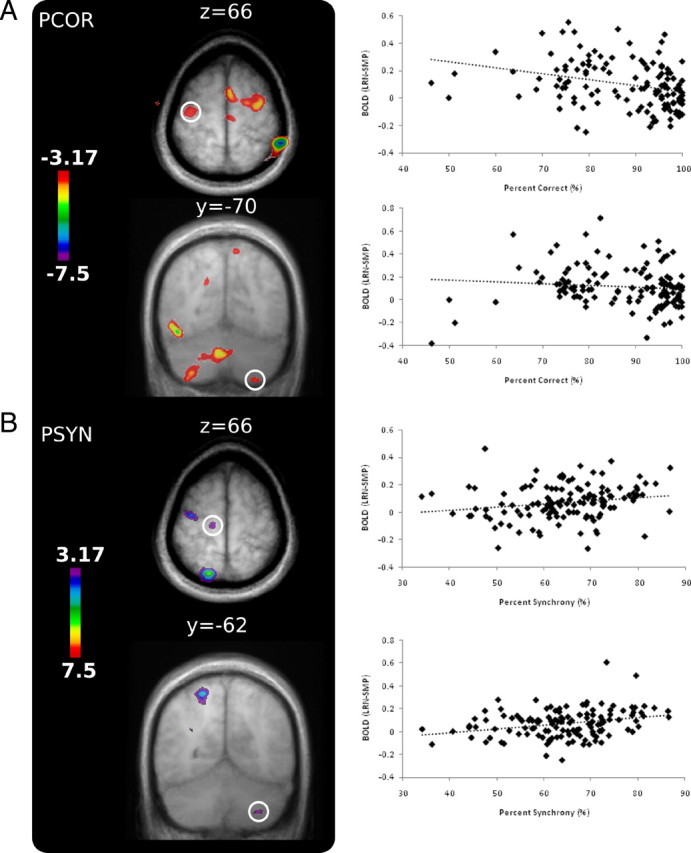
Motor and cerebellar regions identified in the BOLD–behavior correlations. A, Greater accuracy (PCOR) was correlated with lower activity in PMC/M1 and CB. B, Improvement in sensorimotor integration (PSYN) was correlated with greater activity in M1 and CB (VIIIA/VIIB). Signal extractions are plotted against performance on each run for the peak voxel in each area of interest.
PSYN.
To identify regions where activity was correlated with response synchronization—the more procedural, synchronization/sensorimotor integration component of the task—each participant's LRN–SMP contrast for each run was correlated with their corresponding PSYN score. In contrast to the correlations with accuracy, better performance on the PSYN measure was positively correlated with increases in specific subregions of the cerebellum and M1 (right VIIIA/VIIB and left M1 and M1/PMC) (Fig. 4). The more anterior M1/PMC activity (localized to the anterior bank of the precentral gyrus) overlaps with both the M1 region found in the contrast between day 5 and day 1 and in the PCOR correlation. This partial overlap may represent the differential contributions of subpopulations of M1 neurons to different parameters of the task. The combined results of the two different correlational analyses indicate that different subnetworks of the learning network are involved in learning and optimizing different components of the sequencing task. The complete list of peak voxels and their t values can be found in supplemental Table 5 (available at www.jneurosci.org as supplemental material). To confirm the separability of the effect, the correlations were repeated for each behavioral measure with the second measure included as a regressor of no interest. The results were the same as those reported.
Consolidation
To identify brain regions whose activity was related to consolidation on the task, each participant's BOLD activity during the first run of the LRN condition was correlated with their PCOR change score between the last run of day 1 and the first run of day 2. Greater improvement in performance between day 1 and day 2 was predicted by greater activity in two locations within left M1 (Fig. 5, Table 1) (this correlation is significant both with and without the largest difference score; p < 0.05, uncorrected). The location of these regions corresponds well with those identified in the correlation analysis and the contrast between day 5 and day 1. These results indicate that M1 recruitment during the earliest stage of learning predicts the extent of improvement that occurs between training sessions, and fits with the idea that M1 activity is important early in learning (Karni et al., 1998; Floyer-Lea and Matthews, 2005; Penhune and Doyon, 2005). Previous research has shown that direct current stimulation over M1 leads to enhanced performance (Reis et al., 2009), but this is the first neuroimaging evidence for the contribution of M1 to human motor sequence consolidation. The same analysis conducted with PSYN did not identify correlations with any locations of interest—peak locations and t values for the PSYN predictor can be found in supplemental Table 6 (available at www.jneurosci.org as supplemental material).
Figure 5.

Consolidation predictor and functional connectivity. A, Two locations within M1 correlated with the extent of PCOR consolidation between day 1 and day 2. A plot of BOLD signal against behavioral improvement for the more medial region is also shown. Each point demarks a single participant, whereas the solid line illustrates the between-subjects correlation. This correlation is significant both with and without the largest difference score; p < 0.05, uncorrected. B, Ipsilateral CB VIIIA was found to exhibit increased temporal connectivity with M1 during performance of LRN on day 5 when compared with day 1.
Table 1.
Consolidation predictors
| x | y | z | t value | |
|---|---|---|---|---|
| L M1 | −18 | −24 | 66 | 3.94 |
| L M1 | −34 | −22 | 66 | 3.61 |
| R S2 | 68 | −6 | 16 | 3.74 |
| L secondary auditory cortex | −44 | −14 | 16 | 4.09 |
| R secondary auditory cortex | 56 | −4 | 6 | 3.59 |
Consolidation on PCOR correlated with activity in the LRN condition on the first run of day 1. L, Left; R, right.
Stimulus-modulated functional connectivity
Similar regions of M1 were correlated with improvements in synchronization and predicted consolidation gains, indicating their role in sequence retention. Therefore, we wanted to assess whether M1 activity at long-term retention on day 5 was temporally correlated with other regions in the network, particularly the cerebellum, over and above any temporal correlation during early learning on day 1. This stimulus-modulated functional connectivity analysis looked for regions whose activity was significantly more temporally correlated with M1 activity on day 5 than on day 1, and modulated by the task (LRN vs RST) [the seed voxel in M1 (−14, −24, 66) was chosen because of its relationship to both sensorimotor integration and consolidation, and had the largest t value within M1 that was common to both analyses]. A single region of the cerebellum showed stimulus-modulated increases in temporal correlation—right cerebellar VIIIA (Table 2, Fig. 5B). This region is close to the cerebellar cortical area identified in the correlation with PSYN (Fig. 4)—further supporting its specific role in learning the sensorimotor integration component of the task. This finding is consistent with recent resting state connectivity results (O'Reilly et al., 2009) and previous evidence from our laboratory showing a functional relationship between motor and cerebellar cortices (Penhune and Doyon, 2005), but represents a more specific, task-relevant relationship between M1 and the cerebellum that increases over the course of the experiment. Together, this result indicates that specific regions of M1 and the cerebellum work together during performance of well learned sequences.
Table 2.
Stimulus-modulated functional connectivity
| x | y | z | t value | |
|---|---|---|---|---|
| R CB VIIIA | 34 | −52 | −56 | 4.06 |
| SMA | 4 | 4 | 48 | 3.50 |
L M1 seed with day 5 − day 1 (LRN). L, Left; R, right.
Discussion
The current study investigated changes in brain activity over 5 d of practice on a motor sequencing task. The network of brain regions active during early learning was dominated by the cerebellum, PMC, BGs, pre-SMA, and SMA as predicted by existing models (Hikosaka et al., 2002; Doyon and Benali, 2005). Across days of learning, as performance improved and error processing became less critical, global decreases were found in the majority of these regions. Importantly, within the context of these global decreases, we found specific regions of left M1 and right cerebellar VIIIA/VIIB that were positively correlated with improvements in performance. Improvements in accuracy were correlated with increases in hippocampus, BA 9/10, and the putamen. Thus, the two behavioral measures, accuracy and synchrony, were found to be related to two different sets of brain regions, suggesting that these networks optimize different components of learning. In addition, M1 activity early on day 1 was also shown to be predictive of the degree of consolidation on day 2. Finally, on day 5, M1 and cerebellar regions were functionally connected during execution of the well learned motor sequence.
Global decreases with specific increases
Our results suggest that motor sequence learning can be characterized by specific increases within a context of global decreases. Sequence learning studies commonly describe extensive decreases in motor and cerebellar cortex, as well as frontal and parietal regions, as learning progresses (Penhune and Doyon, 2002, 2005; Floyer-Lea and Matthews, 2004; Lehéricy et al., 2005), and the model proposed by Doyon and Benali (2005) predicts decreases in most areas of the learning network. Decreases in M1 have been detected early in learning (Karni et al., 1995; Floyer-Lea and Matthews, 2004) and have been attributed to habituation or repetition suppression (Grill-Spector et al., 2006), whereas cerebellar cortical decreases have been interpreted as the decreased need for error correction as learning progresses (Ito, 2000; Penhune and Doyon, 2005; de Gruijl et al., 2009). The global decreases identified in our study are sharply contrasted by increases in specific subregions of M1 and cerebellar cortex. The M1 increases are similar to those described by others during later learning (Karni et al., 1995; Penhune and Doyon, 2002; Floyer-Lea and Matthews, 2005) and are likely the result of synaptically mediated cortical reorganization (Monfils et al., 2005). In this view, increases likely reflect improvement in the synaptic efficacy of the region and may therefore represent the location of a putative motor engram. As a whole, our results suggest that, although there are general decreases with habituation/suppression, specific neuronal subpopulations become progressively more active as skill parameters, such as synchronization, are optimized over the course of learning. Specific increases in sensorimotor cerebellar cortex are a relatively novel finding for motor sequence learning but is consistent with evidence for the development and refinement of internal models within the cerebellum (Imamizu et al., 2007) and could be the result of synaptogenesis, increased excitability, decreased inhibition, or some combination of these processes (Kleim et al., 2002). Although others have suggested that the cerebellum is only involved in sequence performance and not learning (Seidler et al., 2002) and error feedback (Ohyama et al., 2003), our findings strongly suggest its involvement in learning per se, in addition to its role in error-related processing and performance. When the anatomical [nonhuman primates (Kelly and Strick, 2003)] and functional [humans (O'Reilly et al., 2009)] connectivity of these regions is considered, our results strongly support the idea that they operate as part of an interconnected network to learn and optimize movement (Wolpert and Miall, 1996; Ramnani, 2006).
Different components are learned by different brain networks
Behavioral studies have succeeded in separating learning into different components including feedforward and feedback control (Grafton et al., 2008), spatial accuracy and error (Ghilardi et al., 2009), and accuracy and sensorimotor integration (Savion-Lemieux et al., 2009), but few neuroimaging studies have attempted to do so. To assess whether learning of the different task components was represented by similar networks, we separated performance into two components: accuracy, the more explicit, rapidly learned stimulus–response association component of the task; and synchronization, the more procedural, slowly learned component of the task.
Accuracy
The network responsible for optimizing accuracy was characterized by increased activity in regions involved in retrieval and memory (BA 9/10 and hippocampus) (Petrides, 2000; Schendan et al., 2003) and stimulus–response association/long-term sequence storage (putamen) (Packard and Knowlton, 2002; Lehéricy et al., 2005), with decreases in motor regions (PMC/M1 and cerebellar cortex). The putamen has been hypothesized to be involved in long-term sequence storage (Jueptner and Weiller, 1998; Floyer-Lea and Matthews, 2005; Lehéricy et al., 2005; Penhune and Doyon, 2005), and our results show that it may interact with a network involving working and explicit memory regions to optimize the more explicit sequence ordering components of the task. This result, in combination with the decreases in the caudate nucleus observed between day 2 and day 5, is consistent with the shift in activity from caudate nucleus to putamen as learning progresses. This finding has been reported by others (Graybiel, 2008) and is in agreement with Doyon and colleagues' current model of motor sequence learning (Doyon et al., 2009). As previously discussed, repetition–suppression/habituation effects and reduced error correction can account for concurrent decreases in motor and cerebellar cortical areas as accuracy improves.
Sensorimotor integration
The network responsible for optimizing synchronization was characterized by increased activity in M1, M1/PMC, and lobule VIIIA/VIIB of the cerebellum: a region known to be anatomically connected to M1 in the monkey (Kelly and Strick, 2003). The more lateral M1/PMC region overlaps with a location found to be negatively correlated with accuracy. Considering the learning curves of the two behavioral measures helps clarify these results: accuracy improved rapidly and was negatively correlated with M1 activity, whereas sensorimotor integration improved gradually and was positively correlated with M1. A similar change from decreasing M1 to increasing M1 over the course of learning has previously been reported (Karni et al., 1998; Floyer-Lea and Matthews, 2005). Furthermore, the network of regions and differential time course of the optimization of the two components corresponds well with the idea that more explicit sequence ordering component is learned quickly, whereas the more procedural component is learned over a protracted period (Hikosaka et al., 2002). The overlap in regions correlated with the two task components indicates that subpopulations of neurons within the same region participate in optimizing different task components (Downing et al., 2007). Future studies with specifically designed measures of performance [such as in the study by Grafton et al. (2008)] or multivariate approaches could be used to confirm these results.
M1 as a predictor of consolidation
This study is the first to present human neuroimaging evidence for the role of M1 in motor sequence consolidation. Greater activity in M1 during the first block of learning on day 1 predicted greater improvement in accuracy between day 1 and day 2. The regions identified in this analysis are very similar to those found to be related to long-term learning/improvement in performance. Repetitive transcranial magnetic stimulation of M1 has been shown to disrupt motor sequence consolidation when applied soon after the first session of practice (Muellbacher et al., 2002; Baraduc et al., 2004; Hotermans et al., 2008). In a complementary study, direct current stimulation of M1 was shown to facilitate sequence consolidation (Reis et al., 2009). Interestingly, these studies found no effect on long-term retention—implying that there are different types of consolidation and that M1 may not always play the same role in these processes (Robertson et al., 2005). In our experiment, greater M1 activity early in learning was shown to be predictive of consolidation on the rapidly changing, more explicit, accuracy measure but was not correlated with the same measure over the long term. M1 activity did not, however, predict consolidation on the more slowly improving sensorimotor integration measure but was positively correlated with long-term improvement. Therefore, we propose that functionally distinct subpopulations of neurons within M1 encode and express different parameters of motor sequence learning, with one population tuned to the more rapidly learned, explicit, stimulus-response component of the task and the other tuned to the more slowly learned, procedural, sensorimotor integration component of the task. This is consistent with results from our laboratory (Savion-Lemieux et al., 2009) and others (Grafton et al., 2008; Ghilardi et al., 2009) that, together, describe a spectrum of parameters that can be differentially optimized over the course of learning.
Although M1 activity during early learning was found to correlate with the behavioral consequences of consolidation on this sequence learning task, the brain areas that actually participate in consolidation cannot be directly addressed with this experiment. Evidence for consolidation-related processes has been demonstrated in animal models in which the same hippocampal neurons active during task practice were found to be reactivated during sleep (Wilson and McNaughton, 1994) (for review, see Stickgold and Walker, 2007). Human electroencephalographic (EEG) studies have shown links between different stages of sleep and declarative (Marshall et al., 2006), perceptual (Aeschbach et al., 2008), and visuomotor (Landsness et al., 2009; Määttä et al., 2010) memory consolidation. In addition, recent simultaneous EEG and functional magnetic resonance imaging (fMRI) work links sleep cycles to particular brain regions and may help to clarify which regions are involved in consolidation (Dang-Vu et al., 2008). Although not illustrating a direct link between M1 and consolidation, our study provides, to our knowledge, the first evidence that M1 activity during early learning predicts subsequent consolidation-related improvement on a sequence learning task.
Because changes in brain activity observed at consolidation may relate to the enhanced execution of learned skills rather than to the effects of consolidation itself, learning-related effects may be confounded with those of performance, making interpretation difficult (Seidler et al., 2005; Orban et al., 2010). We addressed this problem by using brain activity from the first run of day 1 to predict consolidation-related performance changes between day 1 and day 2. Because we used activity during early learning (when performance is poor) to predict consolidation-related improvement on day 2, our results cannot be interpreted as attributable to the confounding effects of activity changes when performance/execution have improved.
M1 and cerebellar VIIIA functional connectivity
Stimulus-modulated functional connectivity analyses revealed that activity in M1 and lobule VIIIA of the cerebellum showed greater temporal correlation during performance of the LRN sequence on day 5 that was not present on day 1. Our results are consistent with a previous study from our laboratory that identified correlated activity between M1 and the cerebellum across blocks of learning (Penhune and Doyon, 2005). The current analysis extends this finding by illustrating that connectivity between M1 and cerebellar cortex is modulated by performance of the well learned sequence. This same cerebellar lobule exhibits positively correlated activity with improvements in sensorimotor integration, indicating that this region is actively involved in the learning and expression of skilled motor sequences. Although our experiment was not specifically designed to probe the nature of internal models within the cerebellum, our results are consistent with the idea that the cerebellum, in functional coordination with M1, optimizes and retains an internal model (or representation) of the acquired motor sequence skill (Imamizu et al., 2000).
Our results are consistent with the growing body of literature suggesting that there are separable motor and frontal loops with the cerebellum that contribute differentially to learning.
Increases in ipsilateral lobule VIIIA/VIIB and M1 with improvements in sensorimotor integration, in combination their increasing connectivity as learning progresses, implies that these two regions form a closed cortico-cerebellar loop for the learning and optimization of the synchronization aspect of this motor skill—perhaps through modification of a forward model of motor control (Ramnani, 2006; Imamizu et al., 2007; Strick et al., 2009). We also found that the medial aspect of BA 10 increased while a more lateral and posterior posterior region decreased with learning. There is evidence that these regions are functionally connected to the cerebellum in humans (O'Reilly et al., 2009), and nonhuman primate work has found reciprocal anatomical connections between the adjacent region, BA 46, and cerebellar Crus II (Kelly and Strick, 2003). It is possible that the prefrontal changes identified here are portions of two closed-loop cerebellar circuits that differentially increase/decrease as the more explicit component of the task is learned. This increased prefrontal activity is consistent with the general function of BA 10 in focusing attention on relevant information and coordinating the processing and flow of that information among different supramodal regions (Ramnani and Owen, 2004; Burgess et al., 2007).
The current study used fMRI to identify the specific contributions and interactions of the cerebellum and M1 during early learning, consolidation, and retention of a motor sequence task. Across-day learning was characterized by globally decreasing activity, with specific increases in M1 and the cerebellum related to improvements in synchronization. In contrast, improvements in accuracy were correlated with decreases in motor cortex and cerebellum, and increases in hippocampus, BA 9/10, and the putamen. Interestingly, M1 activity during early learning was found to predict between-session improvements in sequence accuracy and thus represents the first human neuroimaging evidence for the role of M1 in consolidation. Based on these findings, we propose that functionally distinct subpopulations of neurons within M1 encode and express different components of performance (accuracy, sensorimotor integration) that are learned over different timescales (rapid, slow). Finally, functional connectivity between M1 and cerebellum in late learning points to their interaction as a mechanism underlying the long-term representation and expression of a learned skill.
Footnotes
This work was supported by the Natural Sciences and Engineering Research Council of Canada Postgraduate Doctoral Scholarship (C.J.S.) and Grant 238670 (V.B.P.), and Fonds de la Recherche en Santé du Québec Grant 12014 (V.B.P.). We acknowledge Avrum Hollinger and Alejandro Endo for their assistance in developing the stimulus presentation software, stimulus–response device, and data collection software, as well as Jennifer A. Bailey and Anthony Hopley for their work in data collection and participant recruitment. We also thank the staff at the McConnell Brain Imaging Centre of McGill University for their assistance with scanning and the scanning protocol.
References
- Aeschbach D, Cutler AJ, Ronda JM. A role for non-rapid-eye-movement sleep homeostasis in perceptual learning. J Neurosci. 2008;28:2766–2772. doi: 10.1523/JNEUROSCI.5548-07.2008. [DOI] [PMC free article] [PubMed] [Google Scholar]
- Albouy G, Sterpenich V, Balteau E, Vandewalle G, Desseilles M, Dang-Vu T, Darsaud A, Ruby P, Luppi PH, Degueldre C, Peigneux P, Luxen A, Maquet P. Both the hippocampus and striatum are involved in consolidation of motor sequence memory. Neuron. 2008;58:261–272. doi: 10.1016/j.neuron.2008.02.008. [DOI] [PubMed] [Google Scholar]
- Bapi RS, Miyapuram KP, Graydon FX, Doya K. fMRI investigation of cortical and subcortical networks in the learning of abstract and effector-specific representations of motor sequences. Neuroimage. 2006;32:714–727. doi: 10.1016/j.neuroimage.2006.04.205. [DOI] [PubMed] [Google Scholar]
- Baraduc P, Lang N, Rothwell JC, Wolpert DM. Consolidation of dynamic motor learning is not disrupted by rTMS of primary motor cortex. Curr Biol. 2004;14:252–256. doi: 10.1016/j.cub.2004.01.033. [DOI] [PubMed] [Google Scholar]
- Burgess PW, Dumontheil I, Gilbert SJ. The gateway hypothesis of rostral prefrontal cortex (area 10) function. Trends Cogn Sci. 2007;11:290–298. doi: 10.1016/j.tics.2007.05.004. [DOI] [PubMed] [Google Scholar]
- Collins DL, Neelin P, Peters TM, Evans AC. Automatic 3D intersubject registration of MR volumetric data in standardized Talairach space. J Comput Assist Tomogr. 1994;18:192–205. [PubMed] [Google Scholar]
- Crovitz HF, Zener K. A group-test for assessing hand- and eye-dominance. Am J Psychol. 1962;75:271–276. [PubMed] [Google Scholar]
- Dang-Vu TT, Schabus M, Desseilles M, Albouy G, Boly M, Darsaud A, Gais S, Rauchs G, Sterpenich V, Vandewalle G, Carrier J, Moonen G, Balteau E, Degueldre C, Luxen A, Phillips C, Maquet P. Spontaneous neural activity during human slow wave sleep. Proc Natl Acad Sci U S A. 2008;105:15160–15165. doi: 10.1073/pnas.0801819105. [DOI] [PMC free article] [PubMed] [Google Scholar]
- de Gruijl JR, van der Smagt P, De Zeeuw CI. Anticipatory grip force control using a cerebellar model. Neuroscience. 2009;162:777–786. doi: 10.1016/j.neuroscience.2009.02.041. [DOI] [PubMed] [Google Scholar]
- Downing PE, Wiggett AJ, Peelen MV. Functional magnetic resonance imaging investigation of overlapping lateral occipitotemporal activations using multi-voxel pattern analysis. J Neurosci. 2007;27:226–233. doi: 10.1523/JNEUROSCI.3619-06.2007. [DOI] [PMC free article] [PubMed] [Google Scholar]
- Doyon J, Benali H. Reorganization and plasticity in the adult brain during learning of motor skills. Curr Opin Neurobiol. 2005;15:161–167. doi: 10.1016/j.conb.2005.03.004. [DOI] [PubMed] [Google Scholar]
- Doyon J, Bellec P, Amsel R, Penhune V, Monchi O, Carrier J, Lehéricy S, Benali H. Contributions of the basal ganglia and functionally related brain structures to motor learning. Behav Brain Res. 2009;199:61–75. doi: 10.1016/j.bbr.2008.11.012. [DOI] [PubMed] [Google Scholar]
- Eickhoff SB, Paus T, Caspers S, Grosbras MH, Evans AC, Zilles K, Amunts K. Assignment of functional activations to probabilistic cytoarchitectonic areas revisited. Neuroimage. 2007;36:511–521. doi: 10.1016/j.neuroimage.2007.03.060. [DOI] [PubMed] [Google Scholar]
- Floyer-Lea A, Matthews PM. Changing brain networks for visuomotor control with increased movement automaticity. J Neurophysiol. 2004;92:2405–2412. doi: 10.1152/jn.01092.2003. [DOI] [PubMed] [Google Scholar]
- Floyer-Lea A, Matthews PM. Distinguishable brain activation networks for short- and long-term motor skill learning. J Neurophysiol. 2005;94:512–518. doi: 10.1152/jn.00717.2004. [DOI] [PubMed] [Google Scholar]
- Friston KJ, Buechel C, Fink GR, Morris J, Rolls E, Dolan RJ. Psychophysiological and modulatory interactions in neuroimaging. Neuroimage. 1997;6:218–229. doi: 10.1006/nimg.1997.0291. [DOI] [PubMed] [Google Scholar]
- Ghilardi MF, Moisello C, Silvestri G, Ghez C, Krakauer JW. Learning of a sequential motor skill comprises explicit and implicit components that consolidate differently. J Neurophysiol. 2009;101:2218–2229. doi: 10.1152/jn.01138.2007. [DOI] [PMC free article] [PubMed] [Google Scholar]
- Grafton ST, Schmitt P, Van Horn J, Diedrichsen J. Neural substrates of visuomotor learning based on improved feedback control and prediction. Neuroimage. 2008;39:1383–1395. doi: 10.1016/j.neuroimage.2007.09.062. [DOI] [PMC free article] [PubMed] [Google Scholar]
- Graybiel AM. Habits, rituals, and the evaluative brain. Annu Rev Neurosci. 2008;31:359–387. doi: 10.1146/annurev.neuro.29.051605.112851. [DOI] [PubMed] [Google Scholar]
- Grill-Spector K, Henson R, Martin A. Repetition and the brain: neural models of stimulus-specific effects. Trends Cogn Sci. 2006;10:14–23. doi: 10.1016/j.tics.2005.11.006. [DOI] [PubMed] [Google Scholar]
- Hikosaka O, Rand MK, Miyachi S, Miyashita K. Learning of sequential movements in the monkey: process of learning and retention of memory. J Neurophysiol. 1995;74:1652–1661. doi: 10.1152/jn.1995.74.4.1652. [DOI] [PubMed] [Google Scholar]
- Hikosaka O, Nakahara H, Rand MK, Sakai K, Lu X, Nakamura K, Miyachi S, Doya K. Parallel neural networks for learning sequential procedures. Trends Neurosci. 1999;22:464–471. doi: 10.1016/s0166-2236(99)01439-3. [DOI] [PubMed] [Google Scholar]
- Hikosaka O, Nakamura K, Sakai K, Nakahara H. Central mechanisms of motor skill learning. Curr Opin Neurobiol. 2002;12:217–222. doi: 10.1016/s0959-4388(02)00307-0. [DOI] [PubMed] [Google Scholar]
- Hollinger A, Steele C, Penhune V, Zatorre R, Wanderley M. fMRI-compatible electronic controllers. Proceedings of the Seventh International Conference on New Interfaces for Musical Expression; New York: ACM; 2007. pp. 246–249. [Google Scholar]
- Hotermans C, Peigneux P, de Noordhout AM, Moonen G, Maquet P. Repetitive transcranial magnetic stimulation over the primary motor cortex disrupts early boost but not delayed gains in performance in motor sequence learning. Eur J Neurosci. 2008;28:1216–1221. doi: 10.1111/j.1460-9568.2008.06421.x. [DOI] [PubMed] [Google Scholar]
- Imamizu H, Miyauchi S, Tamada T, Sasaki Y, Takino R, Pütz B, Yoshioka T, Kawato M. Human cerebellar activity reflecting an acquired internal model of a new tool. Nature. 2000;403:192–195. doi: 10.1038/35003194. [DOI] [PubMed] [Google Scholar]
- Imamizu H, Higuchi S, Toda A, Kawato M. Reorganization of brain activity for multiple internal models after short but intensive training. Cortex. 2007;43:338–349. doi: 10.1016/s0010-9452(08)70459-3. [DOI] [PubMed] [Google Scholar]
- Ito M. Mechanisms of motor learning in the cerebellum. Brain Res. 2000;886:237–245. doi: 10.1016/s0006-8993(00)03142-5. [DOI] [PubMed] [Google Scholar]
- Jueptner M, Weiller C. A review of differences between basal ganglia and cerebellar control of movements as revealed by functional imaging studies. Brain. 1998;121:1437–1449. doi: 10.1093/brain/121.8.1437. [DOI] [PubMed] [Google Scholar]
- Karni A, Meyer G, Jezzard P, Adams MM, Turner R, Ungerleider LG. Functional MRI evidence for adult motor cortex plasiticity during motor skill learning. Nature. 1995;377:155–158. doi: 10.1038/377155a0. [DOI] [PubMed] [Google Scholar]
- Karni A, Meyer G, Rey-Hipolito C, Jezzard P, Adams MM, Turner R, Ungerleider LG. The acquisition of skilled motor performance: fast and slow experience-driven changes in primary motor cortex. Proc Natl Acad Sci U S A. 1998;95:861–868. doi: 10.1073/pnas.95.3.861. [DOI] [PMC free article] [PubMed] [Google Scholar]
- Kelly RM, Strick PL. Cerebellar loops with motor cortex and prefrontal cortex of a nonhuman primate. J Neurosci. 2003;23:8432–8444. doi: 10.1523/JNEUROSCI.23-23-08432.2003. [DOI] [PMC free article] [PubMed] [Google Scholar]
- Kleim JA, Freeman JH, Jr, Bruneau R, Nolan BC, Cooper NR, Zook A, Walters D. Synapse formation is associated with memory storage in the cerebellum. Proc Natl Acad Sci U S A. 2002;99:13228–13231. doi: 10.1073/pnas.202483399. [DOI] [PMC free article] [PubMed] [Google Scholar]
- Korman M, Raz N, Flash T, Karni A. Multiple shifts in the representation of a motor sequence during the acquisition of skilled performance. Proc Natl Acad Sci U S A. 2003;100:12492–12497. doi: 10.1073/pnas.2035019100. [DOI] [PMC free article] [PubMed] [Google Scholar]
- Krakauer JW, Shadmehr R. Consolidation of motor memory. Trends Neurosci. 2006;29:58–64. doi: 10.1016/j.tins.2005.10.003. [DOI] [PMC free article] [PubMed] [Google Scholar]
- Landsness EC, Crupi D, Hulse BK, Peterson MJ, Huber R, Ansari H, Coen M, Cirelli C, Benca RM, Ghilardi MF, Tononi G. Sleep-dependent improvement in visuomotor learning: a causal role for slow waves. Sleep. 2009;32:1273–1284. doi: 10.1093/sleep/32.10.1273. [DOI] [PMC free article] [PubMed] [Google Scholar]
- Lehéricy S, Benali H, Van de Moortele PF, Pélégrini-Issac M, Waechter T, Ugurbil K, Doyon J. Distinct basal ganglia territories are engaged in early and advanced motor sequence learning. Proc Natl Acad Sci U S A. 2005;102:12566–12571. doi: 10.1073/pnas.0502762102. [DOI] [PMC free article] [PubMed] [Google Scholar]
- Määttä S, Landsness E, Sarasso S, Ferrarelli F, Ferreri F, Ghilardi MF, Tononi G. The effects of morning training on night sleep: a behavioral and EEG study. Brain Res Bull. 2010;82:118–123. doi: 10.1016/j.brainresbull.2010.01.006. [DOI] [PMC free article] [PubMed] [Google Scholar]
- Marshall L, Helgadóttir H, Mölle M, Born J. Boosting slow oscillations during sleep potentiates memory. Nature. 2006;444:610–613. doi: 10.1038/nature05278. [DOI] [PubMed] [Google Scholar]
- Mayka MA, Corcos DM, Leurgans SE, Vaillancourt DE. Three-dimensional locations and boundaries of motor and premotor cortices as defined by functional brain imaging: a meta-analysis. Neuroimage. 2006;31:1453–1474. doi: 10.1016/j.neuroimage.2006.02.004. [DOI] [PMC free article] [PubMed] [Google Scholar]
- Monfils MH, Plautz EJ, Kleim JA. In search of the motor engram: motor map plasticity as a mechanism for encoding motor experience. Neuroscientist. 2005;11:471–483. doi: 10.1177/1073858405278015. [DOI] [PubMed] [Google Scholar]
- Muellbacher W, Ziemann U, Wissel J, Dang N, Kofler M, Facchini S, Boroojerdi B, Poewe W, Hallett M. Early consolidation in human primary motor cortex. Nature. 2002;415:640–644. doi: 10.1038/nature712. [DOI] [PubMed] [Google Scholar]
- Nakamura K, Sakai K, Hikosaka O. Effects of local inactivation of monkey medial frontal cortex in learning of sequential procedures. J Neurophysiol. 1999;82:1063–1068. doi: 10.1152/jn.1999.82.2.1063. [DOI] [PubMed] [Google Scholar]
- Ohyama T, Nores WL, Murphy M, Mauk MD. What the cerebellum computes. Trends Neurosci. 2003;26:222–227. doi: 10.1016/S0166-2236(03)00054-7. [DOI] [PubMed] [Google Scholar]
- Orban P, Peigneux P, Lungu O, Albouy G, Breton E, Laberenne F, Benali H, Maquet P, Doyon J. The multifaceted nature of the relationship between performance and brain activity in motor sequence learning. Neuroimage. 2010;49:694–702. doi: 10.1016/j.neuroimage.2009.08.055. [DOI] [PubMed] [Google Scholar]
- O'Reilly JX, Beckmann CF, Tomassini V, Ramnani N, Johansen-Berg H. Distinct and overlapping functional zones in the cerebellum defined by resting state functional connectivity. Cereb Cortex. 2009;20:953–965. doi: 10.1093/cercor/bhp157. [DOI] [PMC free article] [PubMed] [Google Scholar]
- Packard MG, Knowlton BJ. Learning and memory functions of the Basal Ganglia. Annu Rev Neurosci. 2002;25:563–593. doi: 10.1146/annurev.neuro.25.112701.142937. [DOI] [PubMed] [Google Scholar]
- Penhune VB, Doyon J. Dynamic cortical and subcortical networks in learning and delayed recall of timed motor sequences. J Neurosci. 2002;22:1397–1406. doi: 10.1523/JNEUROSCI.22-04-01397.2002. [DOI] [PMC free article] [PubMed] [Google Scholar]
- Penhune VB, Doyon J. Cerebellum and M1 interaction during early learning of timed motor sequences. Neuroimage. 2005;26:801–812. doi: 10.1016/j.neuroimage.2005.02.041. [DOI] [PubMed] [Google Scholar]
- Penhune VB, Zatorre RJ, Feindel WH. The role of auditory cortex in retention of rhythmic patterns as studied in patients with temporal lobe removals including Heschl's gyrus. Neuropsychologia. 1999;37:315–331. doi: 10.1016/s0028-3932(98)00075-x. [DOI] [PubMed] [Google Scholar]
- Petrides M. The role of the mid-dorsolateral prefrontal cortex in working memory. Exp Brain Res. 2000;133:44–54. doi: 10.1007/s002210000399. [DOI] [PubMed] [Google Scholar]
- Picard N, Strick PL. Imaging the premotor areas. Curr Opin Neurobiol. 2001;11:663–672. doi: 10.1016/s0959-4388(01)00266-5. [DOI] [PubMed] [Google Scholar]
- Ramnani N. The primate cortico-cerebellar system: anatomy and function. Nat Rev Neurosci. 2006;7:511–522. doi: 10.1038/nrn1953. [DOI] [PubMed] [Google Scholar]
- Ramnani N, Owen AM. Anterior prefrontal cortex: insights into function from anatomy and neuroimaging. Nat Rev Neurosci. 2004;5:184–194. doi: 10.1038/nrn1343. [DOI] [PubMed] [Google Scholar]
- Reis J, Schambra HM, Cohen LG, Buch ER, Fritsch B, Zarahn E, Celnik PA, Krakauer JW. Noninvasive cortical stimulation enhances motor skill acquisition over multiple days through an effect on consolidation. Proc Natl Acad Sci U S A. 2009;106:1590–1595. doi: 10.1073/pnas.0805413106. [DOI] [PMC free article] [PubMed] [Google Scholar]
- Robertson EM, Pascual-Leone A, Miall RC. Current concepts in procedural consolidation. Nat Rev Neurosci. 2004;5:576–582. doi: 10.1038/nrn1426. [DOI] [PubMed] [Google Scholar]
- Robertson EM, Press DZ, Pascual-Leone A. Off-line learning and the primary motor cortex. J Neurosci. 2005;25:6372–6378. doi: 10.1523/JNEUROSCI.1851-05.2005. [DOI] [PMC free article] [PubMed] [Google Scholar]
- Savion-Lemieux T, Penhune VB. The effects of practice and delay on motor skill learning and retention. Exp Brain Res. 2005;161:423–431. doi: 10.1007/s00221-004-2085-9. [DOI] [PubMed] [Google Scholar]
- Savion-Lemieux T, Bailey JA, Penhune VB. Developmental contributions to motor sequence learning. Exp Brain Res. 2009;195:293–306. doi: 10.1007/s00221-009-1786-5. [DOI] [PubMed] [Google Scholar]
- Schendan HE, Searl MM, Melrose RJ, Stern CE. An fMRI study of the role of the medial temporal lobe in implicit and explicit sequence learning. Neuron. 2003;37:1013–1025. doi: 10.1016/s0896-6273(03)00123-5. [DOI] [PubMed] [Google Scholar]
- Schmahmann JD, Doyon J, McDonald D, Holmes C, Lavoie K, Hurwitz AS, Kabani N, Toga A, Evans A, Petrides M. Three-dimensional MRI atlas of the human cerebellum in proportional stereotaxic space. Neuroimage. 1999;10:233–260. doi: 10.1006/nimg.1999.0459. [DOI] [PubMed] [Google Scholar]
- Schmahmann JD, Doyon J, Petrides M, Evans AC, Toga AW. MRI atlas of the human cerebellum. Ed 1. San Diego: Academic; 2000. [DOI] [PubMed] [Google Scholar]
- Seidler RD, Purushotham A, Kim SG, Ugurbil K, Willingham D, Ashe J. Cerebellum activation associated with performance change but not motor learning. Science. 2002;296:2043–2046. doi: 10.1126/science.1068524. [DOI] [PubMed] [Google Scholar]
- Seidler RD, Purushotham A, Kim SG, Ugurbil K, Willingham D, Ashe J. Neural correlates of encoding and expression in implicit sequence learning. Exp Brain Res. 2005;165:114–124. doi: 10.1007/s00221-005-2284-z. [DOI] [PubMed] [Google Scholar]
- Smith SM, Beckmann CF, Ramnani N, Woolrich MW, Bannister PR, Jenkinson M, Matthews PM, McGonigle DJ. Variability in fMRI: a re-examination of inter-session differences. Hum Brain Mapp. 2005;24:248–257. doi: 10.1002/hbm.20080. [DOI] [PMC free article] [PubMed] [Google Scholar]
- Stickgold R, Walker MP. Sleep-dependent memory consolidation and reconsolidation. Sleep Med. 2007;8:331–343. doi: 10.1016/j.sleep.2007.03.011. [DOI] [PMC free article] [PubMed] [Google Scholar]
- Strick PL, Dum RP, Fiez JA. Cerebellum and nonmotor function. Annu Rev Neurosci. 2009;32:413–434. doi: 10.1146/annurev.neuro.31.060407.125606. [DOI] [PubMed] [Google Scholar]
- Talairach J, Tournoux P. Co-planar stereotaxic atlas of the human brain: three-dimensional proportional system. New York: Thieme Medical; 1988. [Google Scholar]
- Willingham DB. A neuropsychological theory of motor skill learning. Psychol Rev. 1998;105:558–584. doi: 10.1037/0033-295x.105.3.558. [DOI] [PubMed] [Google Scholar]
- Wilson MA, McNaughton BL. Reactivation of hippocampal ensemble memories during sleep. Science. 1994;265:676–679. doi: 10.1126/science.8036517. [DOI] [PubMed] [Google Scholar]
- Wolpert DM, Miall RC. Forward models for physiological motor control. Neural Netw. 1996;9:1265–1279. doi: 10.1016/s0893-6080(96)00035-4. [DOI] [PubMed] [Google Scholar]
- Worsley KJ. Spatial smoothing of autocorrelations to control the degrees of freedom in fMRI analysis. Neuroimage. 2005a;26:635–641. doi: 10.1016/j.neuroimage.2005.02.007. [DOI] [PubMed] [Google Scholar]
- Worsley KJ. An improved theoretical P value for SPMs based on discrete local maxima. Neuroimage. 2005b;28:1056–1062. doi: 10.1016/j.neuroimage.2005.06.053. [DOI] [PubMed] [Google Scholar]
- Worsley KJ, Liao CH, Aston J, Petre V, Duncan GH, Morales F, Evans AC. A general statistical analysis for fMRI data. Neuroimage. 2002;15:1–15. doi: 10.1006/nimg.2001.0933. [DOI] [PubMed] [Google Scholar]
- Yousry TA, Schmid UD, Alkadhi H, Schmidt D, Peraud A, Buettner A, Winkler P. Localization of the motor hand area to a knob on the precentral gyrus. A new landmark. Brain. 1997;120:141–157. doi: 10.1093/brain/120.1.141. [DOI] [PubMed] [Google Scholar]