

Abstract
Toll-like receptors play an important role in the innate immune response, although emerging evidence indicates their role in brain injury and neurodegeneration. Alcohol abuse induces brain damage and can sometimes lead to neurodegeneration. We recently found that ethanol can promote TLR4 signaling in glial cells by triggering the induction of inflammatory mediators and causing cell death, suggesting that the TLR4 response could be an important mechanism of ethanol-induced neuroinflammation. This study aims to establish the potential role of TLR4 in both ethanol-induced glial activation and brain damage. Here we report that TLR4 is critical for ethanol-induced inflammatory signaling in glial cells since the knockdown of TLR4, by using both small interfering RNA or cells from TLR4-deficient mice, abolished the activation of microtubule-associated protein kinase and nuclear factor-κB pathways and the production of inflammatory mediators by astrocytes. Our results demonstrate, for the first time, that whereas chronic ethanol intake upregulates the immunoreactive levels of CD11b (microglial marker) and glial fibrillary acidic protein (astrocyte marker), and also increases caspase-3 activity and inducible nitric oxide synthase, COX-2, and cytokine levels [interleukin (IL)-1β, tumor necrosis factor-α, IL-6] in the cerebral cortex of female wild-type mice, TLR4 deficiency protects against ethanol-induced glial activation, induction of inflammatory mediators, and apoptosis. Our findings support the critical role of the TLR4 response in the neuroinflammation, brain injury, and possibly in the neurodegeneration induced by chronic ethanol intake.
Introduction
Inflammation plays a critical role in the pathogenesis of many CNS disorders, including chronic neurodegenerative diseases such as Parkinson's disease (Hunot and Hirsch, 2003), Alzheimer's disease (Giovannini et al., 2003), etc. The hallmark of brain inflammation is the activation of glial cells, primarily microglia and astrocytes, that release free radicals, cytokines, and inflammatory mediators, which can induce brain damage (Lucas et al., 2006). The inflammatory response is usually associated with the activation of innate immunity, specifically with Toll-like receptors (TLRs), the key host molecules in the regulation of the immune response during infections and CNS damage.
TLRs are a family of pattern-recognition receptors that enable the recognition of conserved structural motifs in a wide array of pathogens. Activation of TLRs triggers the downstream stimulation of nuclear factor-κB (NFκB) and the induction of genes that encode inflammation-associated molecules and cytokines (O'Neill, 2003; Akira and Takeda, 2004). Most TLRs are expressed in the CNS, mainly in glial cells (Mishra et al., 2008). Recent evidence demonstrates that these receptors respond to pathogens and host tissue injury (Owens et al., 2005; Trendelenburg, 2008), and they not only play a role in the innate immunity in response to infections but also participate in CNS neurodegeneration and neural injury (Jin et al., 2008; Okun et al., 2009). Activation of the TLR response significantly contributes to neuroinflammation (Chen et al., 2007), and TLR4-deficient mice are protected against ischemic brain damage and injury (Caso et al., 2007; Tang et al., 2007).
Alcohol can cause brain damage (Harper and Matsumoto, 2005) and, in some cases, leads to neurodegeneration (Pfefferbaum, 2004). The neuropathological processes underlying these effects remain elusive. We have demonstrated that chronic ethanol consumption increases cytokines and inflammatory mediators in the rat brain, activating signaling pathways associated with neuroinflammation and triggering cell damage (Valles et al., 2004). We have also shown that ethanol activates TLR4 signaling in astrocytes (Blanco et al., 2005), microglia, and macrophages (Fernandez-Lizarbe et al., 2008), suggesting that activation of the TLR4 response by ethanol could be an important mechanism of ethanol-induced neuroinflammation.
Therefore, by considering the critical role of TLR4 in the neuroinflammation and brain injury, the present study aims to establish the potential role of TLR4 in the ethanol-induced glial activation and brain damage. Here we show that TLR4 is critical for ethanol-induced inflammatory signaling in astrocytes, since the knockdown of TLR4, by using small interfering RNA (siRNA) or cells from TLR4-deficient mice (TLR4−/−), abolished not only the activation of microtubule-associated protein kinase (MAPK) and NFκB signaling pathways but also the production of inflammatory mediators by astrocytes. Our results also demonstrate, for the first time, that although chronic ethanol intake causes microglial and astroglial activation, increases cytokines and caspase-3 activity, and induces COX-2 and inducible nitric oxide synthase (iNOS) expression in the cerebral cortex of wild-type (WT) mice, these events do not occur in the brains of TLR4−/− [knock-out (KO)] mice. These results support the pivotal role of the TLR4 response and glial activation in ethanol-induced brain damage.
Materials and Methods
Animals and ethanol treatment.
Female Wistar rats (Harlan Ibérica) weighing 200–250 g, female C57BL/6 WT mice (Harlan Ibérica), and female TLR4−/− KO mice (C57BL/6 background; kindly provided by Dr. S. Akira, Osaka University, Suita, Japan) were used. All the animals were kept under controlled 12 h light/dark conditions, temperature (23°C), and humidity (60%). After mating, dams were placed in separate cages during the gestation period. All the animal experiments were performed in accordance with the guidelines established by the European Communities Council Directive (86/609/ECC) and by Spanish Royal Decree 1201/2005. All the experimental procedures were approved by the Ethical Committee of Animal Experimentation.
For chronic ethanol treatment, 40 (10 animals per group) 7-week-old female C57BL/6 (WT, TLR4+/+) and TLR4−/− (KO) mice weighing 18–20 g were housed (3 animals per cage) and maintained with water (control WT and TLR4−/−) or water containing 10% (v/v) ethanol and a solid diet ad libitum for 5 months. During this period, the daily food and liquid intake was similar for WT and KO mice and also for the alcohol-treated (per mouse and day, food and fluid intake were 3.26 ± 0.91 g and 3.49 ± 0.5 ml of 10% ethanol in water, respectively) and nontreated (food/fluid daily intake per mouse was 3.32 ± 0.81 g and 3.55 ± 0.92 ml/d of water) groups. Ethanol concentration in the drinking water was progressively increased for the first 2 weeks to finally reach 12.8 ± 1.2 g/kg per body weight over 5 months. Blood ethanol levels achieved in ethanol-treated WT and KO mice were 125 ± 20 mg/dl (range, 87–140 mg/dl) and 122 ± 13 mg/dl (range, 98–135 mg/dl), respectively. The body weight gain at 5 months was similar in the WT mice with or without ethanol treatment (WT, 32.7 ± 1.2 g; WT plus EtOH, 31.1 ± 1.8 g) and in the TLR4−/− mice (TLR4-KO, 30 ± 1.8 g; TLR4 plus EtOH, 31.6 ± 1.6 g). All values are given as mean ± SD.
Blood ethanol determination.
Blood ethanol concentrations were assessed in the morning (8:00 A.M.) by taking blood from the mice tails. Blood was collected in heparinized tubes and centrifuged. Then, ethanol was determined by the spectrophotometric method (Sigma-Aldrich).
Primary culture of astrocytes and treatments.
Primary cultures of rat and mice cortical astrocytes from newborn pups were prepared as described previously (Minana et al., 2001). Cells were plated on 60-mm-diameter plates in DMEM (Invitrogen) containing 20% FBS, supplemented with l-glutamine (1%), glucose (1%), fungizone (1%), and antibiotics (1%). For the nucleofection experiments, Primocin (1:500; Amaxa Biosystems), an antibiotic developed to protect sensitive primary cells from mycoplasma, was used. Cultures were grown in a humidified atmosphere of 5% CO2/95% air at 37°C. After 1 week of culture, FBS was reduced to 10%, and the medium was changed twice per week. Cells were grown to confluence and were used after 12 d in culture. The purity of astrocytes was assessed by immunofluorescence using the following: anti-glial fibrillary acidic protein (GFAP; astrocyte marker; Sigma-Aldrich), anti-CD11b (microglial marker; Serotec), anti-myelin basic protein (MBP; olygodendroglial marker; Sigma-Aldrich), and anti-microtubule-associated protein 2 (MAP-2; neuronal marker; Sigma-Aldrich). Astrocyte cultures were found to be at least 99% GFAP positive. No cells were found to express CD11b, MBP, or MAP-2.
To assess the effect of ethanol (EtOH; 10 or 50 mm) or lipopolysaccharide (LPS; 50 ng/ml) treatments, these compounds were added to DMEM in the absence of serum but in the presence of 1 mg/ml bovine serum albumin. At 0, 10, and 30 min of LPS or ethanol treatment, cells were harvested by trypsinization, centrifuged, and used for the specific determinations. In some experiments, astrocytes were incubated with a medium containing CD14 monoclonal antibody (mAb; 2 μg/ml; Santa Cruz Biotechnology) for 30 min before and during ethanol (50 mm) or LPS (50 ng/ml) treatment. Interleukin-1β (IL-1β) mRNA was determined in cells after 3 h of treatments.
We used sterile toxin-free culture materials for all the experiments. In addition, the possible contamination of ethanol with LPS was determined by using the chromogenic limulus amebocyte lysate test, following the manufacturer's instructions (Lonza Verviers SPRL). The endotoxin content in the ethanol solution was ≤2.98 × 10⁻³ pg/ml, which is far below the concentration required to induce astroglial activation under our assay conditions. However, to further eliminate the LPS-dependent effects, in some experiments the LPS antagonist polymyxin B sulfate (PMBS, 10 μg/ml; Sigma-Aldrich) was added to the cell medium 15 min before and during the 3 h of LPS (50 ng/ml) or ethanol (50 mm) treatment. Then, the IL-1β mRNA levels in the cells were determined.
Transfections.
All the transfections were performed using the Nucleofector II device (Amaxa Biosystems). siRNA targeting different exons of rat TLR4 were purchased from Ambion. To optimize our transfection procedure, different incubation times (24, 48, 72, 96 h) and different siRNA–TLR4 concentrations were tested. Plasmid pmax-GFP, supplied by Amaxa Biosystems, was used as a positive control for transfection efficiency. Under our experimental conditions, 76% of the cells were green fluorescent protein (GFP) positive, as assessed by flow cytometry (Cytomics FC500; Beckman Coulter).
For each transfection, 2 × 10⁶ rat astrocytes were harvested by trypsinization and were then transfected using the astrocyte nucleofector kit (VPG-1007; Amaxa Biosystems) with the following siRNAs: (1) 3.1 μg of siRNA-targeting TLR4 or 30–50 nm negative control siRNA (19 bp scrambled sequence with 3′dT overhangs; Ambion) or (2) 1.3 μg of siRNA-targeting CD14, or MD-2, or nontargeting control (ON-TARGETplus SMART pool siRNA; Dharmacon Research). Knocked-down cells were stimulated at 48 h (TLR4) or 96 h (CD14 and MD-2) after transfection with either LPS (50 ng/ml) or ethanol (50 mm) for 10 or 30 min. Cells were placed in a serum-free medium 24 h before stimulation. After stimulation, cells or supernatants were collected and analyzed by Western blotting, quantitative reverse transcription (RT)-PCR, or ELISA immunoassay.
Western blot analysis.
The protein extracts from the astrocytes cultured with or without stimulation with either ethanol or LPS and the cerebral cortex tissue homogenates were mixed with equal volumes of lysis buffer (1% NP-40, 20 mm Tris-HCl, pH 8, 130 mm NaCl, 10 mm NaF, 10 μg/ml aprotinin, 10 μg/ml leupeptin, 10 mm DTT, 1 mm Na3VO4, and 1 mm PMSF) and were then mixed with SDS buffer and boiled for 5 min. In some experiments, the nuclei were separated following the procedure described by Matsuoka et al. (2002). The protein concentration in the cell lysates was determined by the Bradford assay (Bio-Rad). Cell and nuclei lysates were separated by SDS-PAGE gels and transferred to polyvinylidene difluoride membranes by standard techniques. Membranes were blocked with 5% nonfat dried milk in TBS containing 0.1% Tween 20 (TBS/T) and incubated overnight with the following primary antibodies: anti-TLR4 (1:50; Santa Cruz Biotechnology), anti-IL1RI (1:50; Santa Cruz Biotechnology), anti-MyD88 (1:300; ProSciences), anti-IL-1 receptor-associated kinase (IRAK; 1:200; Santa Cruz Biotechnology), anti-phophorylated extracellular signal-regulated kinase (pERK; 1:250; Santa Cruz Biotechnology), anti-COX-2 (1:300; Cayman Chemical), anti-phospho-IκB-α (1:100; Cell Signaling), anti-NFκB-p65 (1:50; Santa Cruz Biotechnology), and anti-iNOS (1:100; Santa Cruz Biotechnology). After washing with TBS/T, blots were incubated with HRP-conjugated antibodies: anti-mouse IgG (1:1,000) for pERK, anti-goat (1:25,000) for TLR4, and anti-rabbit (1:20,000) for the rest. Blots were developed using the ECL system (ECL Plus; GE Healthcare).
Some membranes were stripped for 1 h at 60°C in an SDS solution (2% SDS, 0.85% 2-ME, and 65 mm Tris-HCl, pH 6.8), washed, and incubated with anti-glyceraldehyde-3-phosphate dehydrogenase (GAPDH; 1:3000; Millipore Bioscience Research Reagents), polyclonal anti-ERK1/2 (1:250; Santa Cruz Biotechnology), and laminin A/C (1:100; Cell Signaling) for 2 h as a loading control. The intensity of the bands was quantified with the Alpha-Ease FC program, the image analysis software Alpha Imager 2200 version (Alpha Innotech).
Brain tissue preparation and immunohistochemistry.
Mice were anesthetized by intraperitoneal injection of sodium penthobarbital (60 mg/kg) and fentanyl (0.05 mg/kg) for analgesia. Animals were then perfused transcardially with 0.9% cold saline containing heparin to be immediately followed by 4% paraformaldehyde (PF) in 0.1 m phosphate buffer, pH 7.4, for tissue fixation. Some mice were killed by cervical dislocation. Brains were removed, dissected, and frozen until used for the determination cytokines and other proteins (e.g., iNOS, COX-2). For immunohistochemistry, PF-fixed brains were removed, postfixed overnight at 4°C with the same fixative solution (4% PF), and stored at 4°C in PBS containing 30% sucrose for cryoprotection. Coronal brain sections (40 μm) were obtained with a cryostat (Microm HM 505E) and collected on polysine glass slides (Menzel-Gläser, Thermo Scientific). Brain sections were treated with citrate buffer, pH 6.0, for 15 min for epitope retrieval (Jiao et al., 1999; Shi et al., 2001; Casella et al., 2004) and incubated with a peroxide quenching solution and 3% methanol-hydroperoxide for 10 min, followed by a blocking solution (5% serum in 0.1% PBS/Tween 20) for 1 h. Sections were subsequently incubated overnight at 4°C with the following antibodies: rabbit polyclonal anti-GFAP (1:100; Sigma-Aldrich), rat monoclonal anti-CD11b (1:350; Abcam), and rabbit polyclonal anti-activated caspase-3 (1:100; Cell Signaling). Sections were then incubated for 30 min with the respective secondary biotinylated antibodies, against rabbit (1:1000; Sigma-Aldrich) or rat (1:200; Vector Laboratories), respectively. The avidin–biotin–peroxidase method (ABC kit; Vector Laboratories) was performed using either 3,3′-diaminobenzidine (DAB; 0.7 mg/ml) or nickel-DAB (0.05% v/v) as a substrate (SIGMA FAST 3,3′-Diaminobenzidine; Sigma-Aldrich) according to manufacturer's protocol. Some sections were then counterstained with hematoxylin and mounted onto glass slides with distyrene-plasticizer-xylene-mounting medium (Sigma-Aldrich). For immunofluorescence, we used coronal brain sections, as described previously, blocked with 5% nonfat dried milk for 1 h and incubated overnight at 4°C with rabbit polyclonal anti-iNOS (1:100; Santa Cruz Biotechnology) or goat polyclonal anti-COX-2 (1:100;Cayman Chemical). Sections were then incubated with the secondary Alexa Fluor-conjugated antibodies, anti-goat (1:500) and anti-rabbit (1:500), respectively, from Invitrogen. Samples were counterstained with Hoescht (1:20,000) as a nuclei marker. Sections were mounted onto glass slides with fluorescent mounting medium (Dako North America). For negative controls, sections were incubated in parallel with either antibody diluent alone or specific IgGs isotype control antibodies to block the nonspecific staining. Immunostainings were visualized and digitally recorded with a camera (DFC-480; Leica Microsystems) mounted onto a microscope (DM-6000B; Leica Microsystems). The quantitative image analysis of the immunoreactivity of CD11b, GFAP, caspase-3, iNOS, and COX-2 in the medial frontal cortex was assessed using MetaMorph software analysis (version 7.0). Specifically, the percentage of the thresholded area occupied by the specific staining relating to the whole tissue area was measured (Maximova et al., 2006). The results are expressed as a fold increase over WT control values. Approximately 18–20 fields of the medial frontal cortex from five to eight coronal brain sections of at least three animals per group were analyzed.
For the double-labeling analysis, coronal brain sections were treated with citrate buffer, pH 6.0, for 15 min for epitope retrieval. Sections were rinsed in PBS solution (0.1 m PBS containing 0.1% bovine albumin and 0.1% Triton X-100, pH 7.4) and incubated overnight at 4°C with the following antibodies: polyclonal anti-COX-2 (1:100; Cayman Chemical), monoclonal anti-GFAP (1:250; Sigma-Aldrich), polyclonal anti-Iba-1 (1 μg/ml; Wako Chemicals), and monoclonal anti-NeuN (1:100; Millipore Bioscience Research Reagents). Brain sections were then incubated with the respective secondary Alexa Fluor-conjugated antibodies (1:500; Invitrogen). For double staining of COX-2/Iba-1, a sequential multi-step protocol was applied (van der Loos, 2008) Briefly, sections were first incubated with anti-Iba-1 followed by biotinylated goat anti-rabbit Ig (1:300). After a blocking step with normal rabbit serum, sections were incubated with anti-COX-2 followed by goat anti-rabbit Alexa Fluor 647 (1:500) and streptavidin–FITC (1:1000). We used 4′-6-diamidino-2-phenylindole (DAPI; 1 μg/ml) as a nuclei marker. Negative controls were performed by replacing the respective primary antibodies by isotype-matched irrelevant IgG. In addition, the staining pattern of double labeling was carefully compared with the staining on adjacent tissue sections. Sections were mounted onto glass slides with fluorescent mounting medium (Dako North America). Images were acquired using a TCS-SP2-AOBA confocal laser-scanning microscope (Leica Microsystems) using a 40× Plan-HCX PL APO CS40x1.25 oil objective. The excitation wavelengths for fluorochromes were as follows: 488 nm (argon laser) for Oregon Green, 633 nm (HeNe) for Alexa Fluor 633 and Alexa Fluor 647, and 405 nm (blue diode) for DAPI. For the colocalization studies, two-dimensional pseudo color images (255 color levels) were gathered with a size of 1024 × 1024 pixels. All the confocal images were acquired using the same settings, and the fluorescence distribution was analyzed using the Leica confocal software Leica Lite (version 2.61). The quantitative analysis was performed by counting 100–500 cells from five medial frontal cortex coronal brain sections per animal and three animals per group.
Tumor necrosis factor-α and IL-1β assays.
Frozen brain cortices were homogenized in 250 mg of tissue/0.5 ml of cold lysis buffer (1% NP-40, 20 mm Tris-HCl, pH 8, 130 mm NaCl, 10 mm NaF, 10 μg/ml aprotinin, 10 μg/ml leupeptin, 10 mm DTT, 1 mm Na3VO4, and 1 mm PMSF). Brain homogenates were kept on ice for 30 min and centrifuged at the maximun speed for 15 min; the supernatant was collected, and protein levels were determined by the Bradford assay (Bio-Rad). The tumor necrosis factor-α (TNF-α) and IL-1β levels in the brains were measured with commercial mouse TNF-α (BMS607/2) and mouse IL-1β (BMS6002) ELISA kits from Bender MedSystems following the manufacturer's instructions.
RNA isolation, RT-PCR, and quantification of mRNA levels.
RNA was isolated from the brain cortices, using Tri Reagent (Sigma) according to the manufacturer's instructions. The amount of purified RNA was estimated by measuring the absorbance at 260 nm, and its purity was assessed by the 260/280 nm ratio. The RNA integrity was examined by agarose gel electrophoresis. RNA (1 μg) of each sample was reverse transcribed using the Transcriptor First Strand cDNA Synthesis kit (Roche). Diluted cDNA (3 μl) was amplified in a rapid thermal cycler (LightCycler Instrument; Roche Diagnostics) in 10 μl of LightCycler 480 SYBR Green I Master (Roche) and 0.5 μm of each oligonucleotide. The sequence of both the forward and reverse primers used in this study was as follows: caspase-3, 5′-TGGAGGCTGACTTCCTGTATG-3′ (forward) and 5′-AATTCCGTTGCCACCTTC-3′ (reverse); IL-6, 5′-AAGCCAGAGTCCTTCAGAGAGA-3′ (forward) and 5′-TCTTGGTCCTTAGCCACTCCT-3′ (reverse); SP1, 5′-ACAAGCCCAGACAATCACC-3′ (forward) and 5′-TGTATCCCATCACCACCAG-3′ (reverse); rat IL-1β, 5′-TCATCTGGGATCCTCTCCAGTCAGG-3′ (forward) and 5′-AGCTCCACGGGCAAGACATAGG-3′ (reverse). The mRNA levels of the housekeeping genes SP1 or CypA were used as an internal control for normalization. To ensure that treatments did not alter housekeeping mRNA levels, the Ct values were compared between groups. No significant differences were found in SP1 or CypA mRNA levels. PCR amplicons were confirmed to be specific by size and melting curve analysis. For the quantification of the PCR products, the exponential phase of the amplification and the melting curve analysis were performed with the LightCycler 480 quantification software, as recommended by the manufacturer's instructions.
Statistical analysis.
All the statistical parameters used in experiments were calculated using the SPSS Statistics software program 17.0 (SPSS). Statistical comparison between groups was performed by using the Mann–Whitney U nonparametric test with a Kolmogorov–Smirnov normality test or Student's t test. For RT-PCR, one-way ANOVA was used, following a significant F value and post hoc analysis (Student–Newman–Keuls). Significant differences were considered to be p < 0.05.
Results
siRNA-mediated suppression of the TLR4 function abolished ethanol-induced astrocytes' activation
Our previous results have demonstrated that ethanol (50 mm) is capable not only of activating TLR4 signaling in rat astrocytes but also of inducing a fast phosphorylation of several kinases (IRAK, MAPKs) and triggering the activation of NFκB and the induction of inflammatory mediators (Blanco et al., 2005). Therefore, to address the functional importance of the TLR4 receptors in ethanol-induced inflammatory signaling in astrocytes, we knocked down the expression of this receptor by using siRNA targeting TLR4. Then, cells were stimulated with ethanol. We used siRNA-targeting exon 1/2 boundary and exon 3 of rat TLR4 and a negative control siRNA (NegCsiRNA). Transfection of siRNAs was assessed by nucleofection with a relatively high efficiency (∼76%), as demonstrated by interference from GFP-encoding control plasmid pmax-GFP (Fig. 1B). After 48 h of transfection, astrocytes were stimulated with either LPS (50 ng/ml) or ethanol (50 mm) for 30 min. Transfection of siRNA downregulated the TLR4 protein levels in astrocytes with or without LPS or ethanol (50 mm) treatments (Fig. 1A,C). Although we used two siRNAs targeting different TLR4 exons, both were very efficient in downregulating TLR4. Furthermore, the ethanol-induced activation of the NKκB-p65 subunit was also markedly reduced in the TLR4-siRNA-transfected cells (Fig. 1D) compared with either nontransfected cells or the nonsilencing control siRNA-transfected cells, suggesting that TLR4 contributes to the ethanol-induced activation of NFκB-p65.
Figure 1.

Gene silencing of TLR4 downregulates the TLR4 expression and reduces NFκB activation induced by ethanol in astrocytes in culture. A, Western blot of TLR4 in astrocytes. At 48 h after transfection with different siRNAs, cells were stimulated with either LPS (50 ng/ml) or ethanol (50 mm) for 30 min. A negative control for siRNA (NegC siRNA), untransfected cells [control (C)], and GAPDH (loading control) were assessed. B, Transfection efficiency was determined by using pmax-GFP plasmid (scale bar, 200 μm). The inset shows details of astrocytes expressing GFP (scale bar, 50 μm). C, D, Forty-eight hours after transfection with TLR4 siRNA (silencing either exon 1/2 boundary or exon 3), astrocytes were stimulated with ethanol (50 mm) for 30 min, and the TLR4 and NFκB-p65 levels were determined in cell lysates or nuclear extracts, respectively. GAPDH and Lamin A/C were used as loading controls. A representative Western blot of each protein is shown. Data show the average of three to four independent experiments. Densitometry values represent the mean ± SEM (*p < 0.05; **p < 0.01; ***p < 0.001; Student's t test).
CD14 and MD-2 participate in ethanol-induced astroglial activation
Activation of TLR4 by LPS requires the involvement of MD-2 and CD14. MD-2 is required for TLR4-dependent cell activation by endotoxin, whereas CD14 is needed for maximal sensitivity (Akashi et al., 2003). Therefore, to investigate whether CD14 and MD-2 contribute in ethanol-induced TLR4 activation, we used two experimental approaches: siRNA targeting MD-2 and CD14 and blocking antibodies. For the first approach and after the validation of siRNA, we observed that the depletion of CD14 or MD-2 occurred after 96 h of siRNA transfection (data not shown). Then, rat astrocytes were transfected with CD14-siRNA or MD-2-siRNA or with nonsilencing control siRNA. After 96 h of transfection, cells were stimulated with either ethanol (50 mm) or LPS for 10 or 30 min. Then the levels of pERK and the nuclear NFκB-p65 subunit were determined. As shown in Figure 2A, the siRNA-mediated knockdown of the MD-2 gene expression decreased both pERK and NFκB-p65 activation induced by either LPS or ethanol (Fig. 2B). Similar results were obtained when assessing the siRNA targeting CD14 (Fig. 2A,B).
Figure 2.

CD14 and MD-2 are involved in the ethanol-induced TLR4 response. A, Rat astrocytes were transfected with siRNA targeting CD14 or MD-2 or with a nontargeting control (ON-TARGETplus SMART pool siRNA). After 96 h of transfection, cells were stimulated with either LPS (50 ng/ml) or ethanol (50 mm) for 10 or 30 min, and the levels of pERK and NFκB-p65 were determined in cell lysates or nuclear extracts, respectively. A representative Western blot of each protein is shown. B, Rat astrocytes were preincubated with anti-CD14 mAb, 30 min before and during the 3 h of LPS (50 ng/ml) or ethanol (50 mm) treatment. C, In some experiments, cells were treated with LPS or ethanol for 3 h, in the presence or in the absence of Polymixin B (10 μg/ml). The IL-1β mRNA levels in cells were measured. Data show the average of three independent experiments. Densitometry values represent the mean ± SEM (*p < 0.05; **p ≤ 0.01; ***p < 0.001; p < 0.05; Student's t test). C, Control; ns, not significant.
In the second approach, we used an anti-CD14 mAb (Gong et al., 2002). For these experiments, astrocytes were incubated 30 min before and during the 3 h of LPS (50 ng/ml) or ethanol (50 mm) treatment. Then, the IL-1β mRNA levels in the cells were determined. Incubation with anti-CD14 mAb significantly reduced the upregulation of IL-1β mRNA induced by LPS. It also decreased the levels of IL-1β mRNA induced by ethanol, although these changes were not statistically significant (Fig. 2C). We also assessed the possible LPS-dependent effects in ethanol-treated samples, and PMBS (10 μg/ml), an LPS scavenger, was added to the cell medium 15 min before and during LPS or ethanol treatment. The results in Figure 2C show that whereas the presence of PMBS abolished the LPS-induced increase in the IL-1β mRNA levels, this compound did not significantly modify the ethanol-induced IL-1β mRNA levels, excluding that these effects were attributable to LPS contamination.
Astrocytes from TLR4-deficient mice are not activated by ethanol
To further confirm the role of the TLR4 function in ethanol-induced astroglial activation, astrocytes from TLR4-deficient mice were used, and cells were stimulated with either ethanol or LPS. For these experiments, we used the 10 mm ethanol concentration, because previous studies have demonstrated that this is the lowest concentration that activates TLR4 signaling in astrocytes (Blanco et al., 2005, 2008). The stimulation of WT mice astrocytes with either ethanol (10 mm) or LPS (50 ng/ml) induced a rapid increase (within 10 min) in MyD88 and in pERK, as well as a subsequent IκB phosphorylation and nuclear activation of the NFκB-p65 subunit, after 30 min of treatment (Fig. 3). The early changes in MyD88 and ERK phosphorylation clearly indicate the stimulation of TLR4 signaling by both compounds. Furthermore, the levels of COX-2 and iNOS were also upregulated after 30 min of ethanol treatment (Fig. 3). Conversely, neither ethanol nor LPS induced the activation of MyD88/NFkB-p65 or the upregulation of inflammatory mediators (COX-2 and iNOS) in TLR4-deficient cells. These results strongly support the role of TLR4 in the ethanol-induced inflammatory signaling in astrocytes.
Figure 3.

Effects of ethanol on TLR4 signaling and the iNOS and COX-2 levels in the astrocytes of the WT and TLR4-KO mice. A, Astrocytes were stimulated with either LPS (50 ng/ml) or ethanol (10 mm) for 10 or 30 min. The levels of MyD88 and pERK were analyzed after 10 min of LPS or ethanol stimulation. Phosphorylation of the IκB-α, (pIκB-α), NFκB-p65, COX-2, and iNOS levels was assessed after 30 min during LPS or ethanol treatment. A representative Western blot of each protein is shown. GAPDH, ERK 1/2, and Lamin A/C were used as loading controls. B, Densitometry values represent the mean ± SEM. from at least six individual experiments (*p < 0.05; **p < 0.01; Student's t test).
In vivo chronic ethanol treatment induces astroglia and microglia activation in cerebral cortex: role of the TLR4 receptors
Glial activation is a marker of neuroinflammation and is also associated with the pathology of neurodegenerative disorders (Heneka et al., 2005). Therefore, to evaluate the in vivo role of the TLR4 receptors in ethanol-induced glial activation and neuroinflammation, astrocytes and microglia immunoreactivities were determined in the cerebral cortices of the WT (WT-TLR4+/+) and TLR4 KO (KO-TLR4−/−) mice treated with ethanol over a 5 month period (see Materials and Methods).
To assess the reactive astrocytes, GFAP, an astrocyte-specific intermediate filament component, was used because the upregulation of GFAP is a biological marker of neurotoxicity after cerebral injury (Otani et al., 2006) and it also contributes to neurodegeneration (Maragakis and Rothstein, 2006). Figure 4 shows that whereas cortical GFAP-positive staining appeared to be randomly distributed within the cortices of the nontreated WT control mice (Fig. 4Aa), chronic ethanol treatment upregulated GFAP immunoreactivity in the layers (IV–VI) of the cerebral cortices of the WT mice, where evident cell hypertrophy was observed in some astrocytes (Fig. 4Ab, see inset). The quantification of the GFAP-positive cells (Fig. 4B) demonstrates that although GFAP immunoreactivity markedly increased (∼16-fold) in the medial frontal cortex of the WT ethanol-treated mice, the levels of this protein only increased ∼3-fold in the TLR4-KO ethanol-treated animals (Fig. 4B) compared with untreated controls. In addition to the frontal cortex, astrogliosis was also notably observed in other brain areas, such as the hippocampus of WT ethanol-treated mice (data not shown).
Figure 4.

Coronal brain sections of the medial frontal cortex of both WT and TLR4-KO mice with or without chronic ethanol treatment were immunostained for GFAP and CD11b. A, A significant upregulation of GFAP (b) and CD11b (f) immunoreactivity was observed in the ethanol-treated WT mice versus the WT nontreated controls (a, e; scale bar, 200 μm). Some hypertrophic astrocytes (GFAP immunoreactivity) surrounding the lesion area (layers IV–VI) are observed in the ethanol-treated WT mice (b). The inset in b shows details of astrocytic hypertrophy (scale bar, 20 μm). In the ethanol-treated TLR4-KO mice, a moderate increase in the GFAP immunoreactivity is also noted (d) when compared with the nontreated TLR4-KO animals (c). No significant changes in CD11b immunoreactivity were observed between the ethanol-treated (h) and the nontreated KO (g) mice (scale bars: 200 μm; inset, 50 μm). B, Bars represent the values of the quantification of GFAP and CD11b immunoreactivity expressed as the percentage of the thresholded area occupied by the specific staining in relation to the whole area versus the WT control. Values represent the mean ± SD. of three animals per group and five to six high-power fields analyzed per coverslip. **p < 0.01; ***p < 0.001 (Mann–Whitney U nonparametric test, with a Kolmogorov–Smirnov normality test).
Chronic ethanol intake also induced microglial activation in the cerebral cortex of the WT-mice (Fig. 4Af), as revealed by the upregulation in CD11b, a microglial marker, immunoreactivity. However, the levels of CD11b immunoreactivity were similar in both ethanol-treated and nontreated TLR4-KO mice (Fig. 4A,B), thus suggesting the critical role of the TLR4 in the ethanol-induced glial activation.
Sustained activation of TLR4 signaling is induced by chronic ethanol intake
To assess whether the activation of glial cells observed in the ethanol-treated WT mice is associated with the stimulation of TLR4 signaling, we determined the levels of MyD88, pERK, and the nuclear activation of NFκB-p65 in the cerebral cortices of the WT and TLR4-KO animals with and without ethanol. The results in Figure 5A illustrate that although chronic ethanol intake in the WT mice increased the levels of MyD88 and in pERK, it promoted a persistent nuclear activation of the NFκB-p65 subunit associated with a reduction in IκB phosphorylation (Fig. 5B). However, this treatment did not induce significant changes in the levels and/or activation of the above-mentioned proteins in TLR4-KO animals. Furthermore, chronic ethanol treatment markedly upregulates CD14 in the WT mice but not in TLR4-KO animals (Fig. 5A). Therefore, these results support the role of the CD14/TLR4 complex in the initiation of the inflammatory signaling by ethanol.
Figure 5.

Chronic ethanol intake increases the levels of MyD88, pERK, CD14, and NFκB-p65. Western blot analysis of MyD88, pERK, and CD14 was performed in total cerebral cortex homogenates (A), whereas that of NFκB and IκB-α was performed in the nuclear or cytoplasmic extracts (B), respectively. GAPDH and Lamin A/C were used as loading controls. A representative blot of each protein is shown. Bars represent the densitometry quantification of three to four different experiments. Values represent the mean ± SEM. *p < 0.05; **p < 0.01 (Mann–Whitney U nonparametric test, with a Kolmogorov–Smirnov normality test or a Student's t test).
Role of the TLR4 receptors in the upregulation of cytokines and inflammatory mediators induced in the brain of chronic ethanol-fed animals
Activation of TLR4/NFκB signaling (Takeda and Akira, 2004) can trigger the transcriptional induction of the genes encoding cytokines and other inflammatory mediators (e.g., iNOS and COX-2) (Perkins, 2000). Therefore, we first determined the TNF-α, IL-1β, and IL-6 levels in the cerebral cortices of the WT and TLR4-KO animals treated with or without alcohol. Figure 6 shows how chronic ethanol treatment upregulated the levels of TNF-α, IL-1β, and mRNA IL-6 in the cortex homogenates of the WT mice, whereas no changes were observed in the levels of these cytokines in the cerebral cortices of the TLR4-KO mice.
Figure 6.

Levels of TNF-α (top), IL-1β (middle), and IL-6 mRNA (bottom) from brain cortex homogenates. Analysis of TNF-α and IL-1β was conducted by ELISA, whereas IL-6 cytokine mRNA was measured by RT-PCR. Values represent the mean ± SEM. of five to eight individual experiments, **p < 0.01 (Mann–Whitney U nonparametric test, with a Kolmogorov–Smirnov normality test or a Student's t test).
Next, we assessed the iNOS and COX-2 expression levels in cerebral cortices. Western blotting analyses demonstrate that although chronic ethanol treatment increased the expression of iNOS (Fig. 7A) and COX-2 (Fig. 7C) in the cerebral cortices of the ethanol-treated WT mice, the induction of these proteins did not take place in the cortices of the TLR4-KO mice. In agreement with these results, the immunohistochemical analysis also reveals that the immunoreactivity of iNOS (Fig. 7B) and COX-2 (Fig. 7D) was significantly higher in the medial frontal cortex of the WT ethanol-treated mice than in the nontreated animals. Conversely, ethanol treatment did not enhance iNOS and COX-2 immunoreactivities in the cortices of the TLR4-KO mice (Fig. 7B,D).
Figure 7.

Role of the TLR4 receptors in the ethanol-induced upregulation of the iNOS and COX-2 expressions in the cerebral cortices. A, C, The iNOS and COX-2 protein levels were assessed by Western blotting analysis in the cerebral cortices of the WT and the TLR4-KO mice treated with or without alcohol for 5 months. Values represent the mean ± SEM. of four to six independent experiments. *p < 0.05 (Student's t test). B, D, iNOS and COX-2 immunostaining was performed in the brain sections from the medial frontal cortex (scale bars: a, b, e, f, 200 μm; c, d, g, h, 50 μm). Bars represent the values of the quantification of iNOS and COX-2 immunoreactivity expressed as the percentage of the thresholded area occupied by the specific staining in relation to the whole area versus WT control. For quantification, five to eight high-power fields were analyzed per coverslip. Values represent the mean ± SD. of at least three animals per group; *p < 0.05 and ***p < 0.005 versus the WT control animals (Mann–Whitney U nonparametric test, with a Kolmogorov–Smirnov normality test or a Student's t test).
To obtain more information about the cellular localization of COX-2 upregulation, double-labeling immunohistochemistry was performed (Fig. 8). In the medial frontal cortices from the WT control mice, the expression of COX-2 was poorly detected in neurons (NeuN+, 13.5 ± 3%), astrocytes (GFAP+ 24 ± 5.4%), and microglia (Iba-1+, 25 ± 2.4%) (Fig. 8). However, the percentage COX-2 immunoreactivity that colocated with astrocytes, microglia, and neurons markedly increased in chronic ethanol-fed WT mice (GFAP+, 84 ± 15%; Iba-1+, 73 ± 0.9%; NeuN+, 51 ± 11%) compared with the WT nontreated controls. The double-labeling studies also revealed that COX-2 expression in neurons and microglia was similar in ethanol-treated and untreated TLR4-KO animals (TLR4-KO Iba-1+, 28 ± 3.4%; TLR4-KO plus EtOH, 27 ± 1.5%) and comparable with the WT nontreated controls. However, COX-2 labeling slightly increased in GFAP+ astrocytes (45 ± 2.9%) of ethanol-treated TLR4-KO mice compared with nontreated TLR4-KO controls (23.2 ± 4.5%). These results support the critical role of the TLR4 receptors in alcohol-induced glial activation and neuroinflammation.
Figure 8.
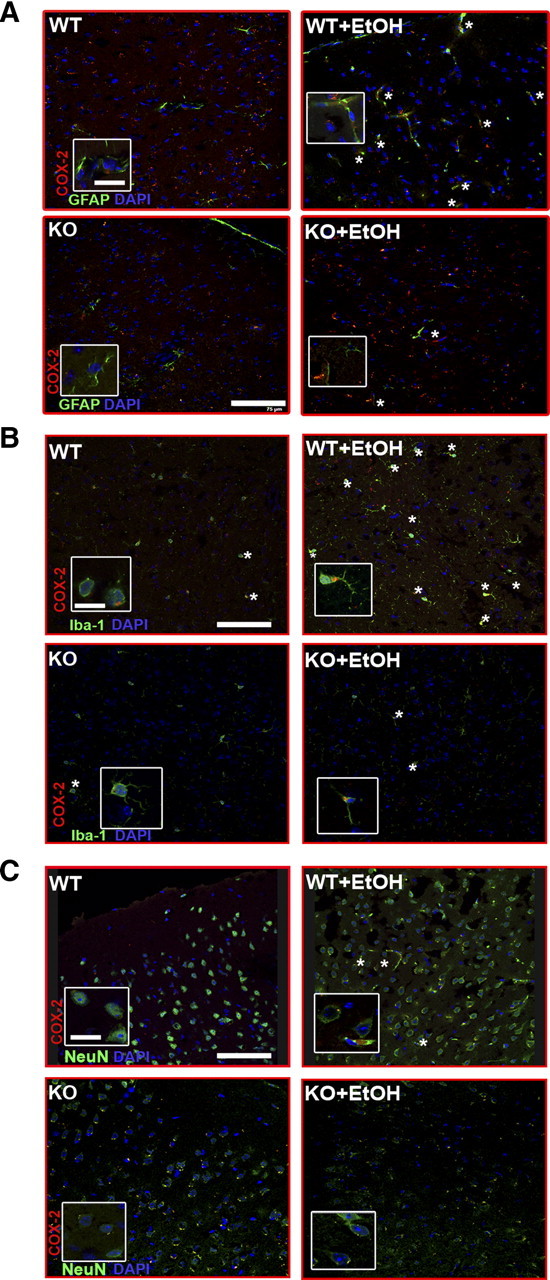
Double-labeling immunofluorescence of COX-2 with GFAP+ astrocytes, or Iba1+ microglial cells, or NeuN+ neurons in the medial frontal cortex of the WT and TLR4-KO mice treated with or without ethanol for 5 months. Images were acquired using a Leica TCS-SP2-AOBA confocal laser-scanning microscope. Immunolabeling of COX-2 (red) with GFAP+ astrocytes (A), or with Iba1+cells (B), or with NeuN+ neurons (C) is shown. A high proportion of the immunoreactivity of COX-2 colocated with astrocytes or microglia or neurons from the brain sections from ethanol-treated WT mice (asterisks). Scale bars, 75 μm. Higher-magnification images from boxes, 15 μm.
Chronic ethanol treatment induces caspase-3 activation
To explore the possibility that the upregulation of inflammatory mediators induced by ethanol in the WT mice could lead to neural cell death, we determined the caspase-3 levels. The immunohistochemical analysis demonstrates that the density of caspase-3 immunoreactivity was significantly higher in the medial frontal cortex of the ethanol-treated WT mice (Fig. 9A) than in the nontreated mice. According to these findings, the Western blot analysis shows caspase-3 activation as the appearance of the ∼17 kDa caspase-3 cleavage fragment in cerebral cortices of the ethanol-treated WT animals. Conversely, chronic ethanol treatment did not induce caspase-3 activation in the TLR4-KO animals, as revealed by both caspase-3 immunoreactivity and the appearance of the 17 kDa fragment (Fig. 9B). Similarly, caspase-3 mRNA levels significantly increased in cerebral cortices of the chronic ethanol-treated WT mice, but no significant changes were noted in TLR4-KO mice (Fig. 9C). These results suggest that ethanol-induced activation of the inflammatory mediators may contribute to the brain damage and that TLR4 plays a crucial role in these events.
Figure 9.

Caspase-3 levels in the frontal cortex of both the WT and TLR4-KO mice treated with or without chronic ethanol treatment. A, Significant upregulation of caspase-3 immunostaining was observed in the medial frontal cortex of the WT mice treated with ethanol versus the nontreated control animals. DAB with hematoxylin counterstain (scale bars: 200 μm; inset, 50 μm) is shown. Quantification values of caspase-3 immunoreactivity represent the mean ± SEM (3 animals per group), with 10 high-power fields analyzed per coverslip. ***p < 0.001 (Mann–Whitney U nonparametric test, with a Kolmogorov–Smirnov normality test). B, Western blot analysis showing the caspase-3 cleavage fragment of ∼17 kDa in the cerebral cortices of the WT mice chronically treated with ethanol. GAPDH was used as a loading control. C, Levels of caspase-3 mRNA. Values represent the mean ± SEM. of six animals per group. *p < 0.05 (Student's t test).
Discussion
Alcohol abuse can cause brain damage, cognitive dysfunctions, and even neurodegeneration in some cases (Crews and Nixon, 2009). Cerebral white matter atrophy and neuronal loss in the frontal cortex, the hypothalamus, and the thalamus are some of the alterations observed in alcoholic brains (Harper et al., 2003, 2005; Harper and Matsumoto, 2005). The pathogenesis of alcohol-induced brain damage is not well understood. We previously found that chronic ethanol intake upregulates inflammatory mediators in the brain and stimulates the signaling pathways and transcription factors associated with the activation of the IL-1RI/TLR4 receptors (Valles et al., 2004). We suggested that alcohol, by activating the TLR4 receptor signaling in glial cells (Blanco et al., 2005), can induce neuroinflammatory brain injury (Blanco and Guerri, 2007). The results of this study support this hypothesis and demonstrate that TLR4 is critical for the ethanol-induced inflammatory signaling in astrocytes, since the knockdown of TLR4 abolished the activation of the MAPK and NFκB pathways as well as the production of inflammatory mediators by astrocytes. It is worth stressing that we also demonstrate that although chronic ethanol intake promotes glial activation, enhances NFκB-p65 nuclear translocation, and upregulates inflammatory factors and caspase-3 activity in cortices of WT-TLR4 mice, deficiency in the TLR4 function protects against these deleterious events. These results demonstrate the relevance of the TLR4 response in the ethanol-induced neuroinflammation and brain injury for the first time.
Activation of both the TLR receptors and glial cells contributes to brain inflammation and neurodegeneration (Kielian, 2006; Farina et al., 2007; Tang et al., 2007; Okun et al., 2009). Most of the TLRs are expressed in microglia and astrocytes (Kielian, 2006; Carpentier et al., 2008), and their expression can be altered in pathological states. Our previous findings demonstrate that ethanol at low/moderate concentrations activates the TLR4 receptors in astrocytes, triggers NFκB activation, and leads to the induction of an inflammatory response (Blanco et al., 2005), suggesting that TLR4 activation in glial cells is a critical event in the ethanol-induced inflammatory processes. The findings presented here also support the role of the TLR4 response in the induction of inflammatory mediators induced by ethanol in astrocytes since knocking down the function of TLR4, by using either siRNA or cells from the TLR4-KO mice (TLR4−/−), abolishes the activation of the MAPK and NFκB pathways and the production of inflammatory mediators in glial cells. Activation of NFκB by acute ethanol treatment has also been observed in vitro in human astroglial cells (Davis and Syapin, 2004).
Astrocytes play important roles in the repairing and scarring processes after brain and spinal cord injury (Farina et al., 2007). Indeed, reactive hypertrophic astrogliosis is a marker of neuroinflammation and is also associated with the neurodegenerative disorders (Heneka et al., 2005; Vanzani et al., 2005; Rodriguez et al., 2009). Our immunohistochemical and biochemical data reveal that in vivo chronic ethanol intake induces astroglial activation and astrogliosis in the cerebral cortices of normal mice, as demonstrated by the marked upregulation of GFAP immunoreactivity along with hypertrophic astrocytes, which are events associated with CNS injury (Wilhelmsson et al., 2006; Chvatal et al., 2007; Barcia et al., 2008). A marked upregulation of microglial cells was also observed in WT mice after long-term ethanol treatment. Indeed, microglia are the immune cells in the nervous system, and they express multiple TLRs that are an essential component of the microglial innate immune response (Block et al., 2007). Evidence from our laboratory indicates that ethanol, by triggering the TLR4 MyD88-dependent and -independent pathways, activates not only microglial cells in culture (Fernandez-Lizarbe et al., 2009) but also the production of inflammatory mediators. In fact, our in vitro findings in microglia also reveal that 50 mm ethanol triggers a greater TLR4 response and production of inflammatory mediators than in astrocytes. However, lower ethanol concentrations (as low a 10 mm) are capable to activate TLR4 signaling in astrocytes but not in microglial cells in culture. The present in vivo findings also support the pivotal role of the TLR4 receptors in the activation of both microglia and astroglia induced by ethanol, since the deficiency of TLR4 function markedly reduces astroglia hypertrophy and completely abolishes microglia activation.
Activation of glial cells is a critical event in the neuroinflammatory processes (Streit et al., 2004; Block et al., 2007), and the data presented here demonstrate that ethanol-induced glial activation is associated with the upregulation of inflammatory cytokines (IL-1β, TNF-α, IL-6), iNOS, and COX-2 in cerebral cortices of the ethanol-treated WT mice. A deficient TLR4 function prevents both glial activation and the inflammatory reaction, thus supporting the role played by the TLR4 function in these processes. Activation of microglia along with brain cytokine production has also been reported after 10 daily doses of ethanol (Qin et al., 2008). Notably, an increased expression of the proinflammatory cytokine MCP-1 (monocyte chemoattractant protein 1) and microglial activation as well as astrogliosis have been demonstrated by postmortem analyses in alcoholic brains (Koga et al., 1978; He and Crews, 2008). These results in humans highlight the significance of the present findings and suggest that glial activation and inflammatory processes also occur in chronic alcoholics.
NFκB is an important transcription factor found downstream to the TLR4-mediated signaling pathway (Takeda and Akira, 2004). Activation of TLR4 stimulates IκB-α phosphorylation and degradation, resulting in the nuclear translocation of NFκB, which initiates the transcription of genes associated with innate immune responses and inflammation (Khorooshi et al., 2008; Wu et al., 2009). Our findings show that the phosphorylation levels of IκB-α and the nuclear NFκB-p65 subunit translocation significantly increase in both ethanol-stimulated astrocytes and in the cerebral cortices of the ethanol-treated WT mice. We also show that ethanol intake promotes a sustained activation of the TLR4/NFκB pathway in WT animals. Elimination of the TLR4 receptor function prevents ethanol-induced NFκB activation and cytokine upregulation, suggesting the critical role of TLR4/NFκB in the ethanol-induced inflammatory process in the brain.
Neurodegeneration, brain injury, and neuroinflammation are associated not only with increased cell apoptosis but also with the activation of a key proteolytic enzyme in this process, caspase-3 (Kothakota et al., 1997; Krajewska et al., 1997; Tang et al., 2007, 2008; Louneva et al., 2008; Lambertsen et al., 2009). Our immunohistochemical findings in WT mice fed chronically with ethanol reveal that inflammatory processes occur concomitantly with caspase-3 activation, suggesting an increase in programmed cell death. Augmented TUNEL (terminal deoxynucleotidyl transferase-mediated biotinylated UTP nick end labeling)-positive cells have been observed in the brains of human alcoholics (Ikegami et al., 2003). Interestingly, we demonstrate that neither inflammatory mediators nor caspase-3 activation are observed in the cerebral cortices of TLR4-KO animals, indicating that the alcohol-induced TLR4 response triggers inflammatory processes and apoptosis. A recent study suggests that the TLR4 response can also induce oxidative stress and neuronal injury (Haorah et al., 2008), which agrees with a role of TLR4 in ethanol-induced brain damage and possibly in neurodegeneration.
Regarding the mechanisms by which ethanol activates the TLR4 receptors, we have shown that ethanol can activate or inhibit TLR4 by interacting with membrane lipids. Low/moderate ethanol concentrations (10–50 mm, in the range found in the blood of social drinkers and alcoholics) (Adachi et al., 1991) are capable of promoting translocation and clustering of TLR4 and CD14 and the signaling molecules (IRAK, MyD88, ERK) into the lipid rafts (Blanco et al., 2008; Fernandez-Lizarbe et al., 2008). Conversely, high ethanol concentrations or lipid raft-disrupting agents (streptolysin-O or saponin) inhibit ethanol-induced activation of the TLR4 signaling pathway (Blanco et al., 2008; Fernandez-Lizarbe et al., 2008). Although the molecular mechanism of ethanol interactions with TLR4 remains unknown, we demonstrate that the TLR4 coreceptors CD14 and MD-2 participate in ethanol-induced TLR4 activation, since knocking down these proteins by using siRNAs reduces ethanol-induced pERK and the nuclear activation of the NFκB-p65 subunit. CD14 is also upregulated in the cerebral cortex of the ethanol-fed WT animals, but not the TLR4-KO mice, thus supporting the role of this protein in ethanol-induced TLR4 activation. An upregulation of CD14 also occurs after intracranial LPS administration (Xia et al., 2006). TLR4 receptors can also be activated by endogenous molecules (e.g., fibrinogen, fibronectin, heat shock proteins), in addition to pathogen-associated molecular patterns, suggesting that TLRs not only participate in the CNS in the response to pathogens but also regulate the subsequent host reactions to injury (Owens et al., 2005; Tanga et al., 2005). It is therefore conceivable that although ethanol could initiate the inflammatory events by activating TLR4 in glial cells, amplification of the inflammatory events could occur after cell injury via a mechanism in which endogenous ligands activate these receptors, thus contributing to cause brain damage. The role of TLR4 in brain injury has been indicated in a number of recent studies demonstrating that elimination of TLR4 protects against oxidative stress in Alzheimer's disease (Tang et al., 2008), focal cerebral ischemia (Kilic et al., 2008), human immunodeficiency virus-associated neurodegeneration (Salaria et al., 2007), and ischemic brain injury (Tang et al., 2007).
To summarize, the present results provide the first evidence of the critical role of the TLR4 receptor response in neuroinflammation, brain injury, and possible neurodegeneration induced by chronic ethanol intake. These results will contribute to our understanding of ethanol-related brain injury, and they establish the basis of new intervention strategies for preventing ethanol-induced brain damage.
Footnotes
This work was supported by grants from the Spanish Ministry of Science and Innovation (SAF 2009-07503), the Spanish Ministry of Health, the Carlos III Institute (RTA Network, G03/005), Plan Nacional sobre Drogas (G46923421), PROMETEO/2009/072, and General Direct. Drug Dependence, GV. We thank M. March and M. J. Morillo for excellent technical assistance. We also thank Dr. Ulises Gomez-Pinedo and Eva M. Lafuente for invaluable help with the immunohistochemistry and with the confocal microscopy. We are thankful to Dr. S. Akira, who provided us with the TLR4−/− knock-out mice.
References
- Adachi J, Mizoi Y, Fukunaga T, Ogawa Y, Ueno Y, Imamichi H. Degrees of alcohol intoxication in 117 hospitalized cases. J Stud Alcohol. 1991;52:448–453. doi: 10.15288/jsa.1991.52.448. [DOI] [PubMed] [Google Scholar]
- Akashi S, Saitoh S, Wakabayashi Y, Kikuchi T, Takamura N, Nagai Y, Kusumoto Y, Fukase K, Kusumoto S, Adachi Y, Kosugi A, Miyake K. Lipopolysaccharide interaction with cell surface Toll-like receptor 4-MD-2: higher affinity than that with MD-2 or CD14. J Exp Med. 2003;198:1035–1042. doi: 10.1084/jem.20031076. [DOI] [PMC free article] [PubMed] [Google Scholar]
- Akira S, Takeda K. Toll-like receptor signalling. Nat Rev Immunol. 2004;4:499–511. doi: 10.1038/nri1391. [DOI] [PubMed] [Google Scholar]
- Barcia C, Sanderson NS, Barrett RJ, Wawrowsky K, Kroeger KM, Puntel M, Liu C, Castro MG, Lowenstein PR. T cells' immunological synapses induce polarization of brain astrocytes in vivo and in vitro: a novel astrocyte response mechanism to cellular injury. PLoS One. 2008;3:e2977. doi: 10.1371/journal.pone.0002977. [DOI] [PMC free article] [PubMed] [Google Scholar]
- Blanco AM, Guerri C. Ethanol intake enhances inflammatory mediators in brain: role of glial cells and TLR4/IL-1RI receptors. Front Biosci. 2007;12:2616–2630. doi: 10.2741/2259. [DOI] [PubMed] [Google Scholar]
- Blanco AM, Valles SL, Pascual M, Guerri C. Involvement of TLR4/type I IL-1 receptor signaling in the induction of inflammatory mediators and cell death induced by ethanol in cultured astrocytes. J Immunol. 2005;175:6893–6899. doi: 10.4049/jimmunol.175.10.6893. [DOI] [PubMed] [Google Scholar]
- Blanco AM, Perez-Arago A, Fernandez-Lizarbe S, Guerri C. Ethanol mimics ligand-mediated activation and endocytosis of IL-1RI/TLR4 receptors via lipid rafts caveolae in astroglial cells. J Neurochem. 2008;106:625–639. doi: 10.1111/j.1471-4159.2008.05425.x. [DOI] [PubMed] [Google Scholar]
- Block ML, Zecca L, Hong JS. Microglia-mediated neurotoxicity: uncovering the molecular mechanisms. Nat Rev Neurosci. 2007;8:57–69. doi: 10.1038/nrn2038. [DOI] [PubMed] [Google Scholar]
- Carpentier PA, Duncan DS, Miller SD. Glial toll-like receptor signaling in central nervous system infection and autoimmunity. Brain Behav Immun. 2008;22:140–147. doi: 10.1016/j.bbi.2007.08.011. [DOI] [PMC free article] [PubMed] [Google Scholar]
- Casella GT, Bunge MB, Wood PM. Improved immunocytochemical identification of neural, endothelial, and inflammatory cell types in paraffin-embedded injured adult rat spinal cord. J Neurosci Methods. 2004;139:1–11. doi: 10.1016/j.jneumeth.2004.04.008. [DOI] [PubMed] [Google Scholar]
- Caso JR, Pradillo JM, Hurtado O, Lorenzo P, Moro MA, Lizasoain I. Toll-like receptor 4 is involved in brain damage and inflammation after experimental stroke. Circulation. 2007;115:1599–1608. doi: 10.1161/CIRCULATIONAHA.106.603431. [DOI] [PubMed] [Google Scholar]
- Chen H, Koustova E, Shults C, Sailhamer EA, Alam HB. Differential effect of resuscitation on Toll-like receptors in a model of hemorrhagic shock without a septic challenge. Resuscitation. 2007;74:526–537. doi: 10.1016/j.resuscitation.2007.01.031. [DOI] [PubMed] [Google Scholar]
- Chvatal A, Anderova M, Hock M, Prajerova I, Neprasova H, Chvatal V, Kirchhoff F, Sykova E. Three-dimensional confocal morphometry reveals structural changes in astrocyte morphology in situ. J Neurosci Res. 2007;85:260–271. doi: 10.1002/jnr.21113. [DOI] [PubMed] [Google Scholar]
- Crews FT, Nixon K. Mechanisms of neurodegeneration and regeneration in alcoholism. Alcohol Alcohol. 2009;44:115–127. doi: 10.1093/alcalc/agn079. [DOI] [PMC free article] [PubMed] [Google Scholar]
- Davis RL, Syapin PJ. Ethanol increases nuclear factor-kappa B activity in human astroglial cells. Neurosci Lett. 2004;371:128–132. doi: 10.1016/j.neulet.2004.08.051. [DOI] [PubMed] [Google Scholar]
- Farina C, Aloisi F, Meinl E. Astrocytes are active players in cerebral innate immunity. Trends Immunol. 2007;28:138–145. doi: 10.1016/j.it.2007.01.005. [DOI] [PubMed] [Google Scholar]
- Fernandez-Lizarbe S, Pascual M, Gascon MS, Blanco A, Guerri C. Lipid rafts regulate ethanol-induced activation of TLR4 signaling in murine macrophages. Mol Immunol. 2008;45:2007–2016. doi: 10.1016/j.molimm.2007.10.025. [DOI] [PubMed] [Google Scholar]
- Fernandez-Lizarbe S, Pascual M, Guerri C. Critical role of TLR4 response in the activation of microglia induced by ethanol. J Immunol. 2009;183:4733–4744. doi: 10.4049/jimmunol.0803590. [DOI] [PubMed] [Google Scholar]
- Giovannini MG, Scali C, Prosperi C, Bellucci A, Pepeu G, Casamenti F. Experimental brain inflammation and neurodegeneration as model of Alzheimer's disease: protective effects of selective COX-2 inhibitors. Int J Immunopathol Pharmacol. 2003;16:31–40. [PubMed] [Google Scholar]
- Gong JP, Dai LL, Liu CA, Wu CX, Shi YJ, Li SW, Li XH. Expression of CD14 protein and its gene in liver sinusoidal endothelial cells during endotoxemia. World J Gastroenterol. 2002;8:551–554. doi: 10.3748/wjg.v8.i3.551. [DOI] [PMC free article] [PubMed] [Google Scholar]
- Haorah J, Ramirez SH, Floreani N, Gorantla S, Morsey B, Persidsky Y. Mechanism of alcohol-induced oxidative stress and neuronal injury. Free Radic Biol Med. 2008;45:1542–1550. doi: 10.1016/j.freeradbiomed.2008.08.030. [DOI] [PMC free article] [PubMed] [Google Scholar]
- Harper C, Matsumoto I. Ethanol and brain damage. Curr Opin Pharmacol. 2005;5:73–78. doi: 10.1016/j.coph.2004.06.011. [DOI] [PubMed] [Google Scholar]
- Harper C, Dixon G, Sheedy D, Garrick T. Neuropathological alterations in alcoholic brains. Studies arising from the New South Wales Tissue Resource Centre. Prog Neuropsychopharmacol Biol Psychiatry. 2003;27:951–961. doi: 10.1016/S0278-5846(03)00155-6. [DOI] [PubMed] [Google Scholar]
- He J, Crews FT. Increased MCP-1 and microglia in various regions of the human alcoholic brain. Exp Neurol. 2008;210:349–358. doi: 10.1016/j.expneurol.2007.11.017. [DOI] [PMC free article] [PubMed] [Google Scholar]
- Heneka MT, Sastre M, Dumitrescu-Ozimek L, Dewachter I, Walter J, Klockgether T, Van Leuven F. Focal glial activation coincides with increased BACE1 activation and precedes amyloid plaque deposition in APP[V717I] transgenic mice. J Neuroinflammation. 2005;2:22–33. doi: 10.1186/1742-2094-2-22. [DOI] [PMC free article] [PubMed] [Google Scholar]
- Hunot S, Hirsch EC. Neuroinflammatory processes in Parkinson's disease. Ann Neurol. 2003;53(Suppl 3):S49–S58. doi: 10.1002/ana.10481. discussion S58–S60. [DOI] [PubMed] [Google Scholar]
- Ikegami Y, Goodenough S, Inoue Y, Dodd PR, Wilce PA, Matsumoto I. Increased TUNEL positive cells in human alcoholic brains. Neurosci Lett. 2003;349:201–205. doi: 10.1016/s0304-3940(03)00826-7. [DOI] [PubMed] [Google Scholar]
- Jiao Y, Sun Z, Lee T, Fusco FR, Kimble TD, Meade CA, Cuthbertson S, Reiner A. A simple and sensitive antigen retrieval method for free-floating and slide-mounted tissue sections. J Neurosci Methods. 1999;93:149–162. doi: 10.1016/s0165-0270(99)00142-9. [DOI] [PubMed] [Google Scholar]
- Jin JJ, Kim HD, Maxwell JA, Li L, Fukuchi K. Toll-like receptor 4-dependent upregulation of cytokines in a transgenic mouse model of Alzheimer's disease. J Neuroinflammation. 2008;5:23–32. doi: 10.1186/1742-2094-5-23. [DOI] [PMC free article] [PubMed] [Google Scholar]
- Khorooshi R, Babcock AA, Owens T. NF-kappaB-driven STAT2 and CCL2 expression in astrocytes in response to brain injury. J Immunol. 2008;181:7284–7291. doi: 10.4049/jimmunol.181.10.7284. [DOI] [PubMed] [Google Scholar]
- Kielian T. Toll-like receptors in central nervous system glial inflammation and homeostasis. J Neurosci Res. 2006;83:711–730. doi: 10.1002/jnr.20767. [DOI] [PMC free article] [PubMed] [Google Scholar]
- Kilic U, Kilic E, Matter CM, Bassetti CL, Hermann DM. TLR-4 deficiency protects against focal cerebral ischemia and axotomy-induced neurodegeneration. Neurobiol Dis. 2008;31:33–40. doi: 10.1016/j.nbd.2008.03.002. [DOI] [PubMed] [Google Scholar]
- Koga M, Shimono M, Tateishi J, Ikuta F. Chronic alcoholism: report of an autopsy case and comparison with pseudoulegyric type of hepatocerebral degeneration. Folia Psychiatr Neurol Jpn. 1978;32:141–148. doi: 10.1111/j.1440-1819.1978.tb02788.x. [DOI] [PubMed] [Google Scholar]
- Kothakota S, Azuma T, Reinhard C, Klippel A, Tang J, Chu K, McGarry TJ, Kirschner MW, Koths K, Kwiatkowski DJ, Williams LT. Caspase-3-generated fragment of gelsolin: effector of morphological change in apoptosis. Science. 1997;278:294–298. doi: 10.1126/science.278.5336.294. [DOI] [PubMed] [Google Scholar]
- Krajewska M, Wang HG, Krajewski S, Zapata JM, Shabaik A, Gascoyne R, Reed JC. Immunohistochemical analysis of in vivo patterns of expression of CPP32 (Caspase-3), a cell death protease. Cancer Res. 1997;57:1605–1613. [PubMed] [Google Scholar]
- Lambertsen KL, Clausen BH, Babcock AA, Gregersen R, Fenger C, Nielsen HH, Haugaard LS, Wirenfeldt M, Nielsen M, Dagnaes-Hansen F, Bluethmann H, Faergeman NJ, Meldgaard M, Deierborg T, Finsen B. Microglia protect neurons against ischemia by synthesis of tumor necrosis factor. J Neurosci. 2009;29:1319–1330. doi: 10.1523/JNEUROSCI.5505-08.2009. [DOI] [PMC free article] [PubMed] [Google Scholar]
- Louneva N, Cohen JW, Han LY, Talbot K, Wilson RS, Bennett DA, Trojanowski JQ, Arnold SE. Caspase-3 is enriched in postsynaptic densities and increased in Alzheimer's disease. Am J Pathol. 2008;173:1488–1495. doi: 10.2353/ajpath.2008.080434. [DOI] [PMC free article] [PubMed] [Google Scholar]
- Lucas SM, Rothwell NJ, Gibson RM. The role of inflammation in CNS injury and disease. Br J Pharmacol. 2006;147(Suppl 1):S232–S240. doi: 10.1038/sj.bjp.0706400. [DOI] [PMC free article] [PubMed] [Google Scholar]
- Maragakis NJ, Rothstein JD. Mechanisms of disease: astrocytes in neurodegenerative disease. Nat Clin Pract Neurol. 2006;2:679–689. doi: 10.1038/ncpneuro0355. [DOI] [PubMed] [Google Scholar]
- Matsuoka Y, Matsuoka Y, Shibata S, Ban T, Toratani N, Shigekawa M, Ishida H, Yoneda Y. A chromodomain-containing nuclear protein, MRG15 is expressed as a novel type of dendritic mRNA in neurons. Neurosci Res. 2002;42:299–308. doi: 10.1016/s0168-0102(02)00010-x. [DOI] [PubMed] [Google Scholar]
- Maximova OA, Taffs RE, Pomeroy KL, Piccardo P, Asher DM. Computerized morphometric analysis of pathological prion protein deposition in scrapie-infected hamster brain. J Histochem Cytochem. 2006;54:97–107. doi: 10.1369/jhc.5A6758.2005. [DOI] [PubMed] [Google Scholar]
- Minana R, Duran JM, Tomas M, Renau-Piqueras J, Guerri C. Neural cell adhesion molecule is endocytosed via a clathrin-dependent pathway. Eur J Neurosci. 2001;13:749–756. doi: 10.1046/j.0953-816x.2000.01439.x. [DOI] [PubMed] [Google Scholar]
- Mishra BB, Gundra UM, Teale JM. Expression and distribution of Toll-like receptors 11–13 in the brain during murine neurocysticercosis. J Neuroinflammation. 2008;5:53–63. doi: 10.1186/1742-2094-5-53. [DOI] [PMC free article] [PubMed] [Google Scholar]
- Okun E, Griffioen KJ, Lathia JD, Tang SC, Mattson MP, Arumugam TV. Toll-like receptors in neurodegeneration. Brain Res Rev. 2009;59:278–292. doi: 10.1016/j.brainresrev.2008.09.001. [DOI] [PMC free article] [PubMed] [Google Scholar]
- O'Neill LA. The role of MyD88-like adapters in Toll-like receptor signal transduction. Biochem Soc Trans. 2003;31:643–647. doi: 10.1042/bst0310643. [DOI] [PubMed] [Google Scholar]
- Otani N, Nawashiro H, Fukui S, Ooigawa H, Ohsumi A, Toyooka T, Shima K, Gomi H, Brenner M. Enhanced hippocampal neurodegeneration after traumatic or kainate excitotoxicity in GFAP-null mice. J Clin Neurosci. 2006;13:934–938. doi: 10.1016/j.jocn.2005.10.018. [DOI] [PubMed] [Google Scholar]
- Owens T, Babcock AA, Millward JM, Toft-Hansen H. Cytokine and chemokine inter-regulation in the inflamed or injured CNS. Brain Res Brain Res Rev. 2005;48:178–184. doi: 10.1016/j.brainresrev.2004.12.007. [DOI] [PubMed] [Google Scholar]
- Perkins ND. The Rel/NF-kappa B family: friend and foe. Trends Biochem Sci. 2000;25:434–440. doi: 10.1016/s0968-0004(00)01617-0. [DOI] [PubMed] [Google Scholar]
- Pfefferbaum A. Alcoholism damages the brain, but does moderate alcohol use? Lancet Neurol. 2004;3:143–144. doi: 10.1016/S1474-4422(04)00676-3. [DOI] [PubMed] [Google Scholar]
- Qin L, He J, Hanes RN, Pluzarev O, Hong JS, Crews FT. Increased systemic and brain cytokine production and neuroinflammation by endotoxin following ethanol treatment. J Neuroinflammation. 2008;5:10–26. doi: 10.1186/1742-2094-5-10. [DOI] [PMC free article] [PubMed] [Google Scholar]
- Rodriguez JJ, Olabarria M, Chvatal A, Verkhratsky A. Astroglia in dementia and Alzheimer's disease. Cell Death Differ. 2009;16:378–385. doi: 10.1038/cdd.2008.172. [DOI] [PubMed] [Google Scholar]
- Salaria S, Badkoobehi H, Rockenstein E, Crews L, Chana G, Masliah E, Everall IP. Toll-like receptor pathway gene expression is associated with human immunodeficiency virus-associated neurodegeneration. J Neurovirol. 2007;13:496–503. doi: 10.1080/13550280701558616. [DOI] [PubMed] [Google Scholar]
- Shi SR, Cote RJ, Taylor CR. Antigen retrieval techniques: current perspectives. J Histochem Cytochem. 2001;49:931–937. doi: 10.1177/002215540104900801. [DOI] [PubMed] [Google Scholar]
- Streit WJ, Mrak RE, Griffin WS. Microglia and neuroinflammation: a pathological perspective. J Neuroinflammation. 2004;1:14–17. doi: 10.1186/1742-2094-1-14. [DOI] [PMC free article] [PubMed] [Google Scholar]
- Takeda K, Akira S. TLR signaling pathways. Semin Immunol. 2004;16:3–9. doi: 10.1016/j.smim.2003.10.003. [DOI] [PubMed] [Google Scholar]
- Tang SC, Arumugam TV, Xu X, Cheng A, Mughal MR, Jo DG, Lathia JD, Siler DA, Chigurupati S, Ouyang X, Magnus T, Camandola S, Mattson MP. Pivotal role for neuronal Toll-like receptors in ischemic brain injury and functional deficits. Proc Natl Acad Sci U S A. 2007;104:13798–13803. doi: 10.1073/pnas.0702553104. [DOI] [PMC free article] [PubMed] [Google Scholar]
- Tang SC, Lathia JD, Selvaraj PK, Jo DG, Mughal MR, Cheng A, Siler DA, Markesbery WR, Arumugam TV, Mattson MP. Toll-like receptor-4 mediates neuronal apoptosis induced by amyloid beta-peptide and the membrane lipid peroxidation product 4-hydroxynonenal. Exp Neurol. 2008;213:114–121. doi: 10.1016/j.expneurol.2008.05.014. [DOI] [PMC free article] [PubMed] [Google Scholar]
- Tanga FY, Nutile-McMenemy N, DeLeo JA. The CNS role of Toll-like receptor 4 in innate neuroimmunity and painful neuropathy. Proc Natl Acad Sci U S A. 2005;102:5856–5861. doi: 10.1073/pnas.0501634102. [DOI] [PMC free article] [PubMed] [Google Scholar]
- Trendelenburg G. Acute neurodegeneration and the inflammasome: central processor for danger signals and the inflammatory response? J Cereb Blood Flow Metab. 2008;28:867–881. doi: 10.1038/sj.jcbfm.9600609. [DOI] [PubMed] [Google Scholar]
- Valles SL, Blanco AM, Pascual M, Guerri C. Chronic ethanol treatment enhances inflammatory mediators and cell death in the brain and in astrocytes. Brain Pathol. 2004;14:365–371. doi: 10.1111/j.1750-3639.2004.tb00079.x. [DOI] [PMC free article] [PubMed] [Google Scholar]
- van der Loos CM. Multiple immunoenzyme staining: methods and visualizations for the observation with spectral imaging. J Histochem Cytochem. 2008;56:313–328. doi: 10.1369/jhc.2007.950170. [DOI] [PMC free article] [PubMed] [Google Scholar]
- Vanzani MC, Iacono RF, Caccuri RL, Berria MI. Immunochemical and morphometric features of astrocyte reactivity vs. plaque location in Alzheimer's disease. Medicina (B Aires) 2005;65:213–218. [PubMed] [Google Scholar]
- Wilhelmsson U, Bushong EA, Price DL, Smarr BL, Phung V, Terada M, Ellisman MH, Pekny M. Redefining the concept of reactive astrocytes as cells that remain within their unique domains upon reaction to injury. Proc Natl Acad Sci U S A. 2006;103:17513–17518. doi: 10.1073/pnas.0602841103. [DOI] [PMC free article] [PubMed] [Google Scholar]
- Wu N, Siow YL, Karmin O. Induction of hepatic cyclooxygenase-2 by hyperhomocysteinemia via nuclear factor kappa-B activation. Am J Physiol Regul Integr Comp Physiol. 2009;297:R1086–R1094. doi: 10.1152/ajpregu.00293.2009. [DOI] [PubMed] [Google Scholar]
- Xia Y, Yamagata K, Krukoff TL. Differential expression of the CD14/TLR4 complex and inflammatory signaling molecules following i.c.v. administration of LPS. Brain Res. 2006;1095:85–95. doi: 10.1016/j.brainres.2006.03.112. [DOI] [PubMed] [Google Scholar]