

Abstract
Neuronal migration is a complex process requiring the coordinated interaction of cytoskeletal components and regulated by calcium signaling among other factors. Migratory neurons are polarized cells in which the largest intracellular organelle, the nucleus, has to move repeatedly. Current views support a central role for pulling forces that drive nuclear movement. The participation of actomyosin driven forces acting at the nucleus rear has been suggested, however its precise contribution has not been directly addressed. By analyzing interneurons migrating in cortical slices of mouse brains, we have found that nucleokinesis is associated with a precise pattern of actin dynamics characterized by the initial formation of a cup-like actin structure at the rear nuclear pole. Time-lapse experiments show that progressive actomyosin contraction drives the nucleus forward. Nucleokinesis concludes with the complete contraction of the cup-like structure, resulting in an actin spot at the base of the retracting trailing process. Our results demonstrate that this actin remodeling requires a threshold calcium level provided by low-frequency spontaneous fast intracellular calcium transients. Microtubule stabilization with taxol treatment prevents actin remodeling and nucleokinesis, whereas cells with a collapsed microtubule cytoskeleton induced by nocodazole treatment, display nearly normal actin dynamics and nucleokinesis. In summary, the results presented here demonstrate that actomyosin forces acting at the rear side of the nucleus drives nucleokinesis in tangentially migrating interneurons in a process that requires calcium and a dynamic cytoskeleton of microtubules.
Introduction
Neuronal precursors are generated in progenitor areas far from their mature location, making neuronal migration an essential step in the development of the nervous system. Neuronal migration is a cyclic multi-step process initiated by chemotactic response and the extension of a leading process that leaves the soma situated at the cell rear. The cycle is complete when the soma translocates and the trailing process retracts (Tsai and Gleeson, 2005; Marín et al., 2006; Ayala et al., 2007; Kawauchi and Hoshino, 2008). Soma translocation toward the leading process is achieved in two consecutive steps. First the centrosome together with the Golgi apparatus moves forward, leading to the formation of a swelling ahead of the nucleus (Bellion et al., 2005; Schaar and McConnell, 2005; Higginbotham and Gleeson, 2007). Second, the nucleus moves toward the swelling in a step known as nucleokinesis. Two motor proteins: myosin II and cytoplasmic dynein appear directly implicated in nucleokinesis (Vallee et al., 2009), however the precise mechanisms driving the nuclear movement remain yet controversial.
Nuclear movement can be driven by pulling forces exerted ahead of the nucleus, pushing forces from behind, or a combination of both. The predominant view favors pulling forces driving nuclear movement. This is supported by experiments in glial-guided pyramidal cells in which the nucleus is transported along microtubules (MTs) by dynein, pulling on the microtubule network from the swelling (Tsai et al., 2007). A recent study suggest that Par6α coordinates the forward movement of the centrosome and soma through myosin light-chain phosphorylation promoting the interaction between filamentous actin (F-actin) and myosin II, thereby suggesting that leading-process myosin II may be pulling the centrosome and soma forward during glial-guided migration (Solecki et al., 2009).
The possible role of additional pushing forces from behind has been suggested. Actomyosin contraction at the cell rear seems to be important in the detachment of cell-substrate interactions (Tsai and Gleeson, 2005). In addition, an accumulation of F-actin and myosin II at the rear of the nucleus has been demonstrated (Bellion et al., 2005; Schaar and McConnell, 2005). All these results, together with the fact that inhibition of non-muscle myosin II blocks nuclear movement, suggest that pushing forces play a prominent role in driving nuclear translocation. However the exact contribution of a pushing mechanism, the dynamics of this process and its regulation remain largely unknown.
Neuronal motility is regulated by intracellular calcium concentration ([Ca2+]i) through its effects on cytoskeletal components (Henley and Poo, 2004; Zheng and Poo, 2007). Calcium signaling relies on precise spatiotemporal patterns resulting from the activity of different mechanisms in which the endoplasmic reticulum (ER) plays a central role (Berridge et al., 2003). However, the participation of the ER in calcium signaling in migrating interneurons and its effects on cytoskeleton dynamics has not been explored.
In this work we have analyzed the spatiotemporal properties of actin dynamics in relation to the process of nucleokinesis in interneurons migrating in cortical slices. We found that nucleokinesis requires actin remodeling and condensation at the rear nuclear pole. Moreover, actin dynamics is coordinated by actomyosin contraction that may squeeze the nucleus toward the leading process. Our experiments further show that actin dynamics requires calcium signaling and an active cytoskeleton of microtubules.
Materials and Methods
Mice and slices.
Female mice were kept at the Instituto de Neurociencias in accordance with Spanish and European Union regulations. The day of vaginal plug was considered to be embryonic day (E) 0.5. Pregnant mice were killed by rapid cervical dislocation and the fetuses (E13.5) extracted by cesarean. Coronal brain slices (250 μm thick) were prepared and cultured as previously described (Soria and Valdeolmillos, 2002).
Explants.
Medial ganglionic eminence (MGE) explants were dissected out from E13.5 wild-type coronal slices. MGE explants were grown in Matrigel matrices (BD Biosciences), and incubated for a total of 36 or 48 h at 37°C in Neurobasal (Invitrogen). After the first 12 h vehicle solution, blebbistatin (Sigma) or latrunculin A (Sigma) were added to culture media.
Focal cell labeling.
CMV-based LifeAct-GFP (kindly provided by Roland Wedlich-Söldner, Max Planck Institute of Biochemistry, Martinsried, Germany), CMV-based Utrophin-GFP (kindly provided by William Bement, University of Wisconsin-Madison, Madison, WI), pCAGGS-based dsRed and nuclear GFP (kindly provided by Domingos Henrique, Faculdade de Medicina de Lisboa, Lisboa, Portugal) expression vectors were pressure injected focally into the MGE of coronal slice cultures and focally electroporated as described by Flames et al. (2004). Using this approach, we labeled a reduced number of relatively scattered interneurons per slice, which allowed clear imaging of individual cells with a good signal-to-noise ratio. For ratiometric experiments, Texas Red (Invitrogen) 3 mm was added to the injected solution. For calcium experiments, Oregon Green 488 BAPTA-1 AM (Invitrogen) 3 mm in PBS was injected focally into the MGE of coronal slices.
Time-lapse videomicroscopy.
Slices were transferred to a recording chamber mounted in the stage of an upright Leica DMLFSA microscope and viewed through 10–63× water-immersion objectives. Slices were continuously perfused at a rate of 1 ml/min with warmed (32°C) artificial CSF containing (in mm): 124 NaCl, 4 KCl, 2.4 CaCl2, 1.3 MgSO4, 1.25 KH2PO4, 26 NaHCO3, and 10 glucose continuously bubbled with a mixture of 95% O2 with 5% CO2. The experimental set-up allows alternative confocal or wide field imaging acquisition. In confocal mode, fluorescence was excited with 488 or 543 laser lines as required. We used scanner speeds of 800 and 4000 Hz, and xyz or xy acquisitions. For wide field fluorescence imaging, cells were excited by a Xenon arc lamp at appropriate wavelengths by means of bandpass filters mounted on a filter wheel controlled by AquaCosmos software (Hamamatsu). Images were acquired with a cooled CCD Orca camera (Hamamatsu) controlled by the same software. BAPTA-AM (Invitrogen) and taxol (Sigma) were added to culture media at least 2 h before imaging. Caffeine (Sigma) and blebbistatin were added to perfusion media.
Image data analysis.
Images were analyzed using ImageJ (National Institutes of Health, http://rsb.info.nih.gov/ij/). All the operations with images were applied to the whole image and the complete z stack. For ratiometric analysis, images were background subtracted by a value measured from a region devoid of cells. The mean gray level plus 4 times the SD was subtracted to the whole image for each channel. The resulting images were linearly stretched to the full (0–255) gray levels range. The consistency of the results was checked by analyzing the effects of slightly different background thresholds, giving essentially the same results. As indicated when appropriate, resulting images were filtered with the mean operator (1 pixel diameter) and displayed with the pseudocolor ratio LUT.
In confocal acquisitions, GFP was excited at 488 nm and fluorescence measured at 505–545 nm. Texas Red was excited at 543 nm and measured at 580–700 nm. To quantify the distribution of GFP in relation to the distribution of Texas Red (used as a volume marker), “green channel” images were digitally divided (32 bits) by the corresponding “red channel” and the result displayed with the pseudocolor ratio LUT.
Kymographs were built from a single or few vertical lines of the region of interest (ROI) in the original movie. To simplify measuring total or ROI fluorescence in migrating cells, the rear end of the cell in different times was aligned to the same Cartesian coordinates. In calcium experiments, bleaching was removed by fitting the baseline to an exponential decay.
Immunofluorescence.
Slices and MGE explants were fixed in 4% paraformaldehyde (PFA, Sigma) at room temperature for 2 h. Each slice was cut into 60 μm-thick sections. Free-floating sections were processed for immunofluorescence by blocking with 0.3% Triton X-100 and 1% BSA (Sigma) in PBS for 1 h, following by overnight incubation with primary antibody diluted in 0.1% Triton X-100 and 0.5% BSA in PBS. Explants were processed for immunofluorescence by blocking with 1% Triton X-100 and 10% NGS (Vector Labs) in PBS for 1 h, following by overnight incubation with primary antibody diluted in 0.3% Triton X-100 and 1% NGS in PBS. When staining cytoskeleton components, taxol (2 μm, Invitrogen) and phalloidin (1 μm, Invitrogen) were added to the fixative solution and incubated at 37°C for 30 min. The following primary antibodies were used: rabbit anti-non-muscle myosin II heavy chain B (1:500, Covance) and rabbit anti-GFP (1:2000, Invitrogen). Secondary antibodies diluted in 0.1% X-100 and 0.5% BSA in PBS for slices or 0.3% Triton X-100 and 1% NGS in PBS for explants were incubated for 2 h. The following secondary antibodies were used: donkey anti-rabbit 488 and goat anti-mouse 594 (1:500, Invitrogen). Cell nuclei were stained using bis-benzamide 1:1000 (Sigma). Filamentous actin (F-actin) was stained using Alexa Fluor 488 Phalloidin (Invitrogen). Slices and explants were mounted using Mowiol-NPG (EMD Biosciences; Sigma). Confocal stacks were acquired in the sequential scanning mode to avoid crosstalk among fluorophores.
Quantification.
For single pairwise comparisons, a two-tailed t test was used. Differences among mean values were tested using ANOVA.
Results
Brain slices retain the in vivo pattern of migration and represent a cell environment close to the physiological situation (Ang et al., 2003). Imaging of moving interneurons was achieved with confocal video-microscopy for spatial resolution complemented by wide field fluorescence images.
Actin remodeling during nucleokinesis
To monitor actin dynamics, we labeled interneurons with LifeAct, a short peptide containing the first 17 amino acids of Abp140 fused to GFP (Riedl et al., 2008). LifeAct labels F-actin structures in eukaryotic cells with the same pattern as phalloidin. In migrating interneurons, LifeAct labels the entire cell, with more intense patterns in the growth cones and cell soma. We have analyzed the changes taking place in the soma and the initial part of the leading process as they are directly relevant to nucleokinesis.
Figure 1, A and A′, shows the essential features of actin dynamics in migrating interneurons. The first image (0:00; minutes:seconds) shows actin homogeneously distributed around the nucleus and in the swelling (green arrowhead). During the period 5:00–7:00, actin transiently condenses at the nuclear pole facing the trailing process (red arrowhead) then becomes homogeneous around the nucleus once more (7:30) and the swelling (11:30). At this time, actin distribution is similar to the pattern recorded in the first image. The period from 11:30 to 20:00 shows the repetition of this sequence of changes, indicating that actin shows a cyclic pattern of distribution characterized by shifts from a homogeneous distribution in the soma to the formation of polarized condensations at the nuclear pole facing the trailing process in a sequence that is repeated during every nucleokinesis.
Figure 1.
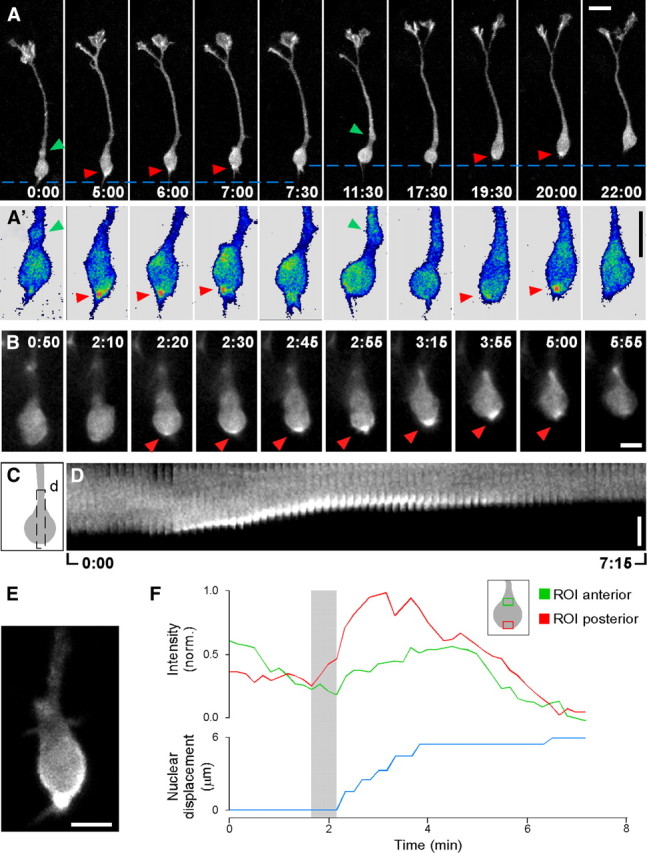
Actin pattern during nucleokinesis in migrating cortical interneurons. LifeAct was electroporated in the MGE of E13.5 slices. Twenty-four hours later, migrating interneurons were recorded at the times indicated (minutes:seconds). In this and all the experiments through the paper the leading process is oriented upwards. A, Maximum projections of confocal stacks (6 sections; total depth = 8.7 μm) acquired at 30 s intervals. The discontinuous lines highlight the nuclear movement. A′, Blowup of LifeAct dynamics in the somatic region. A linear pseudocolor table has been applied to highlight actin condensation spots (red colors) respect to lower levels (blue colors). Green arrowheads point to the swelling formed before nucleokinesis. Red arrowheads point to the actin spot in the posterior pole of the nucleus. In this panel the soma has been aligned to facilitate comparisons. Representative of 15 cells from independent experiments. A complete version of this experiment can be found as supplemental Movie 1, available at www.jneurosci.org as supplemental material. B, Changes in LifeAct pattern at 5 s time resolution. Representative images recorded in the wide field configuration. Red arrowheads point to the actin spot in the posterior pole of the nucleus. Representative of 24 cells from independent experiments. An animated version of this experiment can be found as supplemental Movie 2, available at www.jneurosci.org as supplemental material. C, D, Schema of a cell soma with the ROI (black discontinuous line, C) used to construct the kymograph displaying the whole experiment (D). E, Maximum projection of a confocal stack (3 sections; total depth = 2.1 μm) showing the actin cup-like structure. F, Plot of the nuclear movement (blue line) and the fluorescence changes at the nuclear pole facing the leading (green line) and trailing processes (red line). The gray shadow indicates the period between the initial actin condensation at the rear and nucleokinesis onset. Inset, Schema of a cell soma and both ROIs. Representative of 12 cells from independent experiments. Scale bars, 10 μm (A, A′) and 5 μm (B, D, E).
To correlate the dynamic actin patterns with nuclear movement more precisely we acquired wide field images every 3 s. Figure 1B shows representative images taken at the times indicated. There is continuous actin reorganization in the soma. At time 2:20 actin starts to form a faint condensation in the rear nuclear pole that evolves into an intense rim (2:55–3:15; Fig. 1E) that progressively becomes a spot at the base of the trailing process (3:55–5:00). The last image (5:55) shows a homogeneous pattern that recapitulates the first image of the sequence. Figure 1D shows a kymograph of the region of interest (ROI) depicted in Figure 1C. An increasing actin condensation at the rear clearly corresponds to active nucleokinesis. On the other hand, low levels of homogeneously distributed actin are present during phases of nuclear pause. Figure 1F shows the temporal correlation between nuclear displacement and the fluorescence intensity measured in a ROI at the anterior (green line) and posterior (red line) nuclear poles. Rear actin condensation becomes visible 20–30 s before the onset of nuclear movement, persists throughout the nucleokinesis and disappears when the nucleus stops. Actin fluorescence at the anterior nuclear pole shows a diffuse increase coinciding with nucleokinesis and persisting beyond the active phase of nuclear movement. These differences in timing between fluorescence in the posterior and anterior nuclear pole suggest that the former is responsible for the nuclear movement whereas the later is a consequence of nucleus displacement.
To confirm these observations, we used a reporter based on the actin-binding domain of the Utrophin protein (UTRCH-ABD). The UTRCH-ABD probe has been shown to report the presence of F-actin without altering F-actin concentrations (Burkel et al., 2007). We obtained the same temporal and spatial fluorescence pattern with Utrophin-EGFP (see supplemental Fig. 1A,B, available at www.jneurosci.org as supplemental material) and with LifeAct. To verify that the actin condensations observed with the actin probes corresponded to a net increase of actin we coelectroporate the cytoplasmic marker Texas Red and determined the ratio actin marker/cytoplasmic marker. We found that the ratio signal shows a pattern in relation to nuclear movement that is very similar to the pattern derived from the actin signal alone (supplemental Fig. 1C–E, available at www.jneurosci.org as supplemental material). Essentially the same pattern distribution was obtained measuring the ratio LifeAct versus Texas Red (data not shown).
We then analyzed the impact that the forces due to rear actomyosin contraction have on nuclear dynamics by monitoring nuclear shape and actin distribution in cells under similar conditions. Figure 2, A and A′, shows the nucleus (blue) and the cytoplasm (white) in a cell coelectroporated with nuclear-GFP and dsRed. Initially the nucleus has almost round spheroid morphology and is separated from the swelling (green arrowhead) by a narrow continuity. The beginning of nuclear movement (2:00) is associated with an indentation in the front nuclear pole (red arrowhead) that remains in a fixed position during the entire nucleokinesis. Figure 2B shows the actin pattern in a cell in which the swelling (green arrowhead) is also separated from the nucleus by a narrow gap. The beginning of nucleokinesis is associated with a condensation of actin at the back nuclear pole (0:50). The nucleus starts to shift, initially filling the bridge (2:10, red arrowhead) and then suddenly entering the swelling (2:50). During the active phase of nuclear movement, the actin condensation progressively increases at the nuclear rear becoming an intense spot at the end of nucleokinesis (4:10). Extrapolating this actin pattern to the changes in nuclear shape, it appears that the nuclear indentation is a consequence of the forces acting from the back nuclear pole squeezing the nucleus through a narrow path. Once the bulk of the nucleus has transited this path, nucleokinesis proceeds smoothly and the nucleus recovers its spherical shape when located in the swelling. This can be better appreciated in supplemental Movie 3, available at www.jneurosci.org as supplemental material.
Figure 2.

Nuclear shape deformations and actin condensation during nucleokinesis. A, A′, Time series of a cell coelectroporated with plasmids encoding dsRed (used as a cytoplasmic marker, displayed in white) and nuclear GFP (displayed in blue). Images are maximum projections of confocal stacks (9 sections; total depth = 15 μm). The green arrowhead points to the dilatation. Red arrowheads mark the indentation in the nucleus (2:00–4:00). Representative of 11 cells from 5 independent experiments. B, LifeAct fluorescence imaged in the wide field mode at 5 s intervals of a cell with the swelling bound to the nucleus by a thin bridge of membrane. The green arrowhead points to the dilatation. Red arrowheads point to the initial membrane bridge. An animated version of this experiment can be found as supplemental Movie 3, available at www.jneurosci.org as supplemental material. Scale bars equal 5 μm (A, A′) and 10 μm (B).
To find out whether there is a correlation in the actin and myosin pattern we have performed immunofluorescence experiments for F-actin and non-muscle myosin II heavy chain B in dissociated cells. Figure 3, A and A′, shows representative examples of cells showing a homogeneous distribution of actin and myosin around the nucleus (A) and cells showing intense condensation of actin and myosin in the posterior nuclear pole (A′). These patterns suggest that F-actin and myosin follow a similar dynamic pattern.
Figure 3.
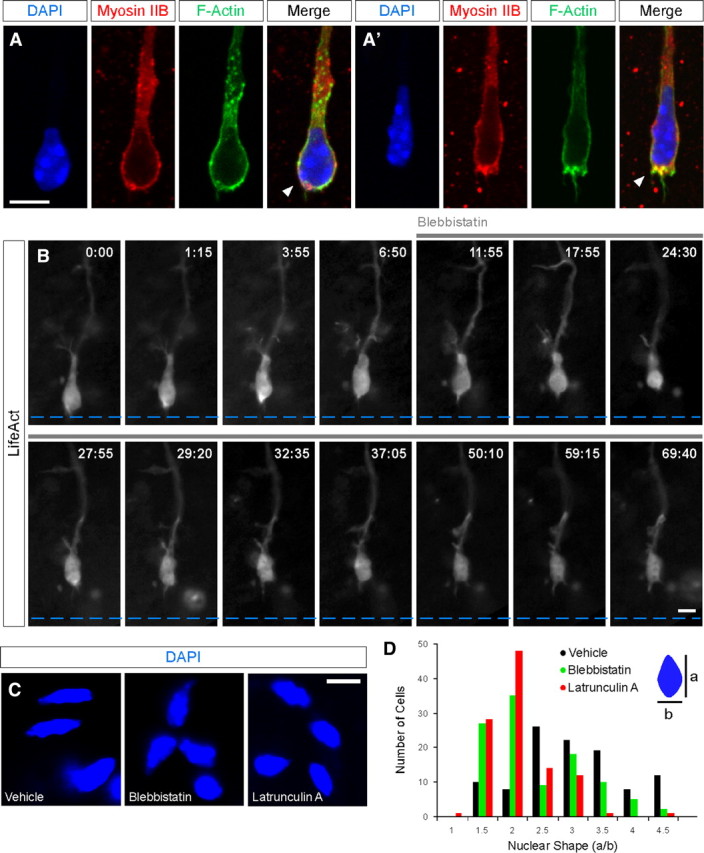
Inhibition of actomyosin contraction impairs actin condensations at the cell rear and nucleus squeezing. A, A′, Myosin IIB, F-actin and DAPI (4′,6′-diamidino-2-phenylindole dihydrochloride) staining in migrating cells from MGE explants after 48 h in culture. Confocal maximal projections show myosin IIB and F-actin colocalization surrounding the nucleus (A, n = 20 cells), in some cases actomyosin is concentrated in the rear pole of the nucleus (A′, n = 6 cells). B, LifeAct fluorescence imaged in the wide field mode at 5 s intervals. Blebbistatin 60 μm was added to the perfusion at 11:55 and remains for the rest of the experiment (n = 4 cells from independent experiments). C, Representative images of the nuclear shape after treatment with vehicle solution, blebbistatin (60 μm) and latrunculin A (1 μm) in migrating cells from MGE explants after 48 h in culture. D, Histogram showing the distribution of nuclear shapes in cells treated with vehicle solution, blebbistatin and latrunculin A. Nuclear shape is measured as the ratio of the diameter parallel to the cell axis to the orthogonal diameter (a/b). Mean values: vehicle, 2.80 ± 0.10; blebbistatin, 2.18 ± 0.08; latrunculin A, 1.84 ± 0.05. Scale bars equal 5 μm (A, A′, B, C).
To confirm the role of actomyosin contraction as the mechanism underlying the appearance of actin condensation at the rear nuclear pole and nuclear movement we used the non-muscle myosin ATPase inhibitor blebbistatin (Straight et al., 2003; Bellion et al., 2005). Figure 3B shows that acute treatment with blebbistatin abolishes the appearance of actin condensations and blocks nuclear movement. Furthermore, MGE explants treated with blebbistatin or the F-actin disrupting agent latrunculin A leads to changes in nuclear shape consistent with the role of actomyosin contraction in squeezing the nucleus (Fig. 3C,D).
Together, the above experiments suggest a causal link between actin reorganization and condensation at the rear pole of the nucleus and nuclear movement, indicating that actomyosin forces from behind drives nucleokinesis. In the next series of experiments we analyzed putative mechanisms regulating these dynamic actin patterns.
Spontaneous calcium signaling in migrating interneurons
Changes in [Ca2+]i play a central role during neuronal migration (Komuro and Kumada, 2005; Zheng and Poo, 2007). As actomyosin contraction has been shown to be a calcium-dependent process (Somlyo and Somlyo, 2003), we sought to analyze calcium signaling in migrating interneurons and its temporal relation to nucleokinesis.
To monitor [Ca2+]i we labeled cells in the MGE by injecting the calcium probe Oregon Green-AM. After 24 h in culture, we measured the fluorescence in isolated cells (Fig. 4A,B′). Figure 4, C and D, shows spontaneous calcium transients in a migrating interneuron. Transients have an irregular pattern appearing either in isolation (asterisk) or in bursts (double asterisk) leading in the latter case to a lasting calcium oscillation. On average, the frequency of spontaneous transients was 0.041 ± 0.004 Hz (n = 14 cells), similar to values recently reported (Bortone and Polleux, 2009). Figure 4E shows the timing of individual spikes extracted from the bulk calcium signal (spikes). The bottom plots the nuclear displacement tracked in the same cell. During the phase of active nucleokinesis (gray shadow), there are periods of nuclear movement associated with either baseline calcium levels or intense calcium activity. These results suggest that there is not a direct temporal correlation between the rate of nuclear movement and the occurrence of calcium transients. This lack of immediate temporal correlation was consistently found in our experiments.
Figure 4.
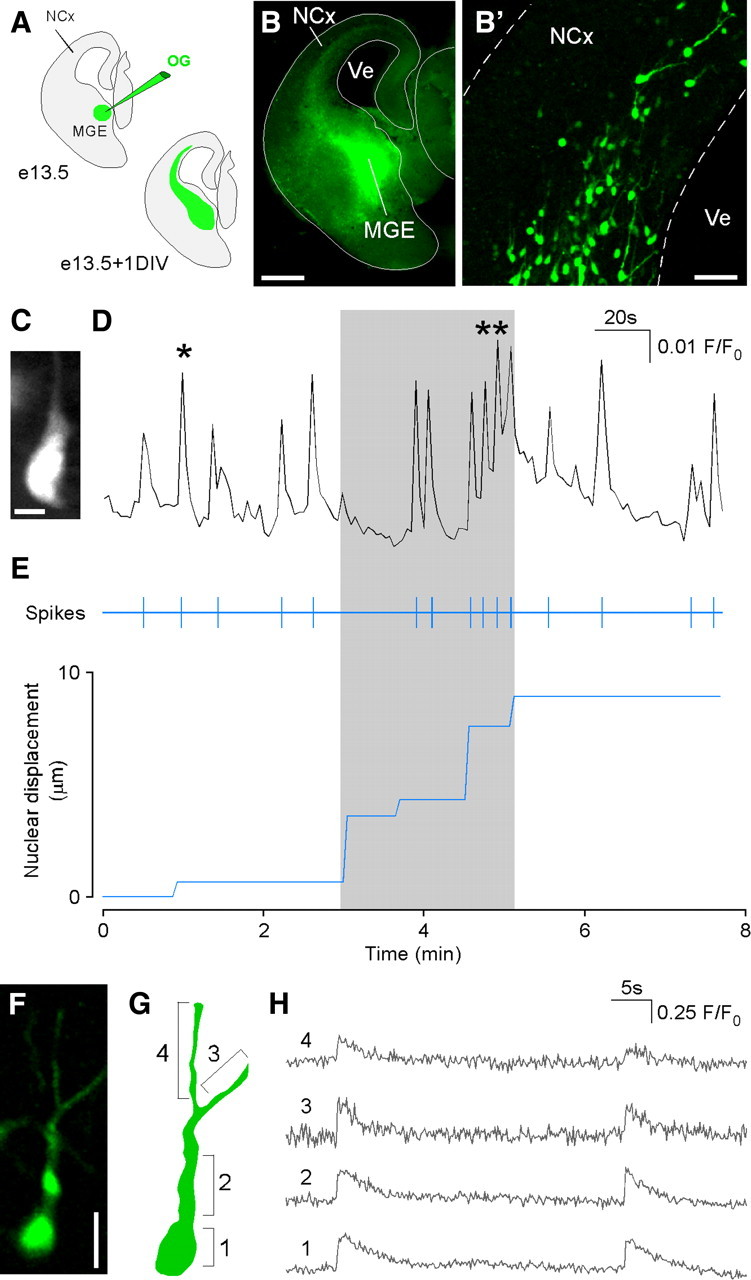
Spontaneous calcium transients in migrating interneurons. A–B′, Schematic diagram of the experimental design. Twenty-four hours after injecting Oregon Green in the MGE, a stream of tangentially migrating cells could be seen (B). Fluorescence from individual cells can be recorded with minimal contamination from neighbor migrating cells (B′). C, D, Spontaneous calcium transients measured in the wide field configuration (image C) at 2 s time resolution. Calcium spikes appear as single or grouped transients (single and double asterisks, respectively, in D). Representative of data obtained in 41 cells. E, Top, Timing of calcium transients (spikes) measured from the record shown in D. Bottom, Plot of the nuclear displacement. The gray shadow highlights the period of active nucleokinesis. F, G, Image and schema of cell locations from where calcium signals were measured: 1 (nuclear region), 2 (swelling) and 3, 4 (branches of the leading process). H, Traces 1–4 show synchronous calcium signals in the corresponding cell locations. No differences were found in the time point of maximum slope of the rising phase of the peaks measured from consecutive cell compartments (see Materials and Methods, one-way ANOVA, p = 0.827, n = 5 cells from independent experiments). NCx, Neocortex; Ve, ventricule; OG, Oregon Green BAPTA-1 AM. Scale bars equal 200 μm (B), 40 μm (B′), 10 μm (C) and 20 μm (F).
Previous work in granule cells has shown that a calcium wave originated in the growth cone that travels to the soma is directly associated to a change in the behavior of the cells upon a chemorepellent activity (Guan et al., 2007). We looked for calcium waves in migrating interneurons by acquiring confocal images in a single plane at the highest temporal resolution compatible with a good signal-to-noise ratio. The trace in Figure 4H shows two consecutive spontaneous calcium transient of a representative cell sampled at 150 ms resolution. Traces 1–4 show calcium signals measured at different cell locations: nuclear region, swelling and the two branches of the leading process. Regardless of cell location, [Ca2+]i transients showed similar kinetics and within our time resolution were synchronous events throughout the entire cell. When the fluorescence signal was measured from a ROI extending for the whole cell perimeter, transient peaked between 300–600 ms (2–4 sampling points) and decreased toward resting levels with a time constant of 6.37 ± 1.13 s (n = 9 cells).
Despite the fact that there is not a direct temporal correlation between calcium transients and nucleokinesis, calcium oscillations are necessary for migration (Bortone and Polleux, 2009) (supplemental Fig. 3, available at www.jneurosci.org as supplemental material). We hypothesized that sporadic calcium transients keep the actin cytoskeleton dynamic during migration enabling actin condensations and nucleokinesis. To test this hypothesis, we manipulated intracellular calcium levels and study the changes in acting dynamics. We first decreased [Ca2+]i by incubating the slices with the fast calcium chelating agent BAPTA. Figure 5, A and B, shows that this treatment abolishes transients and halts nucleokinesis. Actin dynamics show a drastically reduced flux in the perinuclear region with residual and short lasting actin condensations; however we never observed the formation of actin crescents at the rear of the nuclear pole (Fig. 5C,D).
Figure 5.
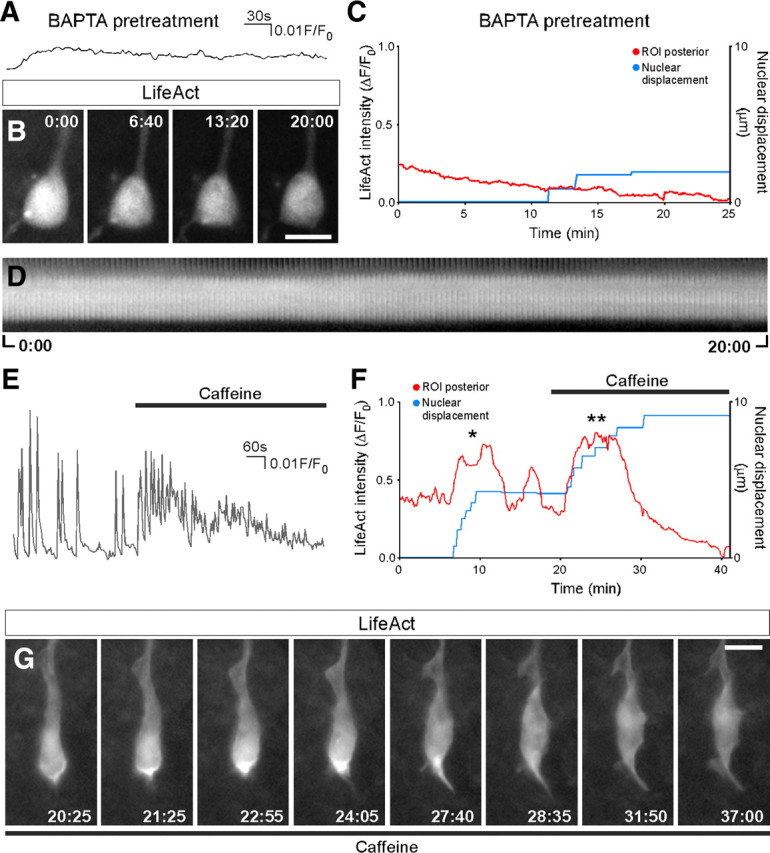
Effects of calcium chelating agents and caffeine on actin dynamics. A, Calcium signal from a migrating interneuron loaded with BAPTA-AM 25 μm (n = 31). B, Effects of calcium chelation on actin pattern (n = 6). C, Plot of actin dynamics (red) and nuclear movement (blue) in cells treated with BAPTA-AM. D, Kymograph actin fluorescence displaying the whole experiment. E, Calcium signal from a migrating interneuron perfused with caffeine 20 mm (n = 6). F, Relationship between actin condensation at the rear nuclear pole (ROI posterior; red trace) and nuclear displacement (blue trace) during the spontaneous (asterisk) and caffeine-induced (double asterisk) nucleokinesis (representative of 4 cells from independent experiments). G, Representative images of the effect of caffeine (applied at 20:25 and kept for the rest of the experiment. Images were acquired in the wide field mode at 5 s intervals. An animated version of the complete experiment can be found as supplemental Movie 4, available at www.jneurosci.org as supplemental material. Scale bars equal 10 μm (B, G).
We then looked for ways to produce controlled increases in intracellular calcium.
The ER is an important element of the calcium signalosome (Verkhratsky, 2002; Berridge et al., 2003; Clapham, 2007) that may be especially important during neuronal migration a stage at which membrane channels and receptors are not fully developed. The expression of ER receptors for inositol trisphosphate (IP3R) and ryanodine (RyR) is precisely regulated in the cerebral cortex during embryonic development (Faure et al., 2001). We tested the effect of caffeine at concentrations that sensitize RyRs to resting calcium levels and promote calcium release through a calcium-induced calcium release (CICR) mechanism (Shirokova and Niggli, 2008). Figure 5E shows that caffeine treatment leads to a burst of high-frequency [Ca2+]i transients that gradually fades-out. In the continuous presence of caffeine, spontaneous transients are abolished and [Ca2+]i remains at resting levels. In parallel experiments, we found that caffeine leads to an immediate nucleokinesis in a sizeable proportion (7 of 13 cells from different experiments) of migrating interneurons. Figure 5G shows representative images of the actin pattern in a cell during caffeine-induced nucleokinesis (20:25–27:40). Figure 5F plots the correlation between LifeAct fluorescence of a ROI at the rear part of the nucleus and nuclear displacement. Both the spontaneous (asterisk) and caffeine elicited nucleokinesis (double asterisk) showed a condensation of actin in the rear part of the nuclear pole. Of note is the fact that in those experiments in which caffeine did not elicited a nucleokinesis there was no actin condensation at any cellular location.
Collectively these results indicate that, to proceed normally, the actin remodeling driving nucleokinesis requires a basal [Ca2+]i provided by spontaneous signaling. Nuclear movement can be stimulated by transiently increasing calcium levels by releasing calcium from the ER. Despite this calcium requirement, there is not a direct temporal relationship between discrete calcium transients and the actual rate of nuclear displacement.
Microtubules and actin dynamics
Cell movement requires the interaction of actin and microtubules (Rodriguez et al., 2003). In our last series of experiments we investigated the role of the microtubule cytoskeleton in nucleokinesis and actin pattern. First we analyzed the effect of the MTs stabilizing agent taxol. Figure 6 shows that the treatment with taxol leads to a halt in nuclear movement. There is a residual actin flux in the nuclear region but we never observed actin condensations at the nucleus rear pole (Fig. 6A,B). In contrast to the effect on somatic actin dynamics, actin remodeling in the growth cone remains very active (Fig. 6C) suggesting that the observed effects on nuclear actin dynamics are not the result of a gross toxic effect of the drug. Given the similarities in actin pattern observed in cells treated with calcium chelating agent and taxol, we check whether the taxol effect could be due to impairment of the calcium signaling. Figure 6D shows that cells treated with taxol display calcium transients similar to the ones observed in nontreated cells. These experiments show that actin remodeling driving nucleokinesis requires a dynamic MTs cytoskeleton.
Figure 6.

Effects of taxol treatment on actin dynamics. A, Representative images of LifeAct fluorescence at the indicated times in a cell treated with taxol 1 μm during the 2 h previous to the experiment. Images were acquired in the wide field mode at 5 s intervals. An animated version of this experiment can be found as supplemental Movie 5, available at www.jneurosci.org as supplemental material. Representative of data obtained in 7 cells. B, Kymograph of a nuclear ROI showing the lack of actin remodeling. C, Representative images of LifeAct fluorescence in the growth cone of the same cell (see supplemental Movie 5, available at www.jneurosci.org as supplemental material). D, Spontaneous calcium transients in a cell pre-incubated with taxol 2 h previous to the experiment. Representative of 7 cells. Scale bars: (A–C), 10 μm.
We next tested the effect of the MTs destabilizing agent nocodazole. Figure 7A shows that acute treatment with nocodazole leads to the retraction of the leading process, giving the cells a shrunken appearance (Baudoin et al., 2008). Despite the alteration in cell morphology, it is possible to observe nuclear movements. Interestingly, the discrete nuclear movements are systematically associated with actin condensation at the rear nuclear pole, with a pattern indistinguishable from the control situation (Fig. 7B). These results suggest that in the absence of an organized MTs cytoskeleton, actin can condense at the nucleus rear and drive nucleokinesis.
Figure 7.

Effect of nocodazole treatment on actin dynamics. A, Time-lapse experiment showing LifeAct fluorescence during a spontaneous nucleokinesis and the effect of bath application of nocodazole 100 nm (applied at 2:00 and kept for the rest of the experiment). Representative of data obtained in 5 cells from independent experiments. B, Kymograph displaying representative periods of control and nocodazole treatment. Scale bars: (A), 10 μm; (B), 5 μm.
Discussion
Our results demonstrate that nucleokinesis in tangentially migrating interneurons is associated with actin dynamics characterized by the formation of actin condensations at the rear nuclear pole. Actomyosin contraction plays an active role during nucleokinesis providing direct evidence for the central role of forces applied on the rear pole of the nucleus in tangentially migrating interneurons.
Previous work in different experimental models suggests that pulling forces from ahead of the nucleus are the main forces driving nucleokinesis in migrating neurons. Such forces seem to be exerted by dynein (Tsai et al., 2007; Umeshima et al., 2007) or actomyosin (Solecki et al., 2009). The possible contribution of pushing forces from behind has been recognized (Bellion et al., 2005; Schaar and McConnell, 2005), however the lack of direct studies on actin dynamics during nucleokinesis has hampered the elucidation of its precise role.
Our time-lapse experiments show continuous actin remodeling in the somatic compartment at all stages of nuclear movement. Two actin patterns are observed: highly polarized during active nuclear movement and homogeneous during pause periods. Before the start of nuclear movement actin begins to condense at the posterior pole of the nucleus, the condensation grows forming a characteristic crescent or cup-like structure centered at the base of the trailing process that may push the nucleus toward the leading process when contracting. At the end of the active phase of nuclear movement the actin condensation ends up as an intense spot at the base of the trailing process.
The same structures are found in myosin IIB stained cells suggesting, together with the lack of actin condensations after blebbistatin treatment, that actomyosin contraction is coordinating actin dynamics. Myosin localization is consistent with previous studies in migrating cortical interneurons and SVZa cells (Bellion et al., 2005; Schaar and McConnell, 2005).
In addition to the actin pattern described above, we also observed less intense condensations at the swelling, where the centrosome is localized. This is reminiscent of results in migrating cerebellar granule cells (Solecki et al., 2009). Although we have not observed consistent actin dynamics at the front nuclear pole preceding or during nuclear movement, we cannot discard a contribution of forces exerted from the swelling.
Our results indicate that actin remodeling requires a dynamic microtubule cytoskeleton as suggested by the blocking effects of taxol treatment. Despite this dependence on MTs dynamics, nuclear movement itself does not require a structured MTs cytoskeleton, as neurons treated with nocodazole still display actin condensations and nuclear movements. Previous work has shown that in migrating cells MTs and F-actin interact and affect each other′s organization and dynamics (Salmon et al., 2002). Microtubule network emanates from the centrosome toward the leading process and nucleus, forming in the later a cage-like structure (Rivas and Hatten, 1995). In migrating pyramidal cells, the MTs plus-end extremes are very plastic structures that grow and retract toward the nucleus (Tsai et al., 2007) providing a possible mechanism for microtubule driven cortical actin flow (Rodriguez et al., 2003). It is likely that similar MTs dynamics occur in migrating interneurons, a possibility that is as yet untested. In addition to their possible role in actin flow, MTs may also act as a directional guide for the nucleus.
During nucleokinesis, the shape of the nucleus is distorted, possibly due to the resistance produced by the dense neuropil (Tsai et al., 2007). In addition, our experiments suggest that actomyosin contraction at the back and the occasionally narrow path separating the nucleus from the swelling exerts enough force to produce the observed distortions in nuclear shape. The dynamic actin pattern observed during nucleokinesis resembles observations in other systems. For instance in the migration of zebrafish primordial germ cells, myosin contraction produces a cytoplasmic flow (here a nuclear flow) and membrane protrusions (Blaser et al., 2006). Interestingly, the protrusions are formed at sites of elevated free calcium where activation of myosin contraction occurs. Likewise in endothelial cells moving in 3D matrices (but not in 2D) compression forces in the central zone of the posterior cell body squeeze the nucleus and change its shape (Martins and Kolega, 2006) and in adhesion-independent migration of leukocytes, where squeezing actomyosin contractions of the trailing edge propel the rigid nucleus through narrow spaces (Lämmermann et al., 2008).
Collectively, the experimental evidence suggests substantial differences in the direction of the forces driving nucleokinesis, from radial glial-guided migration where the emphasis is placed on mechanisms pulling from ahead of the nucleus (Tsai et al., 2007; Umeshima et al., 2007; Solecki et al., 2009) to tangential migration, where forces acting from the rear pole of the nucleus seem to play a central role. The reasons for these differences are unknown but some possibilities can be speculated. An important difference between glial-guided and non-glial-guided neuronal migration resides in the fate of the trailing process during cell movement. Radially migrating pyramidal cells leave behind long trailing processes that transform into axons (Schwartz et al., 1991; Hatanaka and Murakami, 2002). Likewise, during their radial migration cerebellar granule cells leave behind a bifurcated trailing process that will became the characteristic axon (Rakic, 1971). In contrast, tangentially migrating interneurons do not leave behind a long or growing trailing process. This may suggest that interneurons require powerful contracting machinery at the base of the trailing process to ensure its detachment from the substrate, an undesired outcome in the case of glial-guided migrating neurons. Ultimately, these differences may result from differences in the extent of adhesion to the substrate by different migrating neurons. Work in different cellular models has shown that cells display considerable plasticity in their mode of migration depending on the degree of integrin adhesion. In this regard, low adhesion strategies relay on increased actomyosin contractility at the cell rear (Friedl, 2004). The strong effects of the substrate on cell migration lead us to think that the different localization of forces driving nucleokinesis in different neurons may only reflect the preferential use of complementary pulling and pushing mechanisms present in all migrating cells.
Calcium is a ubiquitous signal that participates in different processes and cell domains during cell migration (Gomez and Zheng, 2006; Zheng and Poo, 2007). This has been demonstrated in migrating fibroblasts that keep a rear-to-front calcium gradient in addition to local and short-lived high-calcium micro-domains which are most active at the leading lamella (Wei et al., 2009). In the case of large polarized cells such as migrating neurons, signals for nuclear movement and chemotactic transduction may have different spatial and temporal signatures. Migrating neurons show low frequency transient oscillations of [Ca2+]i. In migrating cortical interneurons and cerebellar cells there is an overall correlation between the frequency of [Ca2+]i transients and the rate of cell migration (Komuro and Rakic, 1996; Komuro and Kumada, 2005; Bortone and Polleux, 2009). Transient [Ca2+]i increments could be triggered by the activation of Gaba and glutamate receptors by ambient neurotransmitters (Owens and Kriegstein, 2002; Luján et al., 2005; Manent et al., 2005; Heng et al., 2007) that may lead to the opening of L-type voltage-sensitive calcium channels (Darcy and Isaacson, 2009).
Our results show that spontaneous calcium transients are in part due to calcium release from the ER. The role of the ER in the regulation of [Ca2+]i transients in migrating interneurons is deduced from the effect of caffeine, producing a transitory increase in calcium oscillations and a later blockade of the calcium signals. These results suggest that the RyRs activated by caffeine, participate in the calcium transients of these cells probably through a CICR mechanism. Spontaneous [Ca2+]i transients are required for actin remodeling, however [Ca2+]i oscillations and the active phase of nuclear movement show very different time courses, indicating that [Ca2+]i transients are a continuous requirement rather than an immediate trigger signal for nuclear movement. Only when a large and maintained [Ca2+]i increment is produced, as in the case of caffeine treatment, the link between intracellular calcium, actin remodeling and nuclear movement is revealed.
Work in isolated granule cells confronted by a chemorepellent Slit gradient found a Ca2+ wave originated at the leading growth cone that propagates in ∼10 s to the soma (Guan et al., 2007). This signal led to the reversal of nuclear movement providing the first direct evidence for the role of the ER during nucleokinesis. In our experiments, at sampling rates of up to 50 ms we have not recorded calcium waves in interneurons migrating in slices, suggesting that calcium waves are not part of the signaling for forward nuclear movement. Alternatively, it is possible that the properties of the ER in interneurons and cerebellar granule cells differ, and the [Ca2+]i waves in interneurons are much faster than in granule cells.
In conclusion by monitoring actin dynamics our results demonstrate that nucleokinesis in tangentially migrating interneurons is primarily driven by actomyosin forces applied to the rear of the nucleus. Actin forms a cup-like structure at the rear nuclear pole in a process that requires calcium and a dynamic cytoskeleton of microtubules. Progressive actomyosin contraction squeezes the nucleus forward and nucleokinesis concludes with the complete contraction of the cup-like structure, resulting in an actin spot at the base of the trailing process.
Footnotes
This work was supported by grants from Spanish Government SAF2008-01488, BFU2009-10342, and CONSOLIDER CSD2007-00023. We thank Sarah Mertens and Maria de los Angeles Casillas Bajo for excellent technical assistance and Dr. Roland Wedlich-Söldner for LifeAct construct, Dr. David Soleki for MLC–Venus construct, and Dr. William Bement for Utrophin–GFP construct. We are very grateful to our colleagues Guillermina López-Bendito, Oscar Marín, Fernando Moya, and Félix Viana for continuous support, helpful discussions, and critical reading of this manuscript.
References
- Ang ES, Jr, Haydar TF, Gluncic V, Rakic P. Four-dimensional migratory coordinates of GABAergic interneurons in the developing mouse cortex. J Neurosci. 2003;23:5805–5815. doi: 10.1523/JNEUROSCI.23-13-05805.2003. [DOI] [PMC free article] [PubMed] [Google Scholar]
- Ayala R, Shu T, Tsai LH. Trekking across the brain: the journey of neuronal migration. Cell. 2007;128:29–43. doi: 10.1016/j.cell.2006.12.021. [DOI] [PubMed] [Google Scholar]
- Baudoin JP, Alvarez C, Gaspar P, Métin C. Nocodazole-induced changes in microtubule dynamics impair the morphology and directionality of migrating medial ganglionic eminence cells. Dev Neurosci. 2008;30:132–143. doi: 10.1159/000109858. [DOI] [PubMed] [Google Scholar]
- Bellion A, Baudoin JP, Alvarez C, Bornens M, Métin C. Nucleokinesis in tangentially migrating neurons comprises two alternating phases: forward migration of the Golgi/centrosome associated with centrosome splitting and myosin contraction at the rear. J Neurosci. 2005;25:5691–5699. doi: 10.1523/JNEUROSCI.1030-05.2005. [DOI] [PMC free article] [PubMed] [Google Scholar]
- Berridge MJ, Bootman MD, Roderick HL. Calcium signalling: dynamics, homeostasis and remodelling. Nat Rev Mol Cell Biol. 2003;4:517–529. doi: 10.1038/nrm1155. [DOI] [PubMed] [Google Scholar]
- Blaser H, Reichman-Fried M, Castanon I, Dumstrei K, Marlow FL, Kawakami K, Solnica-Krezel L, Heisenberg CP, Raz E. Migration of zebrafish primordial germ cells: a role for myosin contraction and cytoplasmic flow. Dev Cell. 2006;11:613–627. doi: 10.1016/j.devcel.2006.09.023. [DOI] [PubMed] [Google Scholar]
- Bortone D, Polleux F. KCC2 expression promotes the termination of cortical interneuron migration in a voltage-sensitive calcium-dependent manner. Neuron. 2009;62:53–71. doi: 10.1016/j.neuron.2009.01.034. [DOI] [PMC free article] [PubMed] [Google Scholar]
- Burkel BM, von Dassow G, Bement WM. Versatile fluorescent probes for actin filaments based on the actin-binding domain of utrophin. Cell Motil Cytoskeleton. 2007;64:822–832. doi: 10.1002/cm.20226. [DOI] [PMC free article] [PubMed] [Google Scholar]
- Clapham DE. Calcium signaling. Cell. 2007;131:1047–1058. doi: 10.1016/j.cell.2007.11.028. [DOI] [PubMed] [Google Scholar]
- Darcy DP, Isaacson JS. L-type calcium channels govern calcium signaling in migrating newborn neurons in the postnatal olfactory bulb. J Neurosci. 2009;29:2510–2518. doi: 10.1523/JNEUROSCI.5333-08.2009. [DOI] [PMC free article] [PubMed] [Google Scholar]
- Faure AV, Grunwald D, Moutin MJ, Hilly M, Mauger JP, Marty I, De Waard M, Villaz M, Albrieux M. Developmental expression of the calcium release channels during early neurogenesis of the mouse cerebral cortex. Eur J Neurosci. 2001;14:1613–1622. doi: 10.1046/j.0953-816x.2001.01786.x. [DOI] [PubMed] [Google Scholar]
- Flames N, Long JE, Garratt AN, Fischer TM, Gassmann M, Birchmeier C, Lai C, Rubenstein JL, Marín O. Short- and long-range attraction of cortical GABAergic interneurons by neuregulin-1. Neuron. 2004;44:251–261. doi: 10.1016/j.neuron.2004.09.028. [DOI] [PubMed] [Google Scholar]
- Friedl P. Prespecification and plasticity: shifting mechanisms in cell migration. Curr Opin Cell Biol. 2004;16:14–23. doi: 10.1016/j.ceb.2003.11.001. [DOI] [PubMed] [Google Scholar]
- Gomez TM, Zheng JQ. The molecular basis for calcium-dependent axon pathfinding. Nat Rev Neurosci. 2006;7:115–125. doi: 10.1038/nrn1844. [DOI] [PubMed] [Google Scholar]
- Guan CB, Xu HT, Jin M, Yuan XB, Poo MM. Long-range Ca2+ signaling from growth cone to soma mediates reversal of neuronal migration induced by slit-2. Cell. 2007;129:385–395. doi: 10.1016/j.cell.2007.01.051. [DOI] [PubMed] [Google Scholar]
- Hatanaka Y, Murakami F. In vitro analysis of the origin, migratory behavior, and maturation of cortical pyramidal cells. J Comp Neurol. 2002;454:1–14. doi: 10.1002/cne.10421. [DOI] [PubMed] [Google Scholar]
- Heng JI, Moonen G, Nguyen L. Neurotransmitters regulate cell migration in the telencephalon. Eur J Neurosci. 2007;26:537–546. doi: 10.1111/j.1460-9568.2007.05694.x. [DOI] [PubMed] [Google Scholar]
- Henley J, Poo MM. Guiding neuronal growth cones using Ca2+ signals. Trends Cell Biol. 2004;14:320–330. doi: 10.1016/j.tcb.2004.04.006. [DOI] [PMC free article] [PubMed] [Google Scholar]
- Higginbotham HR, Gleeson JG. The centrosome in neuronal development. Trends Neurosci. 2007;30:276–283. doi: 10.1016/j.tins.2007.04.001. [DOI] [PubMed] [Google Scholar]
- Kawauchi T, Hoshino M. Molecular pathways regulating cytoskeletal organization and morphological changes in migrating neurons. Dev Neurosci. 2008;30:36–46. doi: 10.1159/000109850. [DOI] [PubMed] [Google Scholar]
- Komuro H, Kumada T. Ca2+ transients control CNS neuronal migration. Cell Calcium. 2005;37:387–393. doi: 10.1016/j.ceca.2005.01.006. [DOI] [PubMed] [Google Scholar]
- Komuro H, Rakic P. Intracellular Ca2+ fluctuations modulate the rate of neuronal migration. Neuron. 1996;17:275–285. doi: 10.1016/s0896-6273(00)80159-2. [DOI] [PubMed] [Google Scholar]
- Lämmermann T, Bader BL, Monkley SJ, Worbs T, Wedlich-Söldner R, Hirsch K, Keller M, Förster R, Critchley DR, Fässler R, Sixt M. Rapid leukocyte migration by integrin-independent flowing and squeezing. Nature. 2008;453:51–55. doi: 10.1038/nature06887. [DOI] [PubMed] [Google Scholar]
- Luján R, Shigemoto R, López-Bendito G. Glutamate and Gaba receptor signalling in the developing brain. Neuroscience. 2005;130:567–580. doi: 10.1016/j.neuroscience.2004.09.042. [DOI] [PubMed] [Google Scholar]
- Manent JB, Demarque M, Jorquera I, Pellegrino C, Ben-Ari Y, Aniksztejn L, Represa A. A noncanonical release of GABA and glutamate modulates neuronal migration. J Neurosci. 2005;25:4755–4765. doi: 10.1523/JNEUROSCI.0553-05.2005. [DOI] [PMC free article] [PubMed] [Google Scholar]
- Marín O, Valdeolmillos M, Moya F. Neurons in motion: same principles for different shapes? Trends Neurosci. 2006;29:655–661. doi: 10.1016/j.tins.2006.10.001. [DOI] [PubMed] [Google Scholar]
- Martins GG, Kolega J. Endothelial cell protrusion and migration in three-dimensional collagen matrices. Cell Motil Cytoskeleton. 2006;63:101–115. doi: 10.1002/cm.20104. [DOI] [PubMed] [Google Scholar]
- Owens DF, Kriegstein AR. Is there more to GABA than synaptic inhibition? Nat Rev. 2002;3:715–727. doi: 10.1038/nrn919. [DOI] [PubMed] [Google Scholar]
- Rakic P. Neuron-glia relationship during granule cell migration in developing cerebellar cortex. A Golgi and electronmicroscopic study in Macacus Rhesus. J Comp Neurol. 1971;141:283–312. doi: 10.1002/cne.901410303. [DOI] [PubMed] [Google Scholar]
- Riedl J, Crevenna AH, Kessenbrock K, Yu JH, Neukirchen D, Bista M, Bradke F, Jenne D, Holak TA, Werb Z, Sixt M, Wedlich-Soldner R. Lifeact: a versatile marker to visualize F-actin. Nat Methods. 2008;5:605–607. doi: 10.1038/nmeth.1220. [DOI] [PMC free article] [PubMed] [Google Scholar]
- Rivas RJ, Hatten ME. Motility and cytoskeletal organization of migrating cerebellar granule neurons. J Neurosci. 1995;15:981–989. doi: 10.1523/JNEUROSCI.15-02-00981.1995. [DOI] [PMC free article] [PubMed] [Google Scholar]
- Rodriguez OC, Schaefer AW, Mandato CA, Forscher P, Bement WM, Waterman-Storer CM. Conserved microtubule-actin interactions in cell movement and morphogenesis. Nat Cell Biol. 2003;5:599–609. doi: 10.1038/ncb0703-599. [DOI] [PubMed] [Google Scholar]
- Salmon WC, Adams MC, Waterman-Storer CM. Dual-wavelength fluorescent speckle microscopy reveals coupling of microtubule and actin movements in migrating cells. J Cell Biol. 2002;158:31–37. doi: 10.1083/jcb.200203022. [DOI] [PMC free article] [PubMed] [Google Scholar]
- Schaar BT, McConnell SK. Cytoskeletal coordination during neuronal migration. Proc Natl Acad Sci U S A. 2005;102:13652–13657. doi: 10.1073/pnas.0506008102. [DOI] [PMC free article] [PubMed] [Google Scholar]
- Schwartz ML, Rakic P, Goldman-Rakic PS. Early phenotype expression of cortical neurons: evidence that a subclass of migrating neurons have callosal axons. Proc Natl Acad Sci U S A. 1991;88:1354–1358. doi: 10.1073/pnas.88.4.1354. [DOI] [PMC free article] [PubMed] [Google Scholar]
- Shirokova N, Niggli E. Studies of RyR function in situ. Methods. 2008;46:183–193. doi: 10.1016/j.ymeth.2008.09.017. [DOI] [PubMed] [Google Scholar]
- Solecki DJ, Trivedi N, Govek EE, Kerekes RA, Gleason SS, Hatten ME. Myosin II motors and F-actin dynamics drive the coordinated movement of the centrosome and soma during CNS glial-guided neuronal migration. Neuron. 2009;63:63–80. doi: 10.1016/j.neuron.2009.05.028. [DOI] [PMC free article] [PubMed] [Google Scholar]
- Somlyo AP, Somlyo AV. Ca2+ sensitivity of smooth muscle and nonmuscle myosin II: modulated by G proteins, kinases, and myosin phosphatase. Physiol Rev. 2003;83:1325–1358. doi: 10.1152/physrev.00023.2003. [DOI] [PubMed] [Google Scholar]
- Soria JM, Valdeolmillos M. Receptor-activated calcium signals in tangentially migrating cortical cells. Cereb Cortex. 2002;12:831–839. doi: 10.1093/cercor/12.8.831. [DOI] [PubMed] [Google Scholar]
- Straight AF, Cheung A, Limouze J, Chen I, Westwood NJ, Sellers JR, Mitchison TJ. Dissecting temporal and spatial control of cytokinesis with a myosin II inhibitor. Science. 2003;299:1743–1747. doi: 10.1126/science.1081412. [DOI] [PubMed] [Google Scholar]
- Tsai JW, Bremner KH, Vallee RB. Dual subcellular roles for LIS1 and dynein in radial neuronal migration in live brain tissue. Nat Neurosci. 2007;10:970–979. doi: 10.1038/nn1934. [DOI] [PubMed] [Google Scholar]
- Tsai LH, Gleeson JG. Nucleokinesis in neuronal migration. Neuron. 2005;46:383–388. doi: 10.1016/j.neuron.2005.04.013. [DOI] [PubMed] [Google Scholar]
- Umeshima H, Hirano T, Kengaku M. Microtubule-based nuclear movement occurs independently of centrosome positioning in migrating neurons. Proc Natl Acad Sci U S A. 2007;104:16182–16187. doi: 10.1073/pnas.0708047104. [DOI] [PMC free article] [PubMed] [Google Scholar]
- Vallee RB, Seale GE, Tsai JW. Emerging roles for myosin II and cytoplasmic dynein in migrating neurons and growth cones. Trends Cell Biol. 2009;19:347–355. doi: 10.1016/j.tcb.2009.03.009. [DOI] [PMC free article] [PubMed] [Google Scholar]
- Verkhratsky A. The endoplasmic reticulum and neuronal calcium signalling. Cell Calcium. 2002;32:393–404. doi: 10.1016/s0143416002001896. [DOI] [PubMed] [Google Scholar]
- Wei C, Wang X, Chen M, Ouyang K, Song LS, Cheng H. Calcium flickers steer cell migration. Nature. 2009;457:901–905. doi: 10.1038/nature07577. [DOI] [PMC free article] [PubMed] [Google Scholar]
- Zheng JQ, Poo MM. Calcium signaling in neuronal motility. Annu Rev Cell Dev Biol. 2007;23:375–404. doi: 10.1146/annurev.cellbio.23.090506.123221. [DOI] [PubMed] [Google Scholar]