

Abstract
Accumulating evidence suggests that changes in neuronal chloride homeostasis may be involved in the mechanisms by which brain insults induce the development of epilepsy. A variety of brain insults, including status epilepticus (SE), lead to changes in the expression of the cation-chloride cotransporters KCC2 and NKCC1, resulting in intracellular chloride accumulation and reappearance of immature, depolarizing synaptic responses to GABAA receptor activation, which may critically contribute to the neuronal hyperexcitability underlying epileptogenesis. In the present study, it was evaluated whether prolonged administration of the selective NKCC1 inhibitor, bumetanide, after a pilocarpine-induced SE modifies the development of epilepsy in adult female rats. The antiepileptic drug phenobarbital, either alone or in combination, was used for comparison. Based on pharmacokinetic studies with bumetanide, which showed extremely rapid elimination and low brain penetration of this drug in rats, bumetanide was administered systemically with different dosing protocols, including continuous intravenous infusion. As shown by immunohistochemistry, neuronal NKCC1 expression was markedly upregulated shortly after SE. Prophylactic treatment with phenobarbital after SE reduced the number of rats developing spontaneous seizures and decreased seizure frequency, indicating a disease-modifying effect. Bumetanide did not exert any significant effects on development of spontaneous seizures nor did it enhance the effects of phenobarbital. However, combined treatment with both drugs counteracted several of the behavioral consequences of SE, which was not observed with single drug treatment. These data do not indicate that bumetanide can prevent epilepsy after SE, but the disease-modifying effect of this drug warrants further studies with more lipophilic prodrugs of bumetanide.
Introduction
A variety of brain insults, including traumatic brain injury, encephalitis, stroke, and status epilepticus (SE), have the potential to induce the development of epilepsy, particularly temporal lobe epilepsy (TLE) in humans and rodent models of TLE (Pitkänen and Lukasiuk, 2009). The mechanisms underlying this process, which is termed epileptogenesis, are only incompletely understood, but include inflammation, neurodegeneration, blood–brain barrier disruption, alterations in expression and function of diverse receptors and ion channels, and development of hyperexcitability of neurons and neuronal circuits (Dichter, 2009; Pitkänen and Lukasiuk, 2009). Enhanced understanding of these epileptogenic mechanisms would ultimately lead to novel strategies allowing prevention or modification of epilepsy by prophylactic antiepileptogenic treatments after brain insults (Dichter, 2009; Jacobs et al., 2009). Until now, such treatments do not exist.
Cation-chloride cotransporters (CCCs), which are important regulators of neuronal Cl− concentration, provide a potentially interesting target for antiepileptogenic treatment (Blaesse et al., 2009). Different proepileptogenic brain insults have been shown to downregulate the K+-Cl− cotransporter KCC2 and upregulate the Na+-K+-2Cl− cotransporter NKCC1, leading to an increase in intracellular Cl− and, consequently, a shift from hyperpolarizing, inhibitory to depolarizing and even excitatory GABA actions that contributes to the development of neuronal hyperexcitability in the hippocampus and parahippocampal areas (Köhling, 2002; Payne et al., 2003; Ben-Ari and Holmes, 2005; Galanopoulou, 2007; Blaesse et al., 2009). Because GABA is typically inhibitory in adults but excitatory at an early developmental stage, the shift to depolarizing action of GABA after brain insults indicates a replay of development programs (Payne et al., 2003; Ben-Ari and Holmes, 2005). In the pilocarpine model of TLE, this shift in GABA equilibrium potential (EGABA) is temporally restricted to the period of epileptogenesis and may constitute a significant mechanism linking injury to the subsequent development of epilepsy (Pathak et al., 2007).
The goal of the present study was to directly address this hypothesis by treating rats with the NKCC1 inhibitor bumetanide after a pilocarpine-induced SE. Bumetanide is a highly potent loop diuretic that selectively blocks NKCC1 at submicromolar concentrations, thereby reducing intracellular chloride concentration (Hannaert et al., 2002; Payne et al., 2003). Bumetanide has been shown to exert neuroprotective effects in rat models of traumatic brain injury (Lu et al., 2006, 2007), but whether this drug also exerts antiepileptogenic activity in models of TLE with spontaneous recurrent seizures (SRS) is not known. In newborn rats, in which GABA is excitatory, administration of bumetanide, either alone or in combination with the antiepileptic drug phenobarbital, exerted an anticonvulsant effect on neonatal seizures, but the combination of both drugs was more efficacious than bumetanide alone (Dzhala et al., 2005, 2008). This prompted us to study bumetanide alone versus phenobarbital alone versus combinations of both drugs as prophylactic treatment in the pilocarpine model of TLE in adult rats in the present study. In addition to determining the effects of prophylactic treatment on development of SRS after pilocarpine-induced SE, we evaluated whether bumetanide or phenobarbital exerted neuroprotective effects or reduced the behavioral alterations associated with epilepsy.
Materials and Methods
Animals.
For the present experiments, Sprague Dawley rats (Harlan Laboratories), weighing 200–230 g, were used. As in our previous studies on pilocarpine-induced epileptogenesis in rats (Glien et al., 2001, 2002; Freichel et al., 2006; Bankstahl et al., 2008; Kuteykin-Teplyakov et al., 2009), we used female rats, because they are easier to handle and eliminate various drugs considerably slower than male rats, which is an advantage for maintaining effective drug levels in studies with prolonged drug administration (Löscher, 2007). Rats were housed under controlled conditions (ambient temperature 24–25°C, humidity 50–60%, lights on from 6:00 A.M. to 6:00 P.M.). Animals were adapted to the laboratories for at least 1 week before being used in the experiments. Food (Altromin 1324 standard diet) and water were available ad libitum. All animal experiments were performed in accordance with the European Communities Council Directive of 24 November 1986 (86/609/EEC) and were formally approved by the animal subjects review board of our institution. All efforts were made to minimize both the suffering and the number of animals. The experimental protocol described in the following is illustrated in Figure 1.
Figure 1.

Schematic illustration of the experimental protocol used in this study. With respect to the time windows shown, it should be noted that histological analysis of neuronal damage was only performed in part of the animals.
Electrode implantation and induction of status epilepticus by pilocarpine.
Approximately 2–3 weeks before the pharmacological experiments in the pilocarpine model, electrodes were implanted into the hippocampus (aimed at the dentate gyrus) under anesthesia (chloral hydrate plus buprenorphine or plus local anesthesia with tetracaine and bupivacaine) for recording of the electroencephalogram (EEG). Stereotaxic coordinates in millimeters relative to bregma according to the atlas of Paxinos and Watson (2007) were as follows: AP −3.9, L −1.7, V −3.5. After 2–3 weeks of postsurgical recovery (including 1 week of postsurgical antibiotic treatment with marbofloxacin), rats received lithium chloride (127 mg/kg, p.o.; Sigma-Aldrich) 14–16 h and methyl-scopolamine (1 mg/kg, i.p.; Sigma-Aldrich) 30 min before pilocarpine treatment. To ensure the occurrence of SE and decrease mortality, individual dosing of pilocarpine was performed by ramping up the dose until onset of SE as described previously (Glien et al., 2001). For this purpose, pilocarpine (Sigma-Aldrich) was administered intraperitoneally at a dose of 10 mg/kg every 30 min until the onset of an SE, consisting of ongoing limbic seizure activity, which was frequently interrupted by generalized convulsive seizures. The total number of pilocarpine injections was limited to five injections per animal. In a total of 119 rats used for the present experiments with pilocarpine, SE could be induced by this protocol of pilocarpine administration in 97 rats (82%), and mortality was very low (5 of the rats died during or after SE). The average dose of pilocarpine for inducing SE was 30 mg/kg (range 20–50 mg/kg). Time to onset of SE was 96 min (range 46–168 min). SE was terminated after 90 min with diazepam (10 mg/kg, i.p.; Ratiopharm) and phenobarbital (25 mg/kg, i.p.). As previously reported (Bankstahl and Löscher, 2008), this treatment was very effective in terminating the pilocarpine-induced SE within 30 min following intraperitoneal administration. All rats were closely observed during the SE and for several hours after termination of SE to exclude differences among rats injected with pilocarpine alone versus the various treatments (see below).
Treatment with phenobarbital during the latency period.
Phenobarbital has a sufficiently long half-life (17 h in female Sprague Dawley rats) to allow maintenance of “therapeutic” drug levels during prolonged treatment by twice daily administration (Löscher, 2007). As described in detail recently (Brandt et al., 2004b), several preliminary experiments were performed to develop a dosing protocol with maximum tolerable doses, resulting in maintenance of plasma drug concentrations within or above the therapeutic range (10–40 μg/ml) (Baulac, 2002) over 24 h/d, 7 d/week. Based on these preliminary experiments, the following treatment protocol was used following the pilocarpine-induced SE: the intraperitoneal bolus dose of 25 mg/kg phenobarbital, which was used in combination with diazepam for terminating SE, was followed 18 h later by an administration of 15 mg/kg (i.p.), and then twice daily (between 7:00 and 8:00 A.M. and 5:00 and 6:00 P.M.) 15 mg/kg (i.p.) for the subsequent days of the treatment period. The treatment period was either 2 weeks (administered alone or in combination with bumetanide; see below) or 5 d in experiments with intravenous infusion of bumetanide (Fig. 1). For drug administration, the sodium salt of phenobarbital (Serva) was dissolved in 0.9% saline and administered at a volume of 3 ml/kg.
Treatment with bumetanide during the latency period.
Compared to phenobarbital, maintenance of effective plasma levels is much more complicated with bumetanide in rats, because its half-life in this species is extremely short (∼10–20 min in adult male Sprague Dawley rats), due to extensive metabolism of bumetanide in rats (Ostergaard et al., 1972; Halladay et al., 1978; Busch et al., 1979; Lee et al., 1994). We therefore used different approaches for dosing protocols. First, we used a low dose (0.2 mg/kg, i.p.) of bumetanide as described previously by Dzhala et al. (2005) for treatment of neonatal seizures in rats. Second, because brain penetration of bumetanide in adult rats may be considerable lower compared to neonates (Feit, 1990), which is also indicated by the low volume of distribution in adult rats (Lee et al., 1994; Kim and Lee, 2001), we administered a high dose (10 mg/kg, i.p.) of this drug. This dose had previously been reported to induce a significant diuretic effect in rats with enhanced elimination of Na+, K+, and Cl−, whereas doses lower than 4 mg/kg (i.p.) were ineffective in this species (Ostergaard et al., 1972). Treatment with either the low or high dose was started immediately after termination of SE. In the first 24 h following SE, these doses of bumetanide were administered at intervals of 3–7 h. On subsequent days, bumetanide was administered twice daily for a period of 2 weeks (Fig. 1). Bumetanide was administered together with phenobarbital, because in a neonatal seizure model in rats, the combination of both drugs was more efficacious than bumetanide alone (Dzhala et al., 2008). At the end of the 2 week treatment period, blood was sampled 0.5 and 14 h after injection for drug analysis in plasma (see below). Before starting the pilocarpine experiments, we evaluated in preliminary experiments whether the low or high dosing protocols of bumetanide affected general behavior, body weight, water consumption, or plasma electrolytes (Na+, K+, Cl−, Ca2+) of the animals. Furthermore, in these preliminary experiments, we determined bumetanide in plasma and, in some experiments, also in the brain.
Another approach for developing an adequate dosing protocol for bumetanide in adult rats was based on the idea to compensate for the rapid elimination of bumetanide in this species by continuous intravenous infusion of bumetanide. First, we performed single-dose experiments with bumetanide in female Sprague Dawley rats to estimate the elimination half-life in the rat strain and gender used in the present study. Based on the elimination half-life thus determined (see Results) and a target plasma concentration of 0.2 μg/ml, we calculated the bolus dose (2 mg/kg, i.p.) and intravenous infusion rate (0.8 mg/kg/h) for maintaining this target concentration in rats, by using the WinNonLin software (Pharsight) for pharmacokinetic modeling. At this plasma concentration, bumetanide had been shown to induce a significant diuretic effect in rats with enhanced elimination of Na+, K+, and Cl− (Ostergaard et al., 1972; Busch et al., 1979). Several preliminary experiments with this bumetanide infusion protocol were performed for analyses of plasma electrolytes and plasma and brain levels of bumetanide (see Results).
For drug administration, bumetanide (Sigma-Aldrich) was dissolved in a small amount of 0.1 m NaOH and final volume was made up with distilled water. The pH of the solution was 11.5, which was tolerated without any adverse effects. For intraperitoneal administration, injection volume was 2 ml/kg; for intravenous infusion, bumetanide was infused at 0.3 ml/kg/h. For intravenous infusion, a flexible polyethylene catheter (0.4 mm outer diameter, 0.2 mm inner diameter; Kleinfeld Labortechnik) was implanted in a jugular vein under anesthesia with chloral hydrate, anchored to the midline neck muscles, and passed under the skin to emerge through the skin of the back of the neck as described in detail previously (Löscher and Hönack, 1995). The catheter was guided through a spring of stainless steel, which prevented it from being destroyed by the rat. A harness was put on the rat and the spring was fixed at the harness. The other end of the catheter and the spring was fixed at a one-channel swivel (22 ga; Instech Laboratories). The swivel was attached to an infusion pump with an eight-syringe rack (Standard Infusion Only Pump 22; Harvard Apparatus), so that eight rats could be infused simultaneously. After surgery, the rats were placed in an acrylic glass cage and were connected to the swivel in such a way that they were able to freely move in the cage. The rats were allowed to recover from surgery for 1 d. During this time the rats were infused with a 25 IU/ml solution of heparinic saline (60 μl/h). Approximately 20–24 h after surgery, lithium chloride was administered orally. On the second day after surgery, SE was induced according to the protocol described above. During the induction of SE, rats remained connected to the swivel and infusion of bumetanide was started immediately after the interruption of SE and a bolus injection of bumetanide (2 mg/kg, i.p.). Infusion was performed over 5 subsequent days. Rats (n = 9) in which infusion had to be terminated because of technical problems before this intended period of 5 d were excluded from final evaluation. The rationale for limiting infusion to the first 5 d after SE was twofold. First, behavioral hyperexcitability of SE rats in response to the infusion setup (see Results) restricted the duration of infusion. Second, more importantly, several lines of evidence indicate that hippocampal increases in NKCC1 expression and EGABA shift occur within 24 h after pilocarpine-induced SE and that EGABA recovers to control values within 1–2 weeks after SE [Pathak et al., 2007; Li et al., 2008; present data (see Results)].
Rats exhibited intense wet-dog shaking during drug infusion after SE (see Results). To investigate whether the behavioral response to infusion was drug induced, due to SE, or due to the infusion setup per se, additional rats (n = 4) were first infused with saline for 24 h and then with bumetanide (0.8 mg/kg/h) for 24 h before induction of SE. Following this treatment, SE was induced and rats were infused with saline immediately after termination of SE (see Results). We did not perform the whole series of experiments illustrated in Figure 1 in an additional control group with 5 d saline infusion after SE, because (1) the behavioral experiments in drug-treated SE rats were performed 4–7 months after the 5-d-infusion paradigm (Fig. 1), so that it is very unlikely that the wet-dog shaking behavior of SE rats in response to the infusion setup affected their behavior recorded in the chronic epileptic phase; and (2) in a previous study, in which we included 12 SE rats with saline infusion for 1–5 d (using the same infusion setup as in the present study), no alterations on epileptogenic outcome measures were observed in comparison to SE rats that obtained repeated intraperitoneal saline injections (M. Langer, C. Brandt, and W. Löscher, unpublished data).
Analysis of bumetanide and phenobarbital in plasma and brain.
Blood was sampled by retro-orbital puncture (after local anesthesia with tetracaine) for drug analysis in plasma. For some of the experiments with bumetanide, brain regions (hippocampus, amygdala, piriform cortex) were dissected for drug analysis in brain tissue. Levels of phenobarbital and bumetanide were analyzed by HPLC with ultraviolet detection (UV), using a modification of a previously described method for analysis of phenobarbital (Potschka et al., 2002), so that bumetanide, phenobarbital, and internal standard (methyl-phenobarbital) could be analyzed in the same sample. In short, 50 μl of plasma were mixed with 150 μl of methanol and then centrifuged for 3 min at 12,000 rpm. Aliquots of the supernatant were injected into the HPLC apparatus equipped with a Nucleosil 120-5 C18 pre-column (60 × 4 mm; Knauer), a Nucleosil 120-5 C18 column (250 × 4.6 mm), and a UV detector (at 210 nm). The composition of the mobile phase, which was pumped with a flow rate of 1 ml/min, was 0.05 m phosphate buffer/acetonitrile (70:30 by volume; pH was adjusted at 5.6). The same HPLC conditions were used for analysis of bumetanide and phenobarbital in brain samples. For extraction from brain samples, ∼50 mg of brain tissue was homogenized in 1 ml of distilled water and centrifuged for 20 min at 10,000 rpm, and the supernatant was purified by solid phase extraction, using a Chromabond HR-X column (Macherey-Nagel). Bumetanide and phenobarbital were extracted from the column by methanol, the extract was evaporated to dryness by nitrogen, the residue was dissolved in 100 μl of buffer, and 20 μl were used for HPLC analysis. Retention times were ∼8.6 min (phenobarbital), 10 min (bumetanide), and 14 min (internal standard), respectively. The detection limit for bumetanide was ∼50 ng/ml in plasma and 100 ng/g (=0.28 μm) in brain tissue.
Bumetanide is highly bound to plasma proteins in rats (Kim and Lee, 2001), but, to our knowledge, it is not known whether the drug is also bound to brain proteins. To determine whether the extraction of bumetanide from brain samples as described above was affected by brain protein binding, we treated rats with bumetanide (15 mg/kg, i.p.), killed them after 20 min, and used the two brain hemispheres from each rat for either the extraction method described above or an extraction method with 0.01N NaOH described by Kim and Lee (2001) for determination of bumetanide in the rat intestinal tract. Both methods gave about the same result, excluding any major effect of protein binding. Recovery of bumetanide from brain under both conditions was ∼80%.
Monitoring and analysis of spontaneous recurrent seizures.
Eight weeks after the induction of SE, all rats were continuously EEG- and video-monitored for 7 d (24 h/d) by a combined video- and EEG-detection system. A group of 16 rats, which received saline instead of drug treatment after SE, was used as SE controls. For EEG monitoring, the system consisted of 16 one-channel amplifiers (BioAmp, Molecular Devices) and an analog–digital converter (PowerLab/800s, ADInstruments). The data were recorded and analyzed with the Chart4 or LabChart 6 for windows software (ADInstruments). The sampling rate for the EEG recording was 200 Hz. A high-pass filter for 0.1 Hz and a low-pass filter for 60 Hz was used. Simultaneously to the EEG recording, the rats were video-monitored using four light-sensitive black-white cameras (CCD-Kamera-Modul, Conrad Electronic), which allowed video recording of up to four rats per camera. The cameras were connected to a multiplexer (TVMP-400, Monacor), which converted the signals from the four cameras to a video recorder (Time Lapse recorder, Sanyo TLS-9024P, Monacor). To allow video recording of seizures during the night, infrared light was used. Rats were housed in clear glass cages (one per cage) to allow optimal video observation.
For detection of spontaneous seizures, the EEG recordings were visually analyzed for characteristic ictal events. To evaluate the severity of motor seizure activity during a paroxysmal alteration in the EEG, the corresponding video recording was viewed. For rating of seizure severity of spontaneous seizures, a modified Racine's scale (Racine, 1972) was used. In addition to video/EEG monitoring of SRS, all spontaneous seizures observed during handling or other manipulations of the animals in the whole experimental period after SE (at least 5 months) were noted.
Evaluation of behavioral alterations in epileptic rats.
In addition to determining the effects of treatments on development of SRS, we evaluated whether the treatment had an influence on the behavioral changes associated with epilespy. Behavioral tests were started 4–6 months after SE and performed within a time period of 3–5 weeks. In addition to the drug-treated epileptic groups, we included an age-matched group of nine nonepileptic sham control rats (without EEG electrodes) in the behavioral testing. These rats received all treatments (anesthesia, fixation in stereotaxic frame, lithium chloride, methyl-scopolamine, diazepam and phenobarbital for interruption of SE, injections of drug vehicle twice daily for 2 weeks, blood sampling) except pilocarpine, bumetanide, or phenobarbital. Before each behavioral test, the epileptic and control rats were transferred to a room next to the room in which the experiments were performed. The two rooms were connected through a door, which was closed during the behavioral trials, so that the respective rat that was subjected to a behavioral test was not affected by the presence of an experimenter or the other rats. The experiments were performed between 9:00 A.M. and 1:00 P.M. For the elevated plus maze and open-field tests, a video tracking system with the EthoVision software from Noldus was used. Behavioral testing was performed only if no motor seizure was observed for at least 1 h before the test. If a spontaneous seizure occurred during a trial, the trial was disrupted, the rat was placed back into its home cage, and the trial was repeated after a time interval of 1 h.
Three tests were performed in epileptic rats (for details, see Brandt et al., 2006, 2007): (1) the elevated plus maze, which is a validated model to assess the level of anxiety in rodents (File, 1993); (2) the open field, which is a commonly used model of exploratory and anxiety-like behavior (Prut and Belzung, 2003); and (3) a test battery for behavioral hyperexcitability described by Rice et al. (1998), consisting of four behavioral tests (approach-response test, touch-response test, finger-snap test, and pick-up test) that potentially discriminate differences in behavioral excitability and sensory responsiveness between epileptic and control rats. These tests were performed four times by four different observers, who were not aware of the treatment status of the rats. There was at least 1 h in between the tests performed by the different observers. The means of their scores were calculated for each animal for each test. The tests were accomplished in the home cage.
Histological assessment of neurodegeneration.
Following the behavioral tests, pilocarpine-treated rats and age-matched sham controls were deeply anesthetized with chloral hydrate and transcardially perfused with 4% paraformaldehyde in 0.1 m phosphate buffer, pH 7.4. Six series of 40-μm-thick transverse sections of the brain were cut on a freezing microtome. One of the series was Nissl-stained with thionin for visualization of neurodegeneration in the hippocampal formation and verification of correct localization of the hippocampal electrode. The histological analyses were restricted to the groups with conventional (intraperitoneal) administration of phenobarbital and bumetanide.
In a first step, thionin-stained sections of the following subregions of the hippocampal formation were visually inspected for damage: CA1, CA2, CA3c/CA4, and dentate gyrus. For this purpose, serial sections of the hippocampus, ranging from 2.5 mm to 5.4 mm posterior from bregma, were used from each rat, and both hemispheres were inspected. Severity of neuronal damage in a section was semiquantitatively assessed by a grading system as previously described (Brandt et al., 2007) as follows: score 0, no obvious damage; score 1, abnormal appearance of the structure without clear evidence of visible neuronal loss; score 2, lesions involving 20–50% of neurons; score 3, lesions involving >50% of neurons. Visual assessment was conducted blindly with respect to the treatment status of the animal. Control sections never showed score 1 (or higher).
Compared to the extent of cell loss occurring after a SE in CA3 and CA1, which can be easily scored by microscopic examination, loss of neurons in the dentate hilus is more difficult to assess without cell counting. Therefore, in a second step, polymorphic neurons (i.e., mossy cells and interneurons) were counted in the dentate hilus of the hippocampal formation. Neuronal loss in the hilus was quantified in three sections per rat. The hilus was defined as the inner border of the granule cell layer and two straight lines connecting the tips of the granule cell layer and the proximal end of the CA3c region. All profiles >8 μm within these borders were counted at a 200× magnification (Axioscope, Carl Zeiss). The area of each hilus counted was measured with the KS400 software (Carl Zeiss). In addition to calculating average numbers of neurons in the hilus, neuronal densities (neurons per unit area) were calculated.
NKCC1 immunohistochemistry.
To our knowledge, the expression of NKCC1 during the first 2 weeks after SE (when the present treatments were conducted) has not been studied yet in the pilocarpine model in adult rats. So it is not known whether there is an upregulation of NKCC1 during this time frame, which would justify treatment with a NKCC1 inhibitor such as bumetanide. This prompted us to establish an immunohistochemical protocol for determining hippocampal NKCC1 expression after SE. For investigation of NKCC1 expression, additional rats were killed 24 h (n = 5) and 4 d (n = 3) after pilocarpine induced SE and compared to age-matched adult control rats (n = 9). Rats were deeply anesthetized with chloral hydrate and transcardially perfused with 4% paraformaldehyde in 0.1 m phosphate buffer, pH 7.4. Six series of 40-μm-thick transversal sections of the brain were cut on a freezing microtome. One of the series was immunohistochemically processed for detection of NKCC1.
For NKCC1 immunohistochemistry, sections were first extensively washed in 0.05 m Tris-buffered saline (TBS, pH 7.6). The endogenous peroxidase activity was blocked by incubation with 0.3% H2O2 for 30 min. After washing with TBS, sections were incubated 60 min at room temperature with blocking solution, containing 3% bovine serum albumin (Sigma–Aldrich) and 11% normal goat serum (Dako Cytomation). Immediately thereafter, the tissue was incubated with a rabbit polyclonal anti-rat NKCC1 antibody (NKCC11-A; Alpha Diagnostic International) in a dilution of 1:200 in carrier solution for 20 h at 4°C. The carrier solution contained 1% bovine serum albumin (Sigma–Aldrich) and 1% normal goat serum (Dako Cytomation). As negative control, the same amount of goat serum replaced the primary antibody, resulting in lack of any neuronal or glial staining. After washing in TBS, sections were incubated with a biotinylated goat anti-rabbit-antibody (Dako Cytomation), in a dilution of 1:2000 in carrier solution. Subsequently, sections were rinsed with TBS and incubated with the Vectastain ABC-Kit for 60 min, followed by a nickel-intensified DAB reaction in the presence of 0.01% H2O2 for 5 min. The washed and air-dried sections were treated with toluol and coverslipped with Entellan (Merck).
The specificity of the affinity-purified antibody used for NKCC1 immunohistochemistry (NKCC11-A; Alpha Diagnostic International) was tested by preincubating the antibody with a 22 aa rat NKCC-1 control peptide (NKCC11-P; Alpha Diagnostic International), which exhibits no significant sequence homology with other CCCs. This preincubation resulted in a complete loss of any staining in brain sections, substantiating the specificity of the antibody.
For analysis of NKCC1 staining, three sections of the dorsal hippocampus at a level of 3.0–5.5 mm posterior to bregma were chosen. In these sections the subiculum, the CA1, CA3a, and CA3c layers, the granule cell layer of the dentate gyrus, and the dentate hilus were investigated at 400× magnification (Axioskop, Zeiss). Only cells that differed in size and in morphologic appearance from glial cells were evaluated and considered neuronal cells; smaller cells were considered glial cells. The relative number and the intensity of the stained cells were evaluated by a score system. The score system for intensity of staining consisted of three scores: 0, no staining that could be distinguished from background; 1, staining is only slightly darker than background; 2, staining is considerably darker than background. The score system for the relative number of stained cells in the pyramidal or granule cell layers consisted of four scores: 0, no stained cells; 1, only few scattered cells; 2, many cells; 3, cells are densely packed. Mean values were calculated from the three sections for each region and animal and used for calculating group means. Evaluation of sections was performed in a blind fashion, i.e., the investigator was not aware whether sections were from controls or post-SE rats. Sections from the ventral hippocampus did not obviously differ from sections from the dorsal hippocampus, so that only data for the dorsal hippocampus were further evaluated.
Statistics.
Depending on whether data were normally distributed or not, either parametric or nonparametric tests were used for statistical evaluation. Fisher's exact test was used for calculation of significant differences in the incidence of spontaneous seizures. The significance of differences between groups in behavioral and histological data was calculated by ANOVA, followed by post hoc testing for individual differences by the Bonferroni test. If data were not normally distributed, ANOVA for nonparametric data (Kruskal–Wallis test), followed by post hoc testing for individual differences by Dunn's test, was used. When only two groups were compared, either Student's t test or the Mann–Whitney U test was used. Because our a priori hypothesis was that phenobarbital and bumetanide will exert a disease-modifying or antiepileptogenic effect, i.e., would decrease the incidence, frequency, or severity of spontaneous seizures developing after SE, all tests for seizure data were used one tailed, while all other tests (i.e., for behavioral and histological data) were used two tailed; a p < 0.05 was considered significant.
Results
Alterations in NKCC1 immunoreactivity after SE
NKCC1 immunohistochemistry demonstrated that the neuronal expression of NKCC1 protein increases shortly after SE in different subregions of the hippocampal formation (Fig. 2). In controls, neuronal staining was either absent (Fig. 2A) or weak (Fig. 2B); only rarely did single neurons exhibit intense staining. However, as previously described (Yan et al., 2001), smaller (presumably glia) cells exhibited intense staining (Fig. 2A,B), which was not further evaluated. The low or absent neuronal expression of NKCC1 in controls is in line with previous studies in adult rats (Clayton et al., 1998; Marty et al., 2002; Bragin et al., 2009). Twenty-four hours after SE, intense neuronal staining was observed in the subiculum, CA1, CA3, and dentate granule cell layer. Particularly in the subiculum (Fig. 2C) and granule cell layer (Fig. 2F), many cells were intensively stained with the NKCC1 antibody. A similar intensity of NKCC1 staining was also observed 4 d after SE (Fig. 2D). At higher magnification, NKCC1 images revealed a preferential perinuclear and somatic location of NKCC1, suggesting increased neuronal protein synthesis. Similar to controls, NKCC1 staining was also observed in smaller (presumably glia) cells. Semiquantitative evaluation of the intensity of neuronal staining (Fig. 2G) and the number of NKCC1-stained neurons (Fig. 2F) indicated that both intensity and number increased significantly in the subiculum. In the dentate granule cell layer, the intensity of staining was significantly increased (Fig. 2G), while the alterations determined in CA1 and CA3c failed to reach statistical significance.
Figure 2.
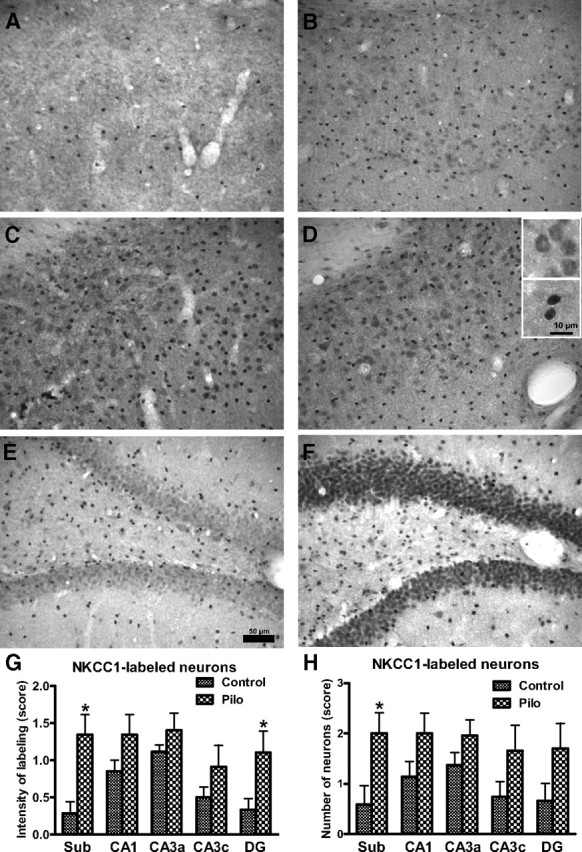
NKCC1-immunostained hippocampal sections of control rats (A, B, E) and rats 24 h (C, F) and 4 d (D) after a pilocarpine-induced SE. Sections shown in A–D are from the subiculum, while sections shown in E and F are from the dentate gyrus. The control section in A does not exhibit any NKCC1 immunostained neurons, which was seen in the majority (6/9) of controls in this region. The few intensively stained cells in A are presumably glial cells. The control section in B shows weakly stained neurons and more intensively stained (presumably glial) cells. Following SE, many cells in the subiculum (C, D) exhibited intensive NKCC1 immunostaining, including both neurons (see upper inset in D for higher magnification) and glial cells (see lower inset in D). Markedly increased NKCC1 immunostaining was also seen in the dentate granule cell layer (F), but not the hilus. No obvious difference in increased NKCC1 staining was determined at 24 h and 4 d following SE, so that data from both time points were put together for the semiquantitative evaluation shown in G (intensity of NKCC1 labeling) and H (number of NKCC1-stained neurons). Data shown in G and H are means ± SEM of 9 controls and 8 SE rats. Analysis of data by two-way ANOVA indicated significant differences between means (p < 0.001). Significant differences between controls and SE rats are indicated by asterisk (p < 0.05). Scale bar in E indicates 50 μm (for A–F), while scale bar in the lower inset in D indicates 10 μm for the two insets.
Elimination half-life, brain penetration, and tolerability of bumetanide in female Sprague Dawley rats
The elimination half-life of bumetanide in female Sprague Dawley rats was determined after intraperitoneal administration of a single dose of 15 mg/kg in four animals (Fig. 3A). As expected, bumetanide was rapidly eliminated with an average half-life of 10.4 min. An average maximum plasma concentration of 27 μg/ml was determined 10 min after administration, and concentrations decreased to 1.5 μg/ml by 60 min. In brain regions dissected either 30 or 60 min after intraperitoneal injection of this high dose of bumetanide, drug levels ranged between <0.1 and 0.26 μg/g (hippocampus), <0.1 and 0.22 μg/g (amygdala), and 0.13 and 0.27 μg/g (piriform cortex), respectively. For the piriform cortex, in which bumetanide could be analyzed in all samples, a brain:plasma concentration ratio of 0.017 was calculated for 30 min and 0.175 for 60 min after application, respectively, indicating that bumetanide was more rapidly eliminated from plasma than from brain (Fig. 3B).
Figure 3.
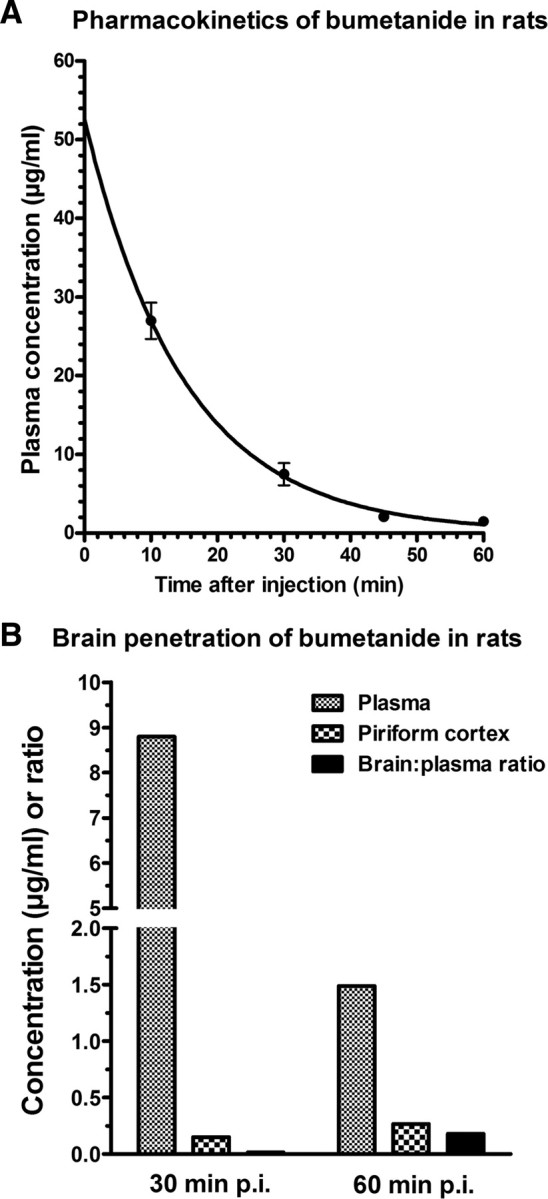
Plasma pharmacokinetics and brain penetration of bumetanide in female Sprague Dawley rats. A shows average (±SEM) plasma concentrations of bumetanide in four rats after intraperitoneal administration of a single dose of 15 mg/kg. Assuming a one-phase exponential decay, best-fit values were calculated by the GraphPad Prism software, resulting in an elimination constant of 0.06694 min−1 and an elimination half-life of 10.36 min. B shows average bumetanide levels in plasma and piriform cortex and the brain:plasma ratio 30 and 60 min after intraperitoneal administration of 15 mg/kg. Data are means of two rats per time point.
In an experiment in which bumetanide was administered twice daily at 10 mg/kg for 10 d in four rats, plasma levels were determined 15 min and brain levels 60 min after the last administration. Average plasma levels were 1.1 (range 0.67–1.51) μg/ml. Only in one rat, bumetanide was detected in hippocampus (0.67 μg/g) and piriform cortex (0.49 μg/g), whereas brain levels were below detection limit (0.1 μg/g) in the other three animals. When bumetanide was intravenously infused at a rate of 0.8 mg/kg/h for 24 h following SE, and plasma and brain levels were determined after termination of infusion, concentrations were 1.54 μg/ml in plasma, and 0.11, 0.41, and 0.99 μg/g in hippocampus, amygdala, and piriform cortex, respectively. This corresponds to brain:plasma concentration ratios of 0.07, 0.27, and 0.64 in the three brain areas, thus indicating an uneven distribution across brain regions, possibly as a result of SE-induced alterations in the blood–brain barrier. In a subsequent experiment in four rats, bumetanide was injected at a bolus dose of 2 mg/kg (i.p.) immediately after termination of SE by diazepam and phenobarbital. Infusion with bumetanide at 0.8 mg/kg/h over 3 d started after injection of the bolus dose. Plasma levels of bumetanide were determined immediately after terminating the infusion. Two rats without SE were used for comparison. Average plasma levels of bumetanide were ∼0.3 μg/ml with no difference between rats with or without SE. Electrolyte (Na+, Cl−, K+, Ca2+) concentrations in plasma were not affected in this experiment. Additional experiments with either continuous infusion or twice daily administration of 10 mg/kg bumetanide (with or without phenobarbital) for 4–5 d substantiated that the animals tolerated this treatment without any obvious adverse effects or significant decreases in plasma electrolyte levels. Based on these preliminary experiments, three dosing protocols of bumetanide were chosen for treatment of rats during the latency period after SE (Fig. 1).
Effects of conventional intraperitoneal treatment with bumetanide and phenobarbital on epileptogenesis in rats
In a first experiment, conventional intraperitoneal administration of bumetanide at either low (0.2 mg/kg) or high (10 mg/kg) doses together with phenobarbital was performed over 2 weeks, starting immediately after termination of SE (Fig. 1). Another group received phenobarbital alone and a SE control group vehicle instead of drug treatment. Phenobarbital and bumetanide were determined in plasma 0.5 and 14 h after termination of treatment. Average phenobarbital levels were 25.1 ± 1.1 μg/ml at 0.5 h and 10.9 ± 0.7 μg/ml at 14 h, and were not different between groups with or without bumetanide. Bumetanide plasma levels were below detection limit (∼50 ng/ml) in most rats treated with the low-dose protocol. With the high-dose protocol, average bumetanide plasma levels were 1.54 ± 0.42 μg/ml at 0.5 h, but below detection limit at 14 h. All rats tolerated the different treatments without any obvious adverse effects except moderate sedation and ataxia induced by phenobarbital. Body weight decreased by ∼10–20 g in the first 2–5 d following SE in all groups, including SE controls, but then increased by ∼40–50 g over the subsequent course of treatment (not illustrated). The most marked initial decrease in body weight was determined in the group with the high-dose bumetanide protocol.
Effects of treatments on development of SRS are shown in Figure 4. Six weeks following termination of treatment, i.e., 8 weeks after SE, all rats were continuously video/EEG monitored over 7 d. As shown in Figure 4A, 15/16 (94%) vehicle-treated rats had developed SRS at this time (group 1 in Fig. 4A). The frequency of SRS in SE controls ranged between 1 and 177 seizures per week with a median seizure frequency of 7.5 seizures/week (Fig. 4B). Seizure severity was typically stage 4 or 5 (Fig. 4C). Seizure duration was 45 s on average (Fig. 4D).
Figure 4.

SRS recorded by continuous video/EEG monitoring 8–9 weeks following SE. Group size was 16 for the group treated 2 weeks with saline after SE (group 1), 8 for the group treated 2 weeks with phenobarbital after SE (group 2), 8 for the group treated 2 weeks with phenobarbital and low-dose bumetanide after SE (group 3), 10 for the group treated 2 weeks with phenobarbital and high-dose bumetanide after SE (group 4), 15 for the group treated 5 d with phenobarbital and continuous infusion of bumetanide after SE (group 5), and 16 for the group treated 5 d by continuous infusion of bumetanide after SE (group 6), respectively. A illustrates seizure incidence, i.e., the percentage rats per group exhibiting spontaneous seizures during the 1 week of continuous video/EEG monitoring. B illustrates the frequency of spontaneous seizures, C seizure severity, and D seizure duration. Data in C and D are shown as means ± SEM, while individual values and median seizure frequency are shown in B. Analysis of data in A by Fisher's exact test indicated that groups 2 and 3 differed significantly from group 1 (p = 0.0139 and 0.0366, respectively; indicated by asterisk), while p was 0.0581 for group 4, thus just failing to reach statistical significance. Analysis of data in B–D by ANOVA indicated significant differences between means for the data on seizure frequency shown in B (p = 0.02615). Post hoc analysis indicated that groups 2, 3, and 5 differed significantly from group 1 (p < 0.05; indicated by asterisk). For group 6, p was 0.05505.
In the group of rats treated with phenobarbital alone, a significant decrease in the number of rats exhibiting SRS during the 7 d recording period was determined (group 2 in Fig. 4A). Furthermore, the phenobarbital-pretreated rats exhibited a striking and statistically significant decrease in seizure frequency (Fig. 4B); median seizure frequency was decreased from 7.5 to 1 seizure/week (p = 0.0044). Treatment with low- or high-dose bumetanide in combination with phenobarbital during the latency period after SE also resulted in fewer rats that exhibited SRS during the 7 d recording period, but the difference to controls reached statistical significance only for the low-dose bumetanide group (group 3 in Fig. 4A), while the high-dose bumetanide group (group 4) just failed to reach statistical significance (p = 0.0581)). Group 3 also exhibited a significantly reduced seizure frequency, while group 4 exhibited only a nonsignificant tendency for decreased seizure frequency (Fig. 4B). None of the treatments reduced severity or duration of SRS (Fig. 4C,D).
During the months following the video/EEG recording of SRS, spontaneous behavioral seizures were observed in several of the rats that had not exhibited seizures during the 1 week of video/EEG recording, so that the total percentage of rats with spontaneous seizures was not significantly different between drug-treated groups and controls at the end of the experimental period illustrated in Figure 1. Respective percentages of rats with SRS per treatment group were 100% in controls, 75% in the phenobarbital group, 71% in the phenobarbital plus low bumetanide group, and 90% in the phenobarbital plus high bumetanide group. These data indicate that the significant reduction of rats with SRS determined 8 weeks after SE in groups 2 and 3 (Fig. 4A) was not due to prevention of epilepsy in such rats but to retarded development of SRS, i.e., a disease-modifying effect of treatment.
Effects of continuous intravenous infusion with bumetanide with or without phenobarbital on epileptogenesis in rats
Because it was impossible to maintain effective levels of bumetanide by conventional intraperitoneal injections of this drug in rats, subsequent experiments were performed with continuous constant-rate infusion to compensate for the rapid elimination of bumetanide in rats. Calculation of bolus (2 mg/kg) and infusion rate (0.8 mg/kg/h) were based on elimination half-life and a minimum target plasma concentration of 0.2 μg/ml. This target concentration was reached and exceeded by the infusion protocol (see above). However, whereas bumetanide infusion was accepted without any problems by normal nonepileptic rats, rats exhibited intense wet dog shaking when the infusion was started after SE, so that several rats disconnected themselves from the infusion and had to be reconnected. This was not an adverse effect of bumetanide but also occurred during saline infusion after SE, indicating behavioral hyperexcitability of SE rats in response to the infusion setup (see Materials and Methods for details).
Following SE, bumetanide was infused either alone or in combination with twice daily administration of 15 mg/kg phenobarbital for 5 d. As shown in Figure 4A, these two types of treatment did not affect the incidence of rats with epilepsy (groups 5 and 6 in Fig. 4A). However, seizure frequency was reduced, resulting in a significant difference to controls for the group with phenobarbital and bumetanide infusion (group 5 in Fig. 4B). A similar, albeit less marked reduction in seizure frequency was observed in the group with bumetanide infusion alone (p = 0.05505). Seizure severity or duration were not altered by any treatment.
When the effect of prophylactic drug treatment on the frequency of spontaneous seizures was compared in percentage reduction from SE controls between the different treatment groups shown in Figure 4B, percentage reduction (based on median values) was 87% for groups 2 and 3, 60% for groups 4 and 5, and 40% for group 6, respectively.
Effects of drug treatment on behavioral alterations associated with epilepsy in rats
In the open field, epileptic rats did not differ significantly from nonepileptic controls except for the group that was treated with phenobarbital plus bumetanide infusion after SE (group 5 in Fig. 5A,B). This group stayed significantly shorter in the outer ring and longer in the aversive inner ring of the open field compared to controls and SE rats treated with saline, indicating decreased anxiety-like behavior. Furthermore, the number of entries into the inner ring was significantly increased in this group (not illustrated). The distance traveled by group 5 in the open field was not significantly different from control. The only group exhibiting a significant increase in distance traveled was group 3 (phenobarbital plus low-dose bumetanide), which also exhibited a significant increase in rearing (not illustrated).
Figure 5.

Behavioral alterations of epileptic rats (groups 1–6) vs nonepileptic controls (group 0; n = 9). See Figure 4 legend for group size of groups 1–6. All data are shown as means ± SEM. A illustrates the time that rats spent in the aversive inner ring of an open field. B illustrates the time that rats spent in the outer ring of the open field. C illustrates the time rats spent in the aversive open arms of an elevated plus maze. D illustrates behavioral hyperexcitability of epileptic rats in the pick-up test. Analysis of data by ANOVA indicated significant differences between means for A (p = 0.0172), B (p = 0.0063), C (p = 0.0360), and D (p = 0.0007), respectively. Significant differences to controls (group 0) are indicated by asterisk (p < 0.05), significant differences to the SE plus saline group (group 1) by circle (p < 0.05).
In the elevated plus maze, epileptic rats tended to stay longer on the aversive open arm of the maze (Fig. 5C), except for the group that was treated with phenobarbital plus bumetanide infusion after SE (group 5 in Fig. 5C). This group stayed significantly shorter on the open arms than SE rats treated with saline (group 1), but did not differ from nonepileptic controls (group 0). Distance traveled in the different regions of the elevated plus maze was not significantly different between groups (not illustrated).
For testing behavioral hyperexcitability of epileptic rats, the observational battery of behavioral tests described by Rice et al. (1998) was used as described in Materials and Methods. Pronounced behavioral hyperexcitability was only determined in the pick-up test (Fig. 4D). In this test, all groups of epileptic rats exhibited an enhanced aversive or aggressive response to pick up, but the difference to controls became statistically different only for the SE plus saline (group 1), the SE plus phenobarbital (group 2), and the SE plus phenobarbital plus high bumetanide (group 4) groups, respectively (Fig. 5D).
Effects of drug treatment on hippocampal damage
Hippocampal damage in epileptic rats was characterized by neurodegeneration in CA1 and dentate hilus, although not all epileptic rats, including rats of the SE plus saline group, exhibited damage in CA1. The incidence of CA1 damage in the different groups ranged between 33 and 67% without significant intergroup differences (not illustrated). The most consistent neurodegeneration in epileptic rats was cell loss in the dentate hilus, so that group comparisons are illustrated for this region (supplemental Fig. S1, available at www.jneurosci.org as supplemental material). A slight increase in hilus area was observed in all groups of epileptic rats, but this became statistically significant only for the SE plus low bumetanide group (group 3 in supplemental Fig. S1A, available at www.jneurosci.org as supplemental material). Such increase in hilus area (or volume) is often seen in the pilocarpine model and other models of TLE and has been related to astrogliosis, edema, or ectopic granule cell development (Brandt et al., 2004a; McCloskey et al., 2006). Number of hilus neurons (supplemental Fig. S1B, available at www.jneurosci.org as supplemental material) and neuronal density in the hilus (supplemental Fig. S1C, available at www.jneurosci.org as supplemental material) were significantly decreased in all groups of epileptic rats without significant intergroup differences.
Discussion
To our knowledge, this is the first study that evaluates whether prolonged administration of the NKCC1 inhibitor bumetanide after a brain insult prevents or modifies the development of epilepsy. For comparison, the GABA-mimetic antiepileptic drug phenobarbital was used either alone or in combination with bumetanide. When phenobarbital was administered over 2 weeks after SE and spontaneous seizures were quantified by video/EEG monitoring 6 weeks after termination of treatment, the number of rats exhibiting SRS was significantly lower compared to the group of saline-treated SE rats. Furthermore, the frequency of SRS was markedly decreased in the phenobarbital group. This disease-modifying effect of phenobarbital was unexpected, because prolonged administration of phenobarbital in juvenile rats did not alter the development of SRS in the kainate model of TLE (Bolanos et al., 1998). However, in the present study, treatment with phenobarbital was started 90 min after onset of SE, whereas Bolanos et al. (1998) started treatment with phenobarbital 24 h after onset of SE, so that the therapeutic window of opportunity may have been missed. Thus, one novel and important finding of the present study is that prophylactic treatment with phenobarbital after a brain insult such as SE modifies the development of epilepsy.
Combined treatment with phenobarbital and bumetanide for 2 weeks after SE did not enhance the disease-modifying effect obtained with phenobarbital alone, although we used dosing protocols of bumetanide that had previously been reported to exert anticonvulsant or neuroprotective effects in rats (Dzhala et al., 2005; Lu et al., 2006, 2007). However, pharmacokinetic analyses showed that bumetanide is extremely rapidly eliminated in adult rats, substantiating previous pharmacokinetic experiments with this drug in rats (Busch et al., 1979; Kim and Lee, 2001). Furthermore, brain penetration of bumetanide was low in the adult rats used in the present study. To our knowledge, brain penetration of bumetanide has not been analyzed previously, but Cohen et al. (1976) investigated the tissue distribution of bumetanide in dogs and determined tissue:plasma ratios for heart, lung, muscle, and fat of 0.1–0.2, resembling the low brain:plasma ratios determined in the present study. This low brain penetration is in line with the low volume of distribution of bumetanide (0.2–0.3 l/kg) reported for adult Sprague Dawley rats (Lee et al., 1994), which is a consequence of the ionized carboxylic group of bumetanide at physiological pH (pKa is 3.6) and its high plasma protein binding (98%) in rats (Feit, 1990; Kim and Lee, 2001).
Due to the rapid elimination of bumetanide and its low brain penetration in rats, effective bumetanide brain concentrations could not be maintained by conventional routes of administration. Bumetanide inhibits NKCC1 with an IC50 of 200–300 nm, i.e., 70–107 ng/ml (O'Grady et al., 1987; Russell, 2000; Hannaert et al., 2002). Such concentrations were only shortly reached or exceeded after intraperitoneal injection of high doses of bumetanide. To compensate for the rapid elimination of bumetanide in rats, we developed an intravenous infusion protocol, allowing maintenance of effective bumetanide levels. Infusion of bumetanide alone did not exert any significant effect on development of SRS or frequency of SRS. However, when bumetanide was coadministered with phenobarbital for 5 d after SE, the frequency of spontaneous seizures was significantly decreased, indicating a disease-modifying effect.
Interestingly, infusion of bumetanide together with twice daily injections of phenobarbital was the only treatment protocol that altered the behavior of epileptic rats. Rats treated with this protocol exhibited significantly reduced anxiety-like behavior in the open field. In the elevated plus maze, in which epileptic rats from the pilocarpine model typically exhibit an increase in time spent on the aversive open arms (Detour et al., 2005; Dos Santos et al., 2005; Brandt et al., 2006), which has been explained by enhanced impulsive inadapted behavior (Detour et al., 2005), treatment with bumetanide infusion plus phenobarbital counteracted this behavior. It is also interesting to note that this treatment group did not exhibit significantly increased behavioral hyperexcitability in the pick-up test described by Rice et al. (1998); a similar effect was also determined for the group in which bumetanide was infused alone. These data indicate that bumetanide infusion exerted disease-modifying effects and that these effects were potentiated by concomitant administration of phenobarbital.
Phenobarbital's effects are thought to be primarily related to enhancement of GABA-mediated inhibitory synaptic transmission via modulation of GABAA receptors (Olsen, 2002; Rogawski and Löscher, 2004). However, this drug also exerts various additional molecular effects, including an inhibitory action on glutamate receptors of the AMPA/kainate subtype (Rogawski and Löscher, 2004). The latter effect is known to be associated with neuroprotective activity (Löscher and Rogawski, 2002; Mattes et al., 2006). The fact that a combination of diazepam and phenobarbital was used to terminate SE in the present study could thus explain the relatively moderate neurodegeneration in the CA1 and CA3 regions compared to previous studies in which we used only diazepam for suppression of SE induced by the same lithium-pilocarpine dosing protocol (Bankstahl et al., 2008). However, prolonged treatment with phenobarbital or combinations of phenobarbital and bumetanide after SE did not prevent the dentate hilus from neuronal damage, indicating that the observed disease-modifying effects were not related to neuroprotection.
The finding that treatment of rats with phenobarbital over 2 weeks after SE significantly reduced the number of rats with SRS, whereas treatment for only 5 d (in the group with bumetanide infusion) did not exert this effect is interesting, because it indicates that the duration of prophylactic treatment after SE is critical for this antiepileptogenic or disease-modifying effect of phenobarbital. The therapeutic window of opportunity after SE is not known, but, depending on the strategy of antiepileptogenesis used, it may be very short (Armstrong et al., 2009). On the other hand, Pitkänen et al. (2004) reported a disease-modifying effect of prophylactic treatment with the α2-adrenoceptor antagonist atipamezole, when treatment was started 1 week after SE.
The only previous study that evaluated whether bumetanide interferes with epileptogenesis used the hippocampal kindling model in neonatal [postnatal day 11 (P11)], postneonatal (P14), and preadolescent (P21) rats (Mazarati et al., 2009). Bumetanide was given at intraperitoneal doses of 0.2, 0.5, or 2.5 mg/kg 20 min before onset of rapid kindling with 80 electrical stimulations of the ventral hippocampus, delivered every 5 min. In neonatal rats, bumetanide decreased hippocampal excitability, which was evident as an increase of afterdischarge threshold (ADT). During kindling, the drug delayed the occurrence and reduced the number of full motor seizures. Such effects were not observed in the two other age groups. However, whether retarded kindling determined in neonatal rats indicates an antiepileptogenic or disease-modifying effect, as suggested by Mazarati et al. (2009), is uncertain, because the anticonvulsant effect on the ADT alone could lead to delayed kindling in the presence of bumetanide. The finding of Mazarati et al. (2009) that bumetanide increased ADT in neonatal rats but not older animals is interesting and may be explained by higher permeability of the blood–brain barrier to bumetanide in neonates and less rapid elimination (Lopez-Samblas et al., 1997).
The lack of any significant antiepileptogenic activity of prophylactic treatment with bumetanide in the adult rat TLE model used in the present study may have several reasons, including that (1) the pharmacokinetic problems (rapid elimination, poor brain penetration) associated with systemic administration of bumetanide do not allow to reach and maintain sufficiently high brain concentrations of this drug, (2) alterations in NKCC1 are not critically involved in pilocarpine-induced epileptogenesis, or (3) the time window used for prophylactic treatment in this model, i.e., the first 2 weeks after SE, was not adequate. In the study of Pathak et al. (2007) in the pilocarpine model in adult rats, a positive EGABA shift in hippocampal granule cells was determined at 24 h and 1 week after SE, and EGABA recovered to control values by 2 weeks after SE. KCC2 expression was significantly decreased at 1 and 2 weeks after SE (earlier time points were not examined). In the present study, by using immunohistochemical analysis of NKCC1 expression, we found that neuronal NKCC1 is upregulated shortly after SE in rats, substantiating previous experiments with pilocarpine in mice (Li et al., 2008). Two to three weeks after pilocarpine-induced SE, no significant alterations in NKCC1 expression were determined in subiculum or dentate gyrus of rats (Bragin et al., 2009). Together, these electrophysiological and immunohistochemical data thus justify the time window used for prophylactic treatment with bumetanide in the present study. Because systemic administration of bumetanide is not an ideal approach for inhibiting brain NKCC1 in adult rats, as demonstrated by our pharmacokinetic analyses, further studies are needed to determine whether inhibition of NKCC1 during epileptogenesis can retard or prevent the development of SRS. We currently develop and evaluate lipophilic prodrugs of bumetanide that are not ionized at physiological pH, which may resolve the issue of poor brain penetration determined in the present study. Furthermore, the neuroprotective and antiepileptogenic or disease-modifying effects of phenobarbital, which constitute a major finding of our study, deserve further investigation and longer time periods to ascertain their potential benefit for patients with brain insults.
Footnotes
The study was supported by a grant (Lo 274/11-1) from the Deutsche Forschungsgemeinschaft. Maia Nozadze received a scholarship from the German Academic Exchange Service. We thank Prof. Hans-Hasso Frey and Dr. Peter W. Feit, who were responsible for the discovery and development of bumetanide at Leo Pharmaceutical Products, for extremely helpful discussions, Dr. Feit for advice during development of the HPLC analysis of bumetanide, and Prof. Kai Kaila for critical reading of the manuscript. We thank Martina Gramer, Maria Hausknecht, and Julia Förster for skilful technical assistance, Prof. Andrea Tipold for help with the electrolyte analysis, Dr. Johanna Kuhlmann-Gottke for help and advice in establishing the continuous intravenous infusion protocol, and Prof. Kietzmann for calculation of the bumetanide infusion rate by WinNonLin.
References
- Armstrong C, Morgan RJ, Soltesz I. Pursuing paradoxical proconvulsant prophylaxis for epileptogenesis. Epilepsia. 2009;50:1657–1669. doi: 10.1111/j.1528-1167.2009.02173.x. [DOI] [PMC free article] [PubMed] [Google Scholar]
- Bankstahl JP, Löscher W. Resistance to antiepileptic drugs and expression of P-glycoprotein in two rat models of status epilepticus. Epilepsy Res. 2008;82:70–85. doi: 10.1016/j.eplepsyres.2008.07.007. [DOI] [PubMed] [Google Scholar]
- Bankstahl JP, Hoffmann K, Bethmann K, Löscher W. Glutamate is critically involved in seizure-induced overexpression of P-glycoprotein in the brain. Neuropharmacology. 2008;54:1006–1016. doi: 10.1016/j.neuropharm.2008.02.008. [DOI] [PubMed] [Google Scholar]
- Baulac M. Phenobarbital and other barbiturates: clinical efficacy and use in epilepsy. In: Levy RH, Mattson RH, Meldrum BS, Perucca E, editors. Antiepileptic drugs. Ed 5. Philadelphia: Lippincott Williams and Wilkins; 2002. pp. 514–521. [Google Scholar]
- Ben-Ari Y, Holmes GL. The multiple facets of gamma-aminobutyric acid dysfunction in epilepsy. Curr Opin Neurol. 2005;18:141–145. doi: 10.1097/01.wco.0000162855.75391.6a. [DOI] [PubMed] [Google Scholar]
- Blaesse P, Airaksinen MS, Rivera C, Kaila K. Cation-chloride cotransporters and neuronal function. Neuron. 2009;61:820–838. doi: 10.1016/j.neuron.2009.03.003. [DOI] [PubMed] [Google Scholar]
- Bolanos AR, Sarkisian M, Yang Y, Hori A, Helmers SL, Mikati M, Tandon P, Stafstrom CE, Holmes GL. Comparison of valproate and phenobarbital treatment after status epilepticus in rats. Neurology. 1998;51:41–48. doi: 10.1212/wnl.51.1.41. [DOI] [PubMed] [Google Scholar]
- Bragin DE, Sanderson JL, Peterson S, Connor JA, Müller WS. Development of epileptiform excitability in the deep entorhinal cortex after status epilepticus. Eur J Neurosci. 2009;30:611–624. doi: 10.1111/j.1460-9568.2009.06863.x. [DOI] [PMC free article] [PubMed] [Google Scholar]
- Brandt C, Ebert U, Löscher W. Epilepsy induced by extended amygdala-kindling in rats: lack of clear association between development of spontaneous seizures and neuronal damage. Epilepsy Res. 2004a;62:135–156. doi: 10.1016/j.eplepsyres.2004.08.008. [DOI] [PubMed] [Google Scholar]
- Brandt C, Volk HA, Löscher W. Striking differences in individual anticonvulsant response to phenobarbital in rats with spontaneous seizures after status epilepticus. Epilepsia. 2004b;45:1488–1497. doi: 10.1111/j.0013-9580.2004.16904.x. [DOI] [PubMed] [Google Scholar]
- Brandt C, Gastens AM, Sun MZ, Hausknecht M, Löscher W. Treatment with valproate after status epilepticus: effect on neuronal damage, epileptogenesis, and behavioral alterations in rats. Neuropharmacology. 2006;51:789–804. doi: 10.1016/j.neuropharm.2006.05.021. [DOI] [PubMed] [Google Scholar]
- Brandt C, Glien M, Gastens AM, Fedrowitz M, Bethmann K, Volk HA, Potschka H, Löscher W. Prophylactic treatment with levetiracetam after status epilepticus: lack of effect on epileptogenesis, neuronal damage, and behavioral alterations in rats. Neuropharmacology. 2007;53:207–221. doi: 10.1016/j.neuropharm.2007.05.001. [DOI] [PubMed] [Google Scholar]
- Busch U, Fedorcak A, Hammer R, Jauch R, Koss FW. [Pharmacokinetics and metabolism of bumetanide in man, dog and rat (author's translation)] Arzneimittelforschung. 1979;29:315–322. [PubMed] [Google Scholar]
- Clayton GH, Owens GC, Wolff JS, Smith RL. Ontogeny of cation-Cl-cotransporter expression in rat neocortex. Brain Res Dev Brain Res. 1998;109:281–292. doi: 10.1016/s0165-3806(98)00078-9. [DOI] [PubMed] [Google Scholar]
- Cohen MR, Hinsch E, Vergona R, Ryan J, Kolis SJ, Schwartz MA. A comparative diuretic and tissue distribution study of bumetanide and furosemide in the dog. J Pharmacol Exp Ther. 1976;197:697–702. [PubMed] [Google Scholar]
- Detour J, Schroeder H, Desor D, Nehlig A. A 5-month period of epilepsy impairs spatial memory, decreases anxiety, but spares object recognition in the lithium-pilocarpine model in adult rats. Epilepsia. 2005;46:499–508. doi: 10.1111/j.0013-9580.2005.38704.x. [DOI] [PubMed] [Google Scholar]
- Dichter MA. Posttraumatic epilepsy: the challenge of translating discoveries in the laboratory to pathways to a cure. Epilepsia. 2009;50(Suppl 2):S41–S45. doi: 10.1111/j.1528-1167.2008.02009.x. [DOI] [PubMed] [Google Scholar]
- Dos Santos JG, Jr, Longo BM, Blanco MM, Menezes de Oliveira MG, Mello LE. Behavioral changes resulting from the administration of cycloheximide in the pilocarpine model of epilepsy. Brain Res. 2005;1066:37–48. doi: 10.1016/j.brainres.2005.09.037. [DOI] [PubMed] [Google Scholar]
- Dzhala VI, Talos DM, Sdrulla DA, Brumback AC, Mathews GC, Benke TA, Delpire E, Jensen FE, Staley KJ. NKCC1 transporter facilitates seizures in the developing brain. Nat Med. 2005;11:1205–1213. doi: 10.1038/nm1301. [DOI] [PubMed] [Google Scholar]
- Dzhala VI, Brumback AC, Staley KJ. Bumetanide enhances phenobarbital efficacy in a neonatal seizure model. Ann Neurol. 2008;63:222–235. doi: 10.1002/ana.21229. [DOI] [PubMed] [Google Scholar]
- Feit PW. Bumetanide: historical background, taxonomy and chemistry. In: Lant AF, editor. Bumetanide. Camforth, UK: Marius; 1990. pp. 1–13. [Google Scholar]
- File SE. The interplay of learning and anxiety in the elevated plus-maze. Behav Brain Res. 1993;58:199–202. doi: 10.1016/0166-4328(93)90103-w. [DOI] [PubMed] [Google Scholar]
- Freichel C, Potschka H, Ebert U, Brandt C, Löscher W. Acute changes in the neuronal expression of gaba and glutamate decarboxylase isoforms in the rat piriform cortex following status epilepticus. Neuroscience. 2006;141:2177–2194. doi: 10.1016/j.neuroscience.2006.05.040. [DOI] [PubMed] [Google Scholar]
- Galanopoulou AS. Developmental patterns in the regulation of chloride homeostasis and GABA(A) receptor signaling by seizures. Epilepsia. 2007;48(Suppl 5):14–18. doi: 10.1111/j.1528-1167.2007.01284.x. [DOI] [PubMed] [Google Scholar]
- Glien M, Brandt C, Potschka H, Voigt H, Ebert U, Löscher W. Repeated low-dose treatment of rats with pilocarpine: low mortality but high proportion of rats developing epilepsy. Epilepsy Res. 2001;46:111–119. doi: 10.1016/s0920-1211(01)00272-8. [DOI] [PubMed] [Google Scholar]
- Glien M, Brandt C, Potschka H, Löscher W. Effects of the novel antiepileptic drug levetiracetam on spontaneous recurrent seizures in the rat pilocarpine model of temporal lobe epilepsy. Epilepsia. 2002;43:350–357. doi: 10.1046/j.1528-1157.2002.18101.x. [DOI] [PubMed] [Google Scholar]
- Halladay SC, Carter DE, Sipes IG. A relationship between the metabolism of bumetanide and its diuretic activity in the rat. Drug Metab Dispos. 1978;6:45–49. [PubMed] [Google Scholar]
- Hannaert P, Alvarez-Guerra M, Pirot D, Nazaret C, Garay RP. Rat NKCC2/NKCC1 cotransporter selectivity for loop diuretic drugs. Naunyn Schmiedebergs Arch Pharmacol. 2002;365:193–199. doi: 10.1007/s00210-001-0521-y. [DOI] [PubMed] [Google Scholar]
- Jacobs MP, Leblanc GG, Brooks-Kayal A, Jensen FE, Lowenstein DH, Noebels JL, Spencer DD, Swann JW. Curing epilepsy: progress and future directions. Epilepsy Behav. 2009;14:438–445. doi: 10.1016/j.yebeh.2009.02.036. [DOI] [PMC free article] [PubMed] [Google Scholar]
- Kim EJ, Lee MG. Pharmacokinetics and pharmacodynamics of intravenous bumetanide in mutant Nagase analbuminemic rats: importance of globulin binding for the pharmacodynamic effects. Biopharm Drug Dispos. 2001;22:147–156. doi: 10.1002/bdd.267. [DOI] [PubMed] [Google Scholar]
- Köhling R. Neuroscience. GABA becomes exciting. Science. 2002;298:1350–1351. doi: 10.1126/science.1079446. [DOI] [PubMed] [Google Scholar]
- Kuteykin-Teplyakov K, Brandt C, Hoffmann K, Löscher W. Complex time-dependent alterations in the brain expression of different drug efflux transporter genes after status epilepticus. Epilepsia. 2009;50:887–897. doi: 10.1111/j.1528-1167.2008.01916.x. [DOI] [PubMed] [Google Scholar]
- Lee SH, Lee MG, Kim ND. Pharmacokinetics and pharmacodynamics of bumetanide after intravenous and oral administration to rats: absorption from various GI segments. J Pharmacokinet Biopharm. 1994;22:1–17. doi: 10.1007/BF02353407. [DOI] [PubMed] [Google Scholar]
- Li X, Zhou J, Chen Z, Chen S, Zhu F, Zhou L. Long-term expressional changes of Na+-K+-Cl-co-transporter 1 (NKCC1) and K+-Cl-co-transporter 2 (KCC2) in CA1 region of hippocampus following lithium-pilocarpine induced status epilepticus (PISE) Brain Res. 2008;1221:141–146. doi: 10.1016/j.brainres.2008.04.047. [DOI] [PubMed] [Google Scholar]
- Lopez-Samblas AM, Adams JA, Goldberg RN, Modi MW. The pharmacokinetics of bumetanide in the newborn infant. Biol Neonate. 1997;72:265–272. doi: 10.1159/000244492. [DOI] [PubMed] [Google Scholar]
- Löscher W. The pharmacokinetics of antiepileptic drugs in rats: consequences for maintaining effective drug levels during prolonged drug administration in rat models of epilepsy. Epilepsia. 2007;48:1245–1258. doi: 10.1111/j.1528-1167.2007.01093.x. [DOI] [PubMed] [Google Scholar]
- Löscher W, Hönack D. Comparison of anticonvulsant efficacy of valproate during prolonged treatment with one and three daily doses or continuous (“controlled release”) administration in a model of generalized seizures in rats. Epilepsia. 1995;36:929–937. doi: 10.1111/j.1528-1157.1995.tb01637.x. [DOI] [PubMed] [Google Scholar]
- Löscher W, Rogawski MA. Epilepsy. In: Lodge D, Danysz W, Parsons CG, editors. Ionotropic glutamate receptors as therapeutic target. Johnson City, TN: Graham; 2002. pp. 91–132. [Google Scholar]
- Lu KT, Wu CY, Cheng NC, Wo YY, Yang JT, Yen HH, Yang YL. Inhibition of the Na+-K+-2Cl−-cotransporter in choroid plexus attenuates traumatic brain injury-induced brain edema and neuronal damage. Eur J Pharmacol. 2006;548:99–105. doi: 10.1016/j.ejphar.2006.07.048. [DOI] [PubMed] [Google Scholar]
- Lu KT, Wu CY, Yen HH, Peng JH, Wang CL, Yang YL. Bumetanide administration attenuated traumatic brain injury through IL-1 overexpression. Neurol Res. 2007;29:404–409. doi: 10.1179/016164107X204738. [DOI] [PubMed] [Google Scholar]
- Marty S, Wehrlé R, Alvarez-Leefmans FJ, Gasnier B, Sotelo C. Postnatal maturation of Na+, K+, 2Cl-cotransporter expression and inhibitory synaptogenesis in the rat hippocampus: an immunocytochemical analysis. Eur J Neurosci. 2002;15:233–245. doi: 10.1046/j.0953-816x.2001.01854.x. [DOI] [PubMed] [Google Scholar]
- Mattes H, Lingenhoehl K, Kalkman H, Auberson Y, Renaud J, Schmutz M, Orain D. AMPA receptor antagonists: potential therapeutic applications. Recent Pat CNS Drug Discov. 2006;1:247–259. doi: 10.2174/157488906778773698. [DOI] [PubMed] [Google Scholar]
- Mazarati A, Shin D, Sankar R. Bumetanide inhibits rapid kindling in neonatal rats. Epilepsia. 2009;50:2117–2122. doi: 10.1111/j.1528-1167.2009.02048.x. [DOI] [PMC free article] [PubMed] [Google Scholar]
- McCloskey DP, Hintz TM, Pierce JP, Scharfman HE. Stereological methods reveal the robust size and stability of ectopic hilar granule cells after pilocarpine-induced status epilepticus in the adult rat. Eur J Neurosci. 2006;24:2203–2210. doi: 10.1111/j.1460-9568.2006.05101.x. [DOI] [PMC free article] [PubMed] [Google Scholar]
- O'Grady SM, Palfrey HC, Field M. Characteristics and functions of Na-K-Cl cotransport in epithelial tissues. Am J Physiol. 1987;253:C177–C192. doi: 10.1152/ajpcell.1987.253.2.C177. [DOI] [PubMed] [Google Scholar]
- Olsen RW. Phenobarbital and other barbiturates. In: Levy RH, Mattson RH, Meldrum BS, Perucca E, editors. Antiepileptic drugs. Ed 5. Philadelphia: Lippincott Williams and Wilkins; 2002. pp. 489–495. [Google Scholar]
- Ostergaard EH, Magnussen MP, Nielsen CK, Eilertsen E, Frey HH. Pharmacological properties of 3-n-butylamino-4-phenoxy-5-sulfamylbenzoic acid (bumetanide), a new potent diuretic. Arzneimittelforschung. 1972;22:66–72. [PubMed] [Google Scholar]
- Pathak HR, Weissinger F, Terunuma M, Carlson GC, Hsu FC, Moss SJ, Coulter DA. Disrupted dentate granule cell chloride regulation enhances synaptic excitability during development of temporal lobe epilepsy. J Neurosci. 2007;27:14012–14022. doi: 10.1523/JNEUROSCI.4390-07.2007. [DOI] [PMC free article] [PubMed] [Google Scholar]
- Paxinos G, Watson C. The rat brain in stereotaxic coordinates. Ed 6. Amsterdam: Elsevier; 2007. [DOI] [PubMed] [Google Scholar]
- Payne JA, Rivera C, Voipio J, Kaila K. Cation-chloride co-transporters in neuronal communication, development and trauma. Trends Neurosci. 2003;26:199–206. doi: 10.1016/S0166-2236(03)00068-7. [DOI] [PubMed] [Google Scholar]
- Pitkänen A, Lukasiuk K. Molecular and cellular basis of epileptogenesis in symptomatic epilepsy. Epilepsy Behav. 2009;14(Suppl 1):S16–S25. doi: 10.1016/j.yebeh.2008.09.023. [DOI] [PubMed] [Google Scholar]
- Pitkänen A, Narkilahti S, Bezvenyuk Z, Haapalinna A, Nissinen J. Atipamezole, an alpha(2)-adrenoceptor antagonist, has disease modifying effects on epileptogenesis in rats. Epilepsy Res. 2004;61:119–140. doi: 10.1016/j.eplepsyres.2004.07.005. [DOI] [PubMed] [Google Scholar]
- Potschka H, Fedrowitz M, Löscher W. P-Glycoprotein-mediated efflux of phenobarbital, lamotrigine, and felbamate at the blood-brain barrier: evidence from microdialysis experiments in rats. Neurosci Lett. 2002;327:173–176. doi: 10.1016/s0304-3940(02)00423-8. [DOI] [PubMed] [Google Scholar]
- Prut L, Belzung C. The open field as a paradigm to measure the effects of drugs on anxiety-like behaviors: a review. Eur J Pharmacol. 2003;463:3–33. doi: 10.1016/s0014-2999(03)01272-x. [DOI] [PubMed] [Google Scholar]
- Racine RJ. Modification of seizure activity by electrical stimulation: II. Motor seizure. Electroencephalogr Clin Neurophysiol. 1972;32:281–294. doi: 10.1016/0013-4694(72)90177-0. [DOI] [PubMed] [Google Scholar]
- Rice AC, Floyd CL, Lyeth BG, Hamm RJ, DeLorenzo RJ. Status epilepticus causes long-term NMDA receptor-dependent behavioral changes and cognitive deficits. Epilepsia. 1998;39:1148–1157. doi: 10.1111/j.1528-1157.1998.tb01305.x. [DOI] [PubMed] [Google Scholar]
- Rogawski MA, Löscher W. The neurobiology of antiepileptic drugs. Nat Rev Neurosci. 2004;5:553–564. doi: 10.1038/nrn1430. [DOI] [PubMed] [Google Scholar]
- Russell JM. Sodium-potassium-chloride cotransport. Physiol Rev. 2000;80:211–276. doi: 10.1152/physrev.2000.80.1.211. [DOI] [PubMed] [Google Scholar]
- Yan Y, Dempsey RJ, Sun D. Expression of Na(+)-K(+)-Cl(−) cotransporter in rat brain during development and its localization in mature astrocytes. Brain Res. 2001;911:43–55. doi: 10.1016/s0006-8993(01)02649-x. [DOI] [PubMed] [Google Scholar]