

Abstract
The ability to accurately control movement requires the computation of a precise motor command. However, the computations that take place within premotor pathways to determine the dynamics of movements are not understood. Here we studied the local processing that generates dynamic motor commands by simultaneously recording spikes and local field potentials (LFPs) in the network that commands saccades. We first compared the information encoded by LFPs and spikes recorded from individual premotor and motoneurons (saccadic burst neurons, omnipause neurons, and motoneurons) in monkeys. LFP responses consistent with net depolarizations occurred in association with bursts of spiking activity when saccades were made in a neuron's preferred direction. In contrast, when saccades were made in a neuron's nonpreferred direction, neurons ceased spiking and the associated LFP responses were consistent with net hyperpolarizations. Surprisingly, hyperpolarizing and depolarizing LFPs encoded movement dynamics with equal robustness and accuracy. Second, we compared spiking responses at one hierarchical level of processing to LFPs at the next stage. Latencies and spike-triggered averages of LFP responses were consistent with each neuron's place within this circuit. LFPs reflected relatively local events (<500 μm) and encoded important features not available from the spiking train (i.e., hyperpolarizing response). Notably, quantification of their time-varying profiles revealed that a precise balance of depolarization and hyperpolarization underlies the production of precise saccadic eye movement commands at both motor and premotor levels. Overall, simultaneous recordings of LFPs and spiking responses provides an effective means for evaluating the local computations that take place to produce accurate motor commands.
Introduction
Recordings of high-frequency electrical events in the brain (i.e., spikes) have become a standard tool for examining how individual neurons are involved in guiding behavior. Recently, there has been increased interest in investigating the information that is carried by low-frequency electrical activity [i.e., local field potentials (LFPs)]. While spiking activity represents the action potentials (i.e., output signal) produced by a neuron, LFPs are generally thought to reflect the summed activity of synaptic potentials, dendritic spikes, and spike afterpotentials occurring around the tip of the recording electrode (Mitzdorf, 1985, 1987). Accordingly, LFPs are considered to reflect the input to a given brain area, whereas spiking activity represents the output that is sent to other parts of the brain.
A central goal in systems neuroscience is to understand how the brain generates precise motor commands to guide behavior. Concurrent recordings of LFPs and spikes could theoretically provide an effective means for evaluating the local computations that take place to produce accurate motor commands. Paradoxically, however, most previous studies have emphasized the strong correlations—rather than differences—that can be measured between spiking activity and LFPs. For example, studies investigating the control of movement execution have established that LFPs encode many movement-related variables, such as direction, with similar accuracy as the spiking activity (Pesaran et al., 2002; Mehring et al., 2003). While several recent studies have revealed significant differences between spiking activity and LFP activity, these have focused on the decoding of static state variables rather than movement dynamics. For example, in a reaching task, integrated LFP activity codes behavioral states (i.e., planning vs movement execution) more efficiently than do single spikes (Pesaran et al., 2002; Scherberger et al., 2005; Hwang and Andersen, 2009).
Thus, a key question that remains unanswered is, Can LFP responses provide insight into the local computations that take place within premotor pathways to determine the precise dynamics of a planned movement trajectory? To address this question, we simultaneously recorded LFPs and the spiking activity of neurons in the well characterized premotor network that commands saccadic eye movements (Fig. 1). First, to determine how local neural processing precisely shapes the generation of dynamic commands, we characterized the relationship between spiking activity and LFPs recorded in association with individual neurons at both premotor and motor levels of processing. We found that both hyperpolarizing and depolarizing LFPs, like spiking activity, robustly encode saccade trajectories. Moreover, in contrast to previous comparisons in cortical neurons (Rasch et al., 2009), minimal filtering occurs between a neuron's input and output. Second, we compared the spiking outputs at one stage of processing to the LFPs recorded at the next hierarchical stage of motor processing to understand the computations that take place within the saccadic premotor network. Our results show that LFPs encode valuable information that is not available when evaluating spike trains alone. Notably, the analysis of LFPs revealed that a dynamic balance of depolarization and hyperpolarization underlies the production of precise eye movement commands.
Figure 1.

A, Diagram of saccadic brainstem circuitry. Inhibition is shown in red and excitation is shown in green. MNs initiate ipsilateral eye movements by sending signals related to eye velocity and position to lateral rectus eye muscles. When the lateral rectus acts as an agonist (i.e., ipsilateral direction), SBNs provide motoneurons with an excitatory input. During saccades in the contralateral direction, MNs are inhibited by contralateral inhibitory SBNs (red). OPNs tonically inhibit SBNs, except during saccades where their activity pauses. B, Example extracellular recordings of spiking activity of brainstem saccadic neurons. In the ipsilateral direction the MN has position and velocity signals and the SBN has eye velocity information. While the input drive to MNs and SBNs can be inferred from the spikes during ipsilateral saccades (green box) the input drive to MNs and SBNs during contralateral saccades (OPNs during all saccades) cannot be predicted based on the spiking activity (red boxes). Overall, we have limited knowledge of the functional weighting/dynamics of these inputs onto their target neurons.
Materials and Methods
Surgical procedures
Two rhesus monkeys (Macaca mulatta) were prepared for chronic extracellular recordings using the aseptic surgical procedures described previously (Sylvestre and Cullen, 1999). Briefly, a stainless steel post was attached to the animal's skull with stainless steel screws and dental acrylic, permitting complete immobilization of the animal's head. Two stainless steel recording chambers, oriented stereotaxically toward the abducens nucleus on the right and left sides of the brainstem, were also secured to the implant. To record eye position an eye coil (three loops of Teflon-coated stainless steel wire, 18–20 mm diameter) was implanted under the conjunctiva (Judge et al., 1980). All procedures were approved by the McGill University Animal Care Committee and complied with the guidelines of the Canadian Council on Animal Care.
Experimental paradigms and data acquisition
During experiments monkeys were seated in primate chairs located within the center of a 1 m3 magnetic eye coil system (CNC Engineering). Monkeys were trained to make saccadic eye movements in response to the onset and offset of a red HeNe laser target that was projected onto a cylindrical screen located 55 cm away from the monkey's eyes. The timing and location of target illumination, data acquisition, and online data displays were controlled using REX (real-time experimentation), a UNIX-based real-time acquisition system (Hayes et al., 1982). Horizontal and vertical eye position signals were measured using the magnetic search coil technique (Fuchs and Robinson, 1966; Judge et al., 1980). Position signals were low-pass filtered at 250 Hz (analog eight-pole Bessel filter) and sampled at 1 kHz. Since ocular saccades include very little power at >50 Hz (Zuber et al., 1968; Van Opstal et al., 1985; Cullen et al., 1996) eye position signals were further digitally filtered (with a 51st-order finite-impulse-response filter with a Hamming window and a cutoff at 125 Hz), before being differentiated to obtain eye velocity signals (using zero-phase forward and reverse digital filtering to prevent phase distortion).
Simultaneous extracellular spiking activity and LFP activity were recorded using single enamel-insulated tungsten microelectrodes (FHC) (for details, see Sylvestre and Cullen, 1999). Recordings were made from (1) omnipause neurons (OPNs) in the nucleus raphe interpositus (N = 12); (2) saccadic burst neurons (SBNs) in the paramedian pontine reticular formation (N = 9); and (3) motoneurons in the abducens motor nucleus (MNs) (N = 22). Neurons were defined based on their characteristic discharge pattern during saccades. Notably, motoneurons were separated from internuclear neurons based on the relationship between eye position sensitivities and eye position threshold, as initially characterized by Fuchs et al. (1988). The electrode signals were amplified with a high-input impedance head stage (>1 GΩ, ∼2 pF of parallel input capacitance) and filtered by a Multichannel Acquisition Processor (Plexon).
Field potential recordings were filtered (0.7–170 Hz) and postprocessed using the Plexon FPAlign utility, which effectively compensates for frequency-dependent phase shifts in the LFP band caused by the filters in the Plexon LFP preamplifier boards (Nelson et al., 2008). Unit activity, LFPs, horizontal and vertical eye position, and target position were digitized and saved using a computer-based data acquisition system (Plexon). Unit activity and LFPs were digitized and sampled at 1 kHz. Subsequent analysis was performed using custom algorithms (Matlab, The MathWorks).
Data analysis
The onset and offset of all saccades was determined using a 20°/s saccade velocity (i.e., horizontal or vertical) criterion. Horizontal saccades were defined as movements for which changes in vertical eye position were <10% of the change in horizontal position. A spike density function, in which a Gaussian function was convolved with the spike train (SD of 5 ms), was used to estimate neuronal firing rate (Cullen et al., 1996; Sylvestre and Cullen, 1999). To evaluate and compare the timing and precision of the information carried by LFPs and spike trains, three different approaches were used.
Metric analysis.
First, the LFPs and spiking activities for each neuron were characterized using classical metric-based analyses (Cullen and Guitton, 1997). Specifically, we quantitatively analyzed the time course and magnitude of saccade-related LFPs/spiking activity and correlated each with saccade parameters (e.g., duration, radial eye velocity, and amplitude). The duration of the saccade-related LFP modulation was defined as the interval where the absolute potential was >20% of the maximum value reached during the saccade consistent with previous analyses of intracellular recordings (Yoshida et al., 1999). Saccade duration was defined as the time interval during which velocity was greater than ±20°/s. For each neuron, standard linear regression techniques were used to describe the relationships between (1) LFP duration and saccade duration, (2) peak LFP and peak eye velocity, and (3) time integral of saccade-induced LFP and saccade amplitude.
Dynamic analysis.
Second, linear optimization techniques were used to quantify how well neuronal responses dynamically encoded eye movements as has been previously described in the analysis of spike trains (Cullen et al., 1996; Sylvestre and Cullen, 1999; Van Horn et al., 2008). Specifically, we compared the ability of different dynamic models to describe the relationship between saccadic neuronal discharges/LFP responses and the concurrently recorded eye movement behavior. Briefly, for each neuron, we first estimated the sensitivity to ipsilaterally directed saccades (i.e., preferred-direction responses) using the following dynamic model:
where FRest is the modeled firing rate, b is the firing rate at rest, r is a constant related to eye velocity, Ė is the instantaneous eye velocity, and td refers to the dynamic lead time, which was estimated by shifting the FR activity in time until an optimal fit was obtained (Sylvestre and Cullen, 1999).
A similar approach was then taken to describe LFP responses:
As described in the Results, the inclusion of additional terms (e.g., eye position, acceleration) were also evaluated to establish whether we could further improve our ability to describe the relationship between neuronal discharges/LFP responses and behavior. Moreover, since motoneurons are also sensitive to eye position, the relationship between firing rates/LFPs obtained from MNs was modeled using the following equation:
where k and r are constants related to eye position and velocity, respectively. E and Ė are instantaneous eye position and velocity, respectively. This formulation has been previously shown to provide an accurate description of motoneurons spike trains during saccades (Sylvestre and Cullen, 1999, 2002; Van Horn and Cullen, 2009).
To quantify the goodness of fit provided by a given model to neuronal data, we computed the variance-accounted-for VAF = 1 − [var(FRest − FR)/var(FR)], where FRest represents the modeled firing rate, FR represents the actual firing rate, and var, the variance of the signal. Note, that when estimating linear models, the VAF is mathematically equivalent to the correlation of determination, R2. Accordingly, a VAF value of 1 indicated a perfect fit to the data, whereas a value of 0 indicated a fit equivalent to the mean value of the firing rate models.
In addition to the dynamic lead time (td) that was estimated for each model formulation above, we also calculated the timing of the response onset using a 2 standard deviation criterion. Specifically, in this analysis LFP response onset was defined as the time at which the LFP reached a value of 2 standard deviations above (preferred direction for MNs and SBNs) or below (MN and SBN nonpreferred directions) baseline activity. Similarly, firing rate onset was defined as the time at which the firing rate reached a value of 2 standard deviations above (preferred direction for MNs and SBNs) baseline activity. In the analysis of OPN responses, LFP and firing rate onset was defined as the time at which either signal reached a value of 2 standard deviations below baseline activity. The difference between the firing rate and saccade or LFP and saccade onset was defined as the response lead time.
Eye velocity reconstruction.
To further compare differences in the information conveyed by spike trains versus LFPs, neuronal responses were characterized using the stimulus reconstruction technique (Rieke et al., 1996). This approach uses an optimal linear decoding algorithm, to assess the quality of the reconstruction of information carried by a given signal. Specifically, we quantified the ability of spike trains versus LFPs to reconstruct eye velocity (i.e., the motor response rather than “stimulus”) by computing the coding fraction (CF).
First, it is assumed that the time-dependent eye movement can be described by a first-order Voltera series (Gabbiani, 1996; Rieke et al., 1996) for each neuron i:
where Ri is the neuronal activity of the neuron i (e.g., spiking activity or LFP). The kernel K(τ) that minimizes the mean-square error ε2 = 〈[Ė(t) − Ėest(t)]2〉 for each neuron i can be computed in the Fourier domain from the cross-spectrum and power spectrum of the response as follows (Rieke et al., 1996; Dayan and Abbot, 2001):
 |
where K̃(f) is the Fourier transform of K(t). We assessed the quality of linear stimulus estimation by computing the coding fraction as follows (Gabbiani, 1996; Rieke et al., 1996):
 |
where ε is the root mean squared error and σmin is the standard deviation of the “stimulus” Ė(t). The coding fraction ranges between 0 and 1 and represents the fraction of the eye velocity signal correctly estimated, such that CF = 1 represents theoretical optimal reconstruction performance, whereas CF = 0 represents a complete lack of coding. However, even in model sensory systems, perfect reconstructions based on single neurons are not observed. For example, values of ∼0.55 are obtained when this same measure to vestibular regular afferents (Sadeghi et al., 2007) or the P-type neurons of the electric fish (Wessel et al., 1996) was used.
In contrast to the dynamic analysis, the reconstruction technique does not require the assumption of a particular relationship between the signals. The characteristics of the linear relation are instead described by the shape of the estimated filter. For example, in the case that a neuronal signal largely encoded eye velocity signals with a simple scaling factor, (1) the filter shape would be narrow and monophasic, and (2) the filter's gain and phase will be related to the gain and lead time estimated by the dynamic analysis as follows, for each neuron i:
where δ(t) is the Dirac delta function and r, b, and td are the parameters estimated by the dynamic analysis in Equation 1a for each neuron i.
For each neuron, the CF was calculated for a dataset that was comprised of ∼40 saccades. Only neuronal responses associated with saccadic eye movements were used for this analysis. Intersaccadic data were discarded and replaced with zeros (Harris, 1998) to ensure reconstruction performance (filter length = 1024 ms) over the relevant frequency range.
Spike-triggered average and spike field coherence.
The temporal relationship between the spiking activity and the LFP dynamics was further characterized by computing spike-triggered averages (STAs) of LFP activity for MNs and SBNs. We defined the “STA onset” as the time when the STA profile crossed a two standard deviation threshold where the mean and standard deviation of the LFP signal were measured 120 to 40 ms preceding spike onset. To quantify this result, the spike-field coherence (SFC) was calculated by normalizing the STA power spectrum by the LFP power spectrum (Fries et al., 2001).
Spectrogram analysis.
To assess whether the frequency content of LFP activity changed over the course of the saccade, we computed spectrograms of the saccade-induced LFPs recorded at each site using the spectrogram function in Matlab with a window size of 100 (The MathWorks). Average LFP spectra were then computed by aligning LFP traces with saccade onset (20 deg/s) and averaging the resultant power spectra of LFPs corresponding to saccades of comparable amplitude and direction (e.g., ipsilateral, contralateral, up, down vs oblique).
LFP and spike tuning curves.
To quantify and compare the tuning of LFPs and spiking responses, we analyzed data from saccades made across a full range of directions. Since LFP amplitudes/spiking activity increase linearly with saccade amplitude, we limited this analysis to saccades ranging from 5 to 10 deg in amplitude. Tuning curves relating the amplitude of the LFP response/number of spikes during the saccade, as a function of saccade direction, were fit with Gaussian curves with the following equation:
where θ represents the direction of the saccade and μ, σ, and A are the mean, the standard deviation, and the amplitude, respectively, of the Gaussian curve.
Unless otherwise stated, values are means ± SDs.
Results
Extracellular spiking activity and LFPs were recorded simultaneously from single electrodes, and characterized in the context of a well defined neural network: the brainstem saccadic circuitry (Fig. 1). Activity was recorded from saccade-related neurons in 3 distinct nuclei whose anatomical connections and spiking output properties are well known (see review Sparks, 2002), but whose LFP responses have not yet been studied. Notably, while excitatory and inhibitory drives to motor and premotor neurons are assumed to reciprocally excite/inhibit action potential firing (and OPNs during all saccades), to date we have limited knowledge of the relative weighting and/or dynamics of these inputs. Accordingly in this study, simultaneous LFP and spiking responses were recorded from (1) OPNs in the nucleus raphe interpositus, which are tonically active during visual fixation and cease firing during saccades, (2) SBNs in the paramedian pontine reticular formation, which have reciprocal inhibitory connections to OPNs (Nakao et al., 1980; Strassman et al., 1987) and send saccade-related command signals (e.g., saccade velocity, duration, direction) to motoneurons, and (3) MNs, which are excited by excitatory SBNs during ipsilateral saccades and carry eye position and velocity commands to activate the lateral rectus muscle and are inhibited by contralateral inhibitory SBNs, which relax the lateral rectus muscle during contralateral saccades (Hikosaka and Kawakami, 1977; Maciewicz et al., 1977; Hikosaka et al., 1980; Langer et al., 1986; Strassman et al., 1986a,b).
LFPs: a reflection of intracellular activity
To test whether LFPs dynamically encode information that is consistent with a given neuron's input, we first analyzed the LFPs recorded from OPNs. Notably, previous analyses of intracellular potentials recorded from OPNs had revealed tight relationships between the saccade metrics (e.g., duration, radial eye velocity, and amplitude) and OPN hyperpolarizations (Yoshida et al., 1999). Moreover, this same study showed that the dynamic time course of OPN hyperpolarizations closely resembles that of the velocity profile of the corresponding saccade.
To address whether these same trends could be measured in LFPs recorded with OPNs, we performed a comparable series of analyses. Figure 2A illustrates a continuous recording of extracellular spiking activity and LFPs from a typical OPN during saccades. A cessation in spiking activity, as well as an LFP response consistent with a net hyperpolarization, occurred during saccades in all directions. (Note that to better compare LFP responses and eye velocity, we plot the inverted LFP trace in this and all subsequent figures.) Figure 2B illustrates this finding for an ensemble of saccades made in the ipsilateral (left panel) and contralateral (right panel) directions. Consistent with the intracellular results, we found a significant correlation between the duration of the LFP modulation and saccade duration in both the ipsilateral (Nsacc = 28) and contralateral (Nsacc = 26) directions (Fig. 2C) (R = 0.8 and R = 0.8, respectively), between the peak of the LFP response and peak radial eye velocity (data not shown; R = −0.41 and R = −0.36), and between the area of the saccade-induced LFP (i.e., time integral) and saccade amplitude (Fig. 2D) (R = −0.8 and R = −0.7). The average correlation coefficients, for each of these three relationships, across the population of OPNs, are summarized in supplemental Figure 1 (available at www.jneurosci.org as supplemental material). Strikingly, a comparison of the dynamic profile of the LFP modulations and corresponding saccadic eye velocity revealed a close resemblance (Fig. 2E). To facilitate comparison of the timing and amplitude of the peaks in the LFP trace and the behavior, the eye velocity traces have been superimposed on the LFP trace. As shown in Figure 2E, this finding was consistent for both typical (Fig. 2E, left) as well as atypical (i.e., display complex temporal dynamics) saccades (Fig. 2E, right). Additional examples of the time-varying OPN LFP response for additional OPNs are shown in supplemental Figure 2 (available at www.jneurosci.org as supplemental material). OPN LFP hyperpolarizing responses, like intracellular membrane potentials, show a tight link with saccadic eye movements. Notably, this was the case in the complete absence of spiking activity (since OPNs do not fire during saccades), indicating a surprisingly strong relationship between the motor tuning of LFPs and behavior.
Figure 2.

Characteristics of LFPs recorded from typical OPN. A, Example traces of horizontal eye velocity, LFP recording, and spiking activity. Note that, regardless of direction, whenever a saccade is made there is a pause in the unit activity and a deflection in the LFP trace that is consistent with a net hyperpolarization. B, A raster displaying spiking activity, as well as average LFP, eye velocity, and eye position traces, is shown for both ipsilateral (left) and contralateral (right) directed saccades. C, D, Plots of LFP duration versus saccade duration (C) and LFP time integral versus saccade amplitude (D) for both ipsilateral (left) and contralateral (right) directed saccades. E, The LFP profile (not inverted) matched eye velocity (superimposed on the LFP trace for comparison) during a typical (left panel) and an atypical (e.g., complex temporal dynamics; right panel) saccade. The timing and amplitude of the peaks in the velocity and LFP profiles are almost synchronous. Inset shows the lead time of the LFP and firing rate responses relative to eye velocity. *Additional examples are illustrated in supplemental Figure 2 (available at www.jneurosci.org as supplemental material).
SBNs are reciprocally connected to OPNs (Fig. 1) and generate high-frequency bursts of action potentials during ipsilateral saccades (i.e., preferred direction) for which the number of spikes generated and the duration and peak firing rate of the burst are related to ipsilateral saccade amplitude, duration, and velocity, respectively (for review, see Sparks, 2002). However, while the spiking output properties of SBNs are well known, to date no study had characterized the LFPs recorded simultaneously from these neurons. We predicted that the LFP responses of SBNs should be consistent with their known inputs [e.g., OPNs, superior colliculus, contralateral inhibitory SBNs (Strassman et al., 1986a,b)] and could potentially provide information that would not be available from the analysis of spike trains.
Figure 3A shows the LFPs and spiking activity of a typical SBN. A high-frequency burst of action potentials was recorded during saccades made in the preferred direction and the neuron was silent during saccades made in the nonpreferred (i.e., contralateral) direction. Similarly, simultaneously recorded LFP responses were consistent with a net depolarization in the neuron's preferred direction and a net hyperpolarization during the nonpreferred direction (Fig. 3A, filled vs unfilled boxes). In addition, consistent with our OPN results, the dynamic profile of the LFP response resembled eye velocity during both typical (Fig. 3B, left) and atypical saccades (e.g., complex temporal dynamics) (Fig. 3B, right; and additional examples from SBNs recorded in a second monkey are shown in supplemental Fig. 2, available at www.jneurosci.org as supplemental material). Moreover, the amplitude of the LFP response increased with saccade amplitude (Fig. 3C1,C2, left vs right panels). Specifically, during saccades in either the preferred or nonpreferred direction, the magnitude of the saccade-induced LFP modulation was well correlated with saccade amplitude (R = 0.7 and R = −0.7, respectively), the duration of LFP modulation was well correlated to the duration of the corresponding saccade (R = 0.9 and R = 0.8, respectively), and the peak of the LFP modulation was correlated with the peak eye velocity (R = 0.7 and R = −0.7).
Figure 3.
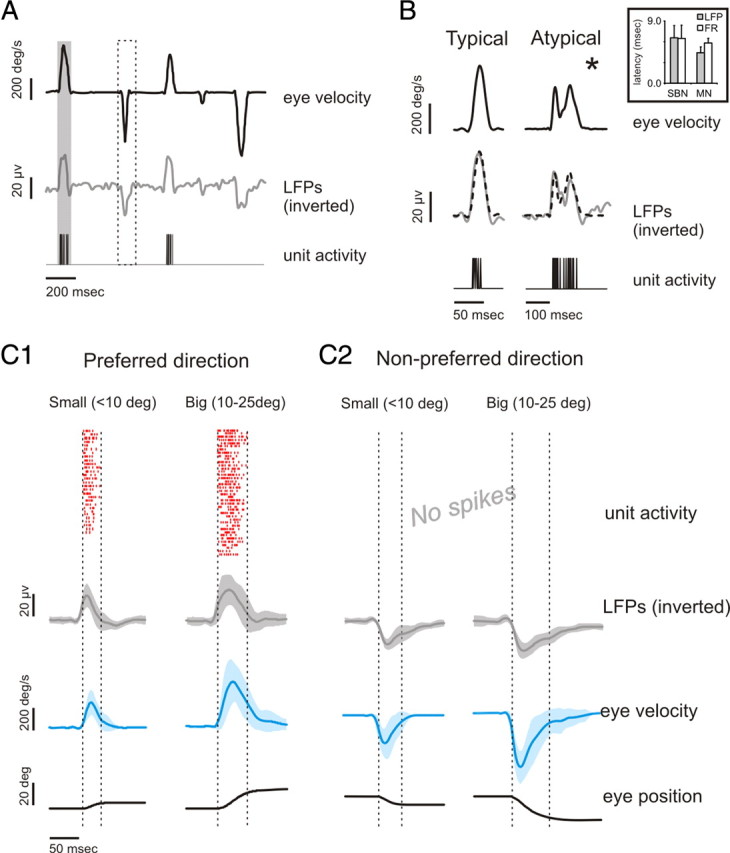
Characteristics of LFPs recorded from typical SBN. A, Example traces of horizontal eye velocity, LFP recording, and single-unit activity. Note that whenever a saccade is made in the cell's preferred direction, an LFP response that is consistent with a net depolarization occurs, whereas when the saccade is in the antipreferred direction, the response is consistent with a net hyperpolarization. B, The LFP profile matched eye velocity during typical (left panel) and atypical (e.g., complex temporal dynamics; right panel) saccades. The timing and amplitude of the peaks in the velocity and LFP profiles are almost synchronous. Inset shows the lead time of the LFP and firing rate responses relative to eye velocity. *Additional examples are illustrated in supplemental Figure 2 (available at www.jneurosci.org as supplemental material). C, A raster displaying unit activity, as well as average LFP, eye velocity, and eye position traces, is shown in the preferred (C1) and nonpreferred (C2) directions.
An analysis of spiking and LFP data recorded from MNs revealed equivalent trends (data not shown). Supplemental Figure 1 (available at www.jneurosci.org as supplemental material) summarizes the average correlation coefficients for the three relationships, across each population of neurons recorded. Overall, the findings are consistent with our prediction that LFP responses provide insights into local processing that are not available in the spike train.
LFP response timing is consistent with sequential processing within the saccadic network
We next determined whether LFPs provide a precise measure of timing relative to the generation of a motor command during premotor processing. Specifically, we compared the response latencies and information conveyed by spike trains versus LFPs in relation to the generated motor behavior (i.e., saccade) at two sequential stages of processing. Response latencies were first determined by calculating the difference between the onset of the saccade-induced LFP/spiking activity and the onset of the saccade using a 2 standard deviation criterion (see Materials and Methods). Overall, we found that the average latencies for each neuron type agreed with its place within the circuit's hierarchical processing order. In particular, LFP responses recorded from MNs, which are the last neurons in the circuit to be activated to produce a saccade, had shorter latencies (4.4 ± 0.85 ms) than SBNs (6.6 ± 1.8 ms) and OPNs (5.5 ± 2.0 ms). Notably, when we compared the estimated latencies of LFPs to those of spiking activity for a given neuron, there were no differences between the two response latencies (insets of Figs. 2E, 3B). Thus, these results suggest that LFP response latencies are consistent with a neuron's place within the neural circuit.
To verify the robustness of this finding, we calculated neuronal response lead times using a second approach. LFP/spiking activity was shifted in time relative to the saccade by the lead time [the optimal dynamic delay (td)] that provided the best fit of the neuronal response when a simple but accurate model was used). Notably, in this analysis the entire portion of the temporally shifted LFP/spike train that was coextensive with the saccade duration was used to fit the model. We used the formulations that had been previously shown to well describe the spike train rate dynamics of SBNs and MNs (Cullen and Guitton, 1997; Sylvestre and Cullen, 1999, 2002; Sylvestre et al., 2003; Van Horn et al., 2008; Van Horn and Cullen, 2009). The precise relationships between MN and SBN spiking activity and eye motion are described by Equations 1a and 2 in Materials and Methods, respectively. Notably, SBN spike trains encode eye velocity during saccades, while MN spike trains encode both eye position and velocity. Again, the estimated response latencies for MNs (7.6 ± 0.9 ms) were shorter than the response latencies of its premotor input the SBNs (9.5 ± 1.3 ms).
The temporal dynamics of LFPs predict motor behavior
The results presented above introduced and used a dynamic approach for the estimation of LFP and spike lead time. We next further used this approach to understand the relationship between LFP dynamics and eye movements. Figure 4A illustrates the relationships between LFP/spike train dynamics and eye motion for representative recordings made from an example SBN, MN, and OPN. As shown by the fits (red traces) superimposed on the LFP trace (gray trace, third row; VAFSBN = 0.66; VAFMN = 0.67; VAFOPN = 0.65) and spiking activity (gray filled profile, fourth row; VAFSBN = 0.36 and VAFMN = 0.62), the dynamics of both neural signals encoded eye velocity well when saccades were made in a given cell's preferred direction. Note that the VAF values were always calculated when fitting an entire dataset, which included a wide range of saccade amplitudes (see supplemental Fig. 3A, available at www.jneurosci.org as supplemental material, for the distribution of saccade amplitudes; average dataset included 41.8 ± 5.8 saccades; average saccade amplitude was 12.5 ± 8.5 deg). To ensure that the robustness of the LFP fit was not influenced by a higher sampling of larger or smaller saccades, we also predicted the LFP response of MNs for a subgroup of small (4–10 deg) and large (>20 deg) saccades using the parameters that were estimated for the entire dataset. Indeed, a comparison of the VAFs revealed no significant differences between the two groups of saccades (p > 0.05) (see supplemental Fig. 3B, available at www.jneurosci.org as supplemental material).
Figure 4.

Dynamic analysis of LFP and single unit responses recorded from an example SBN, MN, and OPN. A1–A3, The fits (red traces) obtained using Equation 1 (SBN and OPN) or Equation 2 (MN) (see Materials and Methods for details) are superimposed on the LFP trace (gray trace, third row) and spiking activity (gray filled profile, fourth row) for the neuron's preferred (left panels) and nonpreferred (right panels) directions. Both the firing rate and LFPs encoded eye velocity in the preferred direction. In contrast, in the neuron's nonpreferred direction, eye velocity was well encoded by LFPs, but not by spiking activity. Insets show the eye velocity coefficient obtained using Equation 1 (SBNs and OPNs) or Equation 2 (MNs) for both ipsilateral and contralateral saccades. Note that the VAF values were always calculated when fitting the entire dataset of saccades. B1–B3, Histograms of VAFs estimated for LFPs during ipsilateral (i.e., preferred) and contralateral (i.e., nonpreferred) saccades for each population of neurons recorded.
In contrast, in the absence of spiking activity (e.g., during contralateral saccades for SBNs and MNs, and ipsilateral and contralateral saccades for OPNs), LFPs well encoded the dynamics of the corresponding saccade (Fig. 4A; fits superimposed in red on gray LFP trace; third row; VAFSBN = 0.52; VAFMN = 0.64; VAFOPN = 0.76). This discrepancy was due to the fact that LFP activity continued to a show robust time-varying modulation in association with these saccades, while there was an absence of corresponding action potentials.
Overall, these main findings were confirmed for each population of neurons recorded. The time-varying profiles of spiking activity and LFPs equally well predicted the dynamics of saccades made in a neuron's preferred direction (p > 0.05), but only LFP responses dynamically encoded eye velocity during saccades in the nonpreferred direction. Notably, in the case of OPNs (Fig. 4B3), only the LFPs robustly encoded eye velocity in either direction, since there was no concurrent spiking activity. The distributions of VAFs estimated for LFPs, across the three populations of neurons are illustrated in Figure 4B. A more complex dynamic model incorporating an eye acceleration term increased our ability to predict eye movement using the LFP signal by <10% (ipsilateral direction: VAFLFP-OPN = 0.74 ± 0.03; VAFLFP-SBN = 0.57 ± 0.09; VAFLFP-MN = 0.51 ± 0.05, and contralateral direction: VAFLFP-OPN = 0.65 ± 0.05; VAFLFP-SBN = 0.42 ± 0.1; VAFLFP-MN = 0.44 ± 0.03).
Interestingly, for SBNs and MNs, a comparison of the estimated velocity coefficients showed that the amplitude of modulation of the measured depolarizations and hyperpolarizations of the LFPs, was the same for saccades made in the preferred versus nonpreferred directions (p > 0.05) (Fig. 4A1,A2, insets). As addressed further in the Discussion, this finding indicates a precise balance in the relative strength of depolarization versus hyperpolarization during preferred versus nonpreferred saccades, respectively. Additionally, for OPNs, the modulation of measured hyperpolarizing LFPs was comparable in both ipsilateral and contralateral directions (p > 0.05) (Fig. 4A3, inset).
To further assess the amount of information conveyed by LFPs and spike trains, we next characterized both signals using a reconstruction technique that is based on a linear decoding algorithm (Rieke et al., 1996) (see Materials and Methods). This approach has proven useful for quantifying the amount of information transmitted by spikes (Rieke et al., 1996) and in contrast to the linear regression technique used above, it does not require prior assumptions regarding the relationship between two signals. Instead, the characteristics of the linear relation are revealed by the shape of the optimal filter, which is estimated.
Comparison between the original and reconstructed eye velocities computed from LFPs recorded from an example SBN revealed that LFPs encode variations in the eye velocity in both directions with great accuracy (Fig. 5A,B, top row, blue traces) (CFpref = 0.56 and CFnon-pref = 0.49). In contrast, eye velocity could only be reconstructed from spiking activity when saccades were made in the preferred direction (Fig. 5A,B, second row, red traces) (CFpref = 0.55 vs CFnon-pref = 0). These findings were confirmed for each population of neurons; variations in LFP and spiking activity were equally good at predicting saccade dynamics for saccades in the preferred direction (p > 0.05), but reconstructions could only be computed from the LFP signal that occurred during nonpreferred directed saccades (e.g., contralateral direction for SBNs and MNs and both ipsilateral and contralateral direction for OPNs). For comparison, we also reconstructed eye velocity using an estimate of neuronal firing rate, computed by convolving a Gaussian function (SD of 5 ms) with the spike train (Cullen et al., 1996). If LFPs represent a low pass filtered version of the spike train, then this estimate of firing rate should convey similar information as LFPs. Figure 6 shows that this prediction is contradicted by our quantification; reconstructions based on firing rate (black histograms) failed to predict eye velocity during saccades made in the nonpreferred direction. Thus, LFPs convey more information than the spike trains as well as the associated firing rate and are not simply a filtered version of the spike train.
Figure 5.

Stimulus reconstruction of the eye velocity using LFPs and spikes recorded from SBN neuron. Eye velocity (black trace; duplicate for clarity in first and second row), stimulus reconstruction of eye velocity using LFPs (first row; blue trace) or spikes (second row; red trace), LFPs, and spiking activity are shown for saccades made in the preferred (A) and nonpreferred (B) directions. Note that in the preferred direction, both the LFPs and spikes were able to accurately reconstruct the corresponding eye velocity signal (CFLFP = 0.56; CFspike = 0.49). In the nonpreferred direction, however, only the LFPs precisely described the eye velocity (CFLFP = 0.55; CFspike = 0). Notably, the CFs were calculated for the entire signal length, which was made up of at least 40 saccades. Optimal filters were calculated for each individual neuron. The insets show the mean optimal filter estimated from LFPs for the reconstructions of the eye velocity profiles for the population of neurons.
Figure 6.
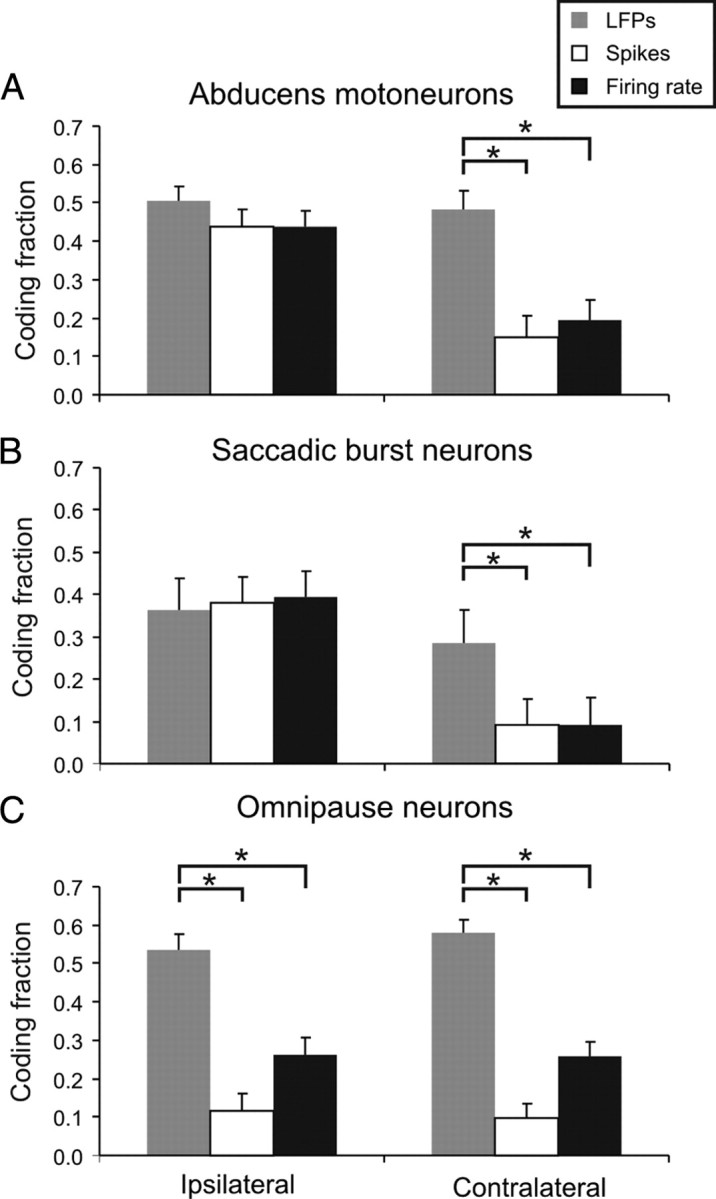
Average population coding fractions for MNs (A), SBNs (B), and OPNs (C) when the reconstruction of the eye velocity was applied with the LFP signal (gray), spike train (white), and firing rate (black). Note that LFPs recorded from MNs, SBNs, and OPNs are able to reconstruct the eye velocity in both the neurons' preferred (i.e., ipsilateral) and nonpreferred (i.e., contralateral) directions. Although the spike train and firing rate accurately reconstruct the eye velocity in the preferred direction of the MNs and SBNs, these signals fail to do so in the neurons' nonpreferred direction. C, Spiking activity and firing rate recorded from OPNs were unable to reconstruct the eye velocity in both the ipsilateral and contralateral directions.
The estimated optimal filters for both LFP and spiking based reconstructions were monophasic and narrow (Fig. 5, insets), indicating that both neuronal signals could be approximated, in large part, by appropriate scaling of the eye velocity signal consistent with the results of our regression analysis. Because MNs are one synapse closer to the motor output than are the premotor SBNs, we predicted that dynamics of the LFPs recorded with MNs should be the more tightly linked to eye movement. Indeed, we found that the CFs of MNs were significantly higher than those of SBNs (p < 0.05 for saccades made in the preferred and nonpreferred direction, respectively). Average CFs estimated for neuronal responses during preferred and nonpreferred direction saccades are summarized in Figure 6 for each group of neurons.
Temporal and spatial relationships between spike trains and LFPs
Given the similarity in the filters estimated between spiking activity and eye movement versus LFPs and eye movement, we next asked whether the spike trains of individual neurons could explain the time course of the simultaneously measured LFPs. Our finding that LFPs encode saccades with comparable accuracy as the corresponding spike train, suggested that little filtering occurs between LFP responses and spike activity. To directly test this proposal, we again applied the linear reconstruction approach (Rieke et al., 1996), but this time we estimated the time course of the LFP response from the corresponding spiking activity. We found that the activity of a single neuron well predicted the dynamic profile of the corresponding LFP response (supplemental Fig. 4A, available at www.jneurosci.org as supplemental material). The shape of the optimized filter was monophasic and narrow and was highly stereotyped at each stage of processing (supplemental Fig. 4B, available at www.jneurosci.org as supplemental material). Interestingly, this filter differs markedly from that estimated in a recent study of neurons in monkey visual cortex (Rasch et al., 2009) in which the optimal filter shape was substantially wider. We consider the implications of this result in the Discussion.
We further examined the degree of temporal correlation between spikes and LFPs by calculating STAs of the LFPs (Fries et al., 2001). The STA obtained for MNs and SBNs during saccades toward the preferred direction was consistent with a causal relationship between LFP and spiking activity (Fig. 7A). We found that on average onset in the STA preceded the onset of spiking of activity by 5.8 ± 3.3 ms for MNs and 6.0 ms ±5.3 ms for SBNs. Notably, the STA response of the MNs was higher at the end of the saccade than that of SBNs, which reflects the fact that MNs are also sensitive to eye position and continue to receive inputs related to eye position even once the saccade has finished. The later suppression seen in the burst neurons could be due to a transient increase in inhibition from the OPNs that occurs at the onset of visual fixation (Bergeron and Guitton, 2002). To quantify the STA modulation, we next calculated the SFC for each neuron (Fries et al., 1997, 2001). The SFC measures the temporal correlation between spikes and LFP oscillations as a function of frequency, and we found that the average peak SFC for SBNs was 0.78 ± 0.07 and 0.85 ± 0.1 (mean ± SE) for MNs, which occurred at 7.5 Hz and 7.6 Hz, respectively (Fig. 7, inset). Thus, together these results are consistent with the proposal that there is a causal temporal relationship between LFPs and spiking activity.
Figure 7.

STA and SFC for MNs (left column) and SBNs (right column). A1 and B1 show the STAs of 2 example cells centered on the first spike of each trial. The onset of the first 2 standard deviation threshold crossing in the STA was computed 120 to 40 ms preceding spike onset (see gray areas). The latency was obtained by measuring the duration between the spike onset and the STA onset (see vertical arrow). For both example neurons, the STA onset precedes the onset of spiking activity. A2 and B2 show population averages of STA superimposed on ±1 SEM (gray area). On average, the STA onset precedes the onset of spiking activity. The insets show the average SFC computed by taking the maximum of the normalized power spectrum for each neuron. Both classes of neurons display high SFCs indicating a strong positive correlation between the LFP signals and the spiking activity.
The results presented so far show that LFPs can encode the detailed time course of eye velocity during horizontal saccades (ipsilateral and contralateral) even when there are no spikes generated. To gain a more complete understanding of the spatial tuning of the LFP response, in relation to spiking activity, we next compared the two signals recorded from each neuron for saccades made in all directions. Figure 8 shows the spiking activity and average LFPs recorded simultaneously from a typical SBN during saccades, of equal amplitude (10 deg), made in 8 different directions (e.g., left, right, up, down, and oblique). The two signals are superimposed on a corresponding spectrogram. Notably, both spiking and LFP activity showed a marked decrease as the direction of the saccade approached vertical relative to the preferred direction (e.g., toward UP; 0 to 90 deg and toward DOWN; 0 to 270 deg). However, as saccades became oblique with a contralaterally directed horizontal components (relative to vertical) again only LFP responses showed clear modulation, such that responses for purely contralateral saccades were comparable in magnitude (but opposite in polarity) to those observed for saccades in the preferred direction. Nevertheless, regardless of movement direction, saccade-related LFPs were limited to lower frequencies (e.g., <20 Hz; compare most leftward and rightward spectrograms in Fig. 8A). Notably no significant power was seen at higher frequencies even when the spectrogram was normalized to baseline activity and plotted using semilog units (see supplemental Fig. 5A, available at www.jneurosci.org as supplemental material).
Figure 8.
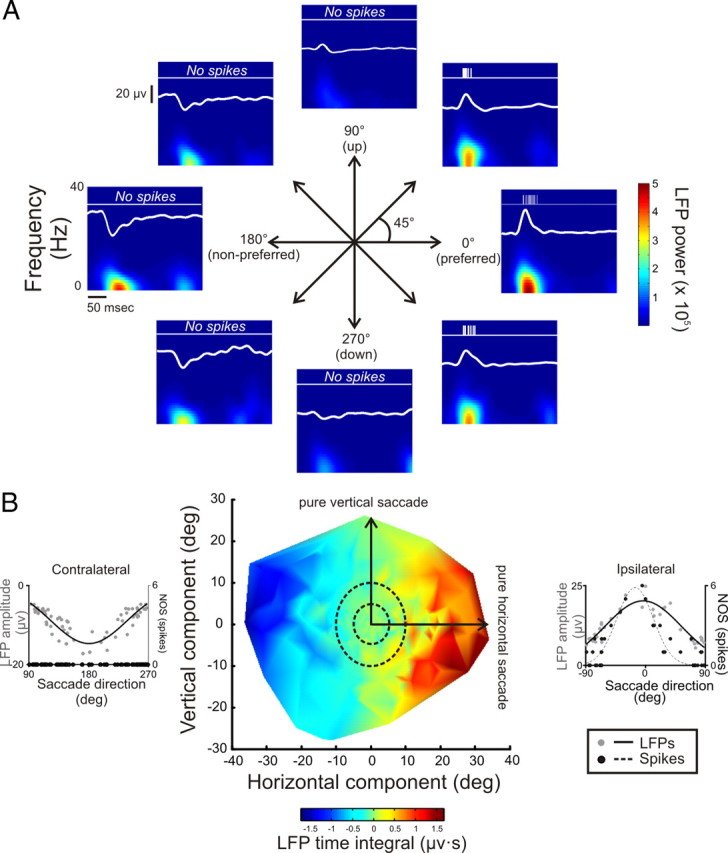
Spatial relationship of SBN LFP responses. A, Spiking activity and average LFPs recorded simultaneously from a typical SBN during saccades, of equal amplitude (10 deg), made in 8 different directions (e.g., left, right, up, down, and oblique) are superimposed on average spectrograms. Zero and one hundred eighty degrees correspond to the cell's preferred and antipreferred directions, respectively; 90 and 270 deg correspond to vertical up and vertical down saccades, respectively. The x- and y-axes represent time and frequency, respectively, while LFP power is color coded. B, Plot of saccade endpoint relative to the origin where the x- and y-axes represent horizontal and vertical components, respectively, and the time integral taken over the saccade interval of the corresponding LFP response is color coded. Left and right insets show tuning curves for saccades (5 to 10 deg) made in contralateral and ipsilateral directions, respectively.
To develop a more complete quantification of LFP tuning, we analyzed data from saccades (N = 400) made across a full range of directions (0–360 deg) and amplitudes (±25 deg). The results of the analysis are shown in Figure 8B. As saccade amplitude increased, LFP activity became increasingly positive (i.e., hotter in color) for ipsilateral saccades and increasingly negative (i.e., cooler in color) for contralateral saccades. Additionally, as expected from the data shown in Figure 8A, LFP responses were minimal for vertically directed saccades (baseline = light green). During ipsilaterally directed saccades, the directional tuning of LFP and spiking responses were both well described by a Gaussian function (Fig. 8B, right inset; compare black and gray circles). In contrast, during contralateral saccades, only LFP responses showed clear Gaussian tuning (Fig. 8B, left inset). Similar results were obtained for the population of SBNs; the LFPs were tuned for saccades of −1.2 ± 4.4 deg and 178 ± 3.7 deg (R2 = 0.60 ± 0.04 and R2 = 0.55 ± 0.0.4, respectively) (supplemental Fig. 6, available at www.jneurosci.org as supplemental material). Thus, while the spiking activity of SBNs shows tuning for ipsilateral saccades, LFPs are tuned (with opposite polarities) for both ipsilateral and contralateral saccades.
Figure 9 shows the same analysis as shown in Figure 8 but for a typical OPN. In contrast to the SBN, the OPN ceased firing spikes for 10 deg saccades in all directions including vertical and oblique as well as horizontal movements (Fig. 9A). Notably, the cessation in spiking activity was accompanied by a corresponding LFP response that was of equal magnitude for saccades made each direction. Additionally, as shown in the corresponding spectrograms, the power in the saccade-induced LFP was comparable and limited to lower frequencies (e.g., <20 Hz) regardless of saccade direction (see also supplemental Fig. 5B, available at www.jneurosci.org as supplemental material, in which the spectrogram is normalized and plotted using semilog units). Further analysis of responses during saccades spanning a more complete range of directions and amplitudes (see Fig. 8B) revealed that LFP responses became increasingly negative (e.g., cooler in color = darker blue) as saccade amplitude became larger regardless of saccade direction (Fig. 9B). The left and right insets illustrate LFP response amplitude as a function of saccade direction for ipsilaterally and contralaterally directed saccades, respectively. In contrast to SBNs, neither the LFP nor spiking responses of the example OPN showed directional tuning (Fig. 9B, insets; gray circles). This observation was confirmed for the population of OPNs (p = 0.59 ± 0.07 and 0.51 ± 0.07 for ipsilateral and contralateral directed saccades, respectively). Therefore, while the LFPs of OPNs encode the speed, duration, and amplitude of a saccade, they do not indicate its direction.
Figure 9.
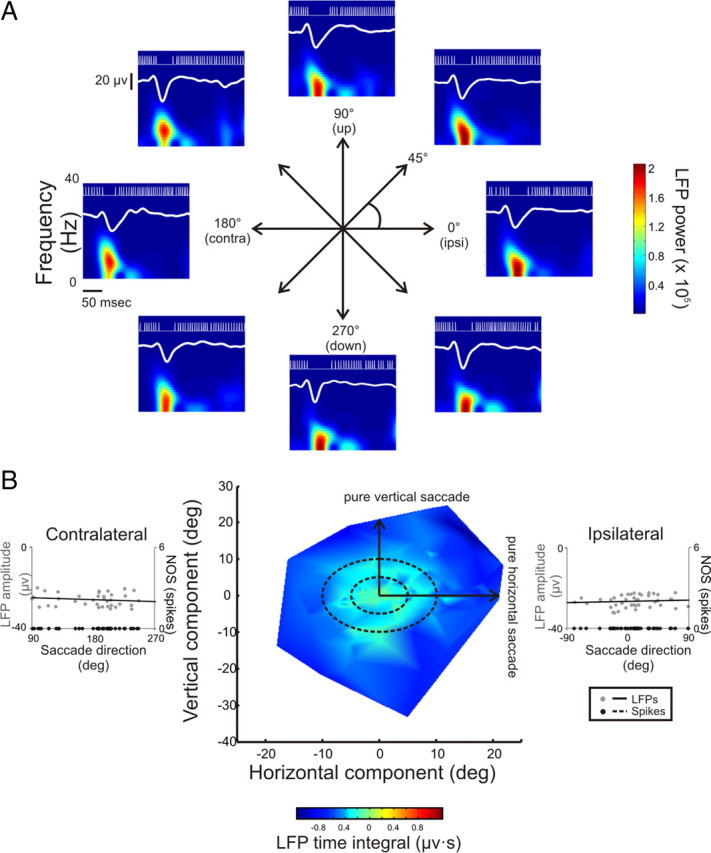
Spatial relationship of OPN LFP responses. A, Spiking activity and average LFPs recorded simultaneously from a typical OPN during saccades, of equal amplitude, made in 8 different directions (e.g., left, right, up, down, and oblique) are superimposed on average spectrograms. Zero and one hundred eighty degrees correspond to the cell's ipsilateral and contralateral directions, respectively. The x- and y-axes represent time and frequency, respectively, while LFP power is color coded. B, Plot of saccade endpoint relative to the origin where the x- and y-axes represent horizontal and vertical components, respectively, and the time integral taken over the saccade interval of the corresponding LFP response is color coded. Note that, regardless of direction, as the amplitude of the saccades made become larger, the peak LFP becomes increasingly negative. Left and right insets show a constant LFP response as a function of saccade direction and a lack of unit activity during saccades (5 to 10 deg) made in the contralateral and ipsilateral direction, respectively.
LFPs are routinely used as a measure of neuronal activity; however, their spatial specificity remains a matter of debate and is likely to differ as a function of the geometry of the structure (e.g., relatively discrete nuclei vs layered structures such as the neocortex or cerebellum) (Logothetis et al., 2001; Kreiman et al., 2006; Katzner et al., 2009). To explicitly assess how electrode location influences the amplitude/reliability of LFP responses in our study, we were able to take advantage of the fact that neurons with similar properties are contained in distinct nuclei. Notably, the abducens nucleus is ideal for this analysis; it is characterized by a group of neurons that have predominately homogenous discharge properties and are organized in a spherical volume with a radius of ∼1 mm. During each recording session where a penetration was made in the abducens (N > 20), we found that saccade-induced LFP responses decreased as the electrode was moved away from the abducens. Indeed, the LFPs were not modulated by saccades once the electrode was >500 μm from lateral edge of the abducens.
To quantify this finding, LFPs were recorded from MNs when the electrode was approximately at the lateral edge of the right abducens nucleus. In two separate sessions the electrode was moved in 50 μm increments and we recorded until the electrode was >500 μm from the original site. At each site (N = 20), we recorded the average amplitude of the LFP response for saccades of ∼10 degrees (Nsacc = 38.5 ± 3.7). A baseline LFP activity was calculated at each site by averaging the peak LFP value during the 100 ms interval before each saccadic eye movement. Figure 10 plots the average peak (gray diamonds) and baseline (black squares) LFP value as a function of distance from the center of the nucleus during one session. The peak LFP values decreased within the first 150 μm and more substantially when the electrode was located 450 μm from the center. At 600 μm the peak LFP value decayed to a baseline level of activity, represented by the dotted line (average baseline values over all distances). The solid line shows an exponential fit to the peak LFP data points (R12 = 0.98 and R22 = 0.89; and τ1 = 0.37 and τ2 = 0.25). These findings indicate that the placement of the electrode relative to the recording site of interest has a significant effect on the measured response such that the LFPs recorded using standard single unit recording approaches in discrete nuclei reflect relatively local (i.e., within an ∼500 μm radius) events.
Figure 10.

Effect of electrode distance on LFP response. A, LFPs traces when electrode was placed 0, 150, 300, and 600 μm away from the lateral edge of the abducens nucleus. Note that as the electrode is placed further away, the LFP trace becomes noisier. The average eye position trace is shown below. B, Plot of the peak (black circles) and baseline (gray squares) LFP response as a function of distance from the nucleus. As the electrode is moved further away, the LFP activity decays to a baseline level. Solid line represents an exponential fit to peak LFP values (τ = 0.37; R2 = 0.98). Dotted line represents average of baseline values for all distances plotted.
Discussion
We studied the local neural processing required for the precise control of eye movement dynamics by simultaneously recording spiking activity and LFPs in the saccadic premotor network. We found that LFPs encode important information that cannot be extracted from single spikes. To understand how local neural processing precisely shapes the generation of dynamic eye movement commands, we first characterized the relationship between spiking activity and LFPs recorded in association with individual premotor and motoneurons. During saccades made in a neuron's preferred direction, bursts of spikes were recorded with depolarizing LFP responses, consistent with a net excitatory synaptic input. LFPs reflected movement dynamics as robustly as spiking activity, and there was a consistent temporal relationship between LFP modulations and spike onset, suggesting that minimal filtering occurs between a neuron's input and output. Conversely, when saccades were made in the opposite direction, neurons ceased spiking and the associated LFP responses were consistent with a net hyperpolarization. Remarkably, hyperpolarizing LFPs dynamically encoded saccade trajectories with fidelity equal to that of depolarizing LFPs observed during preferred direction saccades. Next, to understand sequential processing within the saccadic premotor network, the spiking output recorded at one stage of processing was compared to the LFP response recorded at the next hierarchical level. Response latencies were in agreement with each neuron's place within the circuit. Quantification of the time-varying profiles of the LFPs showed that a balance of depolarization and hyperpolarization underlies the production of precise saccadic eye movement commands at both motor and premotor levels such that neuronal activity is symmetrically modulated around a stable resting network state.
LFPs display properties similar to intracellular recordings
To date, surprisingly few studies have explicitly compared LFPs and intracellular responses measured in nearby neurons. Similarities have been described in onset latencies, frequency tuning [auditory system (Kaur et al., 2004)], and the response phase of the two signals [olfactory system: Wehr and Laurent (1999) and Tanaka et al. (2009); sleep: Haider et al. (2006) and Mukovski et al. (2007)]. Our analysis of OPN LFP responses during saccades provides an unambiguous test of the proposal that this signal encodes the input rather than the filtered output of a given group of neurons. Here, we show that, in the complete absence of spiking output, LFPs, recorded simultaneously with OPNs, display characteristics similar to the intracellular responses of these neurons. Notably, OPNs exhibit an abrupt hyperpolarization that lasts throughout the entirety of the saccade and is correlated with the saccade's amplitude and peak velocity. Moreover, we show not only that inhibitory LFP responses are correlated with these saccadic parameters, but that this signal also robustly encodes saccade dynamics. Accordingly, our results strongly suggest that the pause in OPN spiking activity is caused by IPSPs (as opposed to the removal of an excitatory input) and that this inhibitory input can be measured using extracellular recordings of the associated LFP activity. Together these results support the proposal that LFPs provide a dynamic measure of local synaptic activity, using extracellular recording techniques.
LFPs provide precise timing information and predict motor responses for movements in the nonpreferred as well as preferred directions
The finding that LFPs provide a dynamic measure of intracellular responses supports the proposal that simultaneous recordings of LFPs (i.e., input) and spikes (i.e., output) provide a means for evaluating local neural processing that take place in a given brain area. Previous studies of movement execution control have established that LFPs can encode behavioral states (i.e., planning vs movement execution) more efficiently than single spikes (Pesaran et al., 2002; Scherberger et al., 2005; Hwang and Andersen, 2009). However, before our experiments, no study had addressed how the local computations that take place within premotor pathways determine the precise dynamics of a movement trajectory.
Our recordings show that LFPs dynamically encode important information that cannot be extracted from spiking responses. First, we found that LFP response latencies were consistent with the associated neuron's place within the premotor circuit's hierarchical processing order for saccade generation; estimated latencies for motoneurons were shorter than those recorded for upstream neurons. Notably, the finding that OPN latencies were slightly shorter than SBN latencies is consistent with the proposal that the pause in OPN activity during saccades is the result of an inhibitory input from SBNs (Yoshida et al., 1999). Second, we also found, using both standard regression and optimal linear reconstruction approaches, that the relationship between LFP responses and eye movements were equally well described by the same formulations for saccades made in preferred and nonpreferred directions. Thus, strikingly, LFP activity robustly encoded eye movement dynamics even when there was no corresponding spiking activity. This latter observation has important implications, since it directly refutes the possibility that LFPs reflect a filtered version of the temporally clustered spike trains of ensembles of neurons (Mitzdorf, 1985; Fries et al., 2001).
From local field potentials to spike trains: temporal and spatial relationships
In a reconstruction analysis, we estimated the optimal linear filters that describe the relationship between neuronal responses and behavior. We chose this approach since it (1) requires no inherent assumptions regarding model structure (apart from the requisite assumption of linearity) and (2) has proven to be useful for quantifying the ability of spikes to encode a stimulus in sensory processing pathways (Rieke et al., 1996; Sadeghi et al., 2007). We found that optimal filters were remarkably similar for the LFPs and spike trains recorded from each group of neurons; the shape was narrow and monophasic, indicating that both neuronal signals predominantly encoded eye velocity during saccades. On the basis of this result, we predicted that the spike train of individual neurons (i.e., output) should have dynamics comparable to that of the associated LFPs (i.e., input). Indeed, there was minimal filtering between each neuron's input and output. While this finding differs markedly from that in neocortex (Rasch et al., 2009), it is likely that differences in the intrinsic properties of neurons as well as the geometry of the neocortex versus other structures are important factors in determining the precise relationship between individual spikes and measured LFP activity.
Spectral analysis further demonstrated that LFP responses were predominantly confined to a relatively low frequency range (<20 Hz; i.e., β and lower frequency band responses). While the polarities of the LFPs associated with recordings of SBNs and MNs were oppositely directed for ipsilateral versus contralateral saccades, the spectrum was comparable for saccades made in either direction. Similarly, the power of the LFPs recorded in association with the pause in OPN firing rate during saccades was concentrated in this frequency range. Our finding that movement-related LFP responses are principally low frequency is consistent with the spectrum of LFPs recorded from neurons in primary motor cortex during arm movements (O'Leary and Hatsopoulos, 2006) as well as the finding that arm movement direction is significantly better encoded in this relatively lower frequency band than by gamma band fluctuations (Moschovakis and Highstein, 1994). Together, these results suggest that low-frequency LFP modulations encode vital information required for the control of eye as well as arm movements.
Functional implications of LFPs as related to the analysis of neural circuits
The saccadic circuitry is well suited to analyze local circuit computations because its connectivity and spiking output properties have been extensively characterized. Previous intracellular recording studies have revealed that abducens MNs receive excitatory input from ipsilateral, excitatory SBNs during ipsilateral saccades, and inhibitory input from the contralateral inhibitory SBNs during contralateral saccades [for review, see Nakao et al. (1980), Curthoys et al. (1984), and Strassman et al. (1987)] (Fig. 1). In addition, OPNs make direct inhibitory connections with SBNs (Langer and Kaneko, 1990; Yoshida et al., 1999), and there is evidence that OPNs receive reciprocal inhibition from SBNs (Strassman et al., 1986b).
While the inhibitory drives to MNs are assumed to inhibit neuronal firing during contralateral saccades (and OPNs during all saccades), to date little is known about the functional weighting/dynamics of these inputs onto their target neurons since previous studies have used traditional extracellular recording techniques that can only describe the excitatory command signals encoded by spiking activity. In this study, we showed that hyperpolarizing LFP responses encode eye velocity signals consistent with the inhibitory drives to MNs and OPNs.
Finally, our observation that hyperpolarizing LFP responses are also recorded in association with premotor SBNs during contralaterally directed saccades is novel. Prior studies have not quantitatively characterized the intracellular responses of SBNs during saccades. We show that SBN LFPs dynamically encode eye velocity during contralateral saccades. This result has important implications, since it suggests that SBNs are actively inhibited by neurons that carry information about the dynamics of the ongoing saccades. Likely candidates for this inhibitory command signal are contralateral SBNs and burst neurons in the superior colliculus; however, these projections remain to be verified. What is even more striking is that an analysis of the LFP profiles reveals that a dynamic balance of depolarization and hyperpolarization underlies the production of precise eye movement commands at both the premotor and motor stages.
Footnotes
This study was supported by the Canadian Institutes of Health Research, the Natural Science and Engineering Research Council of Canada, and the Fonds de la Recherche en Santé du Québec. We thank J. Brooks, M. Jamali, J. Carriot, and A. Schneider for critically reading this manuscript and J. Willms, S. Nuara, W. Kucharski, and J. Knowles for excellent technical assistance.
References
- Bergeron A, Guitton D. In multiple-step gaze shifts: omnipause (OPNs) and collicular fixation neurons encode gaze position error; OPNs gate saccades. J Neurophysiol. 2002;88:1726–1742. doi: 10.1152/jn.2002.88.4.1726. [DOI] [PubMed] [Google Scholar]
- Cullen KE, Guitton D. Analysis of primate IBN spike trains using system identification techniques. I. Relationship to eye movement dynamics during head-fixed saccades. J Neurophysiol. 1997;78:3259–3282. doi: 10.1152/jn.1997.78.6.3259. [DOI] [PubMed] [Google Scholar]
- Cullen KE, Rey CG, Guitton D, Galiana HL. The use of system identification techniques in the analysis of oculomotor burst neuron spike train dynamics. J Comput Neurosci. 1996;3:347–368. doi: 10.1007/BF00161093. [DOI] [PubMed] [Google Scholar]
- Curthoys IS, Markham CH, Furuya N. Direct projection of pause neurons to nystagmus-related excitatory burst neurons in the cat pontine reticular formation. Exp Neurol. 1984;83:414–422. doi: 10.1016/S0014-4886(84)90109-2. [DOI] [PubMed] [Google Scholar]
- Dayan P, Abbot L. Theoretical neuroscience: computational and mathematical modeling of neural systems. Cambridge, MA: MIT; 2001. [Google Scholar]
- Fries P, Roelfsema PR, Engel AK, König P, Singer W. Synchronization of oscillatory responses in visual cortex correlates with perception in interocular rivalry. Proc Natl Acad Sci U S A. 1997;94:12699–12704. doi: 10.1073/pnas.94.23.12699. [DOI] [PMC free article] [PubMed] [Google Scholar]
- Fries P, Reynolds JH, Rorie AE, Desimone R. Modulation of oscillatory neuronal synchronization by selective visual attention. Science. 2001;291:1560–1563. doi: 10.1126/science.1055465. [DOI] [PubMed] [Google Scholar]
- Fuchs AF, Robinson DA. A method for measuring horizontal and vertical eye movement chronically in the monkey. J Appl Physiol. 1966;21:1068–1070. doi: 10.1152/jappl.1966.21.3.1068. [DOI] [PubMed] [Google Scholar]
- Fuchs AF, Scudder CA, Kaneko CR. Discharge patterns and recruitment order of identified motoneurons and internuclear neurons in the monkey abducens nucleus. J Neurophysiol. 1988;60:1874–1895. doi: 10.1152/jn.1988.60.6.1874. [DOI] [PubMed] [Google Scholar]
- Gabbiani F. Coding of time-varying signals in spike trains of linear and half-wave rectifying neurons. Network. 1996;7:61–85. doi: 10.1080/0954898X.1996.11978655. [DOI] [PubMed] [Google Scholar]
- Haider B, Duque A, Hasenstaub AR, McCormick DA. Neocortical network activity in vivo is generated through a dynamic balance of excitation and inhibition. J Neurosci. 2006;26:4535–4545. doi: 10.1523/JNEUROSCI.5297-05.2006. [DOI] [PMC free article] [PubMed] [Google Scholar]
- Harris CM. The Fourier analysis of biological transients. J Neurosci Methods. 1998;83:15–34. doi: 10.1016/s0165-0270(98)00080-6. [DOI] [PubMed] [Google Scholar]
- Hayes A, Richmond BJ, Optican LM. A UNIX-based multiple process system for real-time data acquisition and control. WESCON Conf Proc. 1982;2:1–10. [Google Scholar]
- Hikosaka O, Kawakami T. Inhibitory reticular neurons related to the quick phase of vestibular nystagmus—their location and projection. Exp Brain Res. 1977;27:377–386. doi: 10.1007/BF00235511. [DOI] [PubMed] [Google Scholar]
- Hikosaka O, Igusa Y, Imai H. Inhibitory connections of nystagmus-related reticular burst neurons with neurons in the abducens, prepositus hypoglossi and vestibular nuclei in the cat. Exp Brain Res. 1980;39:301–311. doi: 10.1007/BF00237119. [DOI] [PubMed] [Google Scholar]
- Hwang EJ, Andersen RA. Brain control of movement execution onset using local field potentials in posterior parietal cortex. J Neurosci. 2009;29:14363–14370. doi: 10.1523/JNEUROSCI.2081-09.2009. [DOI] [PMC free article] [PubMed] [Google Scholar]
- Judge SJ, Richmond BJ, Chu FC. Implantation of magnetic search coils for measurement of eye position: an improved method. Vision Res. 1980;20:535–538. doi: 10.1016/0042-6989(80)90128-5. [DOI] [PubMed] [Google Scholar]
- Katzner S, Nauhaus I, Benucci A, Bonin V, Ringach DL, Carandini M. Local origin of field potentials in visual cortex. Neuron. 2009;61:35–41. doi: 10.1016/j.neuron.2008.11.016. [DOI] [PMC free article] [PubMed] [Google Scholar]
- Kaur S, Lazar R, Metherate R. Intracortical pathways determine breadth of subthreshold frequency receptive fields in primary auditory cortex. J Neurophysiol. 2004;91:2551–2567. doi: 10.1152/jn.01121.2003. [DOI] [PubMed] [Google Scholar]
- Kreiman G, Hung CP, Kraskov A, Quiroga RQ, Poggio T, DiCarlo JJ. Object selectivity of local field potentials and spikes in the macaque inferior temporal cortex. Neuron. 2006;49:433–445. doi: 10.1016/j.neuron.2005.12.019. [DOI] [PubMed] [Google Scholar]
- Langer T, Kaneko CR, Scudder CA, Fuchs AF. Afferents to the abducens nucleus in the monkey and cat. J Comp Neurol. 1986;245:379–400. doi: 10.1002/cne.902450307. [DOI] [PubMed] [Google Scholar]
- Langer TP, Kaneko CR. Brainstem afferents to the oculomotor omnipause neurons in monkey. J Comp Neurol. 1990;295:413–427. doi: 10.1002/cne.902950306. [DOI] [PubMed] [Google Scholar]
- Logothetis NK, Pauls J, Augath M, Trinath T, Oeltermann A. Neurophysiological investigation of the basis of the fMRI signal. Nature. 2001;412:150–157. doi: 10.1038/35084005. [DOI] [PubMed] [Google Scholar]
- Maciewicz RJ, Kaneko CR, Highstein SM, Eagen K. Vestibular and medullary brain stem afferents to the abducens nucleus in the cat. Brain Res. 1977;123:229–240. doi: 10.1016/0006-8993(77)90476-0. [DOI] [PubMed] [Google Scholar]
- Mehring C, Rickert J, Vaadia E, Cardosa de Oliveira S, Aertsen A, Rotter S. Inference of hand movements from local field potentials in monkey motor cortex. Nat Neurosci. 2003;6:1253–1254. doi: 10.1038/nn1158. [DOI] [PubMed] [Google Scholar]
- Mitzdorf U. Current source-density method and application in cat cerebral cortex: investigation of evoked potentials and EEG phenomena. Physiol Rev. 1985;65:37–100. doi: 10.1152/physrev.1985.65.1.37. [DOI] [PubMed] [Google Scholar]
- Mitzdorf U. Properties of the evoked potential generators: current source-density analysis of visually evoked potentials in the cat cortex. Int J Neurosci. 1987;33:33–59. doi: 10.3109/00207458708985928. [DOI] [PubMed] [Google Scholar]
- Moschovakis AK, Highstein SM. The anatomy and physiology of primate neurons that control rapid eye movements. Annu Rev Neurosci. 1994;17:465–488. doi: 10.1146/annurev.ne.17.030194.002341. [DOI] [PubMed] [Google Scholar]
- Mukovski M, Chauvette S, Timofeev I, Volgushev M. Detection of active and silent states in neocortical neurons from the field potential signal during slow-wave sleep. Cereb Cortex. 2007;17:400–414. doi: 10.1093/cercor/bhj157. [DOI] [PubMed] [Google Scholar]
- Nakao S, Curthoys IS, Markham CH. Direct inhibitory projection of pause neurons to nystagmus-related pontomedullary reticular burst neurons in the cat. Exp Brain Res. 1980;40:283–293. doi: 10.1007/BF00237793. [DOI] [PubMed] [Google Scholar]
- Nelson MJ, Pouget P, Nilsen EA, Patten CD, Schall JD. Review of signal distortion through metal microelectrode recording circuits and filters. J Neurosci Methods. 2008;169:141–157. doi: 10.1016/j.jneumeth.2007.12.010. [DOI] [PMC free article] [PubMed] [Google Scholar]
- O'Leary JG, Hatsopoulos NG. Early visuomotor representations revealed from evoked local field potentials in motor and premotor cortical areas. J Neurophysiol. 2006;96:1492–1506. doi: 10.1152/jn.00106.2006. [DOI] [PubMed] [Google Scholar]
- Pesaran B, Pezaris JS, Sahani M, Mitra PP, Andersen RA. Temporal structure in neuronal activity during working memory in macaque parietal cortex. Nat Neurosci. 2002;5:805–811. doi: 10.1038/nn890. [DOI] [PubMed] [Google Scholar]
- Rasch M, Logothetis NK, Kreiman G. From neurons to circuits: linear estimation of local field potentials. J Neurosci. 2009;29:13785–13796. doi: 10.1523/JNEUROSCI.2390-09.2009. [DOI] [PMC free article] [PubMed] [Google Scholar]
- Rieke F, Warland D, Steveninck RR, Bialek W. Spikes: exploring the neural code. Cambridge, MA: MIT; 1996. [Google Scholar]
- Sadeghi SG, Chacron MJ, Taylor MC, Cullen KE. Neural variability, detection thresholds, and information transmission in the vestibular system. J Neurosci. 2007;27:771–781. doi: 10.1523/JNEUROSCI.4690-06.2007. [DOI] [PMC free article] [PubMed] [Google Scholar]
- Scherberger H, Jarvis MR, Andersen RA. Cortical local field potential encodes movement intentions in the posterior parietal cortex. Neuron. 2005;46:347–354. doi: 10.1016/j.neuron.2005.03.004. [DOI] [PubMed] [Google Scholar]
- Sparks DL. The brainstem control of saccadic eye movements. Nat Rev Neurosci. 2002;3:952–964. doi: 10.1038/nrn986. [DOI] [PubMed] [Google Scholar]
- Strassman A, Highstein SM, McCrea RA. Anatomy and physiology of saccadic burst neurons in the alert squirrel monkey. I. Excitatory burst neurons. J Comp Neurol. 1986a;249:337–357. doi: 10.1002/cne.902490303. [DOI] [PubMed] [Google Scholar]
- Strassman A, Highstein SM, McCrea RA. Anatomy and physiology of saccadic burst neurons in the alert squirrel monkey. II. Inhibitory burst neurons. J Comp Neurol. 1986b;249:358–380. doi: 10.1002/cne.902490304. [DOI] [PubMed] [Google Scholar]
- Strassman A, Evinger C, McCrea RA, Baker RG, Highstein SM. Anatomy and physiology of intracellularly labelled omnipause neurons in the cat and squirrel monkey. Exp Brain Res. 1987;67:436–440. doi: 10.1007/BF00248565. [DOI] [PubMed] [Google Scholar]
- Sylvestre PA, Cullen KE. Quantitative analysis of abducens neuron discharge dynamics during saccadic and slow eye movements. J Neurophysiol. 1999;82:2612–2632. doi: 10.1152/jn.1999.82.5.2612. [DOI] [PubMed] [Google Scholar]
- Sylvestre PA, Cullen KE. Dynamics of abducens nucleus neuron discharges during disjunctive saccades. J Neurophysiol. 2002;88:3452–3468. doi: 10.1152/jn.00331.2002. [DOI] [PubMed] [Google Scholar]
- Sylvestre PA, Choi JT, Cullen KE. Discharge dynamics of oculomotor neural integrator neurons during conjugate and disjunctive saccades and fixation. J Neurophysiol. 2003;90:739–754. doi: 10.1152/jn.00123.2003. [DOI] [PubMed] [Google Scholar]
- Tanaka NK, Ito K, Stopfer M. Odor-evoked neural oscillations in Drosophila are mediated by widely branching interneurons. J Neurosci. 2009;29:8595–8603. doi: 10.1523/JNEUROSCI.1455-09.2009. [DOI] [PMC free article] [PubMed] [Google Scholar]
- Van Horn MR, Cullen KE. Dynamic characterization of agonist and antagonist oculomotoneurons during conjugate and disconjugate eye movements. J Neurophysiol. 2009;102:28–40. doi: 10.1152/jn.00169.2009. [DOI] [PubMed] [Google Scholar]
- Van Horn MR, Sylvestre PA, Cullen KE. The brain stem saccadic burst generator encodes gaze in three-dimensional space. J Neurophysiol. 2008;99:2602–2616. doi: 10.1152/jn.01379.2007. [DOI] [PubMed] [Google Scholar]
- Van Opstal AJ, Van Gisbergen JA, Eggermont JJ. Reconstruction of neural control signals for saccades based on an inverse method. Vision Res. 1985;25:789–801. doi: 10.1016/0042-6989(85)90187-7. [DOI] [PubMed] [Google Scholar]
- Wehr M, Laurent G. Relationship between afferent and central temporal patterns in the locust olfactory system. J Neurosci. 1999;19:381–390. doi: 10.1523/JNEUROSCI.19-01-00381.1999. [DOI] [PMC free article] [PubMed] [Google Scholar]
- Wessel R, Koch C, Gabbiani F. Coding of time-varying electric field amplitude modulations in a wave-type electric fish. J Neurophysiol. 1996;75:2280–2293. doi: 10.1152/jn.1996.75.6.2280. [DOI] [PubMed] [Google Scholar]
- Yoshida K, Iwamoto Y, Chimoto S, Shimazu H. Saccade-related inhibitory input to pontine omnipause neurons: an intracellular study in alert cats. J Neurophysiol. 1999;82:1198–1208. doi: 10.1152/jn.1999.82.3.1198. [DOI] [PubMed] [Google Scholar]
- Zuber BL, Semmlow JL, Stark L. Frequency characteristics of the saccadic eye movement. Biophys J. 1968;8:1288–1298. doi: 10.1016/S0006-3495(68)86556-7. [DOI] [PMC free article] [PubMed] [Google Scholar]