Abstract
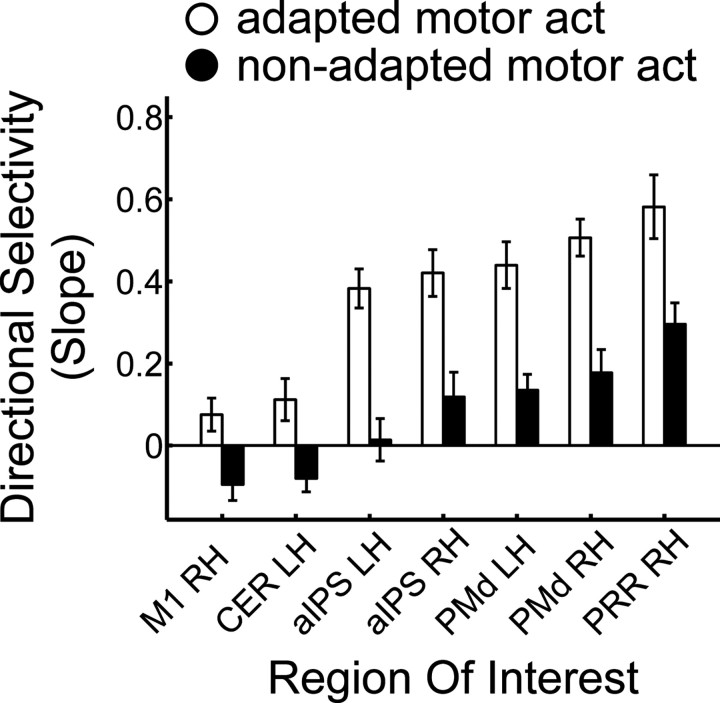
Neurons in macaque primary motor cortex (M1) are broadly tuned to arm movement direction. Recent evidence suggests that human M1 contains directionally tuned neurons, but it is unclear which other areas are part of the network coding movement direction and what characterizes the responses of neuronal populations in those areas. Such information would be highly relevant for the implementation of brain–computer interfaces (BCIs) in paralyzed patients. We used functional magnetic resonance imaging adaptation to identify which areas of the human brain show directional selectivity and the degree to which these areas are affected by the type of motor act (to press vs to grasp). After adapting participants to one particular hand movement direction, we measured the release from adaptation during occasional test trials, parametrically varying the angular difference between adaptation and test direction. We identified multiple areas broadly tuned to movement direction, including M1, dorsal premotor cortex, intraparietal sulcus, and the parietal reach region. Within these areas, we observed a gradient of directional selectivity, with highest directional selectivity in the right parietal reach region, for both right- and left-hand movements. Moreover, directional selectivity was modulated by the type of motor act to varying degrees, with the largest effect in M1 and the smallest modulation in the parietal reach region. These data provide an important extension of our knowledge about directional tuning in the human brain. Furthermore, our results suggest that the parietal reach region might be an ideal candidate for the implementation of BCI in paralyzed patients.
Introduction
Cells in monkey primary motor cortex (M1) are broadly tuned to movement direction (Georgopoulos et al., 1982). Arm posture (Scott and Kalaska, 1997), wrist rotation (Kakei et al., 1999), and changes in the starting location (Caminiti et al., 1990) modulate directional selectivity in M1, suggesting that this area contains neuronal populations that represent movement direction at the level of parameters such as muscle forces and joint angles (Todorov, 2003).
Because of the lack of invasive electrophysiological data, little is known about directional tuning in humans. Using electrodes implanted in human tetraplegic patients, it has been demonstrated that activity of cells in M1 permits classification of the direction of an intended center-out movement with high accuracy (Hochberg et al., 2006; Truccolo et al., 2008). These studies indicate that human M1 contains neurons that are sensitive to movement direction (for similar results using multivariate pattern analysis, see Eisenberg et al., 2010) and thus suggest that M1 might be a good candidate region for brain–computer interfaces (BCIs). Although the studies by Hochberg et al. (2006) and Truccolo et al. (2008) demonstrate that spiking activity in M1 can persist even several years after spinal cord injury, there is evidence that motor cortex and descending motor tracts in patients suffering from complete spinal cord injury undergo degradation (Hains et al., 2003; Wrigley et al., 2009). Therefore, characterizing directional tuning in additional areas that are more closely linked to the visual system might reveal information that is relevant for the development of BCIs (Andersen and Buneo, 2002).
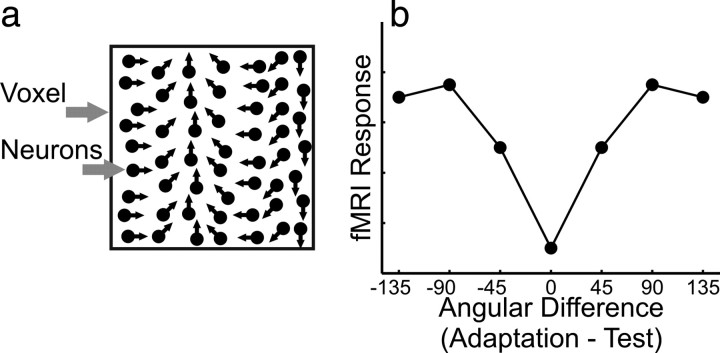
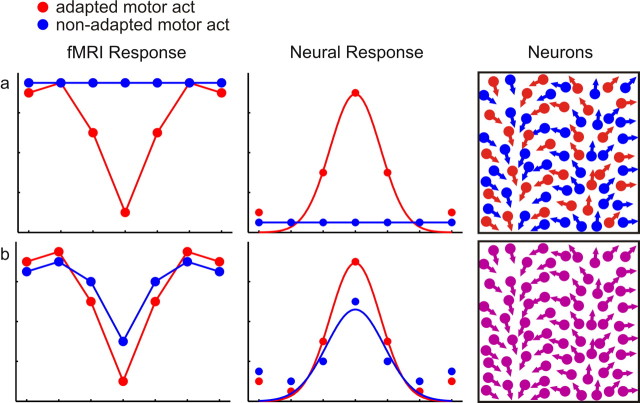
Here we used functional magnetic resonance imaging (fMRI) adaptation (Grill-Spector and Malach, 2001; Krekelberg et al., 2006) to determine which areas of the human brain are broadly tuned to hand movement direction. Participants were adapted to a reaching movement in one specific direction. During occasional test trials, we measured the amplitude of the blood oxygen level-dependent (BOLD) effect as a function of the angular difference between adaptation and test direction (for a similar approach in the number domain, see Piazza et al., 2004). We hypothesized that areas containing directionally tuned neuronal populations (Fig. 1a) show a recovery from adaptation that is proportional to the angular difference between adaptation and test direction (Fig. 1b).
Figure 1.
Prediction. a, A voxel containing directionally tuned neurons. b, Neuronal populations that contain directionally tuned neurons are assumed to show a recovery from adaptation that is proportional to the angular difference between adaptation and test direction.
Because reaching is typically performed in combination with a grasping movement, we furthermore aimed to explore how directional tuning is modulated by the type of grasp. To this aim, we manipulated the type of motor act (to press vs to grasp) orthogonally to movement direction.
We observed a gradient of directional selectivity, with highest directional selectivity in the right dorsal premotor cortex (PMd) and the right parietal reach region (PRR), for both movements of the right and left hand. Activity in these areas was clearly modulated by the type of motor act, with the strongest modulation in M1 and the weakest effect in the PRR. These results provide an important extension of our knowledge on how the brain represents movement direction and furthermore suggest that the PRR might be well suited for BCI application.
Materials and Methods
Participants
Fourteen volunteers (eight males) took part in experiment 1 (mean age, 28.07; range, 22–34 years). Eight of these participants also took part in experiment 2. All participants, except one, were right-handed. Thirteen right-handed volunteers (six male) took part in experiment 2 (mean age, 29.23; range, 22–35 years). Vision was normal or corrected-to-normal using MR-compatible glasses. All participants except two (including one of the authors, A.L.) were naive to the purpose of the study.
All of the participants were neurologically intact and gave written informed consent for their participation. The experimental procedures were approved by the ethical committee for research involving human subjects at the University of Trento.
Experiment 1: right-hand movements
The aim of experiment 1 was to determine which areas of the human brain are tuned to right-hand movement direction and to which degree directional selectivity in these areas is affected by the type of motor act (to press vs to grasp).
Experiment 2: left-hand movements
In experiment 1, using right-hand movements, we observed the strongest directional selectivity in the right hemisphere. This led to the question of whether the highest directional selectivity is right lateralized or whether it is specific to the hemisphere ipsilateral to the hand used in the movement. We therefore performed experiment 2 using the same procedure as in experiment 1 but instructing participants to use the left instead of the right hand.
Procedure and visual stimulation
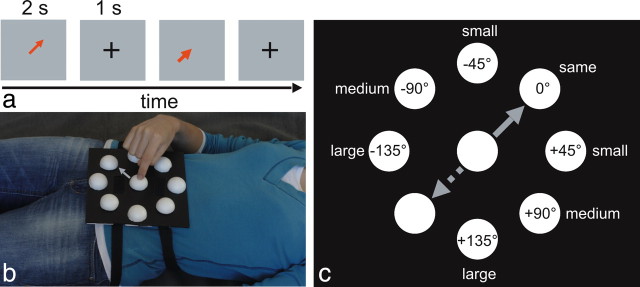
During each trial, we showed participants an arrow at the center of the screen for 2 s, followed by an intertrial interval of 1 s (Fig. 2a). Arrows instructed the participant about the direction of two center-out hand motor acts (to press vs to grasp). The orientation of the arrow indicated the direction of the movement participants had to execute using their right (experiment 1) or left (experiment 2) hand on the device attached to their chest (Fig. 2b), whereas the color indicated the type of motor act (red, to press; blue, to grasp).
Figure 2.
Setup. a, Example sequence of two trials (direction of the arrow, 45°). b, Participants laid in the scanner with the index finger on the center of a device attached to their chest and executed a reaching movement on the device in the direction indicated by the arrow on the screen. The straight arrow illustrates the direction of the movement to be performed on the device (in this example, 45°; arrow on the device not shown during the experiment). In experiment 1, participants used their right hand, and in experiment 2, participants used their left hand. c, On the schematic device, the full set of test directions is shown for adaptation direction 45°, indicated by the straight arrow. On each target half-sphere, the angular difference between adaptation and test direction and the corresponding label are indicated. The broken arrow indicates adaptation direction 225°, used in separate blocks.
Within the same scanning run, the same movement direction was repeated in sequences of one to eight adaptation trials. After each sequence of adaptation trials, a test trial was presented. During test trials, we parametrically varied the angular difference between adaptation and test directions, as indicated by the direction of the arrow: 0° (“same”), ±45° (“small”), ±90° (“medium”), and ±135° (“large”) (Fig. 2c). In separate scanning runs, we used two different adaptation directions (45° or 225°) (illustrated by the straight and broken arrows in Fig. 2c).
The device consisted of half-spheres of polystyrene on a black plastic surface (20 × 20 cm). They were placed at eight equidistant positions on an invisible circle (8 cm radius) as well as at the center of the circle.
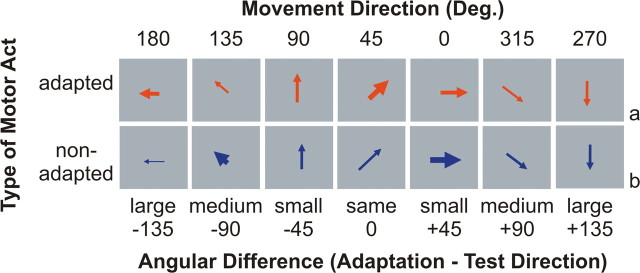
During adaptation trials, participants were adapted to the motor act “to press.” On half of all test trials, participants were asked to perform the motor act “to press” (adapted motor act test trials) (Fig. 3a), whereas on the other half of all test trials, they were asked to execute the motor act “to grasp” (non-adapted motor act test trials) (Fig. 3b). The two motor acts only differed in the final part of the movement. In both cases, participants reached from the starting position at the center of the device to the target position as indicated by the arrow on the screen. For the motor act “to press,” they were asked to touch the center of the target with their index finger as if they were pressing a button. For the motor act “to grasp,” they were asked to grasp the target with a whole-hand grasp. At the end of each trial, they released the target and returned to the central starting position.
Figure 3.
Design. a, Adapted motor act test trials differed from adaptation trials with respect to movement direction only. b, Non-adapted motor act test trials differed from adaptation trials with respect to movement direction and the type of motor act.
To ensure that the pattern of adaptation was specific to the movement direction and not attributable to the repetition of low-level perceptual features, we varied the visual appearance of the arrow that indicated the movement direction and the type of motor act on each trial. Arrow width and length was varied randomly from 0.41° to 1.22° in steps of 0.41°. The x- and y- center coordinates of the arrow were jittered in a range of ±0.07° in steps of 0.035°.
Stimuli were backprojected onto a screen by a liquid crystal projector at a frame rate of 60 Hz and a screen resolution of 1280 × 1024 pixels (mean luminance, 109 cd/m2). Participants viewed the stimuli binocularly through a mirror above the head coil. The screen was visible as a rectangular aperture of 17.5 × 14.3°.
Visual stimulation was programmed with in-house software (ASF, available from jens.schwarzbach@unitn.it), based on the MATLAB Psychtoolbox-3 for Windows (Brainard, 1997).
Instructions and training
Training was performed outside the scanner. Participants sat in front of the computer that showed the visual instruction, with the device positioned on their chest similar to the setup inside the scanner. The experimenter explicitly asked participants to execute every motor act within a constant time window of 2 s corresponding to the presentation time of the arrow rather than trying to move as fast as possible and thus risking head movements. Participants were asked to move their hand back to the center position before the arrow disappeared and to start each trial from the center position.
Training consisted of several stages. At the beginning, the experimenter informed the participants that neither hand nor the device was visible to them inside the scanner. Therefore, they were allowed to get familiar with the spatial dimensions of the device and to practice the movements while looking directly at their hand and their device. Once they felt comfortable performing the task, they were asked to perform the movements without looking at the hands or the device. Training was finished once participants were able to perform the task correctly without visual feedback.
fMRI adaptation design
Both experiments 1 and 2 consisted of 12 event-related fMRI adaptation runs. Each run consisted of 88 trials (72 adaptation trials plus 16 test trials) and lasted 5.4 min.
In each run, each combination of angular difference between adaptation and test trial (±45°, ±90°, ±135°) and type of motor act test trial (adapted, non-adapted) was repeated once. Because we intended to collapse across test directions to the left (−) and right (+) of the adaptation direction in the analysis, we had two repetitions for angular differences 45°, 90°, and 135°. To have the same number of repetition for each test direction, test trials that contained no change in movement direction (angular difference 0°, same) were repeated twice per run for both types of motor act. Thus, there were 16 test trials in total per run.
There were one to eight adaptation trials between two successive test trials, resulting in eight different adaptation intervals. Each interval was repeated twice, resulting in 72 adaptation trials per run. The number of adaptation trials between two successive test trials was randomly assigned to each condition.
To minimize fatigue of muscles related to the task, breaks of 20 s were inserted after half a block (i.e., after 2.2 min). Trials in both the first and the second half of each run consisted of eight test trials each following one of the randomly distributed eight adaptation intervals giving a total of 44 trials (36 adaptation trials plus eight test trials).
Data acquisition
We acquired fMRI data using a 4 T Bruker MedSpec Biospin MR scanner and an eight-channel birdcage head coil. Functional images were acquired with a T2*-weighted gradient-recalled echo-planar imaging (EPI) sequence. Before each functional scan, we performed an additional scan to measure the point-spread function (PSF) of the acquired sequence, which serves for correction of the distortion expected with high-field imaging (Zaitsev et al., 2004). We used 34 slices, acquired in ascending interleaved order, slightly tilted to run parallel to the calcarine sulcus [time to repeat (TR), 2000 ms; voxel resolution, 3 × 3 × 3 mm; echo time, 33 ms; flip angle (FA), 73°; field of view (FOV), 192 × 192 mm; gap size, 0.45 mm]. Each participant completed 12 scans of 162 volumes each.
To be able to coregister the low-resolution functional images to a high-resolution anatomical scan, we acquired a T1-weighted anatomical scan (magnetization-prepared rapid-acquisition gradient echo; voxel resolution, 1 × 1 × 1 mm; FOV, 256 × 224 mm; generalized autocalibrating partially parallel acquisitions with an acceleration factor of 2; TR, 2700 ms; inversion time, 1020 ms; FA, 7°).
Data analysis
Data analysis was performed using BrainVoyager QX 2.1 (Brain Innovation) and custom software written in MATLAB (MathWorks). In experiment 1, participant 13 was excluded from the analysis because of several abrupt head movements, as was evident from the first derivative of the three-dimensional (3D) motion correction parameters.
Preprocessing, segmentation, and flattening.
To correct for distortions in geometry and intensity in the echo-planar images, we applied distortion correction on the basis of the PSF data acquired before each EPI scan (Zeng and Constable, 2002). Before additional analysis, we removed the first four volumes to avoid T1 saturation. Next, we performed 3D motion correction with trilinear interpolation using the first volume as reference, followed by slice timing correction with ascending interleaved order. Functional data were temporally high-pass filtered using a cutoff frequency of three cycles per run. We applied spatial smoothing with a Gaussian kernel of 8 mm full-width at half-maximum. Next, we aligned the first volume of each run to the high-resolution anatomy. Both functional and anatomical data were transformed into Talairach space using trilinear interpolation.
Definition of regions of interest.
We ran a random effects (RFX) general linear model (GLM) analysis, including the factors adaptation direction (45°, 225°), angular difference between adaptation and test direction (0°, ±45°, ±90°, ±135°), and type of motor act (adapted, non-adapted). Each predictor time course was convolved with a dual-gamma hemodynamic impulse response function (Friston et al., 1998). The resulting reference time courses were used to fit the signal time course of each voxel. We also included the first and second derivatives of each predictor time course to be able to model shift and dispersion of the hemodynamic impulse response function, respectively. Furthermore, parameters from 3D motion correction were included in the model as predictors of no interest. To avoid selection of regions of interest (ROIs) biased in favor of our hypothesis on movement selectivity (Kriegeskorte et al., 2009), we functionally selected our ROIs by computing the following contrasts: (1) adaptation trials versus baseline, to identify motor areas active during the adaptation trials, and (2) test trials “same direction, adapted” versus all remaining test trials, to identify areas sensitive to a change in movement direction or the type of motor act. Statistical maps were Bonferroni's corrected (p < 0.05) for multiple comparisons.
Statistical analysis.
To quantify the effect of the angular difference between adaptation and test directions as well as the effect of type of motor act, we extracted z-transformed β estimates of the BOLD response for each of the seven angular differences between adaptation and test direction, separately for the two adaptation directions and the type of motor act. Next, we computed a 2 (adaptation directions 45° and 225°) × 7 (angular difference between adaptation and test direction: 0°, ±45°, ±90°, ±135°) × 2 (type of motor act: adapted, non-adapted) repeated-measures ANOVA on the extracted β values. Degrees of freedom were adjusted by the Greenhouse–Geisser procedure when Mauchly's tests indicated violation of sphericity, with corrected p values denoted as pGG. We corrected the critical p value for the number of ROIs (p < 0.005 in experiment 1, p < 0.007 in experiment 2).
Results
Experiment 1: right-hand movements
Areas involved during hand reaching movements
Our first aim was to identify regions of interest that were (1) active during adaptation trials (“motor areas”), resulting from the RFX GLM contrast between adaptation versus baseline, and (2) areas that were sensitive to a change in movement direction or the type of motor act (“change areas”), as revealed by the contrast between test trials that differed from adaptation trials and test trials that were identical to adaptation trials.
Figure 4 shows that motor areas (yellow) consist of the left primary motor area and the right cerebellum (not shown in Fig. 4). Note that there appear to be two additional yellow areas in the vicinity of PMd and medial intraparietal sulcus (mIPS), but these are actually part of one larger region, including M1. Change areas (green) include the medial aspect of the left and right posterior parietal cortex [parietal reach region (Connolly et al., 2003)], mIPS and anterior intraparietal sulcus (aIPS), and dorsal premotor cortex.
Figure 4.
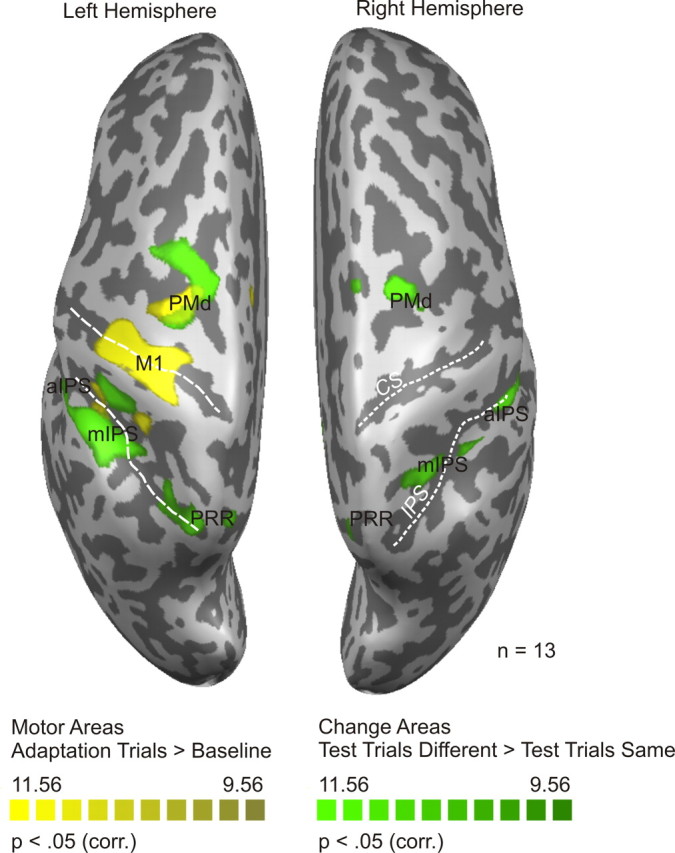
Statistical map of experiment 1. Motor areas and change areas are shown in yellow and green, respectively (for details, see Results). Functional data (Bonferroni's corrected, p < 0.05) are superimposed on the segmented and inflated left and right hemispheres of one of the participants. Motor areas include left M1 and right cerebellum (not shown in the figure). Change areas include left and right PRR, left and right aIPS, left and right mIPS, and left and right PMd. White dotted lines mark the central sulcus (CS) and the intraparietal sulcus (IPS). corr., Corrected.
An overview of the Talairach coordinates of these areas can be found in Table 1.
Table 1.
Talairach coordinates (mean ± SD x, y, z center of mass)
| ROIs | Experiment 1 |
Experiment 2 |
||||
|---|---|---|---|---|---|---|
| x | y | z | x | y | z | |
| M1 LH | −30 ± 6.2 | −23 ± 6.2 | 52 ± 7.8 | |||
| M1 RH | 31 ± 4.0 | −24 ± 3.3 | 53 ± 6.3 | |||
| cer LH | −5 ± 3.1 | −52 ± 4.0 | −19 ± 1.9 | |||
| cer RH | 13 ± 8.2 | −47 ± 5.9 | −22 ± 3.6 | |||
| aIPS LH | −54 ± 4.4 | −24 ± 3.3 | 22 ± 4.9 | −54 ± 5.6 | −28 ± 4.4 | 36 ± 5.8 |
| aIPS RH | 47 ± 4.5 | −27 ± 3.1 | 36 ± 3.8 | 44 ± 5.8 | −31 ± 3.0 | 40 ± 4.4 |
| mIPS LH | −39 ± 7.3 | −35 ± 6.6 | 43 ± 7.6 | |||
| mIPS RH | 27 ± 3.8 | −45 ± 2.8 | 46 ± 4.9 | |||
| PMd LH | −21 ± 4.2 | −9 ± 3.6 | 56 ± 5.0 | −23 ± 4.8 | −13 ± 2.5 | 58 ± 4.0 |
| PMd RH | 20 ± 3.6 | −11 ± 2.7 | 54 ± 3.5 | 23 ± 3.0 | −14 ± 1.6 | 57 ± 3.9 |
| PRR LH | −19 ± 3.8 | −61 ± 3.5 | 51 ± 3.7 | |||
| PRR RH | 11 ± 2.1 | −64 ± 2.1 | 47 ± 3.0 | 13 ± 2.1 | −67 ± 3.4 | 47 ± 2.6 |
cer, Cerebellum; LH, left hemisphere; RH, right hemisphere.
The modulation of the BOLD response by the angular difference between adaptation and test direction
Next we investigated how the BOLD signal is modulated by the angular difference between adaptation and test direction. Specifically, we asked whether the BOLD response follows the pattern depicted in Figure 1b: if the examined region contains populations of neurons that are tuned to hand movement direction, we expected to see the lowest BOLD signal for test directions that are identical with the adaptation direction and an increasing BOLD signal with increasing angles between adaptation and test direction. To this end, we extracted β estimates for z-transformed voxel time courses from the regions of interest shown in Figure 4.
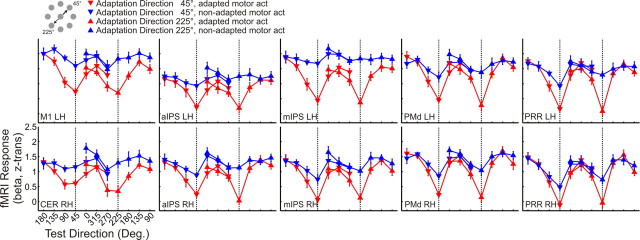
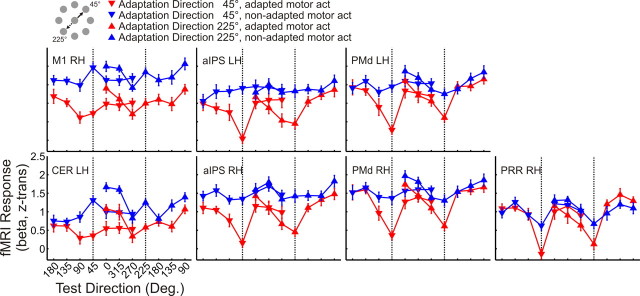
Figure 5 shows the β estimates as a function of the angular difference between adaptation and test direction, separately for the two adaptation directions (45° and 225°, indicated by downward and upward triangles, respectively) and for adapted (red) and non-adapted (blue) motor act test trials. As can be seen, the BOLD response in the left primary motor cortex for adapted motor act test trials (red) follows the pattern expected for areas that contain directionally tuned neuronal populations: the red curve is lowest for the test direction that is identical with the adaptation direction and increases with the angular difference between adaptation and test direction, to both the left and right of the adaptation direction.
Figure 5.
BOLD response (reported as z-transformed β weights) in each ROI in experiment 1. The pattern of the BOLD response in adapted (red curve) and non-adapted (blue curve) motor act test trials is plotted as a function of the test direction, separately for adaptation direction 45° (downward triangles) and 225° (upward triangles). Adaptation directions 45° and 225° are indicated by vertical dotted lines. Data are averaged across individually extracted z-transformed β values from n = 13 participants. Error bars indicate ±SEM. Labels are the same as in Table 1. Deg., Degrees.
Visual inspection of the data in the remaining areas suggests that the BOLD response is modulated by the angular difference between adaptation and test direction also in the remaining regions of interest, indicating directional tuning beyond primary motor cortex.
Our observations are supported by the corresponding statistics. Across regions, the BOLD response was affected by the angular difference between adaptation and test direction (F(6,72) = 27.086, p < 0.0001). However, the strength of directional selectivity differed between regions, as indicated by the interaction between test direction and ROI (F(54,648) = 5.299, p < 0.0001). This observation is further explored below (see Variation of the strength of directional tuning across areas).
The BOLD amplitude did not differ between the two adaptation directions, as indicated by the absence of a main effect of adaptation direction (F(1,12) = 0.606, p = 0.452). We therefore collapsed data across the two adaptation directions in the following analyses. It should be noted, however, that there was an interaction between the type of motor act and adaptation direction (F(1,12) = 4.790, p = 0.049), indicating that the BOLD signal for the two types of motor acts was different for the two adaptation directions. The three-way interaction between adaptation direction, test direction, and ROI (F(54,648) = 2.056, p < 0.0001) suggests that the two adaptation directions were differently modulated by test direction across regions.
Separate ANOVAs computed for each ROI revealed that the effect of test direction as well as the quadratic trend was significant in each single ROI (for details, see Table 2).
Table 2.
Results of ANOVAs on z-transformed β values
| ROIs | Adaptation direction |
Type of motor act |
Test direction |
Quadratic trend |
||||||||||||
|---|---|---|---|---|---|---|---|---|---|---|---|---|---|---|---|---|
| Experiment 1 |
Experiment 2 |
Experiment 1 |
Experiment 2 |
Experiment 1 |
Experiment 2 |
Experiment 1 |
Experiment 2 |
|||||||||
| F(1,12) | p | F | p | F(1,12) | p | F | p | F(6,72) | p | F | p | F(1,12) | p | F | p | |
| M1 LH | 0.712 | 0.415 | 33.687 | <0.0001 | 15.431 | <0.0001 | 56.360 | <0.0001 | ||||||||
| M1 RH | 10.327 | 0.007 | 126.069 | <0.0001 | 6.819 | <0.0001 | 13.786 | 0.003 | ||||||||
| cer LH | 15.216 | 0.002 | 108.976 | <0.0001 | 8.079 | <0.0001 | 28.885 | <0.0001 | ||||||||
| cer RH | 1.373 | 0.264 | 50.921 | <0.0001 | 12.540 | <0.0001 | 25.997 | <0.0001 | ||||||||
| aIPS LH | 0.868 | 0.370 | 0.653 | 0.435 | 53.213 | <0.0001 | 126.884 | <0.0001 | 8.896 | <0.0001 | 9.698 | <0.0001 | 17.915 | 0.001 | 15.136 | 0.002 |
| aIPS RH | 1.956 | 0.187 | 2.611 | 0.132 | 29.005 | <0.0001 | 61.611 | <0.0001 | 20.474 | <0.0001 | 19.511 | <0.0001 | 46.118 | <0.0001 | 35.859 | <0.0001 |
| mIPS LH | 0.004 | 0.950 | 45.887 | <0.0001 | 16.596 | <0.0001 | 51.293 | <0.0001 | ||||||||
| mIPS RH | 2.546 | 0.137 | 35.419 | <0.0001 | 19.451 | <0.0001 | 29.118 | <0.0001 | ||||||||
| PMd LH | 0.372 | 0.553 | 2.126 | 0.170 | 10.535 | 0.007 | 47.372 | <0.0001 | 22.907 | <0.0001 | 21.069 | <0.0001 | 46.757 | <0.0001 | 69.324 | <0.0001 |
| PMd RH | 0.652 | 0.435 | 5.914 | 0.032 | 15.178 | 0.002 | 30.761 | <0.0001 | 26.986 | <0.0001 | 21.664 | <0.0001 | 26.570 | <0.0001 | 47.209 | <0.0001 |
| PRR LH | 0.001 | 0.977 | 14.128 | 0.003 | 28.701 | <0.0001 | 57.590 | <0.0001 | ||||||||
| PRR RH | 0.802 | 0.388 | 1.001 | 0.337 | 7.697 | 0.017 | 9.085 | 0.011 | 28.299 | <0.0001 | 20.942 | <0.0001 | 34.849 | <0.0001 | 99.048 | <0.0001 |
| ROIs | Adaptation direction × type of motor act |
Adaptation direction × test direction |
Type of motor act × test direction |
Adaptation direction × type of motor act × test direction |
||||||||||||
|---|---|---|---|---|---|---|---|---|---|---|---|---|---|---|---|---|
| Experiment 1 |
Experiment 2 |
Experiment 1 |
Experiment 2 |
Experiment 1 |
Experiment 2 |
Experiment 1 |
Experiment 2 |
|||||||||
| F(1,12) | p | F | p | F(6,72) | p | F | p | F(6,72) | p | F | p | F(6,72) | p | F | p | |
| M1 LH | 1.694 | 0.218 | 2.465 | 0.073 | 4.536 | 0.001 | 0.794 | 0.578 | ||||||||
| M1 RH | 0.074 | 0.790 | 1.189 | 0.322 | 1.790 | 0.113 | 0.619 | 0.715 | ||||||||
| cer LH | 0.187 | 0.673 | 4.595 | 0.001 | 1.602 | 0.159 | 2.059 | 0.069 | ||||||||
| cer RH | 17.016 | 0.001 | 0.941 | 0.471 | 3.291 | 0.006 | 0.605 | 0.725 | ||||||||
| aIPS LH | 3.058 | 0.106 | 1.823 | 0.202 | 0.544 | 0.773 | 0.901 | 0.499 | 3.207 | 0.008 | 8.003 | <0.0001 | 0.555 | 0.765 | 1.210 | 0.311 |
| aIPS RH | 0.379 | 0.550 | 2.406 | 0.147 | 0.648 | 0.691 | 1.680 | 0.138 | 4.208 | 0.001 | 5.921 | <0.0001 | 1.420 | 0.219 | 1.043 | 0.405 |
| mIPS LH | 1.697 | 0.217 | 0.247 | 0.959 | 7.728 | <0.0001 | 1.531 | 0.180 | ||||||||
| mIPS RH | 3.512 | 0.085 | 0.374 | 0.893 | 3.075 | 0.010 | 0.722 | 0.633 | ||||||||
| PMd LH | 3.633 | 0.081 | 1.071 | 0.321 | 0.506 | 0.802 | 1.481 | 0.197 | 6.620 | <0.0001 | 4.984 | <0.0001 | 1.251 | 0.291 | 1.416 | 0.220 |
| PMd RH | 4.158 | 0.064 | 0.949 | 0.349 | 0.815 | 0.562 | 0.882 | 0.513 | 4.306 | 0.001 | 4.191 | 0.001 | 0.739 | 0.620 | 0.970 | 0.452 |
| PRR LH | 3.606 | 0.082 | 0.493 | 0.812 | 8.601 | <0.0001 | 0.875 | 0.518 | ||||||||
| PRR RH | 1.305 | 0.276 | 0.322 | 0.581 | 1.706 | 0.132 | 4.314 | 0.491 | 4.551 | 0.001 | 4.314 | 0.001 | 0.507 | 0.801 | 1.973 | 0.081 |
Critical p values were corrected with respect to the number of ROIs (pcorrected experiment 1: 0.05/10 = 0.005; pcorrected experiment 2: 0.05/7 = 0.007). Same labels as in Table 1.
Variation of the strength of directional tuning across areas
Figure 5 suggests that the increase of the BOLD signal as a function of the angular difference between adaptation and test direction becomes steeper from left M1, and right cerebellum, through bilateral aIPS and mIPS, to bilateral PMd, and bilateral PRR. In line with this view, our previous analyses revealed a significant interaction between the effect of test direction and ROI.
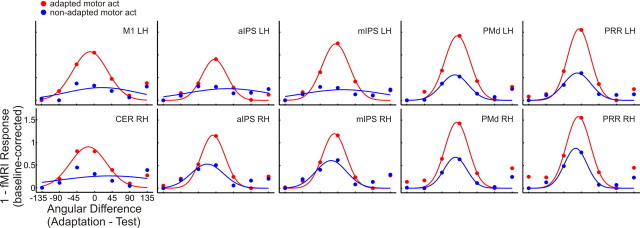
To further explore this effect, we transformed the β weights extracted from each ROI by subtracting each β weight from 1. The purpose of this transformation was to use a visualization that is similar to the tuning functions known in monkey physiology. Furthermore, we shifted the baseline of the resulting curves to zero, separately for the two adaptation directions and the type of motor acts. Next, we fitted a Gaussian function of the form f(x) = to the resulting values (Fig. 6), where x is the angular difference between adaptation and test direction, A is the amplitude, μ is the mean, and σ is the half-width of the estimated tuning curve. Because individual data in some of the regions were too noisy for Gaussian fitting, we collapsed data across participants for this analysis, so this analysis serves mainly a visualization function.
Figure 6.
Gaussian function fitted to β weights extracted from ROIs in experiment 1. A Gaussian function has been fitted to the data shown in Figure 5 after collapsing over the two adaptation directions, transforming the resulting values (1 − x) and shifting the baseline to zero. Labels are the same as in Table 1.
Figure 6 clearly shows that tuning curves for adapted motor act test trials (red) become sharper from left M1 and right cerebellum, over bilateral aIPS and mIPS, to bilateral PMd and PRR, suggesting that the strength of directional tuning increases from M1 to PRR. Tuning curves for non-adapted motor act test trials (blue) are flatter in all regions but still show some directional tuning in most of the regions in the right hemisphere (aIPS, mIPS, PMd, and PRR) left PMd, and PRR. In contrast, tuning curves for non-adapted motor act test trials are essentially flat in the remaining regions of the left hemisphere (M1, aIPS, and mIPS), indicating that in these regions directional tuning is weak for the non-adapted motor act.
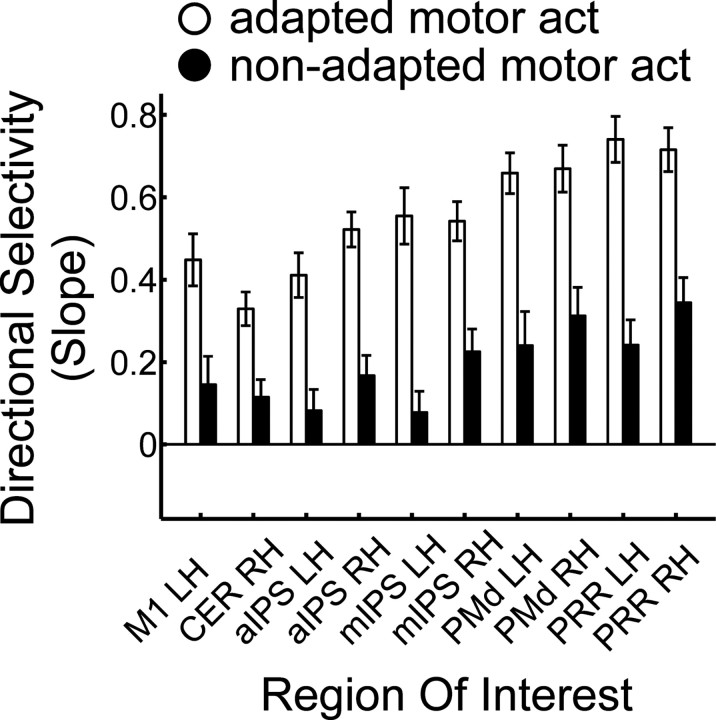
To quantify the variation of directional selectivity across areas, we collapsed over both adaptation directions (45°, 225°) as well as over left (−45°, −90°, −135°) and right (+45°, +90°, +135°) test directions, separately for each area and each participant. Next, we estimated the slope of the BOLD amplitude, as quantified by the z-transformed β weights extracted from each single ROI, as a function of the angular difference between adaptation and test direction. We reasoned that, just as the width of the tuning function in electrophysiology relates to the strength of selectivity, the slope of the BOLD amplitude should relate to the strength of directional selectivity in our adaptation design. We restricted the slope estimation to angular differences of 0°, 45°, and 90° because the 135° condition led to a lower BOLD amplitude than the 90° condition in most areas (Fig. 5). Figure 7 shows that directional selectivity for the adapted motor act (white bars) clearly differs between ROIs: the slope increases from left M1 and right cerebellum, to bilateral aIPS and mIPS, and reaches the highest values in bilateral PMd and PRR.
Figure 7.
Strength of directional selectivity in ROIs in experiment 1. The slope of the β estimates is measured for test directions 0°, 45°, and 90°, collapsed over both adaptation directions and left (−45°, −90°) and right (+45°, +90°) test directions. White and black bars indicate adapted and non-adapted motor act test trials, respectively. Error bars indicate ±SEM. Labels are the same as in Table 1.
These observations were confirmed by a two-factorial repeated-measures ANOVA on the slope of the BOLD response, with ROI (10 levels) and type of motor act (2 levels) as factors. The strength of directional selectivity differed significantly between regions, as indicated by the main effect of ROI (F(9,108) = 18.517, pGG < 0.0001). A significant linear trend (F(1,12) = 34.461, p < 0.0001) supported the observation of a gradient of directional selectivity from left M1 and right cerebellum throughout anterior and medial intraparietal cortex to PMd and PRR. The strength of directional selectivity differed between adapted and non-adapted motor act test trials, as indicated by the main effect of motor act (F(1,12) = 22.949, p < 0.0001). Moreover, the modulation of directional selectivity by the type of motor act differed between ROIs (interaction of type of motor act × ROI: F(9,108) = 5.750, pGG = 0.001).
Modulation of the BOLD response by the type of motor act
Next we asked how directional selectivity is modulated by a change in the type of motor act. To this aim, we compared the extracted β values for adapted and non-adapted motor act test trials. Figures 5–7 show that all areas are sensitive to the type of motor act. This effect, however, is not simply additive: whereas the red curves (Figs. 5, 6) and the white bars (Fig. 7), depicting adapted motor act test trials, reveal clear directional selectivity in all areas, the blue curves (Figs. 5, 6) and the black bars (Fig. 7), showing non-adapted motor act test trials, show a much weaker (if any) modulation by test direction. This interaction between the effect of test direction and the type of motor act differs between areas: in left M1 and the right cerebellum, the blue curve is essentially flat, indicating that there is no sensitivity to test direction for the non-adapted type of motor act. In contrast, right PMd and PRR show a substantial modulation by movement direction also for the non-adapted type of motor act, suggesting that these areas contain neurons that are sensitive to both types of motor acts.
Statistical analyses supported these observations: directional selectivity differed between the adapted and the non-adapted motor act, as revealed by the interaction between test direction and type of motor act (F(6,72) = 6.177, p < 0.0001). This modulation differed between ROIs, as suggested by the interaction of test direction × type of motor act × ROI (F(54,648) = 1.647, p = 0.003). Moreover, across regions, there was a significant main effect of the type of motor act (F(1,12) = 32.549, p < 0.0001), and this sensitivity differed between ROIs (type of motor act × ROI: F(9,108) = 14.693, p < 0.0001). To further explore these interactions, we examined the effect of the type of motor act and the interaction between angular difference between adaptation and test direction and type of motor act separately in each ROI (for details, see Table 2). This analysis supported the observation that directional selectivity in all areas differs between adapted and non-adapted motor acts, as indicated by the interaction between test direction and type of motor act.
The effect of hemisphere on directional tuning
Figures 6 and 7 suggest that directional tuning measured for the non-adapted motor act test trials (Figs. 6, blue curves; 7, black bars) is stronger in the right compared with the left hemisphere. To further examine this effect, we computed an additional ANOVA on the slope of the BOLD response with the factors hemisphere (2 levels), ROI (4 levels), and type of motor act (2 levels) in those ROIs defined in both hemispheres (i.e., aIPS, mIPS, PMd, and PRR) (for an overview of the results, see supplemental Table 1, available at www.jneurosci.org as supplemental material). In support of our observations, directional selectivity as measured by the slope of the BOLD response differed between the two hemispheres (main effect of hemisphere: F(1,12) = 9.458, p = 0.01) and between ROIs (main effect of ROI: F(3,36) = 19.307, pGG < 0.0001). The effect of hemisphere on the slope of the BOLD response was modulated by the type of motor act (interaction of hemisphere × type of motor act: F(1,12) = 9.173, p = 0.01). Furthermore, the interaction between type of motor act and hemisphere differed between areas (interaction of type of motor act × hemisphere × ROI: F(3,36) = 5.240, p = 0.004). Paired t tests revealed that the strength of directional tuning for non-adapted motor act test trials was higher in the right than in the left hemisphere in aIPS (t(11) = −2.597, p = 0.023), mIPS (t(11) = −4.142, p = 0.001), PMd (t(11) = −2.483, p = 0.029), and PRR (t(11) = −3.204, p = 0.008).
Experiment 2: left-hand movements
Areas involved during hand reaching movements
First we identified (1) regions of interest that were active during adaptation trials (motor areas) and (2) areas that were sensitive to a change in movement direction or the type of motor act (change areas). Figure 8 shows the results of the RFX GLM contrasts computed to identify these two types of areas.
Figure 8.
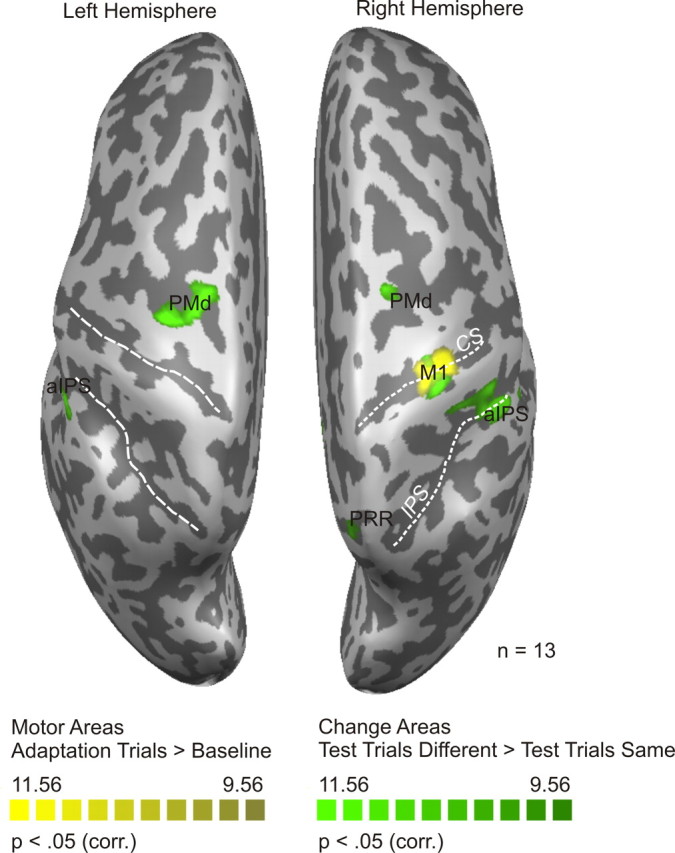
Statistical map of experiment 2. Statistical maps (Bonferroni's corrected, p < 0.05) are superimposed on the segmented and inflated left and right hemispheres of one of the participants (same color code as in Fig. 4). Motor areas include right M1 and left cerebellum (not shown in the figure). Change areas include right PRR RH, left and right aIPS, and left and right PMd. CS, Central sulcus; IPS, intraparietal sulcus; corr., corrected.
Similar to the results obtained in experiment 1, we identified multiple regions sensitive to hand movement direction. Motor areas (yellow) were right M1 and left cerebellum (not shown in Fig. 8). Change areas (green) were bilateral PMd and aIPS, and right PRR. An overview of the Talairach coordinates of these areas can be found in Table 1. In contrast to experiment 1, we did not identify bilateral mIPS and left PRR in experiment 2, probably because of an overall weaker activation during the execution of movements with the nondominant hand (Fig. 8) compared with movements performed with the dominant hand (Fig. 4) (Dassonville et al., 1997).
The modulation of the BOLD response by the angular difference between adaptation and test direction
Next, we examined how the BOLD signal is modulated by the angular difference between adaptation and test direction. Figure 9 shows the β estimates in each ROI, separately for the two types of motor act test trials and for the two adaptation directions. Visual inspection indicates that all areas show directional selectivity during adapted motor act test trials (red curves). Directional selectivity is modest only in left M1 and the right cerebellum and becomes more pronounced in left and right aIPS, PMd, and right PRR.
Figure 9.
BOLD response (reported as z-transformed β weights) in each ROI in experiment 2. The pattern of the BOLD response in adapted (red) and non-adapted (blue) motor act test trials is plotted as a function of the test direction. Adaptation directions 45° and 225° are indicated by vertical dotted lines. Data are averaged across individually extracted z-transformed β values from n = 13 participants. Error bars indicate ±SEM. Labels are the same as in Table 1. Deg., Degrees.
All regions showed directional selectivity (main effect of test direction: F(6,72) = 16.068, < 0.0001), and the strength of this effect differed between regions (test direction × ROI: F(36,432) = 10.565, p < 0.0001).
As in experiment 1, we computed separate repeated-measures ANOVAs for each ROI (Table 2). Similar to the results in experiment 1, both our motor and change areas showed directional selectivity, as indicated by a main effect of test direction in each single area.
The two adaptation directions showed the same general pattern, as indicated by the absence of a main effect of adaptation direction (F(1,12) = 4.415, p = 0.057). However, this pattern differed between regions, as revealed by the interaction between ROI and adaptation direction (F(6,72) = 2.485, p = 0.031). Moreover, the effect of adaptation direction on directional selectivity differed between regions, as indicated by the three-way interaction between adaptation direction, test direction, and ROI (F(36,432) = 1.893, p = 0.002).
Variation of the strength of directional tuning across areas
To compare the strength of directional tuning between areas, we investigated the width of the tuning functions and the slope of the increase of the BOLD response with increasing angular difference between adaptation and test direction in each ROI, similar to the procedures described in Results for experiment 1.
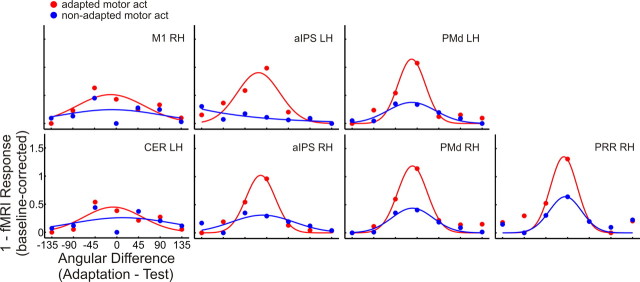
Figure 10 shows the inverted and baseline-corrected β values from each ROI, fitted by a Gaussian function. Similar to experiment 1, we can notice that directional tuning curves measured during adapted motor act test trials (red) become sharper from right M1 and left cerebellum, over bilateral aIPS, to bilateral PMd and right PRR. Directional tuning curves measured during non-adapted motor act test trials are essentially flat in right M1 as well as the left cerebellum and aIPS, whereas they tend to become more narrow from right aIPS over left and right PMd to right PRR.
Figure 10.
Gaussian function fitted to β weights extracted from ROIs in experiment 2. A Gaussian function has been fitted to the data shown in Figure 9 after collapsing over the two adaptation directions, inverting the resulting values and shifting the baseline to zero. Labels are the same as in Table 1.
Next, we quantified the strength of directional tuning by examining the slope of the BOLD amplitude as a function of type of motor act and ROI. As can be seen in Figure 11, directional selectivity measured during adapted motor act test trials (white bars) differed between ROIs, with low directional selectivity in left M1 and right cerebellum, intermediate directional selectivity in left and right aIPS and PMd, and highest directional selectivity in right PRR. During non-adapted motor act test trials (black bars), directional selectivity was substantially weaker but showed a similar trend as during adapted motor act test trials.
Figure 11.
Strength of directional selectivity in ROIs in experiment 2. The slope of the β estimates is measured for test directions 0°, 45°, and 90° (collapsed over both adaptation directions and left and right test directions). Labels are the same as in Table 1.
These observations are supported by the corresponding two-factorial (ROI × type of motor act) repeated-measures ANOVA on the slope of the BOLD response. Directional selectivity differed between ROIs (F(6,72) = 43.507, p < 0.0001). A significant linear trend (F(1,12) = 167.667, p < 0.0001) supported the observation of a gradient of directional selectivity from right M1 and left cerebellum throughout anterior intraparietal cortex to PMd and PRR. The slope of the BOLD response was significantly lower for non-adapted compared with adapted motor acts, as indicated by the main effect of the type of motor act (F(1,12) = 20.592, p = 0.001). Furthermore, the modulation of the slope of the BOLD effect by the type of motor act differed between ROIs (interaction of ROI × type of motor act: F(6,72) = 2.958, p = 0.012).
Modulation of the BOLD response by the type of motor act
Next, we explored how the BOLD response is affected by the type of motor act. As can be seen in Figures 9–11, directional selectivity in all examined regions was modulated by the type of motor act, as indicated by the difference between the red and the blue curves (Figs. 9, 10) and the white and black bars (Fig. 11). Across regions, directional selectivity was stronger for adapted compared with non-adapted motor act test trials. This interaction differed between areas. The blue curve in Figure 9, depicting the BOLD response during non-adapted motor act test trials, shows almost no modulation by test direction in left aIPS. In right aIPS as well as left and right PMd, the modulation of the BOLD response by test direction during non-adapted motor act test trials is modest, whereas the modulation in right PRR is clearly pronounced. Interestingly, the blue curves in M1 and the cerebellum show an increased BOLD response during test trials that are identical to the adaptation direction, an observation for which we have no explanation.
In support of these observations, movement direction selectivity was affected by the type of motor act (test direction × type of motor act: F(6,72) = 5.507, p < 0.0001), and this modulation differed between ROIs (test direction × type of motor act × ROI: F(36,432) = 1.476, p = 0.041). Moreover, all regions also showed a sensitivity for the type of motor act (F(1,12) = 130.811, p < 0.0001), and this effect differed between ROIs (motor act × ROI: F(6,72) = 19.881, p < 0.0001).
Separate ANOVAs in each single ROI (for details, see Table 2) revealed that the interaction between test direction and type of motor act was significant in all regions, except in right M1 and left cerebellum.
The effect of hemisphere on directional tuning
To evaluate whether the effect of the type of motor act on directional selectivity differs between the two hemispheres, we computed an additional repeated-measures ANOVA on the slope of the BOLD response in those regions identified in both hemispheres using the factors hemisphere (left, right), ROI (aIPS, PMd), and type of motor act (adapted, non-adapted) (for a summary of the results, see supplemental Table 1, available at www.jneurosci.org as supplemental material).
The strength of directional selectivity as measured by the slope of the BOLD response differed between the two hemispheres (F(1,12) = 12.797, p = 0.004) and between ROIs (F(1,12) = 5.810, p = 0.033). The interaction between type of motor act × ROI × hemisphere is marginally significant (F(1,12) = 4.177, p = 0.064), indicating that the right hemisphere tends to show stronger directional selectivity than the left hemisphere for non-adapted motor act test trials. Pairwise comparisons revealed that this is the case only for aIPS (t(12) = −3.331, p = 0.006). In contrast to experiment 1, PMd did not show an hemispheric difference (t(12) = −1.670, p = 0.121).
Given that the interaction between type of motor act × ROI × hemisphere is only marginally significant (p = 0.064), one should not draw too firm conclusions from experiment 2 alone. However, experiment 1 showed the same interaction (p = 0.004) with a different subset of participants, suggesting that there may be stronger directional selectivity measured during non-adapted motor act test trials in the right compared with the left hemisphere for movements performed with both the right and the left hand.
Discussion
Tuning for hand movement direction in the human brain
Macaque primary motor cortex contains neurons that are tuned to movement direction. Similar properties have been reported to exist in the human primary motor cortex using invasive single-cell recordings in paralyzed patients (Hochberg et al., 2006; Truccolo et al., 2008) as well as multivariate pattern analysis (Eisenberg et al., 2010). However, little is known about directional tuning in the human brain beyond these areas. Such information would be highly relevant for the development of brain–computer interfaces because it is unclear which area in the brain is best suited for these applications.
Here we asked which areas of the human brain are tuned to hand movement direction and what characterizes their responses. In two experiments, we adapted participants to hand movement directions performed with the right (experiment 1) or the left (experiment 2) hand and measured the release from adaptation as a function of the angular difference between adaptation and test direction. We observed that neuronal populations in M1, the cerebellum, PMd, aIPS, mIPS, and PRR are tuned to hand movement direction. These findings are in line with reports on directional tuning in monkey M1 (Georgopoulos et al., 1982), cerebellum (Fortier et al., 1989), dorsal (Caminiti et al., 1991) and ventral premotor (Kakei et al., 2001) cortex, and areas 2 and 5 of the parietal cortex (Kalaska et al., 1983).
Directional tuning in all identified areas was modulated by the type of motor act, with strongest sensitivity to the type of motor act in M1 and lowest sensitivity in the PRR. Furthermore, we observed a gradient of directional selectivity, with lowest directional selectivity in M1 and the cerebellum and highest directional selectivity in the right PRR, regardless of whether the left or right hand was used. Finally, we observed that directional tuning for the non-adapted motor act tended to be stronger in the right compared with the left hemisphere for both left and right-hand movements. Together, these results suggest that the strongest directional selectivity and the highest level of abstractness can be found in the right parietal reach region (Gourtzelidis et al., 2005). In this context, an “abstract” level may be defined as a level of processing before information about the effector is specified, e.g., in the form of a motor program. We assume that the lowest level of abstractness can be found in areas such as M1, in which actions are likely to be coded at the level of parameters such as muscle activation and joint angles.
Modulation of the BOLD response by the type of motor act
Directional selectivity was high for adapted motor act test trials and weak for the non-adapted motor act test trials in M1, the cerebellum, and aIPS, suggesting that these regions contain separate populations of directionally selective neurons specific for the type of motor act (Fig. 12a). In contrast, directional selectivity was high for both types of motor acts in PMd and in right PRR, suggesting that in these areas neurons are sensitive for both types of motor acts and that adaptation for one motor act leads to adaptation for the other motor act (Fig. 12b).
Figure 12.
Different patterns of adaptation and the assumed underlying physiology. a, Directional selectivity, as measured by a release from adaptation that is proportional to the angular difference between adaptation and test direction, for the adapted motor act (red curve), and no directional selectivity for the non-adapted motor act (blue curve) indicates that the neural response is selective for the direction of the adapted motor act, suggesting that this region contains populations of directionally selective neurons specific for the type of motor act. b, Directional selectivity both for adapted and non-adapted motor act test trials suggests that this region contains populations of directionally selective neurons sensitive to both types of motor act.
Which aspects of an action are coded in those areas that show a strong modulation by the type of motor act? The motor acts “press” and “grasp” share common reaching components but differ in the way in which the hand interacts with the object. For the motor act “press,” participants have to stretch out the index finger toward the center of the target, leading to tactile stimulation of the index finger. This requires a precise coordination of the index finger toward a specific spatial location. In contrast, for the motor act “grasp,” participants have to rotate and shape the entire hand according to the outer shape of the target, giving rise to tactile stimulation of all fingers.
Any of these behavioral aspects are likely to be involved in the modulation of directional tuning by the type of motor act. In line with this view, neurons in monkey aIPS are involved in tactile exploration of an object (Grefkes et al., 2002). Likewise, neurons in monkey aIPS and M1 are sensitive to the shape of the handgrip (Murata et al., 2000; Graziano, 2006), and neurons within the intermediate cerebellum have been reported to be more active during grasping compared with reaching (Gibson et al., 1994).
Hemispheric asymmetries in directional tuning
Our results revealed strongest directional tuning in the right PRR, for movements of both the left and the right hand, suggesting that this region represents movement direction regardless of the side of the effector. In support of this view, Chang et al. (2008) reported a continuum of limb-dependent and limb-independent neurons in monkey PRR.
In both experiments, directional selectivity tended to be stronger in the right compared with left aIPS for the non-adapted motor act, for movements of both the left and the right hand. This observation is compatible with the view that the left and right aIPS might code different levels of a motor act: whereas the left aIPS might contain separate neuronal populations for different types of motor acts, the right aIPS might contain neuronal populations that are sensitive to several types of motor acts.
Relation between BOLD adaptation and underlying neuronal selectivity
Our data show that it is possible to derive directional information in humans not only from invasive multiunit recordings (Hochberg et al., 2006; Truccolo et al., 2008) but also noninvasively from hemodynamic measures, using fMRI adaptation (see also Eisenberg et al., 2010). Tuning functions in humans have been used to investigate neuronal selectivity in several different domains, e.g., motion direction (Busse et al., 2008), numerical knowledge (Piazza et al., 2004), and face perception (Martini et al., 2006). However, care needs to be taken when directly comparing tuning functions as measured with fMRI adaptation with tuning functions from spiking activity, because fMRI adaptation can overestimate neuronal selectivity (Sawamura et al., 2006). Note, however, that we do not claim to be able to make such a direct comparison. Instead, we are comparing how directional tuning functions as measured with fMRI adaptation are affected by the type of motor act and how this interaction differs between regions.
The role of attention in fMRI adaptation
It is sometimes argued that neuronal selectivity measured with fMRI adaptation in fact reflects attentional effects (Mur et al., 2010), e.g., attributable to a general change in movement direction. If so, we would expect a similar recovery of the BOLD signal for all test directions except same direction, adapted motor act test trials. Instead, we measured a recovery proportional to the angular difference between adaptation and test direction. Such a parametric modulation of the BOLD signal is hard to reconcile with an unspecific attentional mechanism that is insensitive to movement direction.
The role of spatial orienting
It could be argued that our finding in parietal areas could as well be explained by sensitivity to attentional orienting toward the target location, instead of selectivity for the direction of the movement, given that parietal cortex is known to be involved in spatial orienting (Colby and Goldberg, 1999; Corbetta and Shulman, 2002; Yantis et al., 2002). Because attentional orienting was required to perform the task, we cannot exclude the possibility that our data were modulated by this process. However, one would expect that in areas that are dominated by attentional orienting (i.e., at a stage before spatial information is transformed into the appropriate motor program), there should be an effect of movement direction but no difference between the two motor acts. The fact that we found a strong modulation of directional tuning by the type of motor act in PRR, aIPS, and mIPS indicates that these areas are involved in the preparation of the motor act and not just in attentional orienting, in line with previous studies (Kalaska et al., 1997; Murata et al., 2000; Andersen and Buneo, 2002; Connolly et al., 2003; Quian Quiroga et al., 2006).
Conclusions
We have reported evidence for directional selectivity in multiple areas of the human visuomotor system. We show that the extent of directionally selective regions includes areas beyond M1, with a gradient of directional selectivity that increases from the primary motor cortex and the cerebellum through dorso-premotor and intraparietal areas, to the PRR. We obtained strongest directional tuning in the right PRR for both left and right-hand reaching movements, suggesting a special role of the right hemisphere in directional tuning.
Our results provide important constrains for models on motor control. Furthermore, our data indicate that the right PRR might be well suited for brain–computer interfaces for the control of movement direction. An interesting challenge for future studies will be to determine how BCI devices can combine information from PRR and additional areas to provide control over additional components of an action such as the type of hand–object interaction.
Footnotes
This research was supported by the Provincia Autonoma di Trento and the Fondazione Cassa di Risparmio di Trento e Rovereto. We are grateful to Jens Schwarzbach for many helpful discussions and to Roberto Caminiti, Michele Furlan, and Magda Altman for comments on a previous version of this manuscript. We also thank Dr. Maxim Zaitsev of the University Hospital Freiburg for providing the point-spread function and modified EPI sequences.
References
- Andersen RA, Buneo CA. Intentional maps in posterior parietal cortex. Annu Rev Neurosci. 2002;25:189–220. doi: 10.1146/annurev.neuro.25.112701.142922. [DOI] [PubMed] [Google Scholar]
- Brainard DH. The psychophysics toolbox. Spat Vis. 1997;10:433–436. [PubMed] [Google Scholar]
- Busse L, Katzner S, Tillmann C, Treue S. Effects of attention on perceptual direction tuning curves in the human visual system. J Vis. 2008;8:2 1–13. doi: 10.1167/8.9.2. [DOI] [PubMed] [Google Scholar]
- Caminiti R, Johnson PB, Urbano A. Making arm movements within different parts of space: dynamic aspects in the primate motor cortex. J Neurosci. 1990;10:2039–2058. doi: 10.1523/JNEUROSCI.10-07-02039.1990. [DOI] [PMC free article] [PubMed] [Google Scholar]
- Caminiti R, Johnson PB, Galli C, Ferraina S, Burnod Y. Making arm movements within different parts of space: the premotor and motor cortical representation of a coordinate system for reaching to visual targets. J Neurosci. 1991;11:1182–1197. doi: 10.1523/JNEUROSCI.11-05-01182.1991. [DOI] [PMC free article] [PubMed] [Google Scholar]
- Chang SW, Dickinson AR, Snyder LH. Limb-specific representation for reaching in the posterior parietal cortex. J Neurosci. 2008;28:6128–6140. doi: 10.1523/JNEUROSCI.1442-08.2008. [DOI] [PMC free article] [PubMed] [Google Scholar]
- Colby CL, Goldberg ME. Space and attention in parietal cortex. Annu Rev Neurosci. 1999;22:319–349. doi: 10.1146/annurev.neuro.22.1.319. [DOI] [PubMed] [Google Scholar]
- Connolly JD, Andersen RA, Goodale MA. FMRI evidence for a “parietal reach region” in the human brain. Exp Brain Res. 2003;153:140–145. doi: 10.1007/s00221-003-1587-1. [DOI] [PubMed] [Google Scholar]
- Corbetta M, Shulman GL. Control of goal-directed and stimulus-driven attention in the brain. Nat Rev Neurosci. 2002;3:201–215. doi: 10.1038/nrn755. [DOI] [PubMed] [Google Scholar]
- Dassonville P, Zhu XH, Uğurbil K, Kim SG, Ashe J. Functional activation in motor cortex reflects the direction and the degree of handedness. Proc Natl Acad Sci U S A. 1997;94:14015–14018. doi: 10.1073/pnas.94.25.14015. [DOI] [PMC free article] [PubMed] [Google Scholar]
- Eisenberg M, Shmuelof L, Vaadia E, Zohary E. Functional organization of human motor cortex: directional selectivity for movement. J Neurosci. 2010;30:8897–8905. doi: 10.1523/JNEUROSCI.0007-10.2010. [DOI] [PMC free article] [PubMed] [Google Scholar]
- Fortier PA, Kalaska JF, Smith AM. Cerebellar neuronal activity related to whole-arm reaching movements in the monkey. J Neurophysiol. 1989;62:198–211. doi: 10.1152/jn.1989.62.1.198. [DOI] [PubMed] [Google Scholar]
- Friston KJ, Fletcher P, Josephs O, Holmes A, Rugg MD, Turner R. Event-related fMRI: characterizing differential responses. Neuroimage. 1998;7:30–40. doi: 10.1006/nimg.1997.0306. [DOI] [PubMed] [Google Scholar]
- Georgopoulos AP, Kalaska JF, Caminiti R, Massey JT. On the relations between the direction of two-dimensional arm movements and cell discharge in primate motor cortex. J Neurosci. 1982;2:1527–1537. doi: 10.1523/JNEUROSCI.02-11-01527.1982. [DOI] [PMC free article] [PubMed] [Google Scholar]
- Gibson AR, Horn KM, Van Kan PL. Grasping cerebellar function. In: Bennet KMB, Castiello U, editors. Insights into the reach to grasp movement. Amsterdam: Elsevier Science; 1994. pp. 129–150. [Google Scholar]
- Gourtzelidis P, Tzagarakis C, Lewis SM, Crowe DA, Auerbach E, Jerde TA, Uğurbil K, Georgopoulos AP. Mental maze solving: directional fMRI tuning and population coding in the superior parietal lobule. Exp Brain Res. 2005;165:273–282. doi: 10.1007/s00221-005-2298-6. [DOI] [PubMed] [Google Scholar]
- Graziano M. The organization of behavioral repertoire in motor cortex. Annu Rev Neurosci. 2006;29:105–134. doi: 10.1146/annurev.neuro.29.051605.112924. [DOI] [PubMed] [Google Scholar]
- Grefkes C, Weiss PH, Zilles K, Fink GR. Crossmodal processing of object features in human anterior intraparietal cortex: an fMRI study implies equivalencies between humans and monkeys. Neuron. 2002;35:173–184. doi: 10.1016/s0896-6273(02)00741-9. [DOI] [PubMed] [Google Scholar]
- Grill-Spector K, Malach R. fMR-adaptation: a tool for studying the functional properties of human cortical neurons. Acta Psychol (Amst) 2001;107:293–321. doi: 10.1016/s0001-6918(01)00019-1. [DOI] [PubMed] [Google Scholar]
- Hains BC, Black JA, Waxman SG. Primary cortical motor neurons undergo apoptosis after axotomizing spinal cord injury. J Comp Neurol. 2003;462:328–341. doi: 10.1002/cne.10733. [DOI] [PubMed] [Google Scholar]
- Hochberg LR, Serruya MD, Friehs GM, Mukand JA, Saleh M, Caplan AH, Branner A, Chen D, Penn RD, Donoghue JP. Neuronal ensemble control of prosthetic devices by a human with tetraplegia. Nature. 2006;442:164–171. doi: 10.1038/nature04970. [DOI] [PubMed] [Google Scholar]
- Kakei S, Hoffman DS, Strick PL. Muscle and movement representations in the primary motor cortex. Science. 1999;285:2136–2139. doi: 10.1126/science.285.5436.2136. [DOI] [PubMed] [Google Scholar]
- Kakei S, Hoffman DS, Strick PL. Direction of action is represented in the ventral premotor cortex. Nat Neurosci. 2001;4:1020–1025. doi: 10.1038/nn726. [DOI] [PubMed] [Google Scholar]
- Kalaska JF, Caminiti R, Georgopoulos AP. Cortical mechanisms related to the direction of two-dimensional arm movements: relations in parietal area 5 and comparison with motor cortex. Exp Brain Res. 1983;51:247–260. doi: 10.1007/BF00237200. [DOI] [PubMed] [Google Scholar]
- Kalaska JF, Scott SH, Cisek P, Sergio LE. Cortical control of reaching movements. Curr Opin Neurobiol. 1997;7:849–859. doi: 10.1016/s0959-4388(97)80146-8. [DOI] [PubMed] [Google Scholar]
- Krekelberg B, Boynton GM, van Wezel RJ. Adaptation: from single cells to BOLD signals. Trends Neurosci. 2006;29:250–256. doi: 10.1016/j.tins.2006.02.008. [DOI] [PubMed] [Google Scholar]
- Kriegeskorte N, Simmons WK, Bellgowan PS, Baker CI. Circular analysis in systems neuroscience: the dangers of double dipping. Nat Neurosci. 2009;12:535–540. doi: 10.1038/nn.2303. [DOI] [PMC free article] [PubMed] [Google Scholar]
- Martini P, McKone E, Nakayama K. Orientation tuning of human face processing estimated by contrast matching in transparency displays. Vision Res. 2006;46:2102–2109. doi: 10.1016/j.visres.2005.11.014. [DOI] [PubMed] [Google Scholar]
- Mur M, Ruff DA, Bodurka J, Bandettini PA, Kriegeskorte N. Face-identity change activation outside the face system: “release from adaptation” may not always indicate neuronal selectivity. Cereb Cortex. 2010;20:2027–2042. doi: 10.1093/cercor/bhp272. [DOI] [PMC free article] [PubMed] [Google Scholar]
- Murata A, Gallese V, Luppino G, Kaseda M, Sakata H. Selectivity for the shape, size, and orientation of objects for grasping in neurons of monkey parietal area AIP. J Neurophysiol. 2000;83:2580–2601. doi: 10.1152/jn.2000.83.5.2580. [DOI] [PubMed] [Google Scholar]
- Piazza M, Izard V, Pinel P, Le Bihan D, Dehaene S. Tuning curves for approximate numerosity in the human intraparietal sulcus. Neuron. 2004;44:547–555. doi: 10.1016/j.neuron.2004.10.014. [DOI] [PubMed] [Google Scholar]
- Quian Quiroga R, Snyder LH, Batista AP, Cui H, Andersen RA. Movement intention is better predicted than attention in the posterior parietal cortex. J Neurosci. 2006;26:3615–3620. doi: 10.1523/JNEUROSCI.3468-05.2006. [DOI] [PMC free article] [PubMed] [Google Scholar]
- Sawamura H, Orban GA, Vogels R. Selectivity of neuronal adaptation does not match response selectivity: a single-cell study of the FMRI adaptation paradigm. Neuron. 2006;49:307–318. doi: 10.1016/j.neuron.2005.11.028. [DOI] [PubMed] [Google Scholar]
- Scott SH, Kalaska JF. Reaching movements with similar hand paths but different arm orientations. I. Activity of individual cells in motor cortex. J Neurophysiol. 1997;77:826–852. doi: 10.1152/jn.1997.77.2.826. [DOI] [PubMed] [Google Scholar]
- Todorov E. On the role of primary motor cortex in arm movement control. In: Latash ML, Levin MF, editors. Progress in motor control III. Champaign, IL: Human Kinetics; 2003. pp. 125–166. [Google Scholar]
- Truccolo W, Friehs GM, Donoghue JP, Hochberg LR. Primary motor cortex tuning to intended movement kinematics in humans with tetraplegia. J Neurosci. 2008;28:1163–1178. doi: 10.1523/JNEUROSCI.4415-07.2008. [DOI] [PMC free article] [PubMed] [Google Scholar]
- Wrigley PJ, Gustin SM, Macey PM, Nash PG, Gandevia SC, Macefield VG, Siddall PJ, Henderson LA. Anatomical changes in human motor cortex and motor pathways following complete thoracic spinal cord injury. Cereb Cortex. 2009;19:224–232. doi: 10.1093/cercor/bhn072. [DOI] [PubMed] [Google Scholar]
- Yantis S, Schwarzbach J, Serences JT, Carlson RL, Steinmetz MA, Pekar JJ, Courtney SM. Transient neural activity in human parietal cortex during spatial attention shifts. Nat Neurosci. 2002;5:995–1002. doi: 10.1038/nn921. [DOI] [PubMed] [Google Scholar]
- Zaitsev M, Hennig J, Speck O. Point spread function mapping with parallel imaging techniques and high acceleration factors: fast, robust, and flexible method for echo-planar imaging distortion correction. Magn Reson Med. 2004;52:1156–1166. doi: 10.1002/mrm.20261. [DOI] [PubMed] [Google Scholar]
- Zeng H, Constable RT. Image distortion correction in EPI: comparison of field mapping with point spread function mapping. Magn Reson Med. 2002;48:137–146. doi: 10.1002/mrm.10200. [DOI] [PubMed] [Google Scholar]


