

Abstract
There is evidence that rule-based category learning is supported by a broad neural network that includes the prefrontal cortex, the anterior cingulate cortex, the head of the caudate nucleus, and medial temporal lobe structures. Although thousands of studies have examined rule-based category learning, only a few have studied the development of automaticity in rule-based tasks. Categorizing by a newly learned rule makes heavy demands on declarative memory, but after thousands of repetitions rule-based categorizations are made with no apparent effort. Thus, it seems likely that the neural systems that mediate automatic rule-based categorization are substantially different from the systems that mediate initial learning. This research aims at identifying the neural systems responsible for early and late rule-based categorization performances. Toward this end, this article reports the results of an experiment in which human participants each practiced a rule-based categorization task for >10,000 trials distributed over 20 separate sessions. Sessions 1, 4, 10, and 20 were performed inside a magnetic resonance imaging scanner. The main findings are as follows: (1) cortical activation remained approximately constant throughout training, (2) subcortical activation increased with practice (i.e., there were more activated voxels in the striatum), and (3) only cortical activation was correlated with accuracy after extensive training. The results suggest an initial subcortical neural system centered around the head of the caudate that is gradually replaced by a cortical system centered around the ventrolateral prefrontal cortex. With extensive practice, the cortical system progressively becomes more caudal and dorsal, and is eventually centered around the premotor cortex.
Introduction
The COVIS theory of category learning assumes separate rule-based and procedural-learning categorization systems that compete for access to response production (Ashby et al., 1998; Ashby and Valentin, 2005). The rule-based system selects and tests simple verbalizable hypotheses about category membership, whereas the procedural system gradually associates categorization responses with regions of perceptual space via reinforcement learning. COVIS assumes that rule-based categorization is mediated by a broad neural network that includes the prefrontal cortex [ventrolateral prefrontal cortex (VLPFC)], anterior cingulate [middle anterior cingulate cortex (mACC)], head of the caudate nucleus (HofC), and the hippocampus. The key structures in the procedural learning system are the putamen and the premotor cortex [supplementary motor area (SMA)].
The SPEED model (Ashby et al., 2007) extends the COVIS procedural system to account for the development of automaticity by adding corticocortical projections from sensory cortex directly to the relevant areas of premotor cortex. This model assumes that a major role of the subcortical path through the striatum is to train these corticocortical projections. Thus, SPEED assumes that the development of automaticity is a gradual transfer of control from the striatum to the cortex. This model predicts an increasing role for premotor [posterior anterior cingulate cortex (pACC), dorsal premotor cortex (PMd), ventral premotor cortex (PMv)] and motor (M1) areas of cortex as automaticity develops. At least some evidence supports a similar view for rule-based tasks. For example, Muhammad et al. (2006) recorded from single neurons in the prefrontal cortex (PFC), head of the caudate, and PMd while monkeys were applying rules. As predicted by the category-learning literature, they found many rule-selective cells in the PFC and caudate. However, after training the monkeys for a year, they also found many PMd cells that were rule selective. More importantly, these cells responded on average ∼100 ms before the PFC and caudate rule-selective cells.
This research aims at identifying the neural systems responsible for early and late rule-based categorization performance. Following the COVIS and SPEED theories of categorization, we hypothesize that initial rule-based categorization should activate mostly cortical brain areas overlapping with declarative memory (e.g., VLPFC, hippocampus), whereas late performance should produce activation mostly in motor areas (e.g., PMd, PMv). To test these hypotheses, this article reports the results of an experiment in which human participants each practiced an easy (simple-1D) or difficult (disjunctive) rule-based categorization task for >10,000 trials distributed over 20 separate sessions. Because category learning is thought to follow the power law of practice (Newell and Rosenbloom, 1981), sessions 1, 4, 10, and 20 (which are approximately equally spaced on a log scale) were performed inside a magnetic resonance imaging (MRI) scanner. Since both the easy and difficult conditions were scanned on the same session numbers, their neuroimaging results should reflect different stages of learning (from a common rule-based learning process). The results suggest an initial subcortical neural system that is progressively replaced by a cortical system that gradually becomes more caudal and dorsal with extensive practice.
Materials and Methods
Participants.
Sixteen healthy undergraduate students at the University of California, Santa Barbara (10 males, 6 females; age range, 19–23 years), were recruited to participate in 20 d of training. One-half of the participants were randomly assigned to the simple-1D condition, whereas the remaining participants were assigned to the disjunctive rule condition. All participants gave their written informed consent to participate in the study, and their consent was reaffirmed at the beginning of each scanning session. The institutional review board of the University of California Santa Barbara approved all procedures in this experiment. All the participants received a monetary compensation or course credit for participation.
Stimuli and apparatus.
This subsection details the materials and procedures used in the scanning sessions. Details concerning the training sessions outside the scanner can be found in the study by Helie et al. (2010).
The stimuli were circular sine-wave gratings of constant contrast and size. Each stimulus was defined by a set of points (x1, x2) sampled from a 100 × 100 stimulus space and converted to a disk using the following equations: frequency = x1/30 + 0.25 cpd, and orientation = 9x2/10 + 20°. This yielded stimuli that varied from 20 to 110° in orientation and from 0.25 to 3.58 cpd in frequency. The stimuli were generated with MATLAB using Brainard's (1997) Psychophysics Toolbox and occupied an approximate visual angle of 5°. An example stimulus is shown in Figure 1a.
Figure 1.

Stimuli used in the experiment. a, An example stimulus. b, Category structures in the disjunctive rule condition. The optimal decision bounds are x1 = 25 and x1 = 75. c, Category structures in the simple-1D condition. The optimal decision bound is x1 = 50.
For the disjunctive rule condition, category A was uniformly distributed in two regions divided along the frequency dimension (x1). Category A stimuli were defined as x1 < 25 or x1 > 75. Category B stimuli were defined as 25 < x1 < 75 (in the 100 × 100 stimulus space shown in Fig. 1b). These boundaries were chosen so that the areas of the two categories were the same. For the simple-1D condition, the category A stimuli were defined as x1 < 50, whereas the category B stimuli were defined as x1 > 50 (Fig. 1c). In both conditions, stimuli that were less than three units away from the category boundaries in the 100 × 100 stimulus space were not used.
Stimulus presentation, feedback, response recording, and response time (RT) measurement were controlled and acquired using MATLAB run on a Macintosh computer. During the scanning sessions, the participants selected category A or B responses using two button boxes (one in each hand). The button box in the left hand indicated an A category response, and the button box in the right hand indicated a B category response. Each stimulus was presented for 2000 ms. Correct responses were followed by a green check mark displayed for 2000 ms. Incorrect responses were followed by a red “X” mark displayed for 2000 ms. If a response was given too slowly (i.e., after the stimulus had disappeared), a black dot was displayed for 2000 ms. A crosshair appeared for 1000 ms before the stimulus on an average of 48% of the trials. Cognitively, the presence/absence of the crosshair should only affect response times, as the crosshair was not diagnostic of the stimulus category membership and the participants had more than enough time to make a categorization decision. Because response times are not explored in the present manuscript, this effect is negligible. However, the irregular presentation of the crosshair in the scanning sessions contributes to the decorrelation of the regressors representing the crosshair and stimulus events (corresponding to a partial trial design) (Serences, 2004). More details on the timing of a trial (including the jittering parameters) are shown in Figure 2.
Figure 2.

Timing of a trial scaled in TR (1 TR = 2000 ms). The number of blank TRs between stimulus and feedback was jittered with a truncated geometric distribution with p = 0.5 (maximum 3 TRs), whereas the number of blank TRs between the feedback and the next stimulus was jittered with a truncated geometric distribution with p = 0.5 (maximum 5 TRs). When more than one blank TR was inserted between the feedback and the following stimulus (48% of the trials), a crosshair was displayed in the second half of the TR immediately preceding stimulus presentation.
Study design.
The experiment lasted 20 consecutive workdays. Sixteen of the sessions were conducted in the laboratory, and four were conducted in an MRI scanner. The laboratory sessions were made up of 12 blocks of 50 stimuli each for a total of 600 stimuli per session, and the scanner sessions were made up of 6 blocks of 80 stimuli each for a total of 480 stimuli per session. The scanning sessions were the 1st (with no previous practice), 4th (after 1680 trials of practice), 10th (after 5160 trials of practice), and 20th (after 11,040 trials of practice) days of the study.
Participants were told that they were taking part in a categorization experiment and that they were to assign each stimulus into either an A or B category. In the laboratory, they were asked to respond A or B with their index fingers (the same fingers used for the button boxes in the scanner) for consistency in motor responses across experimental environments. The participants were allowed to take a break between blocks if they wanted.
Neuroimaging.
A rapid event-related design functional MRI (fMRI) procedure was used to examine neural responses as automaticity developed in the respective categorization tasks. The scanning sessions were conducted at the University of California, Santa Barbara, Brain Imaging Center using a 3T Siemens TIM Trio MRI scanner with an eight-channel phased array head coil. Cushions were placed around the head to minimize head motion. Functional runs [echo-planar images (EPIs)] used a T2*-weighted single-shot gradient echo (GRE), echo-planar sequence sensitive to blood oxygen level-dependent contrast [repetition time (TR), 2000 ms; echo time (TE), 30 ms; flip angle (FA), 90°; field of view, 192 mm] with GRAPPA (generalized autocalibrating partially parallel acquisitions). Each volume consisted of 33 slices acquired parallel to the anterior commissure–posterior commissure plane (interleaved acquisition; 3 mm thick with 0.5 mm gap; 3 × 3 mm in-plane resolution; 64 × 64 matrix). Stimuli were viewed through a mirror mounted on the head coil and a back projection screen. Each block of 80 trials was associated with a different (individually jittered) EPI scan sequence. A localizer, a GRE field map, and a T1-flash (TR, 15 ms; TE, 4.2 ms; FA, 20°; 192 sagittal slices, three-dimensional acquisition; 0.89 mm thick; 1 × 1 mm in-plane resolution; 256 × 256 matrix) were all run before the EPI scans, and an additional GRE field-mapping scan was done at the end of each scanning session. Each scanning session lasted ∼90 min.
The experimenter talked with the participants between each scan, and the participants were allowed to take a break between each scan (but not to exit from the scanner). These manipulations were designed to minimize fatigue and monotony. The possibility of excessive head motion was assessed by individually examining the results of motion correction preprocessing and eliminating blocks with remaining excessive head motion from data analysis (as described next).
Neuroimaging analysis.
All the following neuroimaging analyses were performed on correct responses. Preprocessing and data analysis were conducted using FEAT (FMRI Expert Analysis Tool), version 5.98, part of FSL (www.fmrib.ox.ac.uk/fsl). Preprocessing was done separately on each EPI scan to reduce sources of noise and artifact, including motion correction using MCFLIRT (Jenkinson et al., 2002), BET brain extraction, and spatial smoothing with a full width at half-maximum of 5 mm and a high-pass temporal filter with a cutoff of 100 s. Scanning data in which excessive head motion (i.e., >3 mm) remained after preprocessing were excluded from the remaining analyses (∼5% of the data).
First, low-level analyses were performed separately on each EPI scanning block. Three explanatory variables (EVs) were defined as follows: stimulus, feedback, and baseline (defined as the TRs during which the fixation point crosshairs were shown). The events were convolved with a gamma function with a SD of 3 s and a mean lag of 6 s. A temporal derivative and temporal filtering were added to the design matrix. Contrasts were formed by subtracting the baseline EV from each of the other EVs. Second, the results of the low-level analyses were input into midlevel analyses to aggregate the block data into session data. The midlevel analyses yielded a separate brain map for each participant in each session. Midlevel analyses focused on the contrast “stimulus − baseline.” The mean correlation between these two regressors was 0.07. Third, the results of midlevel analyses were input into a high-level analysis to generate a separate group map for each session in each condition. To generate clusters, a z threshold was set for each voxel at 4.265 (p = 1 × 10⁻⁵) with a cluster size threshold of p = 0.05.
In addition to whole-brain analysis, anatomical regions of interest (ROIs) were examined based on existing categorization theory. Although many cognitive theories of categorization have been proposed (for review, see Ashby and Maddox, 2005), only a few theories include enough neurobiological details to make predictions in the present experiment. Hence, ROIs representing activation predicted by COVIS (Ashby et al., 1998) and SPEED (Ashby et al., 2007) were selected (Table 1). The ROIs were created using the FSL Harvard–Oxford atlases. The mACC and pACC were defined by taking the anterior cingulate gyrus as defined by the Harvard–Oxford Cortical Structural Atlas and dividing based on structural landmarks (Vogt, 2005). PMd and PMv were created using the Harvard–Oxford Cortical Atlas and dividing the regions as defined by Picard and Strick (2001). All other ROIs were directly taken from Harvard–Oxford structural atlases, with the exception of the VLPFC, which was defined by dividing the PFC along the sulcus dividing the middle and inferior frontal gyri and removing the medial part and all the motor and premotor areas.
Table 1.
ROI activations from COVIS and SPEED for the disjunctive and simple-1D rule conditions
| ROI | Simple-1D |
Disjunctive |
||||||
|---|---|---|---|---|---|---|---|---|
| S1 | S4 | S10 | S20 | S1 | S4 | S10 | S20 | |
| COVIS rule-based | ||||||||
| VLPFC | 0.19 | 0.15 | 0.15 | 0.16 | 0.23 | 0.26 | 0.19 | 0.23 |
| MDN | 0.23 | 0.21 | 0.25 | 0.25 | 0.19 | 0.21 | 0.20 | 0.26 |
| VA | 0.30 | 0.23 | 0.29 | 0.26 | 0.21 | 0.25 | 0.23 | 0.30 |
| HofC | 0.16 | 0.13 | 0.13 | 0.16 | 0.12 | 0.13 | 0.14 | 0.22 |
| mACC | 0.26 | 0.22 | 0.23 | 0.27 | 0.20 | 0.30 | 0.24 | 0.31 |
| Hippocampus | 0.12 | 0.13 | 0.13 | 0.15 | 0.07 | 0.10 | 0.11 | 0.17 |
| COVIS procedural | ||||||||
| Putamen | 0.14 | 0.15 | 0.12 | 0.17 | 0.13 | 0.19 | 0.15 | 0.24 |
| VL | 0.18 | 0.16 | 0.18 | 0.19 | 0.14 | 0.17 | 0.17 | 0.21 |
| SMA | 0.19 | 0.19 | 0.16 | 0.19 | 0.27 | 0.35 | 0.28 | 0.33 |
| COVIS common | ||||||||
| Gpi | 0.12 | 0.12 | 0.12 | 0.14 | 0.09 | 0.09 | 0.12 | 0.15 |
| SPEED | ||||||||
| pACC | 0.22 | 0.22 | 0.18 | 0.21 | 0.23 | 0.35 | 0.23 | 0.31 |
| PMd | 0.08 | 0.13 | 0.14 | 0.11 | 0.16 | 0.19 | 0.17 | 0.18 |
| PMv | 0.18 | 0.20 | 0.19 | 0.18 | 0.30 | 0.33 | 0.27 | 0.31 |
| M1 | 0.09 | 0.11 | 0.08 | 0.07 | 0.09 | 0.17 | 0.13 | 0.15 |
Note: Activation is the 90th percentile of percentage signal change and is statistically significant in all cells (p < 0.001). All the ROIs are bilateral. VLPFC, Ventrolateral prefrontal cortex; MDN, medial dorsal nucleus of the thalamus; VA, ventral anterior nucleus of the thalamus; HofC, head of caudate; mACC, middle anterior cingulate cortex; VL, ventrolateral nucleus of the thalamus; SMA, supplementary motor area; GPi, internal segment of the globus pallidus; pACC, posterior anterior cingulate cortex; PMd, dorsal premotor cortex; PMv, ventral premotor cortex; M1, primary motor cortex.
ROI analyses were performed on the group maps resulting from the high-level analyses, and the 90th percentile of percentage signal change was retained as a measure of activation. In addition, ROI analyses were performed on the participant maps resulting from the midlevel analyses. Again, the 90th percentile of percentage signal change was retained as a measure of activation. The activations in each session in each condition resulting from the midlevel ROI analyses were correlated with accuracies, with whole-brain activations partialled out (using the 90th percentile of percentage signal change in a whole-brain mask). Because there is no statistical test that allows the comparison of two (or more) dependent correlation coefficients (e.g., to compare correlation changes between the sessions, which is a within-subject design), trend analyses were performed to quantify correlation changes. Details on the trend analysis are shown in Table 2.
Table 2.
Trend analysis for partial correlations
| ROI | Simple-1D |
Disjunctive |
||||
|---|---|---|---|---|---|---|
| Trend | F | Significance | Trend | F | Significance | |
| COVIS rule-based | ||||||
| VLPFC | ↑ | 13.19 | * | ↑ | 10.02 | * |
| MDN | ↓ | 39.56 | ** | ↓ | 383.72 | *** |
| VA | ↓ | 2.71 | NS | ↓ | 8.98 | * |
| HofC | ↓ | 0.45 | NS | ↓ | 36.42 | ** |
| mACC | ↑ | 2.30 | NS | ↑ | 2.91 | NS |
| Hippocampus | ↓ | 3.54 | NS | ↓ | 6.64 | + |
| COVIS procedural | ||||||
| Putamen | − | 0.00 | NS | ↓ | 6.57 | + |
| VL | ↓ | 9.48 | * | ↓ | 38.63 | *** |
| SMA | ↑ | 0.89 | NS | ↑ | 0.99 | NS |
| COVIS common | ||||||
| GPi | ↓ | 0.90 | NS | ↓ | 5.68 | + |
| SPEED | ||||||
| pACC | ↑ | 1.74 | NS | ↑ | 7.34 | + |
| PMd | ↑ | 3.09 | NS | ↑ | 0.09 | NS |
| PMv | ↑ | 13.56 | * | ↑ | 9.87 | * |
| M1 | ↑ | 5.91 | + | ↑ | 4.40 | NS |
Note: A power function was individually fit for each ROI in each condition: pcor = sessionc −1, where pcor is the partial correlation, session is the session number, and c is a free parameter representing the trend (the −1 was included to allow the model to fit negative values of pcor). Trend indicates whether c was positive (↑), null (−), or negative (↓). The F value was computed by comparing the sum of square error (SSE) of the best-fitting model with the SSE of a model where c = 0 (Ashby and Lee, 1991).
+p < 0.10;
*p < 0.05;
**p < 0.01;
***p < 0.001.
Results
Neuroimaging data from the first scanning session of one participant in the disjunctive rule condition were excluded from all analyses because of a computer error.
Behavioral performance
This subsection presents a brief summary of the behavioral data collected in this experiment. In-depth analysis of the behavioral data is presented in the study by Helie et al. (2010).
The mean accuracies per session for each group are shown in Figure 3a. A condition (2, between) by session (20, within) ANOVA on accuracies shows a significant effect of session (F(19,285) = 2.03; p < 0.01). The mean accuracy on session 1 was 91.3%, which increased to 94.0% in session 20. However, the main effect of session needs to be interpreted with care, because the condition by session interaction also reached statistical significance (F(19,285) = 2.66; p < 0.001). As can be seen in the figure, the simple-1D condition was slightly easier than the disjunctive rule condition in sessions 1 (F(1,15) = 3.28; p < 0.10) and 2 (F(1,15) = 3.03; p < 0.10). This ordering was reversed in session 16 (F(1,15) = 3.33; p < 0.10), which explains the statistically significant interaction. Accuracy was similar in all the other sessions (all values of F(1,15) < 2.69; NS). The mean accuracies in session 1 were 92.8 and 89.6% for the simple-1D and conjunctive rule conditions, respectively. The main effect of condition did not reach statistical significance (F(1,15) = 0.46; NS).
Figure 3.
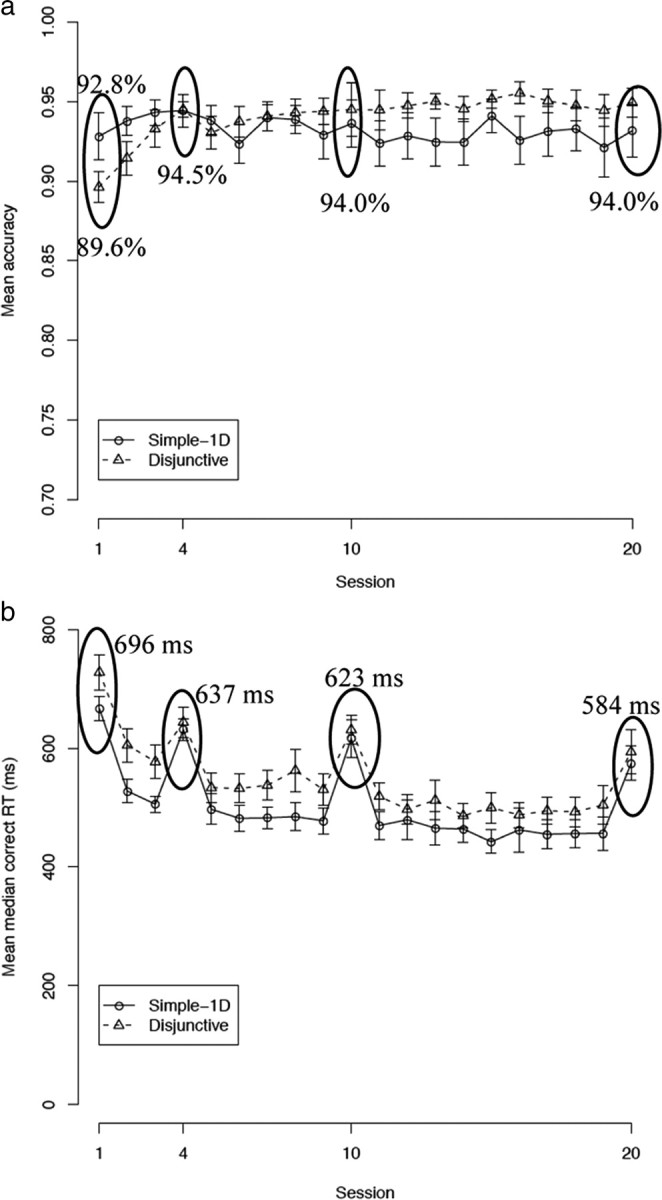
a, Proportion correct per training session. b, Mean median correct RT per training session. The scanning sessions are circled. The error bars are SEMs.
Note that additional (unscanned) participants were run in the study by Helie et al. (2010). The same statistical analysis was performed, and the difference between the two conditions was statistically significant in session 1 (p < 0.01). However, the participants had statistically similar accuracies in all the other sessions. These results suggest that the simple-1D condition was easier than the disjunctive rule condition in session 1, but that the marginally significant differences found in sessions 2 and 16 are probably attributable to random variations. Also, additional behavioral analyses provided in the study by Helie et al. (2010) suggest that the performances of all the participants reported herein are best described by an optimal categorization strategy in every session (Fig. 1).
The mean median correct RTs for each group in each session are shown in Figure 3b. A condition (2, between) by session (20, within) ANOVA on mean median correct RTs shows a significant effect of session (F(19,285) = 38.12; p < 0.001). The mean median correct RT was 696 ms in session 1 and decreased to 584 ms in session 20. The main effect of condition (F(1,15) = 2.18; NS) and its interaction with session (F(19,285) = 0.97; NS) both failed to reach statistical significance.
Group-maps whole-brain analyses
Tables listing all the statistically significant activation clusters are presented in the supplemental material (supplemental Tables S1–S8, available at www.jneurosci.org). This subsection summarizes the key results.
Simple-1D rule condition
Figure 4 shows the activated clusters for the simple-1D group. As can be seen, activation in session 1 was initially mostly cortical, and reproduced a typical rule-guided behavior network (Ashby et al., 1998; Bunge and Wallis, 2008). In particular, activation was found in the VLPFC, the dorsolateral PFC, and the dorsal ACC. The only subcortical region that was significantly activated in session 1 was the thalamus. However, this changed with practice. Although the cortical activation remained approximately constant with practice, new subcortical clusters became activated after training. In particular, the hippocampus became significantly activated in session 4 and the putamen became significantly activated in session 20. Note that these new clusters did not replace the existing clusters from previous sessions; they supplemented activation that was already present. These results are consistent with previous results in habit formation (Poldrack and Packard, 2003). However, correlational analyses described below (see Partial correlations between ROIs and accuracies) suggest that this additional subcortical activation was not mediating the categorization behavior.
Figure 4.
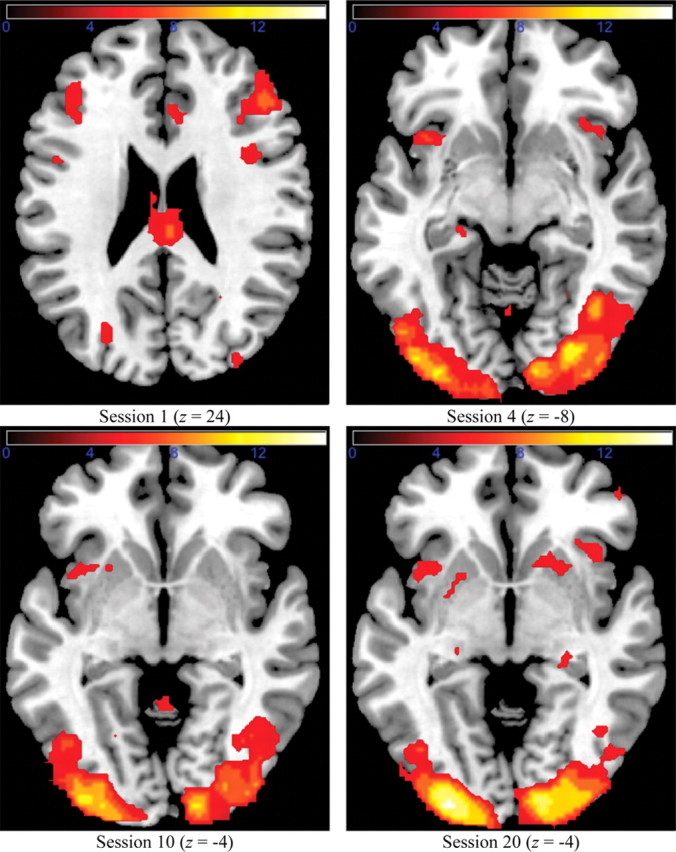
Whole-brain cluster analysis for the simple-1D group.
Disjunctive rule condition
Figure 5 shows the activated clusters for the disjunctive rule condition. As can be seen, activation in the first scanning session was clustered in locations similar to the simple-1D condition. Clusters were found in the dorsal ACC, the VLPFC, and the dorsolateral PFC. The main difference in cortical activation between the two rule conditions was that activation clusters in motor areas (e.g., M1, pACC) were much larger in session 1 in the disjunctive rule condition than in the simple-1D condition. At the subcortical level, only the thalamus was activated in session 1, as in the simple-1D condition.
Figure 5.
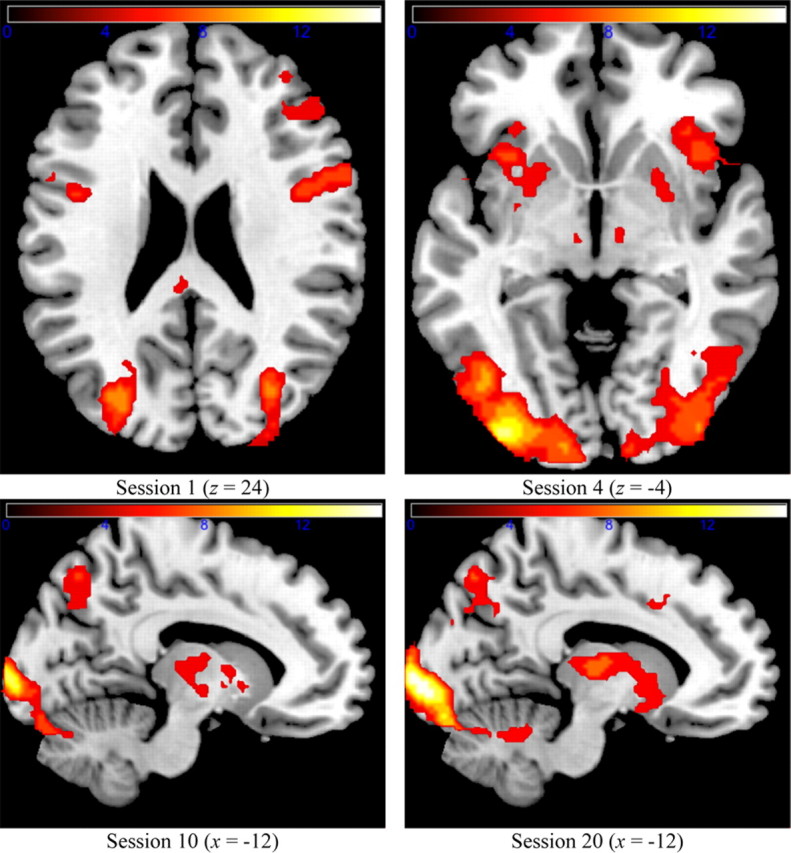
Whole-brain cluster analysis for the disjunctive group.
The remaining scanning sessions were marked by the emergence of additional subcortical activation clusters. In particular, the putamen became activated in session 4, and the caudate became activated in session 10. No new subcortical brain areas became activated in session 20. As in the simple-1D condition, this additional subcortical activation was not mediating the categorization behavior (as detailed below in Partial correlations between ROIs and accuracies). At the cortical level, the activation pattern remained approximately the same throughout training. A noteworthy absence in the disjunctive rule condition was any significant activation in the hippocampus. This was present in sessions 4 and 20 in the simple-1D rule condition. Previous results (Seger and Cincotta, 2006) suggest that activation in the caudate is negatively correlated with activation in the hippocampus during category learning, and that activation in these two brain regions may correspond to different learning strategies (Poldrack and Packard, 2003). The simple-1D rule condition did not have caudate activation (throughout), whereas the disjunctive rule condition had caudate activation (starting with session 10). This suggests that different strategies might have been used by the participants in the two rule-based conditions during the scanning sessions.
ROI analyses
The whole-brain cluster analyses show that brain activation generally followed a trend in which new subcortical brain areas were recruited with extensive training (in addition to the originally activated cortical brain areas). The COVIS theory of category learning (Ashby et al., 1998) makes predictions about which brain areas should be activated during rule-based category learning (Ashby and Valentin, 2005). However, very little is known about the brain areas involved during automatic rule-based categorization. Helie and Ashby (2009) proposed a model of automaticity of abstract rule maintenance and application that assumes a separate corticocortical pathway responsible for automatic performance [as in the theory of Ashby et al. (2007)]. An ROI analysis was therefore conducted to test whether (1) the brain areas involved in category learning were still active after overtraining [those areas identified by Ashby et al. (1998) and Ashby and Valentin (2005)] and (2) a separate corticocortical pathway became activated with practice [as proposed by Ashby et al. (2007) and Helie and Ashby (2009)].
The ROIs predicted by COVIS (Ashby et al., 1998) and SPEED (Ashby et al., 2007) are listed in Table 1, along with their activations for the simple-1D and the disjunctive rule conditions in each session. Activation in all the ROIs in each condition in every session was statistically significant (p < 0.001). As can be seen, the activation was similar in both conditions and remained approximately constant throughout the scanning sessions in the ROIs from COVIS (for both the rule-based and the procedural systems) and SPEED. A separate condition (2, between) by session (4, within) ANOVA was performed for each ROI, confirming the above observations (all values of F < 3.01; NS). The ROIs that were most activated in both conditions are ventral anterior nucleus (VA), medial dorsal nucleus (MDN), mACC, pACC, and the PMv (the VLPFC and the SMA were also highly activated, but only in the disjunctive rule condition).
COVIS and SPEED predict that these ROIs should be important for categorization performance at different stages of training. This prediction was not supported by the activation statistics. Even so, COVIS and SPEED do not predict that the locus of activation will necessarily change with training. Instead, they predict that categorization performance will depend on different brain areas at different stages of training. It is possible that an ROI that helps mediate early categorization performance is still active after extensive training but that it no longer contributes to the behavior. For example, this is exactly the result reported by Muhammad et al. (2006). In addition, an ROI responsible for late categorization performance might need to be activated during early training to allow for Hebbian learning to take place (Ashby et al., 2007). These more specific hypotheses can be tested using correlation analyses.
Partial correlations between ROIs and accuracies
The results so far have shown that (1) the same cortical brain areas remained activated throughout training, (2) subcortical brain areas were recruited to supplement the cortical brain areas after extensive training, and (3) activations in the ROIs from the COVIS (Ashby et al., 1998) and the SPEED (Ashby et al., 2007) networks tended to be high but approximately constant and similar in the two conditions. However, it remains to be determined whether all the activated brain areas were meaningful in producing the behavior. For instance, Muhammad et al. (2006) found that abstract rules are redundantly encoded in the head of the caudate, PFC, and PMd after extensive training. However, PMd rule-selective cells fired earlier than rule-selective cells in other brain areas, suggesting that the PMd was responsible for the overt behavior and that other brain areas with rule-selective cells might be by-products of earlier stages of learning. To address this issue, we examined partial correlations between activation in a variety of different ROIs (from Table 1) and response accuracy (with whole-brain activation partialled out). The 2 (conditions) × 4 (sessions) × 14 (ROIs) = 112 scatterplots underlying the partial correlation analyses presented herein were individually observed for outliers. For each scatterplot, the partial correlation was recalculated after removing the data point that was the furthest away from the best-fitting linear regression line. If the correlation coefficient changed sign, the scatterplot was counted as being driven by an outlier. This happened in 11 scatterplots (9.8% of the cases). However, each one of these cases was associated with a small, nonsignificant correlation that did not change the interpretation of the data reported herein. For instance, the partial correlation of MDN activation with accuracy in session 1 for the disjunctive group is −0.004 in Figure 8a and changed to 0.001 when the largest outlier was removed. Thus, the correlation results reported herein are robust and no datum was eliminated. The results are shown in Table 2.
Figure 8.

Partial correlations between thalamus activation and accuracy (with whole-brain activation partialled out). a, Medial dorsal nucleus (MDN). b, Ventral anterior nucleus (VA). c, Ventrolateral nucleus (VL). Error bars are SEs.
In addition to the partial correlation analyses, trend analyses were performed to detect changes in the correlation coefficient calculated in each session. These results are also shown in Table 2.
Rule-based system
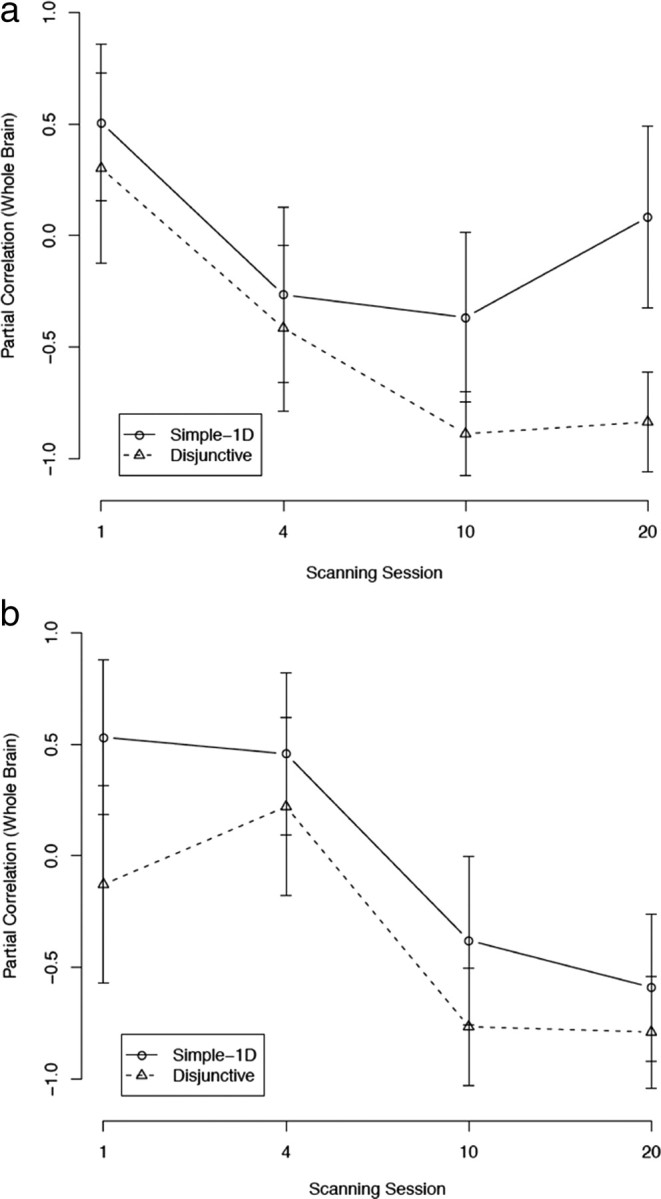
Figure 6a shows the correlations between VLPFC activation and accuracy. As can be seen, the correlations in both conditions were generally increasing (both values of F(1,3) > 10.02; p < 0.05), peaking in session 10, and decreasing slightly in session 20. The correlations in the simple-1D condition were statistically significant in all scanning sessions starting with session 4 (all r > 0.76; p < 0.01). The disjunctive rule condition showed a similar pattern, with correlations being slightly smaller. The correlation for the disjunctive condition was marginally significant in session 4 (r = 0.60; p < 0.10) and statistically significant in session 10 (r = 0.66; p < 0.05). The correlation was not significant in session 20 for the disjunctive rule condition (r = 0.42; NS). The high correlation between VLPFC and accuracy is not surprising and was observed in previous studies (Muhammad et al., 2006). However, the results of Muhammad et al. suggest that the correlation between VLPFC activation and accuracy should decrease after extensive practice (when relevant rule representations are found in the PMd). It is possible that the VLPFC is not only used for rule representation but also for visual representation. This possibility is further explored below (see Discussion, Outstanding results). Correlations for the mACC were similarly high but stable in both conditions (supplemental Fig. S1, available at www.jneurosci.org as supplemental material).
Figure 6.
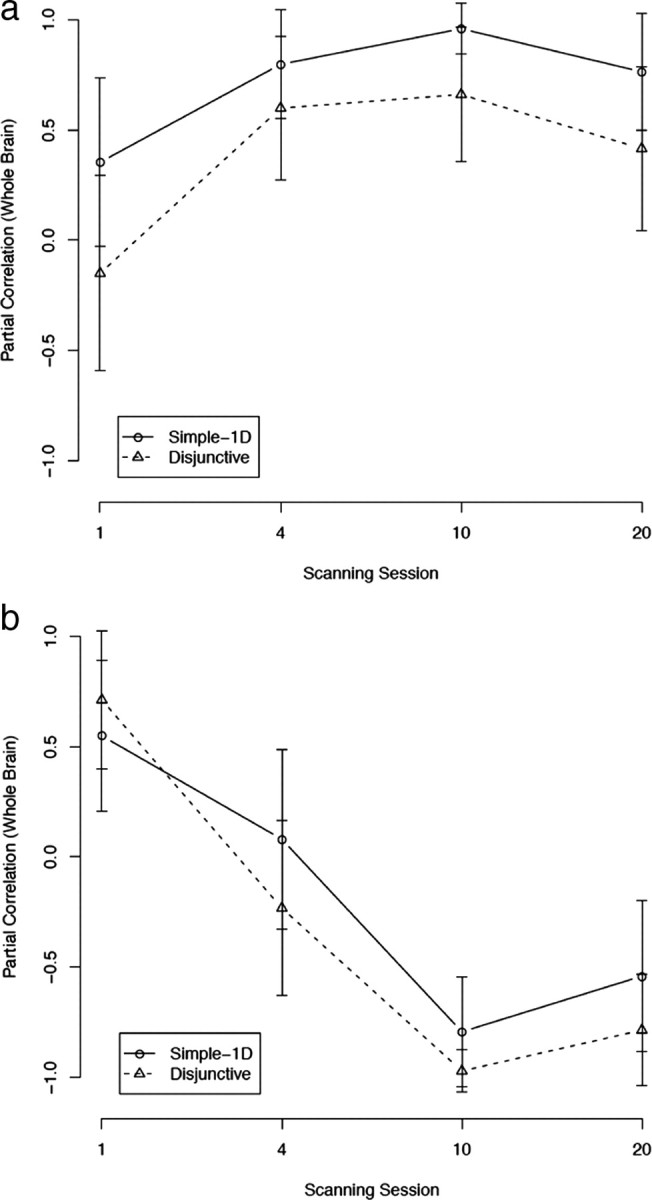
Partial correlations between activations in the COVIS rule-based system and accuracy (with whole-brain activation partialled out). a, Ventrolateral prefrontal cortex (VLPFC). b, Hippocampus. Error bars are SEs.
Figure 6b shows the correlations between hippocampus activation and accuracy. For the simple-1D condition, the correlation was positive (but not statistically significant) until session 4 and became negative in sessions 10 (r = −0.79; p < 0.01) and 20 (r = −0.54; NS). Correlations in the disjunctive rule condition followed a similar pattern, with correlations being generally lower than in the simple-1D condition. The correlation was positive and statistically significant in session 1 (r = 0.71; p < 0.05), not statistically significant in session 4, and negative and statistically significant starting with session 10 (both r < −0.78; p < 0.01). This decreasing trend of correlation was marginally significant in the disjunctive condition (F(1,3) = 6.64; p < 0.10), but not in the simple-1D condition (because of the non-monotonicity in session 20). Seger and Cincotta (2006) found a similar pattern of hippocampus activation for “fast learners” in a rule-based task.
Subcortical ROIs
Muhammad et al. (2006) found rule-selective cells in the head of the caudate that fired after cortical rule-selective cells (suggesting that they were not responsible for the behavior). The correlations between head of the caudate activation and accuracy are shown in Figure 7a. For the simple-1D condition, the correlation was initially positive (r = 0.51; NS) and quickly became smaller with practice, tending toward zero. In the disjunctive rule condition, the correlation was also initially positive (r = 0.30; NS) but quickly became highly negative and statistically significant starting with session 10 (both r < −0.83; p < 0.001). This decreasing trend was highly significant in the disjunctive condition (F(1,3) = 36.42; p < 0.01), but not in the simple-1D condition (because of the non-monotonicity in session 20). These results suggest that, as in the study by Muhammad et al. (2006), performance after extensive training was not driven by the head of the caudate.
Figure 7.
Partial correlations between subcortical brain area activations and accuracy (with whole-brain activation partialled out). a, Head of caudate (HofC). b, Internal segment of the globus pallidus (GPi). Error bars are SEs.
It is noteworthy that this general decreasing pattern of correlations was found in all basal ganglia ROIs that were investigated. For instance, the correlations for the internal segment of the globus pallidus are shown in Figure 7b. The correlations were generally decreasing in both conditions, a trend that was marginally statistically significant in the disjunctive condition (F(1,3) = 5.68; p < 0.10), but not in the simple-1D condition (because of the non-monotonicity in session 1). The correlations were highly significant (and negative) for the disjunctive rule condition in sessions 10 and 20 (both r < −0.76; p < 0.01). The putamen also showed a similar negative pattern of correlations (supplemental Fig. S2, available at www.jneurosci.org as supplemental material).
The decreasing (and mostly negative) correlations between basal ganglia activation and accuracy suggest that categorization behavior was mediated mostly by cortical areas after automaticity had developed. If this interpretation is correct, then activation in thalamic nuclei that receive basal ganglia input should not be positively correlated with accuracy after extensive practice. Figure 8 shows the correlations between activation in three thalamic nuclei [MDN, VA, ventrolateral nucleus (VL)] and accuracy. As can be seen, all three nuclei showed a similar decreasing pattern of correlations in both conditions (all values of F(1,3) > 9.48, p < 0.05; except VA in the simple-1D condition, F(1,3) = 2.71, NS). None of these correlations were significant in sessions 1 and 4. However, accuracy in the simple-1D condition was negatively correlated with VL (r = −0.84; p < 0.001) and MDN (r = −0.84; p < 0.001) activations in session 10, and with MDN activation in session 20 (r = −0.65; p < 0.05). Similarly, accuracy in the disjunctive rule condition was negatively correlated with VA activation in session 10 (r = −0.96; p < 0.001), and with both VA (r = −0.66; p < 0.05) and MDN (r = −0.95; p < 0.001) activations in session 20. These results support the interpretation that automatic categorization is mostly cortical and are in line with the study by Muhammad et al. (2006).
Premotor and motor areas
Muhammad et al. (2006) found rule-selective cells in the PMd that fired stronger and earlier than any other rule-selective cells. They suggested that the PMd was responsible for rule-guided behavior after overtraining. The correlations between accuracy and premotor areas activations are shown in Figure 9. As can be seen, accuracy in both conditions was increasingly correlated with PMv activation (Fig. 9a) (both values of F(1,3) > 9.87; p < 0.05). The correlation is statistically positive in session 10 for the disjunctive rule condition (r = 0.88; p < 0.001) and in session 20 for both conditions (simple-1D, r = 0.69, p < 0.05; disjunctive rule, r = 0.80, p < 0.01). The correlation pattern between accuracy and PMd activation was not as clear. For the simple-1D condition, this correlation was generally increasing (but not statistically significant in the trend analysis because of the non-monotonicity in session 1) and statistically significant in session 20 (r = 0.88; p < 0.001). This is the expected result following Muhammad et al. In contrast, the disjunctive rule condition had a correlation pattern that followed an inverted U-shape function starting at 0.06 (in session 1), peaking in session 4 (r = 0.72; p < 0.05), and ending up negative in session 20 (r = −0.55; NS). These results suggest that, in session 20, rules were processed in the PMd in the simple-1D condition and in the PMv in the disjunctive rule condition. The SMA, the pACC, and M1 had correlation patterns similar to that of the PMd (supplemental Figs. S3–S5, available at www.jneurosci.org as supplemental material).
Figure 9.
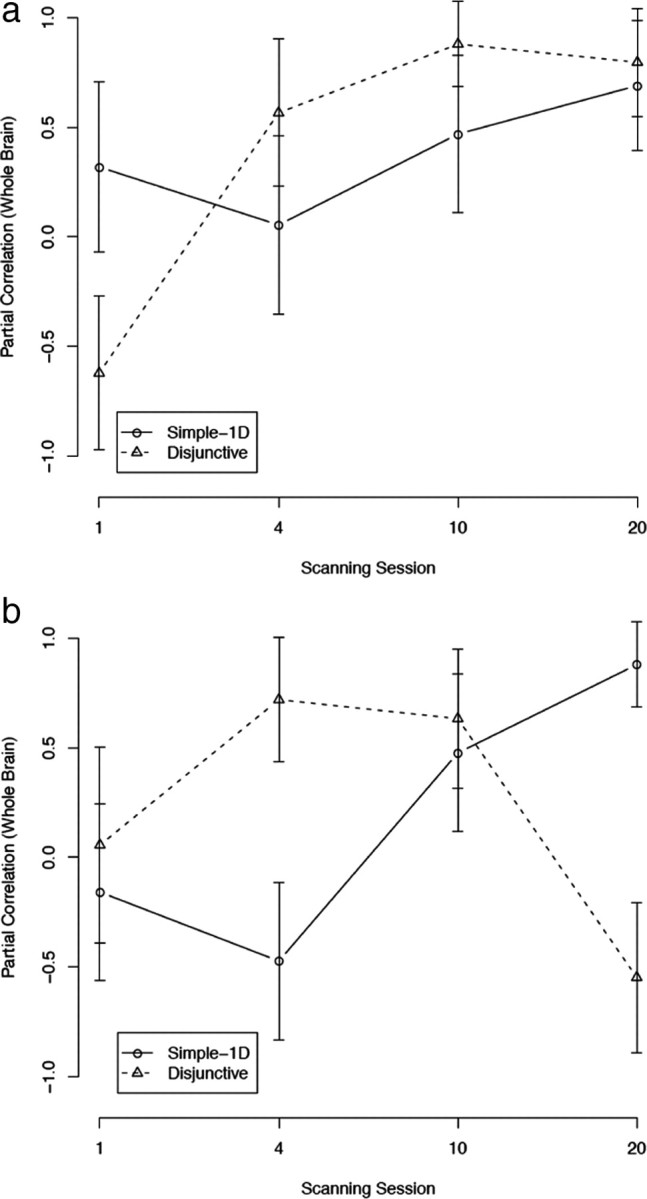
Partial correlations between premotor cortex activation and accuracy (with whole-brain activation partialled out). a, Ventral premotor cortex (PMv). b, Dorsal premotor cortex (PMd). Error bars are SEs.
Discussion
This research explored the effects of overtraining on brain activation. The main findings are as follows: (1) cortical activation remained approximately constant throughout training, (2) subcortical activation increased with practice (i.e., more voxels were activated in the striatum), and (3) only cortical activation was positively correlated with response accuracy after extensive training. These findings have important implications for the interpretation of future research on automaticity.
What is the role of the striatum in the development of automaticity?
The correlation analyses suggest that the striatum did not play a significant role in mediating the behavior after extensive training. This was supported by nonpositive correlations between striatal activation and accuracy and is consistent with the study by Muhammad et al. (2006), who found that rule-selective cells in the striatum did not mediate rule-guided behavior after extensive practice. So, what is the role of the striatum? Ashby et al. (2007) hypothesized that one of the roles of the striatum in the development of automaticity is to train corticocortical connections between higher-level sensory areas and relevant premotor areas. Although Ashby et al. did not address the issue of rule-based categorization, Helie and Ashby (2009) proposed a computational model that assumed a similar corticocortical pathway between high-level sensory areas and the premotor cortex for automatic application of abstract rules (thus bypassing the PFC). Although Helie and Ashby did not address the issue of initial rule learning, the data presented here suggest that the striatum might play a similar role with rule-guided behaviors.
What are the critical brain areas for rule-guided behavior after the development of automaticity?
The correlation analyses show that activations in the head of the caudate and the hippocampus were most highly correlated with successful rule application in session 1. These results are consistent with Seger and Cincotta (2006), who found activation in both of these areas during initial rule learning. However, the correlations between accuracy and activations in the head of the caudate and hippocampus quickly decreased after session 1 (Table 2) and became negative (Figs. 6b, 7a). This same pattern was observed in the thalamus (Table 2), thus making the main communication pathway between the striatum and cortex irrelevant for behavior after session 1 (Fig. 8).
The correlation analyses after session 1 suggest an increasingly important role of the VLPFC (Fig. 6a) and the premotor cortex (Fig. 9) in rule application. However, the changes in the location of these critical areas happened at different rates in the two conditions. In the simple-1D condition, only activation in the VLPFC was correlated with accuracy during session 4. PMv and PMd activation became essential for rule application only in later scanning sessions. In the disjunctive rule condition, the VLPFC and the PMd were both important in producing rule-guided behavior in session 4. After session 4, the involvement of the PMd decreased and became negative, whereas the involvement of the PMv kept increasing and became highly significant (and positive). These results are consistent with the study by Muhammad et al. (2006), who found rule-selective cells in the prefrontal and premotor cortices.
Putting it all together: a new theory of automaticity in rule-based categorization
One speculative but intriguing interpretation of these data is that rule application appears to be initially mediated by a network that depends heavily on the head of the caudate, followed by the VLPFC after moderate training, and the premotor cortex after extensive training. The shift from the head of the caudate to the VLPFC is consistent with the study by Pasupathy and Miller (2005), who found that both the caudate and the PFC were involved in learning, but that the caudate learned faster and sooner than the PFC. According to Pasupathy and Miller, the main role of the caudate is to train a stable representation in the PFC. Because the PFC is thought to be involved in abstract rule representation (Wallis et al., 2001), this stage may correspond to the abstraction of a more general rule (Sun et al., 2001, 2005; Miller and Buschman, 2008).
Once the rule-related activation has become cortical, it appears to move gradually in a caudal direction toward the premotor cortex. This is suggested by the magnitude of the correlations between accuracy and VLPFC and PMv activations, as well as by the first session where the correlations become statistically significant (activation of the VLPFC was first significantly correlated with accuracies in session 4, whereas PMv activation was first significantly correlated with accuracies in session 10). This gradual shift from the prefrontal to the premotor cortex is consistent with the study by Helie and Ashby (2009), who proposed a neurocomputational model in which the PFC is used to train the premotor cortex for automatic rule application. In the model by Helie and Ashby, the automatic corticocortical rule application pathway is a direct link between a high-level sensory area (representing the stimulus) and the premotor cortex (representing the rule/response) [as observed by Pollmann and Maertens (2005)]. The Helie and Ashby model has been used to simulate data from the studies by Muhammad et al. (2006) and Wallis and Miller (2003).
This result is also consistent with a rostrocaudal organization of the PFC (Christoff and Gabrieli, 2000; Bunge and Zelazo, 2006). According to this hypothesis, most subregions of the PFC can be used for rule representation, but more rostral subregions represent more abstract rules, whereas more caudal subregions represent more concrete rules. Because automaticity research suggests that rules become more concrete (or “procedural”) with practice (Moors and De Houwer, 2006), having more caudal regions involved in rule application after the development of automaticity is also consistent with many behavioral results (for review, see Moors and De Houwer, 2006). Some of these behavioral results were also observed after overtraining in the present study, including an interference that appeared when the response keys were switched and a dual-task interference that disappeared (Helie et al., 2010).
Outstanding results
In the preceding subsection, it was argued that the VLPFC is essential for rule application in session 4 and that the rule-related activation moved in a caudal direction toward the premotor cortex (which was responsible for rule application in sessions 10 and 20). If this is the case, then why are the correlations between accuracy and VLPFC activation not decreasing in sessions 10 and 20 (as was the case for the head of the caudate)? We hypothesize that the VLPFC has a dual role in perceptual categorization: (1) rule representation (as argued above) and (2) visual representation. Many studies have found visual representations of categorically relevant information in the VLPFC (Everling et al., 2006; Muhammad et al., 2006; Freedman, 2008). This interpretation is supported by the absence of activation in the inferotemporal cortex in either condition in any scanning session (the 90th percentiles of all percentage signal changes were <0.03; NS). Although the role of the VLPFC in rule representation might decrease in sessions 10 and 20 (because of a caudal shift), the role of the VLPFC in visual representation might remain important throughout the experiment. This hypothesized double role of the VLPFC may account for the high correlations between accuracy and activation after session 4. Even so, this experiment does not provide a strong test of this dual-role hypothesis, so more research is needed.
A second outstanding issue concerns the correlations between accuracy and premotor activation in session 20. Figure 9 suggests that the PMv is important for rule application in both conditions but that the PMd is only important for the simple-1D condition. An extensive review of the literature by Hoshi and Tanji (2007) suggests that the PMv is more involved in the spatial planning of movements, whereas the PMd is more involved in the motor representation of movements. Hence, in keeping with the notion that rule application becomes more concrete with the development of automaticity (Moors and De Houwer, 2006; Helie et al., 2010), we hypothesize a ventrodorsal organization of rule representations in the premotor cortex (Yin and Knowlton, 2006). Accordingly, more automatized rules would be represented in the PMd, whereas less automatized rules would be represented in the PMv. This is consistent with the study by Muhammad et al. (2006), who found rule-selective cells in the PMd after more than a year of practice. In the present experiment, the simple-1D condition was initially easier, had a higher button switch cost (suggesting more automaticity) (Helie et al., 2010), and had a high correlation between accuracy and PMd activation. In contrast, the disjunctive rule condition was initially more difficult, had a smaller button switch cost, and only had a high correlation between accuracy and PMv activation. Additional research is needed to test whether accuracy in the disjunctive rule condition would become correlated with PMd activation after more extensive practice.
Concluding remarks
This article presents fMRI results of extensive practice in a rule-based perceptual categorization task. The results suggest that, although subcortical activation increased with practice (i.e., there were more activated voxels), automatic rule-based performance was mainly mediated by cortical areas. In addition, concrete categorization rules seem to be learned initially in a network that depends heavily on the head of the caudate, but are then reencoded more abstractly in the VLPFC (rostral), and later reencoded more concretely in the premotor cortex (caudal). The results also suggest that, whereas the PFC follows a rostrocaudal organization (from abstract to concrete rule representations), the premotor cortex may follow a ventrodorsal organization (from less to more automatized rule representations). Additional research is needed to substantiate these findings.
Footnotes
This work was supported in part by the U.S. Army Research Office through the Institute for Collaborative Biotechnologies under Grant W911NF-07-1-0072. We thank Kyle Liban, Melissa Morrison, and Alecia M. Moser for their help with data collection. We also thank Sarah Kaufman for her help with the data analysis.
References
- Ashby FG, Lee WW. Predicting similarity and categorization from identification. J Exp Psychol Gen. 1991;120:150–172. doi: 10.1037//0096-3445.120.2.150. [DOI] [PubMed] [Google Scholar]
- Ashby FG, Maddox WT. Human category learning. Annu Rev Psychol. 2005;56:149–178. doi: 10.1146/annurev.psych.56.091103.070217. [DOI] [PubMed] [Google Scholar]
- Ashby FG, Valentin VV. Multiple systems of perceptual category learning: theory and cognitive tests. In: Cohen H, Lefebvre C, editors. Handbook of categorization in cognitive science. Oxford: Elsevier; 2005. pp. 547–572. [Google Scholar]
- Ashby FG, Alfonso-Reese LA, Turken AU, Waldron EM. A neuropsychological theory of multiple systems in category learning. Psychol Rev. 1998;105:442–481. doi: 10.1037/0033-295x.105.3.442. [DOI] [PubMed] [Google Scholar]
- Ashby FG, Ennis JM, Spiering BJ. A neurobiological theory of automaticity in perceptual categorization. Psychol Rev. 2007;114:632–656. doi: 10.1037/0033-295X.114.3.632. [DOI] [PubMed] [Google Scholar]
- Brainard DH. Psychophysics software for use with MATLAB. Spat Vis. 1997;10:433–436. [PubMed] [Google Scholar]
- Bunge SA, Wallis JD, editors. New York: Oxford UP; 2008. Neuroscience of rule-guided behavior. [Google Scholar]
- Bunge SA, Zelazo PD. A brain-based account of the development of rule use in childhood. Curr Dir Psychol Sci. 2006;15:118–121. [Google Scholar]
- Christoff K, Gabrieli JDE. The frontopolar cortex and human cognition: evidence for a rostrocaudal hierarchical organization within the human prefrontal cortex. Psychobiology. 2000;28:168–186. [Google Scholar]
- Everling S, Tinsley CJ, Gaffan D, Duncan J. Selective representation of task-relevant objects and locations in the monkey prefrontal cortex. Eur J Neurosci. 2006;23:2197–2214. doi: 10.1111/j.1460-9568.2006.04736.x. [DOI] [PubMed] [Google Scholar]
- Freedman DJ. Exploring the roles of the frontal, temporal, and parietal lobes in visual categorization. In: Bunge SA, Wallis JD, editors. Neuroscience of rule-guided behavior. New York: Oxford UP; 2008. pp. 391–418. [Google Scholar]
- Helie S, Ashby GF. A neurocomputational model of automaticity and maintenance of abstract rules. Proceedings of the International Joint Conference on Neural Networks; Atlanta, GA: IEEE; 2009. pp. 1192–1198. [Google Scholar]
- Helie S, Waldschmidt JG, Ashby FG. Automaticity in rule-based and information-integration categorization. Atten Percept Psychophys. 2010;72:1013–1031. doi: 10.3758/APP.72.4.1013. [DOI] [PubMed] [Google Scholar]
- Hoshi E, Tanji J. Distinctions between dorsal and ventral premotor areas: anatomical connectivity and functional properties. Curr Opin Neurobiol. 2007;17:234–242. doi: 10.1016/j.conb.2007.02.003. [DOI] [PubMed] [Google Scholar]
- Jenkinson M, Bannister P, Brady M, Smith S. Improved optimisation for the robust and accurate linear registration and motion correction of brain images. Neuroimage. 2002;17:825–841. doi: 10.1016/s1053-8119(02)91132-8. [DOI] [PubMed] [Google Scholar]
- Miller EK, Buschman TJ. Rules through recursion: how interactions between the frontal cortex and basal ganglia may build abstract, complex rules from concrete, simple ones. In: Bunge SA, Wallis JD, editors. Neuroscience of rule-guided behavior. New York: Oxford UP; 2008. pp. 419–440. [Google Scholar]
- Moors A, De Houwer J. Automaticity: a theoretical and conceptual analysis. Psychol Bull. 2006;132:297–326. doi: 10.1037/0033-2909.132.2.297. [DOI] [PubMed] [Google Scholar]
- Muhammad R, Wallis JD, Miller EK. A comparison of abstract rules in the prefrontal cortex, premotor cortex, inferior temporal cortex, and striatum. J Cogn Neurosci. 2006;18:1–16. doi: 10.1162/jocn.2006.18.6.974. [DOI] [PubMed] [Google Scholar]
- Newell A, Rosenbloom PS. Mechanisms of skill acquisition and the law of practice. In: Anderson JR, editor. Cognitive skills and their acquisition. Hillsdale, NJ: Erlbaum; 1981. pp. 1–55. [Google Scholar]
- Pasupathy A, Miller EK. Different time courses of learning-related activity in the prefrontal cortex and the striatum. Nature. 2005;433:873–876. doi: 10.1038/nature03287. [DOI] [PubMed] [Google Scholar]
- Picard N, Strick PL. Imaging the premotor areas. Curr Opin Neurobiol. 2001;11:663–672. doi: 10.1016/s0959-4388(01)00266-5. [DOI] [PubMed] [Google Scholar]
- Poldrack RA, Packard MG. Competition among multiple memory systems: converging evidence from animal and human brain studies. Neuropsychologia. 2003;41:245–251. doi: 10.1016/s0028-3932(02)00157-4. [DOI] [PubMed] [Google Scholar]
- Pollmann S, Maertens M. Shift of activity from attention to motor-related brain areas during visual learning. Nat Neurosci. 2005;8:1494–1496. doi: 10.1038/nn1552. [DOI] [PubMed] [Google Scholar]
- Seger CA, Cincotta CM. Dynamics of frontal, striatal, and hippocampal systems during rule learning. Cereb Cortex. 2006;16:1546–1555. doi: 10.1093/cercor/bhj092. [DOI] [PubMed] [Google Scholar]
- Serences JT. A comparison of methods for characterizing the event-related BOLD timeseries in rapid fMRI. Neuroimage. 2004;21:1690–1700. doi: 10.1016/j.neuroimage.2003.12.021. [DOI] [PubMed] [Google Scholar]
- Sun R, Merrill E, Peterson T. From implicit skills to explicit knowledge: a bottom-up model of skill learning. Cogn Sci. 2001;25:203–244. [Google Scholar]
- Sun R, Slusarz P, Terry C. The interaction of the explicit and the implicit in skill learning: a dual-process approach. Psychol Rev. 2005;112:159–192. doi: 10.1037/0033-295X.112.1.159. [DOI] [PubMed] [Google Scholar]
- Vogt BA. Pain and emotion interactions in subregions of the cingulate gyrus. Nat Rev Neurosci. 2005;6:533–544. doi: 10.1038/nrn1704. [DOI] [PMC free article] [PubMed] [Google Scholar]
- Wallis JD, Miller EK. From rule to response: neuronal processes in the premotor and prefrontal cortex. J Neurophysiol. 2003;90:1790–1806. doi: 10.1152/jn.00086.2003. [DOI] [PubMed] [Google Scholar]
- Wallis JD, Anderson KC, Miller EK. Single neurons in prefrontal cortex encode abstract rules. Nature. 2001;411:953–956. doi: 10.1038/35082081. [DOI] [PubMed] [Google Scholar]
- Yin HH, Knowlton BJ. The role of the basal ganglia in habit formation. Nat Rev Neurosci. 2006;7:464–476. doi: 10.1038/nrn1919. [DOI] [PubMed] [Google Scholar]