

Abstract
Nitric oxide (NO) is a signaling molecule that is synthesized in a range of tissues by the NO synthases (NOSs). In the immature nervous system, the neuronal isoform of NOS (NOS1) is often expressed during periods of axon outgrowth and elaboration. However, there is little direct molecular evidence to suggest that NOS1 influences these processes. Here we address the functional role of NOS1 during in vivo zebrafish locomotor circuit development. We show that NOS1 is expressed in a population of interneurons that lie close to nascent motoneurons of the spinal cord. To determine how this protein regulates spinal network assembly, we perturbed NOS1 expression in vivo with antisense morpholino oligonucleotides. This treatment dramatically increased the number of axon collaterals formed by motoneuron axons, an effect mimicked by pharmacological inhibition of the NO/cGMP signaling pathway. In contrast, exogenous elevation of NO/cGMP levels suppressed motor axon branching. These effects were not accompanied by a change in motoneuron number, suggesting that NOS1 does not regulate motoneuron differentiation. Finally we show that perturbation of NO signaling affects the ontogeny of locomotor performance. Our findings provide evidence that NOS1 is a key regulator of motor axon ontogeny in the developing vertebrate spinal cord.
Introduction
The integration of neurons into functional networks is a dynamic process involving the addition, stabilization, and elimination of axodendritic structures (Luo, 2002). A fundamental goal of neuroscience is to understand the signaling pathways regulating these events. Although considerable progress has been made toward this goal (for review, see Sanes and Yamagata, 2009), the precise mechanisms remain to be fully elucidated.
Nitric oxide (NO) has recently emerged as a potentially critical signaling molecule during axonogenesis. In neurons, NO is biosynthesized by NO synthases (NOSs) and acts as a diffusible messenger, inducing biochemical changes in neighboring neurons through activation of soluble guanylyl cyclase (sGC) and nitrosylation of cysteine residues (Ahern et al., 2002). As NOS isoforms are often expressed in the developing CNS (Bredt and Snyder, 1994; Roskams et al., 1994; Brüning et al., 1996; Truman et al., 1996; Ball and Truman, 1998; Poon et al., 2003; Holmqvist et al., 2004), it has been proposed that NO signaling has critical functions during neuronal morphogenesis.
A number of pharmacological studies support the premise that NO regulates development of vertebrate and invertebrate axons (Hess et al., 1993; Roskams et al., 1994; Cramer et al., 1996; Rentería and Constantine-Paton, 1996; Hindley et al., 1997; Gibbs and Truman, 1998; Ernst et al., 1999, 2000; Van Wagenen et al., 1999; Cogen and Cohen-Cory, 2000; Seidel and Bicker, 2000; Van Wagenen and Rehder, 2001; Yamazaki et al., 2001, 2006; He et al., 2002; Trimm and Rehder, 2004; Welshhans and Rehder, 2005, 2007). Moreover, there is direct molecular evidence that NOS isoforms are required for development of mouse retinal axons: Double knock-out of NOS1 and NOS3, the two constitutively active NOS isoforms in mammals, disrupts retinocollicular axon refinement (Mize et al., 1998; Wu et al., 2000a,b). However, it is currently not known whether NOS proteins have axonogenic functions in other CNS regions, despite their widespread expression.
To better understand the role of NOS during vertebrate axonogenesis, we have used molecular and pharmacological approaches to perturb NOS activity during zebrafish ontogeny. Previous studies indicate that unlike mammals, constitutively active isoforms of NOS are coded by a single gene in zebrafish [NOS1 (North et al., 2009)] that is expressed throughout the immature CNS (Poon et al., 2003; Holmqvist et al., 2004). Here we show that NOS1 is expressed in a discrete population of interneurons of the developing zebrafish spinal cord. Moreover, we demonstrate that abrogation of NOS1 has a striking effect on spinal motoneuron morphogenesis: Antisense NOS1 knockdown dramatically increases motor axon collateral numbers, an effect mimicked by pharmacological inhibitors of NOS/sGC. In contrast, exogenous elevation of NO/cGMP has the converse effect. Finally, we provide evidence that endogenous NO signaling fine-tunes the ontogeny of locomotor behavior. These findings demonstrate key roles for NOS1 during motor axon morphogenesis and network integration.
Materials and Methods
Zebrafish maintenance.
Adult zebrafish were maintained according to established procedures (Westerfield, 1994) and in compliance with the Animals (Scientific Procedures) Act 1986. Embryos were harvested and raised in egg water (Westerfield, 1994) at 28.5°C until the required developmental stage. Staging was performed in accordance with Kimmel et al. (1995).
Pharmacological reagents.
The following drugs were used: l-arginine analog, NG-nitro-l-arginine methyl ester (l-NAME, Sigma), 2-(4-carboxyphenyl)-4,4,5,5-tetramethylimidazoline-1-oxyl-3-oxide (c-PTIO, Tocris Bioscience), diethylene triamine-NO (DETA-NO, Sigma), 8-(4-chlorophenylthio)-guanosine 3′5′ cyclic monophosphate sodium salt [8-(4-chlorophenylthio)-cGMP, Sigma], 1H-[1,2,4]oxadiazolo[4,3-a] quinoxalin-1-one (ODQ, Sigma), and ZM323881 hydrochloride (Tocris Bioscience).
Drug application.
Fifty nanoliters of l-NAME (1 mm), c-PTIO (900 μm), or ODQ (50 μm) dissolved in Evans physiological saline [composition (in mm): 134 NaCl, 2.9 KCl, 2.1 CaCl2, 1.2 MgCl2, and 10 HEPES, pH 7.6] containing fast green (0.2%) were microinjected into the yolk sac of 24 h postfertilization (hpf) fish. Injections were repeated every 24 h until the required developmental stage. Between injections, embryos were incubated at 28.5°C.
To expose embryos to DETA-NO (500 μm) and 8-(4-chlorophenylthio)-cGMP (250 μm-500 μm), embryos at 24 hpf were placed in egg water solution, pH 7.4, containing drug at the desired concentration and subsequently incubated at 28.5°C until the required developmental stage. Based on previous studies, the steady-state NO concentration in DETA-NO experiments was estimated to be ∼250 nm (Ridnour et al., 2005). To ameliorate the effects of drug depletion, incubation solution was exchanged with fresh media every 24 h. In experiments where DETA-NO was added at later stages, fish were raised in normal egg water until 48 hpf and then transferred to egg water containing DETA-NO. For rescue experiments, 24 hpf embryos were injected with ODQ (as described above) 1 h before exposure to DETA-NO.
To prevent intersegmental blood vessel formation, 23 hpf embryos were incubated in egg water containing 2 μm ZM323881 until the required developmental stage. To confirm that intersomitic blood vessels were ablated, the pericardial sack was injected with rhodamine dextran (10,000 molecular weight, Sigma) before fluorescent imaging. Subsequently, fish were fixed and processed as detailed below.
Antisense morpholino oligonucleotide injections.
Antisense morpholino oligonucleotides (AMOs) were obtained from Gene Tools. The NOS1 AMO (sequence: 5′-ACGCTGGGCTCTGATTCCTGCATTG-3′) was designed to target the 5′ UTR of NOS1 mRNA. The control “mismatch” AMO (5′-ACGCTcGcCTCTcATTCgTcCATTG-3′) had 5 nt altered along its sequence. AMO injections were performed as previously described (Nasevicius and Ekker, 2000) with minor modifications: AMOs were dissolved in Evans physiological saline/0.2% fast green to a final concentration of 10–100 μm, and ∼3 nl of AMO was injected into the yolk/blastomere border of 1–4 cell stage embryos.
In situ hybridization.
Riboprobe construction: cDNA comprising a 1.2 kb gene sequence of zebrafish NOS1 mRNA (accession #: NP_571735) was used to construct RNA probes. Antisense probes were generated from NOS1 cDNA inserted into pGEM-T Easy vectors (Promega), which was linearized with Sal1 (Roche). Digoxigenin (DIG) probe labeling was conducted using T7 RNA polymerase (New England Biolabs) and DIG RNA labeling mix (Roche), as per the manufacturers' instructions. Riboprobe labeling was performed according to standard protocols (Nusslein-Volhard and Dahm, 2002). Subsequent to labeling, fish were cryosectioned (thickness, 20–30 μm) and imaged.
Immunohistochemistry and acetylcholine receptor staining.
Immunohistochemical methods were performed as previously described (McDearmid et al., 2006) with minor modifications. The following antibodies were used: mouse anti-znp1 [1:200; Developmental Studies Hybridoma Bank (DSHB), University of Iowa], mouse anti-zn8 (1:200; DSHB), mouse anti-islet1/2 (1:200; DSHB), mouse anti-SV2 (1:200; DSHB), rabbit anti-NOS1 (1:200; Abcam), mouse anti-serotonin (1:200; Abcam), mouse anti-glutamate (1:1000; AbCam), mouse anti-GABA (1:1000; Sigma), mouse anti-GFP (1:500; Roche), AlexaFluor 488 goat anti-mouse (1:500; Invitrogen), and AlexaFluor 568 goat anti-rabbit (1:500; Invitrogen). The majority of immunostaining experiments were performed on whole-mount or cryosectioned tissue, although to assist antibody penetrance for longitudinal NOS1, Islet, and 3A10 experiments, staining was conducted on isolated spinal tissue. For labeling of postsynaptic neuromuscular domains, fish were fixed and treated with collagenase (1 mg/ml; Sigma) before labeling of postsynaptic sites with rhodamine-conjugated α-bungarotoxin (Rh-α-BTX, Sigma; 10 μg/ml for 30 min). Subsequently, SV2 immunohistochemistry was performed as detailed above.
Stochastic green fluorescent protein labeling.
Random labeling of spinal neurons was conducted by injecting newly fertilized eggs with 50 ng/μl DNA construct that contained GFP fused with the neural-specific HuC promoter (Park et al., 2000) (a generous gift from Dr. T. Hawkins, UCL, London, UK). Embryos expressing GFP at 24 hpf were either injected with 1 mm l-NAME or left untreated. At 48 hpf, fish were processed for GFP immunohistochemistry, as detailed above.
Confocal image analysis.
Image acquisition was performed using an Olympus FV1000 confocal microscope and Olympus Fluoview FV1000 imaging software. Images were captured in z-sections at 1–3 μm increments. Axonal branch analysis was performed offline using the ImageJ plugin NeuronJ. Analysis was restricted to fascicles ventral to the spinal cord as labeling of spinal neuropil (dashed lines in Fig. 3F) precluded accurate examination of dorsal processes. Thus, unless otherwise stated, axon branches of the rostral and caudal primary motoneurons, as well as their associated secondary motor axon branches, would have been included for analysis. For fish at 48 hpf, branch patterns of three consecutive somites were analyzed per fish, while at 72 hpf, due to the density of branches present, analysis was limited to one somite.
Figure 3.
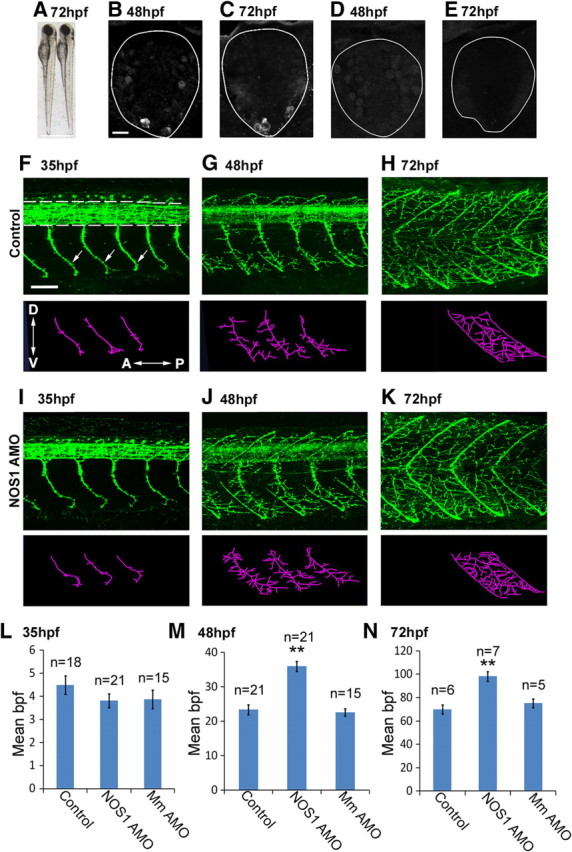
NOS1 AMOs increase motor axon collateral formation. A, Seventy-two hour postfertilization control (left) and NOS1 AMO-injected (right) larvae are morphologically indistinguishable. B, C, Transverse spinal sections immunostained with NOS1 antibodies at 48 hpf (B) and 72 hpf (C) reveal NOS1 labeling in the ventral spinal cord. D, E, NOS1 antibody staining is strongly reduced in NOS1 AMO-injected fish at 48 hpf (D) and at 72 hpf (E). F–K, Top, Lateral views of znp1 antibody staining of control (F–H) and NOS1 AMO-injected (I–K) fish at 35, 48, and 72 hpf. znp1 labels spinal neuropil (demarcated by dotted lines in F) and motor axons (F, arrows). Bottom, Stick tracings of motor axon tracts ventral to the spinal cord (derived from panels directly above). L–N, Bar charts depicting the mean number (±SEM) of axon branches per fascicle for control, NOS1, and mismatch (Mm) AMO at 35 (L), 48 (M), and 72 (N) hpf. Inset in F displays orientation of dorsal (D), ventral (V), anterior (A), and posterior (P) axes in current and all subsequent figures. Scale bars: A, 600 μm; B–E (in B), 10 μm; F–K (in F), 50 μm. **p ≤ 0.0005.
Colocalization analysis.
Colocalization of α-BTX- and SV2-labeled sites was determined with ImarisColoc software (Bitplane). For each analyzed somitic segment, three 75 × 75 pixel areas were selected that were evenly distributed from the ventral midline. These were thresholded and used for automated voxel colocalization analysis.
Kinematic analysis.
Swimming activity was filmed with a Basler Pilot video at a 200 Hz capture rate. Captured sequences of activity were analyzed offline using ImageJ. Tail beat frequency, velocity, and maximal bend amplitude of the first five cycles of each swimming episode were calculated as previously described (Budick and O'Malley, 2000).
Statistical analysis.
Results were calculated as means ± SEM. Statistical analysis was conducted using unpaired Student's t test.
Results
Spatiotemporal distribution of NOS1-expressing cells in the developing spinal cord
Previous studies have shown that by ∼55 hpf, cells of the ventral spinal cord express NOS1 (Poon et al., 2003; Holmqvist et al., 2004). However, the time at which transcription begins is not known. We therefore used antisense RNA probes to examine NOS1 distribution between 24 and 72 hpf, a period that encompasses the extension and elaboration of spinal motoneuron axons (Myers et al., 1986). No staining was found in the 24 hpf embryo spinal cord (not shown). In contrast, at 30 hpf, NOS1 transcript was observed in dorsolaterally located cells (Fig. 1A) (n = 5 embryos). Staining in this region was rare, with no more than three cells labeled throughout the entire length of the spinal cord.
Figure 1.

NOS1 expression in the developing spinal cord. A–E, NOS1 mRNA expression in spinal cross sections. At 30 hpf (A), transcript localizes solely in dorsal spinal cells (arrowhead). At 35 (B) and 40 (C) hpf, NOS1 is present in ventral spinal cells (arrowhead). At 48 (D) and 72 (E) hpf, intensity of ventral expression increases. F, Longitudinal images of spinal cord tissue stained with NOS1 probes in 35 (top), 48 (middle), and 72 (bottom) hpf fish. Arrowheads indicate regions of NOS1 expression. G, Whole NOS1 riboprobe-stained embryo at 48 hpf. Expression is restricted to the brain (bracket) and spinal cord (arrows). H, Sectioned trunk tissue of 72 hpf fish labeled with NOS1 probes. Expression occurs in spinal cord (SC) but not muscle (M), notochord (N), or vasculature (arrow points to dorsal aorta). P, Pigmented epithelial cell. I, J, NOS1-immunolabeled cells (arrows) in spinal sections of 48 and 72 hpf fish. K, Longitudinal sections of ventral spinal tissue showing NOS1-immunopositive cells (red) located ventral to the Mauthner axon (labeled with neurofilament marker 3A10, green). L, M, Longitudinal images of NOS1-positive cells in the ventral spinal cord at 48 and 72 hpf. N, High-magnification images of nitrergic cells. Asterisks denote processes arising from immunoreactive cell bodies (arrowheads). D, Dorsal; V, ventral; L, lateral; M, medial; A, anterior; P, posterior. Dotted lines in F and K–M delimit the ventral border of the spinal cord. Scale bars: A–E (in A), F, H, K–M, 15 μm; G, 100 μm; I, J (in I), N, 8 μm.
At 35 hpf, a more prevalent population of NOS1-positive cells began to emerge in the ventral spinal cord (Fig. 1B,F) (n = 4 embryos). These were far more abundant than dorsal cells, typically occurring in each segment of the rostral spinal cord (somites 1–7). From 40 hpf onwards, transcript was no longer observed in the dorsal cells but remained prevalent in ventral regions, where staining could be observed through to somite 12 (Fig. 1C) (n = 4 embryos). At 48 hpf (Fig. 1D,F,G) (n = 8 embryos) and 72 hpf (Fig. 1E,F) (n = 8 larvae), an increasing number of cells expressed transcript at the ventral border, forming a near-continuous band of staining in all but the caudalmost spinal regions. In fitting with previous transcript studies (Poon et al., 2003; Holmqvist et al., 2004), we did not observe NOS1 expression in either the muscle or vascular tissue of 24–72 hpf fish (Fig. 1G,H).
Using immunohistochemical methods, we examined the morphology of nitrergic spinal cells, focusing on ventral populations as these develop at the onset of motor axon branch formation (compare Figs. 1B, 3F). In fitting with transcript studies (Poon et al., 2003; Holmqvist et al., 2004) (Fig. 1), strongly immunoreactive cell bodies were found at the ventral border of the spinal cord at 48 hpf (Fig. 1I) (n = 10 embryos) and 72 hpf (Fig. 1J) (n = 21 embryos). These cells had morphological characteristics of interneurons with cell bodies situated directly below the Mauthner axon [a major reticulospinal process located in the ventral spinal cord (Fig. 1K)]. Processes of nitrergic neurons formed a loose fascicle immediately dorsal to their somata (Fig. 1L,M). Closer inspection of individual neurons revealed the majority had a single, caudally projecting process (Fig. 1N, top and middle panels) (n = 11 cells), although a smaller proportion were found to have short bipolar processes (Fig. 1N, bottom) (n = 4 cells).
Spatial relationship between nitrergic interneurons and known ventral cell classes
At present, only Kolmer–Agduhr (KA), ventral medial (VeMe), and ventral serotonergic (VeSe) cells are known to have somata ventral to the Mauthner axon (Fig. 2A) (for review, see McLean and Fetcho, 2008). VeMe and VeSe neurons have descending axons and express glutamate and serotonin, respectively (Hale et al., 2001; Higashijima et al., 2004; McLean and Fetcho, 2004), whereas KA neurons have ascending axons and express GABA (Bernhardt et al., 1992; Martin et al., 1998). To determine whether any of these cell types were nitrergic, we costained NOS1-immunolabeled trunk sections with markers for KA (anti-GABA) (Fig. 2B) (n = 4 embryos), VeMe (anti-glutamate) (Fig. 2C) (n = 10 embryos), or VeSe (anti-serotonin) (Fig. 2D,E) (n = 19 embryos) neurons. NOS1 did not colocalize with any of these transmitters, suggesting that they represent a distinct population of spinal interneuron. Quantification of each cell class (by counting immunostained neurons below the Mauthner axon) suggested that nitrergic neurons were approximately equal in number to VeMe neurons, but occurred more frequently than VeSe and KA cells (Fig. 2F).
Figure 2.

Spatial relationship between nitrergic cells and known cell classes of the ventral spinal cord. A, Diagram depicting cell classes of the ventral spinal cord. Serotonergic VeSe (red), glutamatergic VeMe (green), GABAergic KA (dark blue), and ventral nitrergic (VeNi; light blue) somata are found ventral to the M-axon. Motoneuron (Mn) somata are dorsal to this tract. B–D, Transverse ventral spinal cord sections of 72 hpf fish stained with NOS1 (red) and GABA (B, green), glutamate (C), and serotonin (D). E, Z-stack of region highlighted in D rotated through 90° reveals spatial separation between NOS1 and serotonin immunoreactivity. F, Relative proportions of glutamate- (2 cells/30 μm), GABA- (3 cells/30 μm), serotonin- (1 cell/30 μm), and NOS1- (3 cells/30 μm) immunoreactive cells in ventral spinal tissue. G, H, Longitudinal (G) and transverse (H) images of a 48 hpf spinal cord stained with islet1/2 (green) and NOS1 (red). Islet1/2 marks motoneuron (MN) and Rohon–Beard (RB) sensory nuclei. I, Longitudinal image of a GFP-labeled primary motoneuron axon (green) contacting NOS1-immunoreactive processes (red). Solid lines in B–E and H mark lateral margins of ventral spinal cord. Dashed lines in G and I delimit ventral border of spinal cord. D, Dorsal; V, ventral; A, anterior; P, posterior. Scale bars: B–E, H–I, 8 μm; G, 25 μm.
To characterize the spatial relationship between nitrergic interneurons and motoneurons, spinal sections were costained with antibodies for NOS1 and islet1/2, a marker of motoneuron nuclei and Rohon–Beard sensory neurons (Inoue et al., 1994). The nascent motoneuron population was situated immediately dorsal to nitrergic cells, separated from them by a NOS1-immunopositive fascicle (Fig. 2G–I) (n = 9). By stochastically expressing GFP in subsets of spinal neuron and immunostaining for NOS1, we were able to determine that motor axons coursed close to nitrergic neurons as they extended ventrally toward their spinal exit points (Fig. 2I) (n = 3).
Antisense disruption of NOS1 elevates motor axon branch numbers
As nitrergic interneurons come into close apposition with motoneuron axons during periods of neuromuscular innervation, we wished to determine whether NO signaling influenced motor axon development. To this end, we abrogated NOS1 expression throughout early development with antisense morpholino oligonucleotides (Nasevicius and Ekker, 2000). Larvae injected with NOS1 AMO were morphologically indistinguishable from wild type (Fig. 3A) (n = 7). Imaging of immunostained spinal cord sections revealed, as expected, a loss of NOS1 expression at 48 hpf (Fig. 3, compare D, B) (n = 12) and 72 hpf (Fig. 3, compare E, C) (n = 12). In contrast, embryos injected with a control “mismatch” AMO failed to disrupt NOS1 staining (data not shown). Together these results demonstrate that NOS1 AMOs diminish NOS1 protein expression without causing gross morphological perturbations.
Two populations of motoneuron are found in the zebrafish spinal cord (Myers et al., 1986; Westerfield et al., 1986). Primary motoneurons are few in number (typically three per somite), undergo axonogenesis at ∼17 hpf, and innervate the majority of muscle fibers in a given territory. Secondary motoneurons are far more numerous, undergo axonogenesis at ∼26 hpf, and innervate only 2–3 muscle fibers each. To assess the developmental impact of NOS1 perturbation on axons of both motoneuron populations, we used znp1 antibodies, a pan-specific marker of primary and secondary motor axons (Melançon et al., 1997). While motor axon branches of NOS1 AMO-injected fish were similar to controls at 35 hpf (Fig. 3, compare I, F; Fig. 3L), striking changes occurred on the second and third days of development. Here, AMO injection increased the collateral numbers by 57% at 48 hpf (Fig. 3, compare J, G; Fig. 3M) [control: 23 ± 1.5 branches per fascicle (bpf) vs AMO: 36 ± 1.5 bpf, p = 1 × 10⁻⁴] and 40% at 72 hpf (Fig. 3, compare K, H; Fig. 3N) (control: 70 ± 3.9 bpf vs AMO: 98 ± 4.2 bpf, p = 4 × 10⁻⁴). Mismatch AMO-injected fish failed to display this phenotype, exhibiting branch numbers that were not significantly different from control animals (Fig. 3L–N) (35 hpf: 3.9 ± 0.4 bpf, p = 0.20; 48 hpf: 22.6 ± 1.1 bpf, p = 0.60; 72 hpf: 75 ± 3.9 bpf, p = 0.40).
To further examine this effect, we compared the number and length of first- to fifth-order branches arising from the primary fascicle of control and NOS1 AMO-injected fish at 48 hpf. We defined first-order branches as those arising from the primary axon tract; second-order branches as those originating from a first-order axon branch; and so on. The length of each branch was not affected by NOS1 AMOs (Table 1). However, the total number of first- to fourth-order branches increased markedly. Fifth-order branches were not significantly altered, although this is likely due to a lack of quinary branches at the stages used for study.
Table 1.
Perturbation of NOS1 levels affects branch addition but not length
| Branch order | Branch number |
Branch length (μm) |
||||
|---|---|---|---|---|---|---|
| Control | DETA-NO | NOS1 AMO | Control | DETA-NO | NOS1 AMO | |
| Primary | 10.8 ± 0.6 | 5.8 ± 0.4** | 14.9 ± 0.8** | 14.3 ± 0.7 | 11.8 ± 0.9 | 12.7 ± 0.6 |
| Secondary | 8.3 ± 0.8 | 3 ± 0.6** | 11.7 ± 0.7* | 9.3 ± 0.5 | 10.2 ± 0.7 | 9.5 ± 0.6 |
| Tertiary | 3.5 ± 0.5 | 1.3 ± 0.5* | 6.3 ± 0.5** | 8.3 ± 0.5 | 8.5 ± 0.9 | 8.4 ± 0.7 |
| Quaternary | 0.8 ± 0.1 | 0.2 ± 0.2* | 2.5 ± 0.5* | 8.8 ± 1.3 | 7.9 ± 1.0 | 10 ± 1.2 |
| Quinary | 1.5 ± 0.5 | 0.0 | 1.6 ± 0.2 | 6.3 ± 1.6 | 0.0 | 4.8 ± 1.0 |
Table indicating the number and length of first- to fifth-order branches per fascicle in 48 hpf control, DETA-treated, and NOS1 AMO-injected fish. All values are shown as mean ± SEM; n = 21 for each condition;
**p ≤ 0.0005,
*p ≤ 0.005.
Pharmacological abrogation of NO signaling mimics the effects of NOS1 perturbation
To confirm the specificity of phenotypes induced by NOS1 knockdown, we used pharmacological agents to perturb NO signaling. Exposure to the broad-spectrum NOS inhibitor l-NAME during development closely mimicked the NOS1 AMO phenotype: When compared to age-matched controls, l-NAME-treated fish had 39% more collaterals at 48 hpf (Fig. 4, compare E, B; Fig. 4K) (control: 23 ± 1.9 bpf vs l-NAME: 32 ± 0.9 bpf, p = 1 × 10⁻⁴) and 40% more collaterals at 72 hpf (Fig. 4, compare F, C; Fig. 4L) (control: 67 ± 2.5 bpf vs l-NAME: 94 ± 4.6 bpf, p = 1 × 10⁻⁴). Similarly, exposure to the NO scavenger c-PTIO increased branch numbers by 61% at 48 hpf (Fig. 4, compare H, B; Fig. 4K) (control: 23 ± 1.9 bpf vs c-PTIO: 37 ± 1.2 bpf, p = 1 × 10⁻⁴) and 40% at 72 hpf (Fig. 4, compare I, C; Fig. 4L) (control: 67 ± 2.5 bpf vs c-PTIO: 94 ± 3.3 bpf, p = 1 × 10⁻⁴).
Figure 4.
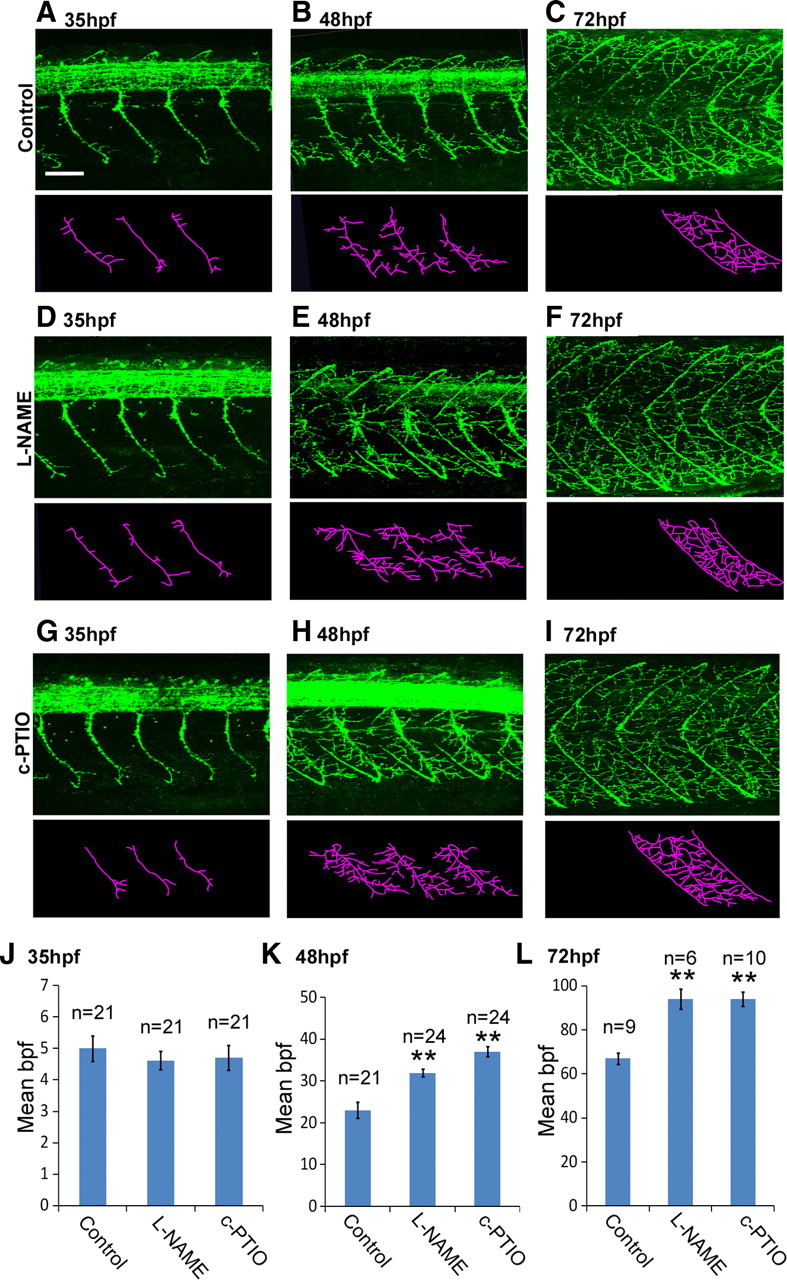
Pharmacological perturbation of NO increases motor axon branching. A–I, Top, Lateral views of znp1 antibody staining of control (A–C), l-NAME-injected (D–F), and c-PTIO-injected (G–I) fish at 35, 48, and 72 hpf. Bottom, Stick tracings of axon tracts ventral to the spinal cord (derived from panels directly above). J–L, Bar charts depicting average (±SEM) number of branches per fascicle for each experimental condition at 35 (J), 48 (K), and 72 (L) hpf. Scale bar (in A), 50 μm. **p ≤ 0.0005.
Primary, but not secondary, motoneurons are competent to NO signaling
To gain an insight into which motoneuron population was affected by NO, we selectively labeled secondary motor axons of c-PTIO and NOS1 AMO-injected fish with zn8 antibodies (Menelaou et al., 2008). As each secondary motoneuron innervates a small number of muscle fibers (Westerfield et al., 1986), few arborizations were observed in control fish (Fig. 5A) (n = 8). Similarly, imaging of c-PTIO (Fig. 5B) (n = 6) and NOS1 knockdown fish (Fig. 5C) (n = 6) demonstrated that disruption of NO biosynthesis had no impact on secondary motor axon branching.
Figure 5.

Perturbation of NO signaling does not affect secondary motor axon branching. A–C, Images of zn8-labeled secondary motoneuron fascicles of 72 hpf control- (A), c-PTIO- (B), and NOS1 AMO- (C) injected fish. Images are LUT inverted so that axon branches can be more readily observed. D, E, Top, Individual GFP-labeled primary (PMn; D) and secondary (SMn; E) motoneurons of control and l-NAME-treated fish at 48 hpf. Bottom, Stick tracings of individually labeled axons (derived from panels above). F, Mean number of axonal arbors occurring in individual primary and secondary motoneurons of control and l-NAME-injected fish. Scale bars: A (for A–C), D, E, 50 μm. *p ≤ 0.005.
To confirm that primary motor axons were uniquely sensitive to NO signaling, we stochastically expressed GFP in the spinal cord and screened for singly labeled motoneurons at 48 hpf. In control fish, primary and secondary motor axons had an average of 11.0 ± 0.5 and 3.7 ± 0.4 branches, respectively (Fig. 5D–F). l-NAME treatment increased primary motor axon branches to 25.3 ± 0.7 (p = 1 × 10⁻⁴) but had no significant effect on secondary motoneuron axons (4.3 ± 0.4 branches, p = 0.37) (Fig. 5D–F). These findings confirm that NO principally regulates primary motor axon branching.
Neuromuscular synapse numbers increase in NO-depleted zebrafish
We next asked whether the number of neuromuscular synapses increased when NO signaling was perturbed. To do this, control and l-NAME-treated fish at 72 hpf were costained with the presynaptic vesicular marker SV2 and the postsynaptic acetylcholine receptor marker Rh-α-BTX (Fig. 6A,B). Regions where these markers colocalized were considered to be putative synapses. A dramatic increase in SV2/Rh-α-BTX colocalization was observed in the muscle of l-NAME-treated fish (Fig. 6, compare A,C with B,D). Quantitative analysis revealed a 97% increase in colocalized domains within the muscle of l-NAME-treated fish (Fig. 6) (l-NAME (n = 6): 6.1 × 10⁴ ± 0.8 × 10⁴ vs control (n = 6): 3.1 × 10⁴ ± 0.3 × 10⁴ colocalized voxels, p = 1 × 10⁻³). These findings suggest that perturbation of NOS1 promotes neuromuscular synaptogenesis.
Figure 6.
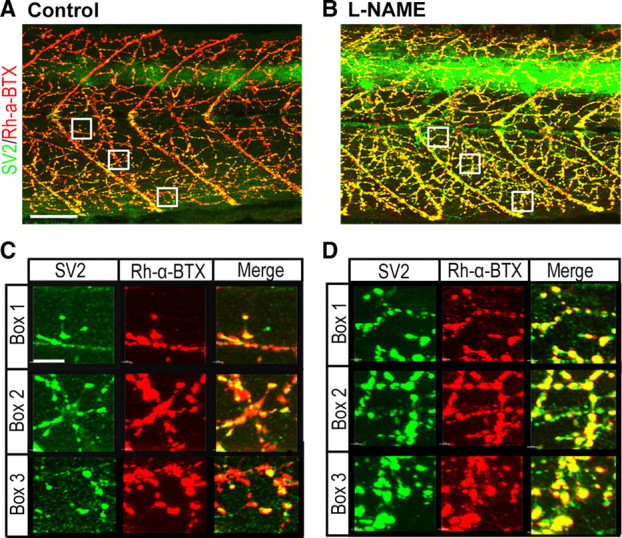
NOS inhibition increases the density of putative neuromuscular synapses. A, B, Merged images of SV2 (green)/Rh-α-BTX (red)-stained control (A) and l-NAME-injected (B) 72 hpf zebrafish trunks. Boxes demark regions selected for colocalization analysis in C and D. C, D, Magnified images of separate and merged SV2/Rh-α-BTX channels taken from boxes in A and B. Scale bars: A, B (in A), 50 μm; C, D (in C), 8 μm.
The NO donor DETA-NO inhibits motor axon branch addition
Next, to determine how elevated NO levels affect motor axon branch formation, we exposed developing zebrafish to the NO donor DETA-NO before processing for znp1 immunoreactivity. At 35 hpf, this drug significantly decreased branch numbers by 27% (Fig. 7, compare D, A; Fig. 7G) (control: 5 ± 0.4 bpf vs DETA-NO: 3.75 ± 0.3 bpf, p = 0.01). By the second and third days of development, DETA-NO had an even more pronounced effect, causing a 59% and 61% decrease in motor axon branches at 48 hpf (Fig. 7, compare E, B; Fig. 7H) (control: 23.4 ± 1.5 bpf vs DETA-NO: 9.7 ± 0.9 bpf, p = 1 × 10⁻⁴) and 72 hpf (Fig. 7, compare F, C; Fig. 7I) (control: 70 ± 3.9 bpf vs DETA-NO: 27.4 ± 1.7 bpf, p = 1 × 10⁻⁴), respectively. In contrast, incubation with NO-depleted DETA did not cause altered motor axon branch numbers (Fig. 7H) (control: 23.4 ± 1.5 bpf vs DETA: 26.9 ± 1.2 bpf, p = 0.06).
Figure 7.
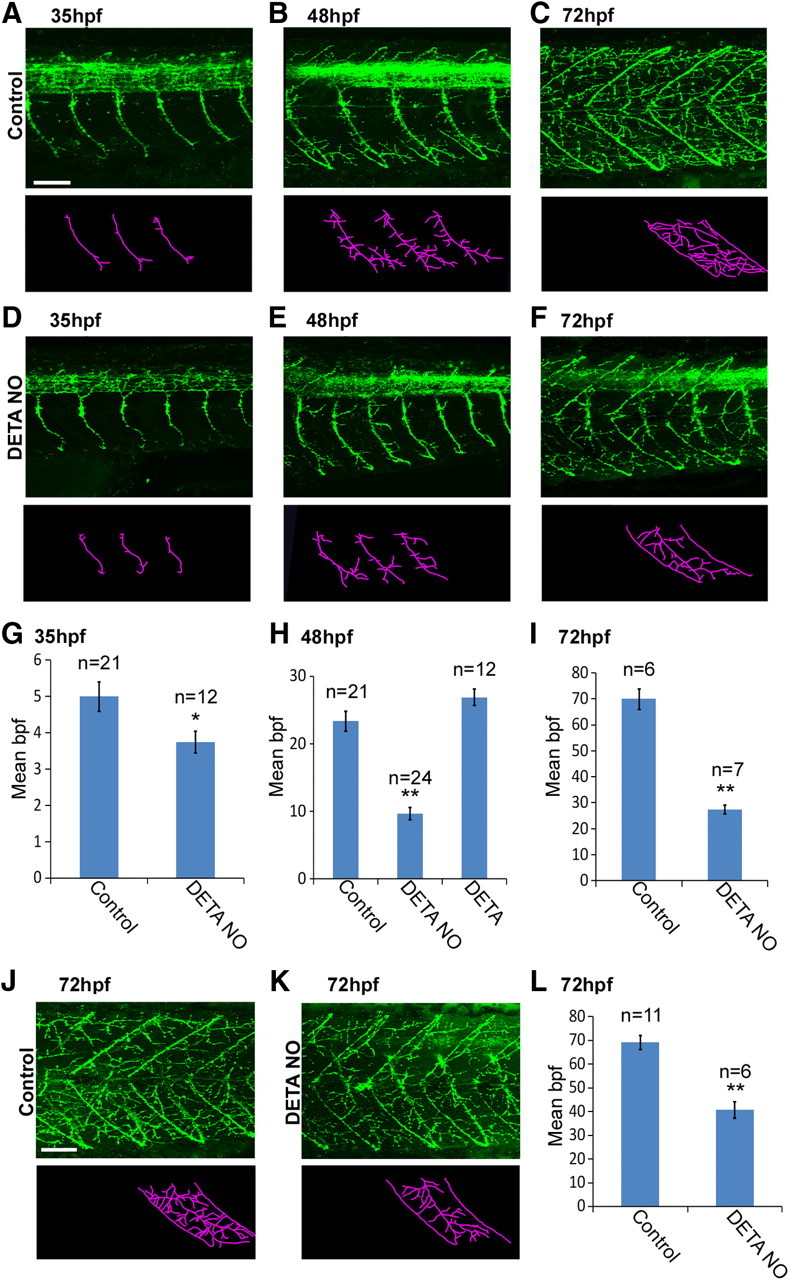
Exogenous elevation of NO decreases motor axon branch numbers. A–F, Top, Lateral views of znp1 antibody staining of control (A–C) and DETA-NO-treated (D–F) fish at 35, 48, and 72 hpf. Bottom, Stick tracings (derived from panels directly above) of axon tracts ventral to the spinal cord. G–I, Bar charts depicting the mean number (±SEM) of motoneuron axon branches per fascicle for control-, DETA-NO-, and DETA-depleted (DETA)-treated fish at 35 (G), 48 (H), and 72 (I) hpf. J, K, znp1 antibody staining of 72 hpf control fish (J) and an age-matched larvae exposed to DETA-NO between 48 and 72 hpf (K). L, Bar chart depicting average (± SEM) branch number per primary fascicle for J and K. Scale bars: A (for A–F), J (for J, K), 50 μm. **p ≤ 0.0005.
To examine whether exogenous NO slowed the rate of motor axon branch addition or induced collapse and retraction of established branches, we exposed late-stage embryos (48 hpf) to a 24 h DETA-NO treatment. We hypothesized that if DETA-NO was simply slowing branch addition, the number of branches formed after this period would be greater than 48 hpf but less than 72 hpf wild types. Alternately, if NO was causing retraction of stabilized branches, motor axons would resemble much younger embryos (as axons would be stripped of branches that were established before onset of treatment). Seventy-two hour postfertilization larvae transiently exposed to DETA-NO had 41% fewer motor axon branches than untreated fish of the same age (Fig. 7J–L) (control: 69.2 ± 2.9 bpf vs DETA-NO: 40.7 ± 3.4 bpf, p = 1 × 10⁻⁴) but 74% more branches than 48 hpf controls (Fig. 7, compare H, L). This suggests that NO slows the rate of branch addition without causing stripping of preexisting branches.
Perturbation of NO signaling does not affect motoneuron differentiation
Although motoneurons are born before the onset of spinal NOS1 expression (Myers et al., 1986), we wished to exclude the possibility that NO had a role in motoneuron differentiation. To do this, we quantified motoneuron numbers with islet1/2 antibodies (Inoue et al., 1994). Fish injected with NOS1 AMO or exposed to DETA-NO exhibited a small but significant decrease in motoneuron numbers, while no difference was observed in c-PTIO or l-NAME-injected fish (Fig. 8A–F) (control: 82.1 ± 2.9; AMO: 71.8 ± 2.3, p = 0.01; C-PTIO: 87.2 ± 3.2, p = 0.26; l-NAME: 79.0 ± 2.2; DETA-NO: 72.5 ± 2.9, p = 0.05). These observations lead us to conclude that excess motor axon branches formed in NO-depleted conditions do not arise from supernumerary motoneurons.
Figure 8.

Perturbation of NO signaling does not increase motoneuron numbers. A–E, Lateral views of 35 hpf zebrafish immunostained with islet1/2 antibodies in control- (A), NOS1 AMO- (B), c-PTIO- (C), l-NAME- (D), and DETA-NO- (E) treated embryos. F, Bar chart depicting average number of motoneuron nuclei in 150 μm2 (box in A). Brackets indicate location of Rohon–Beard (RB) and motoneuron (Mn) nuclei. Scale bar (in A), 50 μm. *p ≤ 0.05.
NO acts via the sGC/cGMP signaling cascade
To determine whether the sGC/cGMP pathway, a canonical target of NO signaling, mimics the effects of NO perturbation, developing zebrafish were exposed to the cGMP analog 8-(4-chlorophenylthio)- cGMP. This drug caused a 56% decrease in motor axon branching at 48 hpf (Fig. 9, compare B, A; Fig. 9F) (control: 23.2 ± 1.2 bpf vs cGMP: 10.2 ± 0.7 bpf, p = 1 × 10⁻⁴), an effect strikingly similar to that caused by DETA-NO treatment (Fig. 7E). In contrast, exposure to the sGC inhibitor ODQ increased motor axon branch numbers by 46% (Fig. 9, compare C, A; Fig. 9F) (control: 23.2 ± 1.2 bpf vs ODQ: 33.9 ± 1 bpf, p = 1 × 10⁻⁴).
Figure 9.

Effects of NO are mediated through the sGC/cGMP pathway. A–E, Top, Lateral views of znp1-labeled control- (A), cGMP- (B), ODQ- (C), DETA-NO- (D), and ODQ plus DETA-NO- (E) treated fish at 48 hpf. Bottom, Stick tracings (derived from panels directly above) of axon tracts ventral to the spinal cord. F, Bar chart depicting average (±SEM) branch number per primary fascicle for each treatment. Scale bar (in A), 50 μm. **p ≤ 0.0005.
To test whether the sGC/cGMP pathway is a downstream target of NO, we exposed ODQ-injected embryos to DETA-NO. We found that ODQ completely inhibited the ability of DETA-NO to perturb motor axon branching (Fig. 9, compare E, D; Fig. 9F) (DETA-NO: 9.7 ± 0.9 bpf vs ODQ+DETA-NO: 23.3 ± 1.6 bpf, p = 1 × 10⁻⁴). These results show that the sGC/cGMP signaling pathway is likely to mediate the actions of NO during spinal cord development.
Effects of NOS inhibition on axons of early-developing interneurons
During the initial periods of motoneuron development, interneurons are also extending axons and forming synaptic connections. To determine whether NO regulates development of the earliest-developing interneuron population (i.e., the primary and CoSA interneurons) (Fig. 10A) (for review, see Lewis and Eisen, 2003), we stochastically labeled interneurons with GFP and examined their morphology at 48 hpf. We found that axonal trajectories and branching patterns of these cells were not perturbed by l-NAME treatment (Fig. 10B–H). Additionally, l-NAME did not disrupt morphology of NOS1-immunoreactive cells (Fig. 10I). These findings suggest that NO signaling does not regulate architecture of early-developing and nitrergic interneurons.
Figure 10.
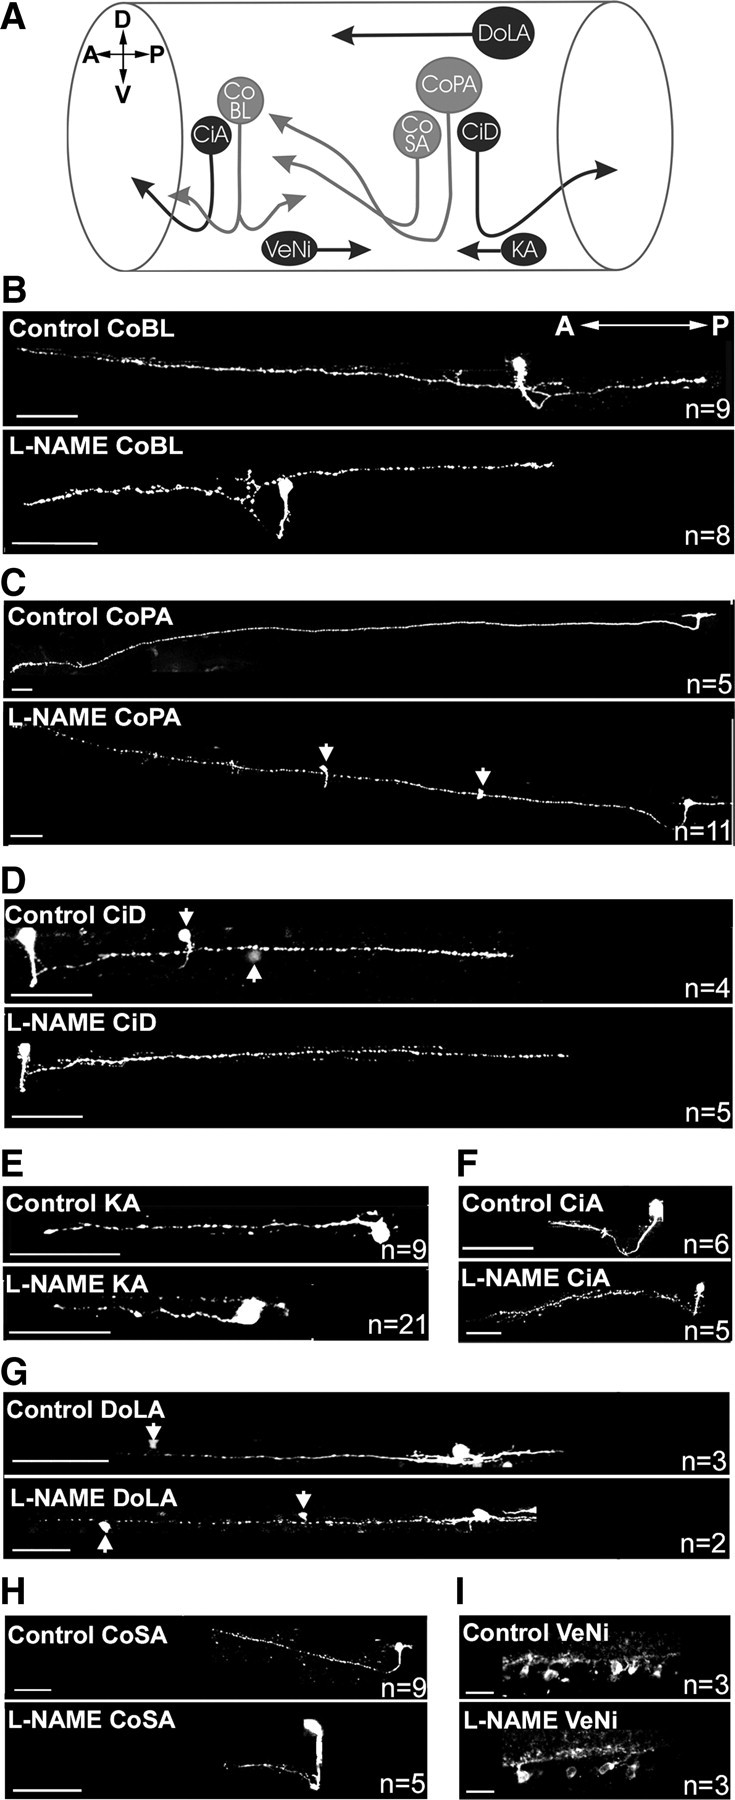
NO does not regulate branching of early born interneurons. A, Schematic of ipsilaterally (dark gray) and contralaterally projecting (light gray) early-developing interneurons of the zebrafish spinal cord. CoBL, Commissural bifurcating longitudinal; CoPA, commissural primary ascending; CiD, circumferential descending; KA, Kolmer–Agduhr; CiA, circumferential ascending; DoLA, dorsal longitudinal ascending; CoSA, commissural secondary ascending. D, Dorsal; V, ventral; A, anterior; P, posterior. B–I, Optical images of GFP- (B–H) and NOS1- (I) immunolabeled interneurons in control and l-NAME-injected fish at 48 hpf. Arrows indicate somata of additional GFP-labeled neurons that lie close to imaged axon. Scale bars: B–H, 50 μm; I, 10 μm.
Abrogation of somitic blood vessels does not alter motor axon branching
As oxyhemoglobin is a major sink for biosynthesized NO (Beckman and Koppenol, 1996), we hypothesized that inhibition of angiogenesis could elevate NO levels during development and reduce motor axon branching. To determine whether this was the case, we prevented formation of trunk intersegmental blood vessels (Isogai et al., 2001) by incubating embryos in ZM323881, a vascular endothelial growth factor receptor 2 inhibitor (Whittles et al., 2002). At 48 hpf, fluorescent angiograms confirmed that intersegmental vessels were absent in ZM323881-treated fish (Fig. 11A,B). Despite this, embryos appeared to develop normally [the vasculature is not required for oxygen transport during early ontogeny (Pelster and Burggren, 1996)]. Subsequent processing for znp1 immunohistochemistry revealed that blood vessel ablation had no effect on motor axon branch numbers (Fig. 11C,D) [control (n = 12): 29 ± 1.5 bpf vs ZM323881 (n = 12): 27 ± 1.3, p = 0.3]. These findings suggest that red blood cells do not consume significant amounts of NO during periods of motor axon development.
Figure 11.

Ablation of somitic blood vessels does not affect motor axon branching. A, B, Lateral trunk angiograms of control- (A) and ZM323881- (B) treated fish at 48 hpf. Closed arrowheads indicate intersegmental vessels, open arrowheads indicate dorsal aorta. Note that intersegmental vessels are ablated by ZM323881. C, D, Top, Lateral views of znp1 staining of control and ZM323881-treated fish. Bottom, Stick tracings of motor fascicles derived from panels above. Scale bars: A, B (in A), C, D (in C), 50 μm.
Developmental disruption of nitrergic signaling affects locomotor output
As spinal motoneurons drive locomotion (swimming) in larval zebrafish, we next asked whether NO signaling affects ontogeny of swimming performance. We focused on 72 hpf zebrafish as by this stage, zebrafish are capable of proficient locomotor behavior (Buss and Drapeau, 2001). To do this, the mean velocity, tail beat frequency, and maximal bend amplitude were measured during initial cycles of touch-evoked swimming activity (Fig. 12A). Swimming velocity of NOS1 knockdown larvae at 72 hpf was significantly higher than controls (Fig. 12B) (control: 75.3 ± 5.2 mm/s vs NOS1 AMO: 90.1 ± 4.6 mm/s, p = 0.03). In contrast, larvae exposed to DETA-NO throughout early development swam at significantly lower velocities than control fish of the same age (Fig. 12B) (control: 75.3 ± 5.2 mm/s vs DETA-NO: 29.7 ± 2.1 mm/s, p = 1 × 10⁻⁴). Similarly, when compared to age-matched controls, tail beat frequency was significantly higher in NOS1 AMO-injected larvae (Fig. 12C) (control: 32.2 ± 1.5 Hz vs NOS1 AMO: 37.7 ± 1.1 Hz, p = 0.04) and significantly lower in DETA-NO-exposed larvae (Fig. 12C) (control: 32.2 ± 1.5 Hz vs DETA-NO: 22.3 ± 1.1 Hz, p = 1 × 10⁻⁴). Finally, NOS1 AMO-injected fish were capable of generating larger maximal bend amplitudes than controls (Fig. 12D) (control: 98.3 ± 3.2° vs NOS1 AMO: 108 ± 2°, p = 0.01), while DETA-NO-treated fish had lower average maximal bend amplitudes (Fig. 12D) (control: 98.3 ± 3.2° vs DETA-NO: 59.9 ± 3.3°, p = 1 × 10⁻⁴). Together, these findings suggest that modulation of NO levels during periods of motoneuron maturation influences several parameters of locomotor output.
Figure 12.

Developmental disruption of NO signaling affects locomotor behavior. A, Thresholded images of swimming behavior collected at 200 frames · s−1 for control-, NOS1 AMO-, and DETA-NO-treated 3-d-old larvae. B–D, Bar charts depicting average (±SEM) velocity (B), tail beat frequency (C), and maximal bend amplitude (D) of 72 hpf larvae for each experimental condition. **p ≤ 0.0005, *p ≤ 0.05.
Discussion
In the current study, we demonstrate a novel role for NOS1 during vertebrate CNS development. We show that antisense and pharmacological perturbation of NOS1 causes supernumerary motor axon branch formation. Moreover, as pharmacological inhibition of NO/sGC signaling mimics this effect, while elevation of NO/cGMP inhibits branch development, we conclude that NOS1 negatively regulates zebrafish motor axon branching in a NO/sGC/cGMP-dependent manner. This is, to the best of our knowledge, the first time nitrergic signaling has been shown to influence morphogenesis of vertebrate motor axons.
NOS1 as a regulator of axon development in vivo
Several vertebrate studies show that pharmacological perturbation of NO disrupts retinal axon development in vivo: Blockade of NOS prevents elimination of transient retinotectal projections in chick (Ernst et al., 1999), disrupts formation of ON/OFF sublamination in the ferret lateral geniculate nucleus (Cramer et al., 1996), and alters dynamic axon branch remodeling in the Xenopus tectum (Cogen and Cohen-Cory, 2000). Moreover, there is direct molecular evidence that NOS isozymes are required for retinal axon remodeling (Mize et al., 1998; Wu et al., 2000a,b). However, the role of NOS isoforms in other CNS regions has remained ambiguous. Our work provides important evidence that NOS1 also regulates maturation of zebrafish spinal motor axons. Thus, this signaling molecule has a broader role in sculpting nervous system development than previously recognized. It remains to be determined whether other neuron populations are similarly affected by nitrergic signals. However, as a large number of developing brain regions express NOS1 (Poon et al., 2003; Holmqvist et al., 2004), it is possible that NO has parallel functions in a number of other CNS structures.
Ventral spinal neurons as a source of NO emission
Our studies strongly suggest that a single population of spinal cord cells emit NO during periods of motor axon development. These are situated immediately ventral to developing motoneuron populations and express NOS1 throughout periods of motoneuron morphogenesis. While previous studies have demonstrated that cells in this region express NOS1 transcript (Poon et al., 2003; Holmqvist et al., 2004), their identity has remained elusive. Here we provide evidence that they are interneurons with a broadly similar spatial distribution and morphology to VeSe/VeMe cells (Higashijima et al., 2004; McLean and Fetcho, 2004). However, as nitrergic neurons do not express markers for either cell type, we posit that they comprise a novel class of interneuron. We also provide the first report of a transient NOS1-positive population in the dorsolateral spinal cord, a position occupied by dorsal longitudinal ascending interneurons (Bernhardt et al., 1990). While these cells may also act as a source of spinal NO emission, several observations imply that they do not influence motoneuron development: First, compared to ventral populations, they are spatially distant from developing motor pools. Second, they are sparsely distributed throughout the spinal cord. Third, they express NOS1 only during the first few hours of motor axon elaboration. Together these data suggest that ventral interneurons are the principal source of NO in the developing spinal cord.
One way in which NO emitted from ventral nitrergic interneurons could exert its effects is through local diffusion at en passant synapses between motoneuron and nitrergic interneuron axons. Such signals could be transmitted to neurites by waves of intracellular calcium (Yamada et al., 2008), or translocation of signal transduction components of the cGMP cascade (Shelly et al., 2010). Alternately, NO may diffuse into the periphery, interacting directly with developing neurites in the muscle. This would hinge on the ability of NO to diffuse considerable distances; at the ages studied, the motoneuron axons extend ∼100 μm (at 48 hpf) to 150 μm (at 72 hpf) ventrally from the spinal cord. However, as NO can diffuse 100–200 μm from its point of synthesis (Lancaster, 1994; Wood and Garthwaite, 1994; Tornieri and Rehder, 2007), the majority of axon branch points could be well within NO's range.
Endogenous NO and motor axon branching
In zebrafish, we consistently found that NO has an inhibitory role during motor axon branching. Similar repressive effects of NO have been reported to occur in Helisoma buccal ganglia (Van Wagenen et al., 1999; Trimm and Rehder, 2004), vertebrate sensory (Hess et al., 1993; Ernst et al., 2000; He et al., 2002), vertebrate retinal (Rentería and Constantine-Paton, 1996; Mize et al., 1998; Ernst et al., 2000; Wu et al., 2000a,b), and insect retinal (Gibbs and Truman, 1998) axons, but not in cultured PC12 cells (Hindley et al., 1997; Wright et al., 1998; Yamazaki et al., 2001, 2006), or insect enteric/antennal pioneer neurons (Hindley et al., 1997; Seidel and Bicker, 2000; Haase and Bicker, 2003), where NO has trophic actions.
The NOS1 AMO phenotype most closely resembles the exuberant retinocollicular axon branch phenotype induced in NOS1/NOS3 double knock-out mice (Mize et al., 1998; Wu et al., 2000a,b). In these animals, refinement of supernumerary synaptic connections is disrupted. Yet, this phenomenon cannot account for the effects we observe, as synaptic pruning does not occur at the developing zebrafish neuromuscular junction (Liu and Westerfield, 1990). Instead, our data point toward a role for NO in repression of branch initiation, rather than a promotion of branch elimination. Thus, while the net effects of NOS perturbation appear similar, the mechanisms that underpin them are likely to diverge.
The sGC/cGMP pathway is a downstream effector of NO
In the zebrafish spinal cord, the sGC/cGMP signaling pathway mediates the effects of NO. This is perhaps not surprising, as sGC is known to be both a canonical target of NO and a regulator of neuron morphogenesis (Piper et al., 2007). Components downstream remain to be established, but these could include ryanodine receptors (Welshhans and Rehder, 2007; Tojima et al., 2009). Additionally, negative regulators of cAMP signaling are potential candidates. Recently it has been shown that axonodendritic development is regulated by the reciprocal actions of cGMP and cAMP (Shelly et al., 2010). A high intracellular cGMP:cAMP ratio promotes dendrite development and suppresses axon outgrowth, while a low cGMP:cAMP ratio has the converse effect. This model may explain our observations: Loss of NO signaling would reduce cGMP turnover, thereby permitting cAMP-dependent initiation of axon branching, while elevation of NO would have the opposite effect. If so, then NO would be expected to affect zebrafish motoneuron dendrite development in a reciprocal fashion. Although we did not examine whether NOS1 knockdown inhibits dendritic development in this study, it is worth noting that disruption of NO signaling in mouse and chick spinal tissue reduces motoneuron dendrite branching (Inglis et al., 1998; Xiong et al., 2007).
Nitrergic regulation of primary motoneurons and consequences to maturation of motor behavior
Our data suggest that NO selectively regulates primary motor axon branching. The most plausible explanation for this discrepancy is that secondary motoneurons/interneurons lack the necessary signal transduction elements (e.g., sGC/protein kinase G), though it remains to be determined whether they become competent to nitrergic signals during later periods. Nonetheless, this observation raises some interesting questions regarding nitrergic regulation of locomotor ontogeny. In zebrafish, each primary motoneuron forms multiterminal contacts with a large number of white muscle (WM) fibers (van Raamsdonk et al., 1983; Myers, 1985; Westerfield et al., 1986; van Asselt et al., 1993; Buss and Drapeau, 2000). As WM is recruited principally during bursts of intense locomotor activity (Liu and Westerfield, 1988; Fetcho and O'Malley, 1995; Buss and Drapeau, 2002), perturbation of primary motoneuron synaptogenesis is likely to impact on the maturation of more powerful motor outputs. In support of this premise, fish exposed to DETA-NO exhibited a markedly reduced swimming velocity, while those injected with NOS1 AMO exhibited a significant, yet less dramatic increase in swim velocity. This effect may, at least in part, be attributable to changes in WM recruitment as maximal bend amplitudes were increased in NOS1 AMO-injected and decreased in DETA-NO-treated fish. We posit that DETA-NO either prevents populations of WM fibers from becoming innervated altogether or reduces the number of multiterminal contacts formed on each WM fiber. In either scenario, the net effect will be that a proportion of WM fibers cannot be effectively recruited. In contrast, NOS1 knockdown would increase the number of primary motoneuron terminals formed on each WM fiber, thereby increasing recruitment efficiency. However, as neuromuscular contacts are already capable of generating optimal muscle contractions, addition of supernumerary synaptic contacts is unlikely to boost motor performance to a dramatic extent.
Our behavioral studies suggest that NO may also affect other aspects of the locomotor network. Changes in tail beat frequency observed in DETA-NO/NOS1 AMO-treated fish most likely arise from an effect on firing of premotor circuitry. Although our anatomical studies show that primary interneuron morphogenesis is unaffected by NO, it remains possible that electrical and/or synaptic properties of spinal interneurons are modulated by this signaling molecule (McLean et al., 2001; McLean and Sillar, 2004; Kyriakatos et al., 2009). Future studies will help determine whether this is the case.
Footnotes
This work was supported by the Biotechnology and Biological Sciences Research Council (United Kingdom). We thank K. Straatman for assistance with confocal microscopy and C. Tilley for help with molecular biology. We thank T. Matheson, H. Tong, and N. Shah for manuscript comments.
References
- Ahern GP, Klyachko VA, Jackson MB. cGMP and S-nitrosylation: two routes for modulation of neuronal excitability by NO. Trends Neurosci. 2002;25:510–517. doi: 10.1016/s0166-2236(02)02254-3. [DOI] [PubMed] [Google Scholar]
- Ball EE, Truman JW. Developing grasshopper neurons show variable levels of guanylyl cyclase activity on arrival at their targets. J Comp Neurol. 1998;394:1–13. doi: 10.1002/(sici)1096-9861(19980427)394:1<1::aid-cne1>3.0.co;2-4. [DOI] [PubMed] [Google Scholar]
- Beckman JS, Koppenol WH. Nitric oxide, superoxide, and peroxynitrite: the good, the bad, and ugly. Am J Physiol. 1996;271:C1424–1437. doi: 10.1152/ajpcell.1996.271.5.C1424. [DOI] [PubMed] [Google Scholar]
- Bernhardt RR, Chitnis AB, Lindamer L, Kuwada JY. Identification of spinal neurons in the embryonic and larval zebrafish. J Comp Neurol. 1990;302:603–616. doi: 10.1002/cne.903020315. [DOI] [PubMed] [Google Scholar]
- Bernhardt RR, Patel CK, Wilson SW, Kuwada JY. Axonal trajectories and distribution of GABAergic spinal neurons in wildtype and mutant zebrafish lacking floor plate cells. J Comp Neurol. 1992;326:263–272. doi: 10.1002/cne.903260208. [DOI] [PubMed] [Google Scholar]
- Bredt DS, Snyder SH. Transient nitric oxide synthase neurons in embryonic cerebral cortical plate, sensory ganglia, and olfactory epithelium. Neuron. 1994;13:301–313. doi: 10.1016/0896-6273(94)90348-4. [DOI] [PubMed] [Google Scholar]
- Brüning G, Hattwig K, Mayer B. Nitric oxide synthase in the peripheral nervous system of the goldfish, Carassius auratus. Cell Tissue Res. 1996;284:87–98. doi: 10.1007/s004410050569. [DOI] [PubMed] [Google Scholar]
- Budick SA, O'Malley DM. Locomotor repertoire of the larval zebrafish: swimming, turning and prey capture. J Exp Biol. 2000;203:2565–2579. doi: 10.1242/jeb.203.17.2565. [DOI] [PubMed] [Google Scholar]
- Buss RR, Drapeau P. Physiological properties of zebrafish embryonic red and white muscle fibers during early development. J Neurophysiol. 2000;84:1545–1557. doi: 10.1152/jn.2000.84.3.1545. [DOI] [PubMed] [Google Scholar]
- Buss RR, Drapeau P. Synaptic drive to motoneurons during fictive swimming in the developing zebrafish. J Neurophysiol. 2001;86:197–210. doi: 10.1152/jn.2001.86.1.197. [DOI] [PubMed] [Google Scholar]
- Buss RR, Drapeau P. Activation of embryonic red and white muscle fibers during fictive swimming in the developing zebrafish. J Neurophysiol. 2002;87:1244–1251. doi: 10.1152/jn.00659.2001. [DOI] [PubMed] [Google Scholar]
- Cogen J, Cohen-Cory S. Nitric oxide modulates retinal ganglion cell axon arbor remodeling in vivo. J Neurobiol. 2000;45:120–133. doi: 10.1002/1097-4695(20001105)45:2<120::aid-neu6>3.0.co;2-6. [DOI] [PubMed] [Google Scholar]
- Cramer KS, Angelucci A, Hahm JO, Bogdanov MB, Sur M. A role for nitric oxide in the development of the ferret retinogeniculate projection. J Neurosci. 1996;16:7995–8004. doi: 10.1523/JNEUROSCI.16-24-07995.1996. [DOI] [PMC free article] [PubMed] [Google Scholar]
- Ernst AF, Wu HH, El-Fakahany EE, McLoon SC. NMDA receptor-mediated refinement of a transient retinotectal projection during development requires nitric oxide. J Neurosci. 1999;19:229–235. doi: 10.1523/JNEUROSCI.19-01-00229.1999. [DOI] [PMC free article] [PubMed] [Google Scholar]
- Ernst AF, Gallo G, Letourneau PC, McLoon SC. Stabilization of growing retinal axons by the combined signaling of nitric oxide and brain-derived neurotrophic factor. J Neurosci. 2000;20:1458–1469. doi: 10.1523/JNEUROSCI.20-04-01458.2000. [DOI] [PMC free article] [PubMed] [Google Scholar]
- Fetcho JR, O'Malley DM. Visualization of active neural circuitry in the spinal cord of intact zebrafish. J Neurophysiol. 1995;73:399–406. doi: 10.1152/jn.1995.73.1.399. [DOI] [PubMed] [Google Scholar]
- Gibbs SM, Truman JW. Nitric oxide and cyclic GMP regulate retinal patterning in the optic lobe of Drosophila. Neuron. 1998;20:83–93. doi: 10.1016/s0896-6273(00)80436-5. [DOI] [PubMed] [Google Scholar]
- Haase A, Bicker G. Nitric oxide and cyclic nucleotides are regulators of neuronal migration in an insect embryo. Development. 2003;130:3977–3987. doi: 10.1242/dev.00612. [DOI] [PubMed] [Google Scholar]
- Hale ME, Ritter DA, Fetcho JR. A confocal study of spinal interneurons in living larval zebrafish. J Comp Neurol. 2001;437:1–16. doi: 10.1002/cne.1266. [DOI] [PubMed] [Google Scholar]
- He Y, Yu W, Baas PW. Microtubule reconfiguration during axonal retraction induced by nitric oxide. J Neurosci. 2002;22:5982–5991. doi: 10.1523/JNEUROSCI.22-14-05982.2002. [DOI] [PMC free article] [PubMed] [Google Scholar]
- Hess DT, Patterson SI, Smith DS, Skene JH. Neuronal growth cone collapse and inhibition of protein fatty acylation by nitric oxide. Nature. 1993;366:562–565. doi: 10.1038/366562a0. [DOI] [PubMed] [Google Scholar]
- Higashijima S, Schaefer M, Fetcho JR. Neurotransmitter properties of spinal interneurons in embryonic and larval zebrafish. J Comp Neurol. 2004;480:19–37. doi: 10.1002/cne.20279. [DOI] [PubMed] [Google Scholar]
- Hindley S, Juurlink BH, Gysbers JW, Middlemiss PJ, Herman MA, Rathbone MP. Nitric oxide donors enhance neurotrophin-induced neurite outgrowth through a cGMP-dependent mechanism. J Neurosci Res. 1997;47:427–439. [PubMed] [Google Scholar]
- Holmqvist B, Ellingsen B, Forsell J, Zhdanova I, Alm P. The early ontogeny of neuronal nitric oxide synthase systems in the zebrafish. J Exp Biol. 2004;207:923–935. doi: 10.1242/jeb.00845. [DOI] [PubMed] [Google Scholar]
- Inglis FM, Furia F, Zuckerman KE, Strittmatter SM, Kalb RG. The role of nitric oxide and NMDA receptors in the development of motor neuron dendrites. J Neurosci. 1998;18:10493–10501. doi: 10.1523/JNEUROSCI.18-24-10493.1998. [DOI] [PMC free article] [PubMed] [Google Scholar]
- Inoue A, Takahashi M, Hatta K, Hotta Y, Okamoto H. Developmental regulation of islet-1 mRNA expression during neuronal differentiation in embryonic zebrafish. Dev Dyn. 1994;199:1–11. doi: 10.1002/aja.1001990102. [DOI] [PubMed] [Google Scholar]
- Isogai S, Horiguchi M, Weinstein BM. The vascular anatomy of the developing zebrafish: an atlas of embryonic and early larval development. Dev Biol. 2001;230:278–301. doi: 10.1006/dbio.2000.9995. [DOI] [PubMed] [Google Scholar]
- Kimmel CB, Ballard WW, Kimmel SR, Ullmann B, Schilling TF. Stages of embryonic development of the zebrafish. Dev Dyn. 1995;203:253–310. doi: 10.1002/aja.1002030302. [DOI] [PubMed] [Google Scholar]
- Kyriakatos A, Molinari M, Mahmood R, Grillner S, Sillar KT, El Manira A. Nitric oxide potentiation of locomotor activity in the spinal cord of the lamprey. J Neurosci. 2009;29:13283–13291. doi: 10.1523/JNEUROSCI.3069-09.2009. [DOI] [PMC free article] [PubMed] [Google Scholar]
- Lancaster JR., Jr Simulation of the diffusion and reaction of endogenously produced nitric oxide. Proc Natl Acad Sci U S A. 1994;91:8137–8141. doi: 10.1073/pnas.91.17.8137. [DOI] [PMC free article] [PubMed] [Google Scholar]
- Lewis KE, Eisen JS. From cells to circuits: development of the zebrafish spinal cord. Prog Neurobiol. 2003;69:419–449. doi: 10.1016/s0301-0082(03)00052-2. [DOI] [PubMed] [Google Scholar]
- Liu DW, Westerfield M. Function of identified motoneurones and co-ordination of primary and secondary motor systems during zebra fish swimming. J Physiol. 1988;403:73–89. doi: 10.1113/jphysiol.1988.sp017239. [DOI] [PMC free article] [PubMed] [Google Scholar]
- Liu DW, Westerfield M. The formation of terminal fields in the absence of competitive interactions among primary motoneurons in the zebrafish. J Neurosci. 1990;10:3947–3959. doi: 10.1523/JNEUROSCI.10-12-03947.1990. [DOI] [PMC free article] [PubMed] [Google Scholar]
- Luo L. Actin cytoskeleton regulation in neuronal morphogenesis and structural plasticity. Annu Rev Cell Dev Biol. 2002;18:601–635. doi: 10.1146/annurev.cellbio.18.031802.150501. [DOI] [PubMed] [Google Scholar]
- Martin SC, Heinrich G, Sandell JH. Sequence and expression of glutamic acid decarboxylase isoforms in the developing zebrafish. J Comp Neurol. 1998;396:253–266. [PubMed] [Google Scholar]
- McDearmid JR, Liao M, Drapeau P. Glycine receptors regulate interneuron differentiation during spinal network development. Proc Natl Acad Sci U S A. 2006;103:9679–9684. doi: 10.1073/pnas.0504871103. [DOI] [PMC free article] [PubMed] [Google Scholar]
- McLean DL, Fetcho JR. Ontogeny and innervation patterns of dopaminergic, noradrenergic, and serotonergic neurons in larval zebrafish. J Comp Neurol. 2004;480:38–56. doi: 10.1002/cne.20280. [DOI] [PubMed] [Google Scholar]
- McLean DL, Fetcho JR. Using imaging and genetics in zebrafish to study developing spinal circuits in vivo. Dev Neurobiol. 2008;68:817–834. doi: 10.1002/dneu.20617. [DOI] [PMC free article] [PubMed] [Google Scholar]
- McLean DL, Sillar KT. Metamodulation of a spinal locomotor network by nitric oxide. J Neurosci. 2004;24:9561–9571. doi: 10.1523/JNEUROSCI.1817-04.2004. [DOI] [PMC free article] [PubMed] [Google Scholar]
- McLean DL, McDearmid JR, Sillar KT. Induction of a non-rhythmic motor pattern by nitric oxide in hatchling Rana temporaria embryos. J Exp Biol. 2001;204:1307–1317. doi: 10.1242/jeb.204.7.1307. [DOI] [PubMed] [Google Scholar]
- Melançon E, Liu DW, Westerfield M, Eisen JS. Pathfinding by identified zebrafish motoneurons in the absence of muscle pioneers. J Neurosci. 1997;17:7796–7804. doi: 10.1523/JNEUROSCI.17-20-07796.1997. [DOI] [PMC free article] [PubMed] [Google Scholar]
- Menelaou E, Husbands EE, Pollet RG, Coutts CA, Ali DW, Svoboda KR. Embryonic motor activity and implications for regulating motoneuron axonal pathfinding in zebrafish. Eur J Neurosci. 2008;28:1080–1096. doi: 10.1111/j.1460-9568.2008.06418.x. [DOI] [PMC free article] [PubMed] [Google Scholar]
- Mize RR, Wu HH, Cork RJ, Scheiner CA. The role of nitric oxide in development of the patch-cluster system and retinocollicular pathways in the rodent superior colliculus. Prog Brain Res. 1998;118:133–152. doi: 10.1016/s0079-6123(08)63205-7. [DOI] [PubMed] [Google Scholar]
- Myers PZ. Spinal motoneurons of the larval zebrafish. J Comp Neurol. 1985;236:555–561. doi: 10.1002/cne.902360411. [DOI] [PubMed] [Google Scholar]
- Myers PZ, Eisen JS, Westerfield M. Development and axonal outgrowth of identified motoneurons in the zebrafish. J Neurosci. 1986;6:2278–2289. doi: 10.1523/JNEUROSCI.06-08-02278.1986. [DOI] [PMC free article] [PubMed] [Google Scholar]
- Nasevicius A, Ekker SC. Effective targeted gene ‘knockdown’ in zebrafish. Nat Genet. 2000;26:216–220. doi: 10.1038/79951. [DOI] [PubMed] [Google Scholar]
- North TE, Goessling W, Peeters M, Li P, Ceol C, Lord AM, Weber GJ, Harris J, Cutting CC, Huang P, Dzierzak E, Zon LI. Hematopoietic stem cell development is dependent on blood flow. Cell. 2009;137:736–748. doi: 10.1016/j.cell.2009.04.023. [DOI] [PMC free article] [PubMed] [Google Scholar]
- Nusslein-Volhard C, Dahm R. Zebrafish: a practical approach. Oxford: Oxford UP; 2002. [Google Scholar]
- Park HC, Kim CH, Bae YK, Yeo SY, Kim SH, Hong SK, Shin J, Yoo KW, Hibi M, Hirano T, Miki N, Chitnis AB, Huh TL. Analysis of upstream elements in the HuC promoter leads to the establishment of transgenic zebrafish with fluorescent neurons. Dev Biol. 2000;227:279–293. doi: 10.1006/dbio.2000.9898. [DOI] [PubMed] [Google Scholar]
- Pelster B, Burggren WW. Disruption of hemoglobin oxygen transport does not impact oxygen-dependent physiological processes in developing embryos of zebra fish (Danio rerio) Circ Res. 1996;79:358–362. doi: 10.1161/01.res.79.2.358. [DOI] [PubMed] [Google Scholar]
- Piper M, van Horck F, Holt C. The role of cyclic nucleotides in axon guidance. Adv Exp Med Biol. 2007;621:134–143. doi: 10.1007/978-0-387-76715-4_10. [DOI] [PMC free article] [PubMed] [Google Scholar]
- Poon KL, Richardson M, Lam CS, Khoo HE, Korzh V. Expression pattern of neuronal nitric oxide synthase in embryonic zebrafish. Gene Expr Patterns. 2003;3:463–466. doi: 10.1016/s1567-133x(03)00063-2. [DOI] [PubMed] [Google Scholar]
- Rentería RC, Constantine-Paton M. Exogenous nitric oxide causes collapse of retinal ganglion cell axonal growth cones in vitro. J Neurobiol. 1996;29:415–428. doi: 10.1002/(SICI)1097-4695(199604)29:4<415::AID-NEU1>3.0.CO;2-B. [DOI] [PubMed] [Google Scholar]
- Ridnour LA, Isenberg JS, Espey MG, Thomas DD, Roberts DD, Wink DA. Nitric oxide regulates angiogenesis through a functional switch involving thrombospondin-1. Proc Natl Acad Sci U S A. 2005;102:13147–13152. doi: 10.1073/pnas.0502979102. [DOI] [PMC free article] [PubMed] [Google Scholar]
- Roskams AJ, Bredt DS, Dawson TM, Ronnett GV. Nitric oxide mediates the formation of synaptic connections in developing and regenerating olfactory receptor neurons. Neuron. 1994;13:289–299. doi: 10.1016/0896-6273(94)90347-6. [DOI] [PubMed] [Google Scholar]
- Sanes JR, Yamagata M. Many paths to synaptic specificity. Annu Rev Cell Dev Biol. 2009;25:161–195. doi: 10.1146/annurev.cellbio.24.110707.175402. [DOI] [PubMed] [Google Scholar]
- Seidel C, Bicker G. Nitric oxide and cGMP influence axonogenesis of antennal pioneer neurons. Development. 2000;127:4541–4549. doi: 10.1242/dev.127.21.4541. [DOI] [PubMed] [Google Scholar]
- Shelly M, Lim BK, Cancedda L, Heilshorn SC, Gao H, Poo MM. Local and long-range reciprocal regulation of cAMP and cGMP in axon/dendrite formation. Science. 2010;327:547–552. doi: 10.1126/science.1179735. [DOI] [PubMed] [Google Scholar]
- Tojima T, Itofusa R, Kamiguchi H. The nitric oxide-cGMP pathway controls the directional polarity of growth cone guidance via modulating cytosolic Ca2+ signals. J Neurosci. 2009;29:7886–7897. doi: 10.1523/JNEUROSCI.0087-09.2009. [DOI] [PMC free article] [PubMed] [Google Scholar]
- Tornieri K, Rehder V. Nitric oxide release from a single cell affects filopodial motility on growth cones of neighboring neurons. Dev Neurobiol. 2007;67:1932–1943. doi: 10.1002/dneu.20572. [DOI] [PubMed] [Google Scholar]
- Trimm KR, Rehder V. Nitric oxide acts as a slow-down and search signal in developing neurites. Eur J Neurosci. 2004;19:809–818. doi: 10.1111/j.0953-816x.2004.03182.x. [DOI] [PubMed] [Google Scholar]
- Truman JW, De Vente J, Ball EE. Nitric oxide-sensitive guanylate cyclase activity is associated with the maturational phase of neuronal development in insects. Development. 1996;122:3949–3958. doi: 10.1242/dev.122.12.3949. [DOI] [PubMed] [Google Scholar]
- van Asselt E, de Graaf F, van Raamsdonk W. Ultrastructural characteristics of zebrafish spinal motoneurons innervating glycolytic white, and oxidative red and intermediate muscle fibers. Acta Histochem. 1993;95:31–44. doi: 10.1016/S0065-1281(11)80385-5. [DOI] [PubMed] [Google Scholar]
- van Raamsdonk W, Mos W, Smit-Onel MJ, van der Laarse WJ, Fehres R. The development of the spinal motor column in relation to the myotomal muscle fibers in the zebrafish (Brachydanio rerio). I. Posthatching development. Anat Embryol. 1983;167:125–139. doi: 10.1007/BF00304606. [DOI] [PubMed] [Google Scholar]
- Van Wagenen S, Rehder V. Regulation of neuronal growth cone filopodia by nitric oxide depends on soluble guanylyl cyclase. J Neurobiol. 2001;46:206–219. doi: 10.1002/1097-4695(20010215)46:3<206::aid-neu1003>3.3.co;2-j. [DOI] [PubMed] [Google Scholar]
- Van Wagenen S, Cheng S, Rehder V. Stimulation-induced changes in filopodial dynamics determine the action radius of growth cones in the snail Helisoma trivolvis. Cell Motil Cytoskeleton. 1999;44:248–262. doi: 10.1002/(SICI)1097-0169(199912)44:4<248::AID-CM3>3.0.CO;2-Z. [DOI] [PubMed] [Google Scholar]
- Welshhans K, Rehder V. Local activation of the nitric oxide/cyclic guanosine monophosphate pathway in growth cones regulates filopodial length via protein kinase G, cyclic ADP ribose and intracellular Ca2+ release. Eur J Neurosci. 2005;22:3006–3016. doi: 10.1111/j.1460-9568.2005.04490.x. [DOI] [PubMed] [Google Scholar]
- Welshhans K, Rehder V. Nitric oxide regulates growth cone filopodial dynamics via ryanodine receptor-mediated calcium release. Eur J Neurosci. 2007;26:1537–1547. doi: 10.1111/j.1460-9568.2007.05768.x. [DOI] [PubMed] [Google Scholar]
- Westerfield M. The zebrafish book: a guide to the laboratory use of the zebrafish (Brachydanio rerio) Ed 2.1. Eugene, OR: University of Oregon Press; 1994. [Google Scholar]
- Westerfield M, McMurray JV, Eisen JS. Identified motoneurons and their innervation of axial muscles in the zebrafish. J Neurosci. 1986;6:2267–2277. doi: 10.1523/JNEUROSCI.06-08-02267.1986. [DOI] [PMC free article] [PubMed] [Google Scholar]
- Whittles CE, Pocock TM, Wedge SR, Kendrew J, Hennequin LF, Harper SJ, Bates DO. ZM323881, a novel inhibitor of vascular endothelial growth factor-receptor-2 tyrosine kinase activity. Microcirculation. 2002;9:513–522. doi: 10.1038/sj.mn.7800164. [DOI] [PubMed] [Google Scholar]
- Wood J, Garthwaite J. Models of the diffusional spread of nitric oxide: implications for neural nitric oxide signalling and its pharmacological properties. Neuropharmacology. 1994;33:1235–1244. doi: 10.1016/0028-3908(94)90022-1. [DOI] [PubMed] [Google Scholar]
- Wright JW, Schwinof KM, Snyder MA, Copenhaver PF. A delayed role for nitric oxide-sensitive guanylate cyclases in a migratory population of embryonic neurons. Dev Biol. 1998;204:15–33. doi: 10.1006/dbio.1998.9066. [DOI] [PubMed] [Google Scholar]
- Wu HH, Cork RJ, Mize RR. Normal development of the ipsilateral retinocollicular pathway and its disruption in double endothelial and neuronal nitric oxide synthase gene knockout mice. J Comp Neurol. 2000a;426:651–665. doi: 10.1002/1096-9861(20001030)426:4<651::aid-cne11>3.0.co;2-x. [DOI] [PubMed] [Google Scholar]
- Wu HH, Cork RJ, Huang PL, Shuman DL, Mize RR. Refinement of the ipsilateral retinocollicular projection is disrupted in double endothelial and neuronal nitric oxide synthase gene knockout mice. Brain Res Dev Brain Res. 2000b;120:105–111. doi: 10.1016/s0165-3806(99)00145-5. [DOI] [PubMed] [Google Scholar]
- Xiong G, Mojsilovic-Petrovic J, Pérez CA, Kalb RG. Embryonic motor neuron dendrite growth is stunted by inhibition of nitric oxide-dependent activation of soluble guanylyl cyclase and protein kinase G. Eur J Neurosci. 2007;25:1987–1997. doi: 10.1111/j.1460-9568.2007.05456.x. [DOI] [PubMed] [Google Scholar]
- Yamada RX, Sasaki T, Ichikawa J, Koyama R, Matsuki N, Ikegaya Y. Long-range axonal calcium sweep induces axon retraction. J Neurosci. 2008;28:4613–4618. doi: 10.1523/JNEUROSCI.0019-08.2008. [DOI] [PMC free article] [PubMed] [Google Scholar]
- Yamazaki M, Chiba K, Mohri T, Hatanaka H. Activation of the mitogen-activated protein kinase cascade through nitric oxide synthesis as a mechanism of neuritogenic effect of genipin in PC12h cells. J Neurochem. 2001;79:45–54. doi: 10.1046/j.1471-4159.2001.00533.x. [DOI] [PubMed] [Google Scholar]
- Yamazaki M, Chiba K, Mohri T. Differences in neuritogenic response to nitric oxide in PC12 and PC12h cells. Neurosci Lett. 2006;393:222–225. doi: 10.1016/j.neulet.2005.09.068. [DOI] [PubMed] [Google Scholar]