. 2019 Jul 2;8:e46883. doi: 10.7554/eLife.46883

Figure 6. Cluster W is associated with mitochondrial N-terminal targeting signals.

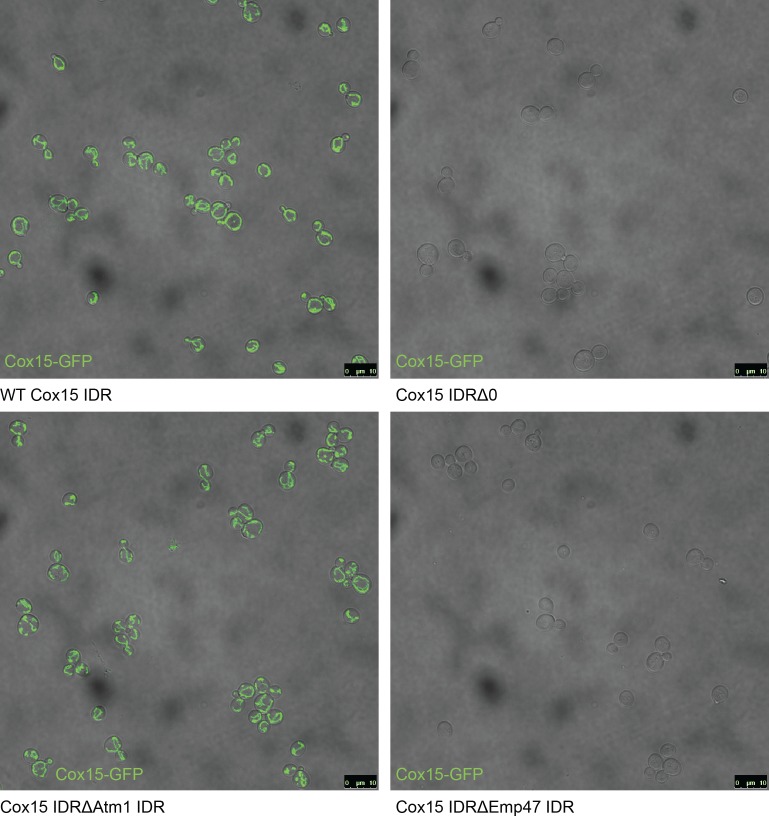
(A) Schematic (not to scale) showing the path of a mitochondrial precursor peptide (with N-terminal targeting sequence in red) from the cytosol, where it is translated, to the mitochondrial matrix, where the peptide folds and targeting sequence is cleaved. (B) Violin plots (median indicated by black dot, thick black line showing 25th-75th percentile, and whiskers showing outliers) show distributions of mitochondrial presequence probability scores for all IDRs in each cluster. The cluster that we predict to contain mitochondrial N-terminal targeting signals is outlined in red, while the cluster that we predict to contain endoplasmic reticulum targeting signals is outlined in purple. (C) Micrographs of S. cerevisiae strains in which Cox15 is tagged with GFP, with either the wildtype Cox15 IDR, deletion of the Cox15 IDR, replacement of the Cox15 IDR with the Atm1 IDR (also in the mitochondrial targeting signal cluster), or replacement of the Cox15 IDR with the Emp47 IDR (from the endoplasmic reticulum targeting signal cluster).

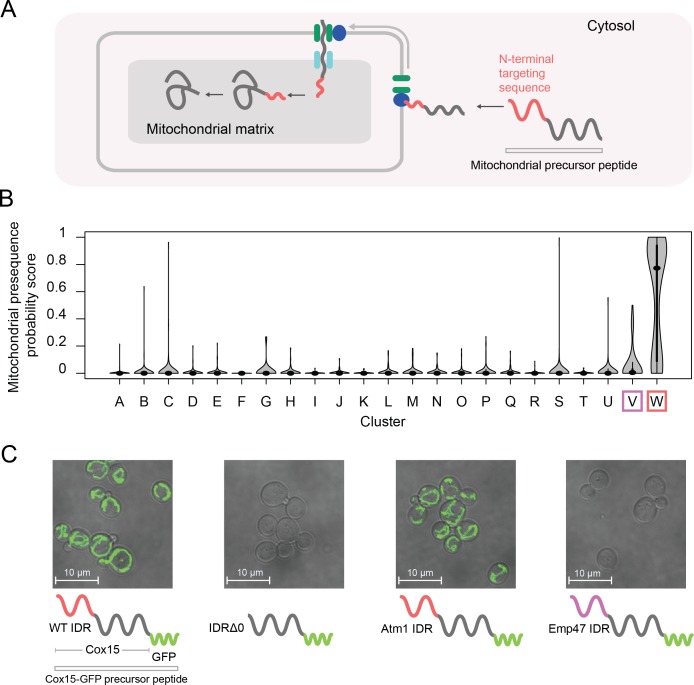
Figure 6.

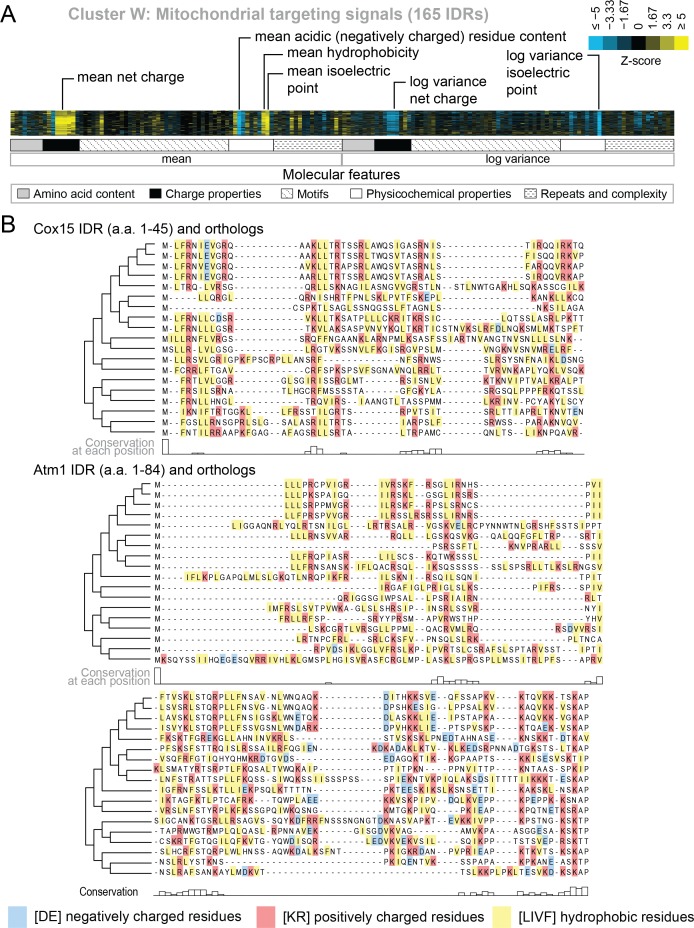
Figure 6—figure supplement 1. Evolutionary signatures in cluster W contain molecular features that have been previously reported for mitochondrial N-terminal targeting signals.

Figure 6—figure supplement 1.

(A) Pattern of evolutionary signatures in cluster W. (B) Multiple sequence alignments of example disordered regions from Cox15 (top) and Atm1 (bottom) from cluster W, showing a subset of highlighted molecular features. Species included in phylogeny in order from top to bottom are S. cerevisiae, S. mikatae, S. kudriavzevii, S. uvarum, C. glabrata, K. africana, K. naganishii, N. castellii, N. dairenensis, T. phaffii, V. polyspora, Z. rouxii, T. delbrueckii, K. lactis, E. gossypii, E. cymbalariae, L. kluyveri, L. thermotolerans, L. waltii.
Figure 6—figure supplement 2. Full field-of-view micrographs of S. cerevisiae strains from Figure 6C.

Figure 6—figure supplement 2.

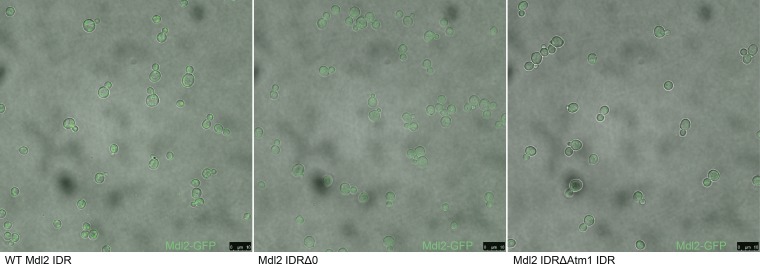
Figure 6—figure supplement 3. Micrographs of S. cerevisiae strains with three different genotypes.

Figure 6—figure supplement 3.

From left to right: Mdl2-GFP has a mitochondrial localization in the wildtype (WT) strain, knocking out the Mdl2 IDR abolishes wildtype localization, and replacing the Mdl2 IDR with that of Atm1 rescues mitochondrial localization.
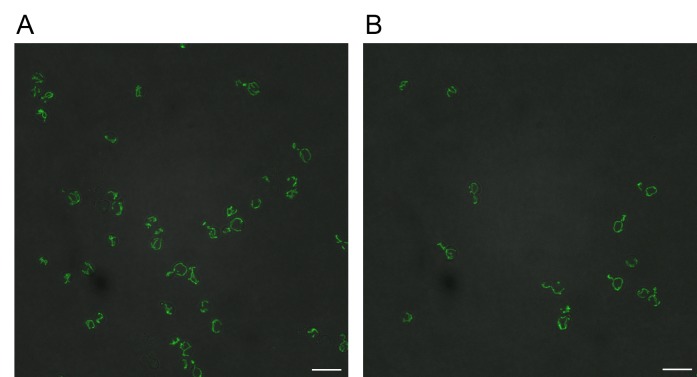
Figure 6—figure supplement 4. Reverse transformation of GFP-tagged Cox15 IDR∆0 and Cox15∆Emp47 strains to wildtype Cox15 IDR rescues mitochondrial localization of Cox15-GFP.

Figure 6—figure supplement 4.

Scale bars represent 10 micrometers. (A) GFP-tagged Cox15 IDR∆Emp47 reverted to wildtype Cox15-GFP. (B) GFP-tagged Cox15 IDR∆0 reverted to wildtype Cox15-GFP.