. 2019 Jul 16;8:e44907. doi: 10.7554/eLife.44907

Figure 2. Histograms of swimming speed for ciliates and flagellates demonstrate a similar character but different scales of velocities.

Data points represent the mean and standard deviation of the data in each bin; horizontal error bars represent variability within each bin, vertical error bars show the standard deviation of the count. Inset: number of flagella displayed, where available, for each organism exhibits a clear morphological division between ciliates and flagellates.

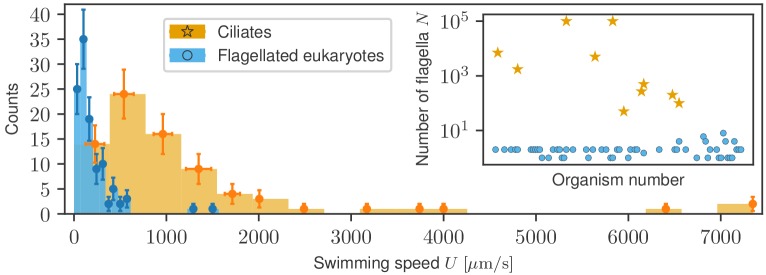
Figure 2.

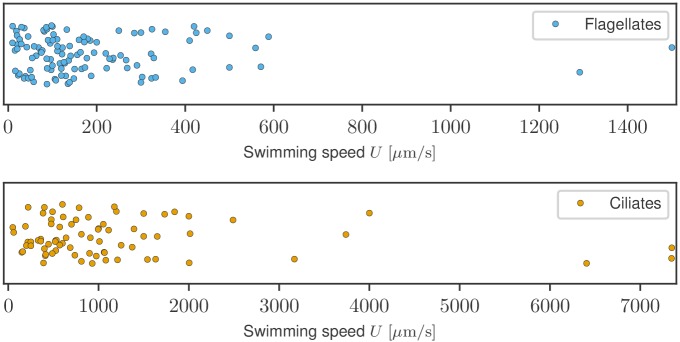
Figure 2—figure supplement 1. Linear distribution of swimming speed data.

Figure 2—figure supplement 1.

Symbols have been randomly placed vertically to avoid overlap.

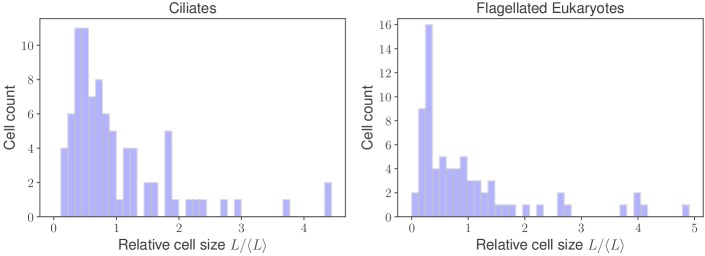
Figure 2—figure supplement 2. Distribution of organism sizes in analyzed groups.

Figure 2—figure supplement 2.

Each histogram has been rescaled by the average cell size for each group. Although both distributions exhibit a qualitatively similar shape biased toward the low limit, no quantitative similarity is found.

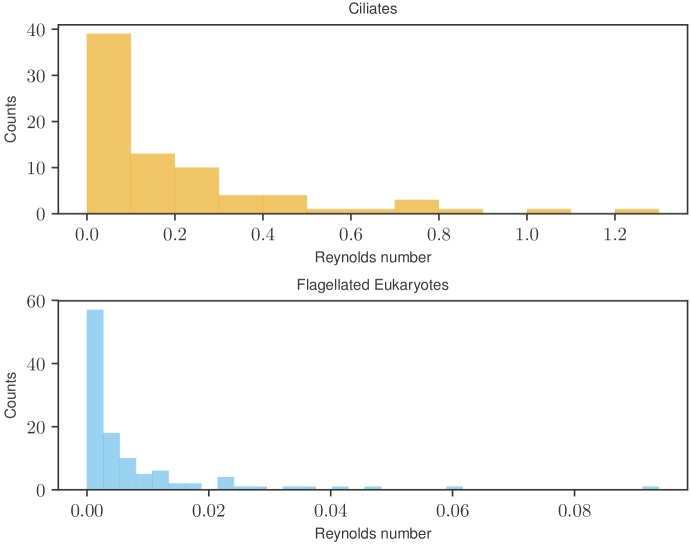
Figure 2—figure supplement 3. Distribution of Reynolds numbers for organisms in analyzed groups.

Figure 2—figure supplement 3.

Source data for the characteristic size L and swimming speeds U are listed in Appendix 1.